
To test for the stopping distances of four brake systems, 10 of the same make and model
of car are selected randomly and then are assigned randomly to each of four brake
systems. This is a randomized complete block design.
In conducting the Wilcoxon signed rank test, after collecting the sample data the next
step is to find the sample median and subtract this value from each data value to obtain
the deviations.
The actual mean fill volume for all bottles of a soft drink product that were filled on a
Tuesday is 11.998 ounces. A sample of 64 bottles was randomly selected and the sample
mean fill volume was 12.004 ounces. Based upon this information, the sampling error is
.006 ounce.
When the median of a data set is 110 and the mean is 127, the percentile associated with
the mean must be higher than 50 percent.

The Wilson company monitors customer complaints and organizes these complaints
into six distinct categories. Over the past year, the company has received 534
complaints. One possible graphical method for representing these data would be a
histogram.
When a survey is done you can always assume that non-respondents would have
answered the same way as those who did respond.
Statistics is a discipline that involves tools and techniques used to describe data and
draw conclusions.

Variation exists naturally in the world around us so all processes and products can be
expected to vary.
A product that is produced at Ramsey Manufacturing goes through three steps to be
built. At step one, the components are assembled by technicians. At step two, the
product is sanded, and at step three the product is painted. The product can become
defective if any of these three steps is performed incorrectly. The three steps are done
by different people in different locations. We let D1 = defect introduced at step 1, D2 =
defect introduced at step 2, and D3 = defect introduced at step three. Based on this
situation these three events would be considered to be mutually exclusive.
The manager in charge of concessions at an NFL football stadium is interested in
estimating the mean dollars that are spent per person attending the games. A pilot
sample of n = 50 people has revealed a sample mean and standard deviation of $12.35
and $2.35 respectively. He wishes to estimate the population mean within $0.20 of the
true mean and wishes to have a confidence level of 95 percent. Given this, he needs to
sample an additional 481 people.
One of the nation’s biggest regional airlines has tracked 4,000 landings and take-offs
during the past month. Treating these data as the population of interest, the company
found that the average time the planes spent on the ground (called the turn time) was
17.23 minutes with a standard deviation of 3.79 minutes. Further, they determined that
the distribution of turn times is normally distributed. Then, the probability that a single
turn time selected at random from this population would exceed 20 minutes is
approximately 0.2327.
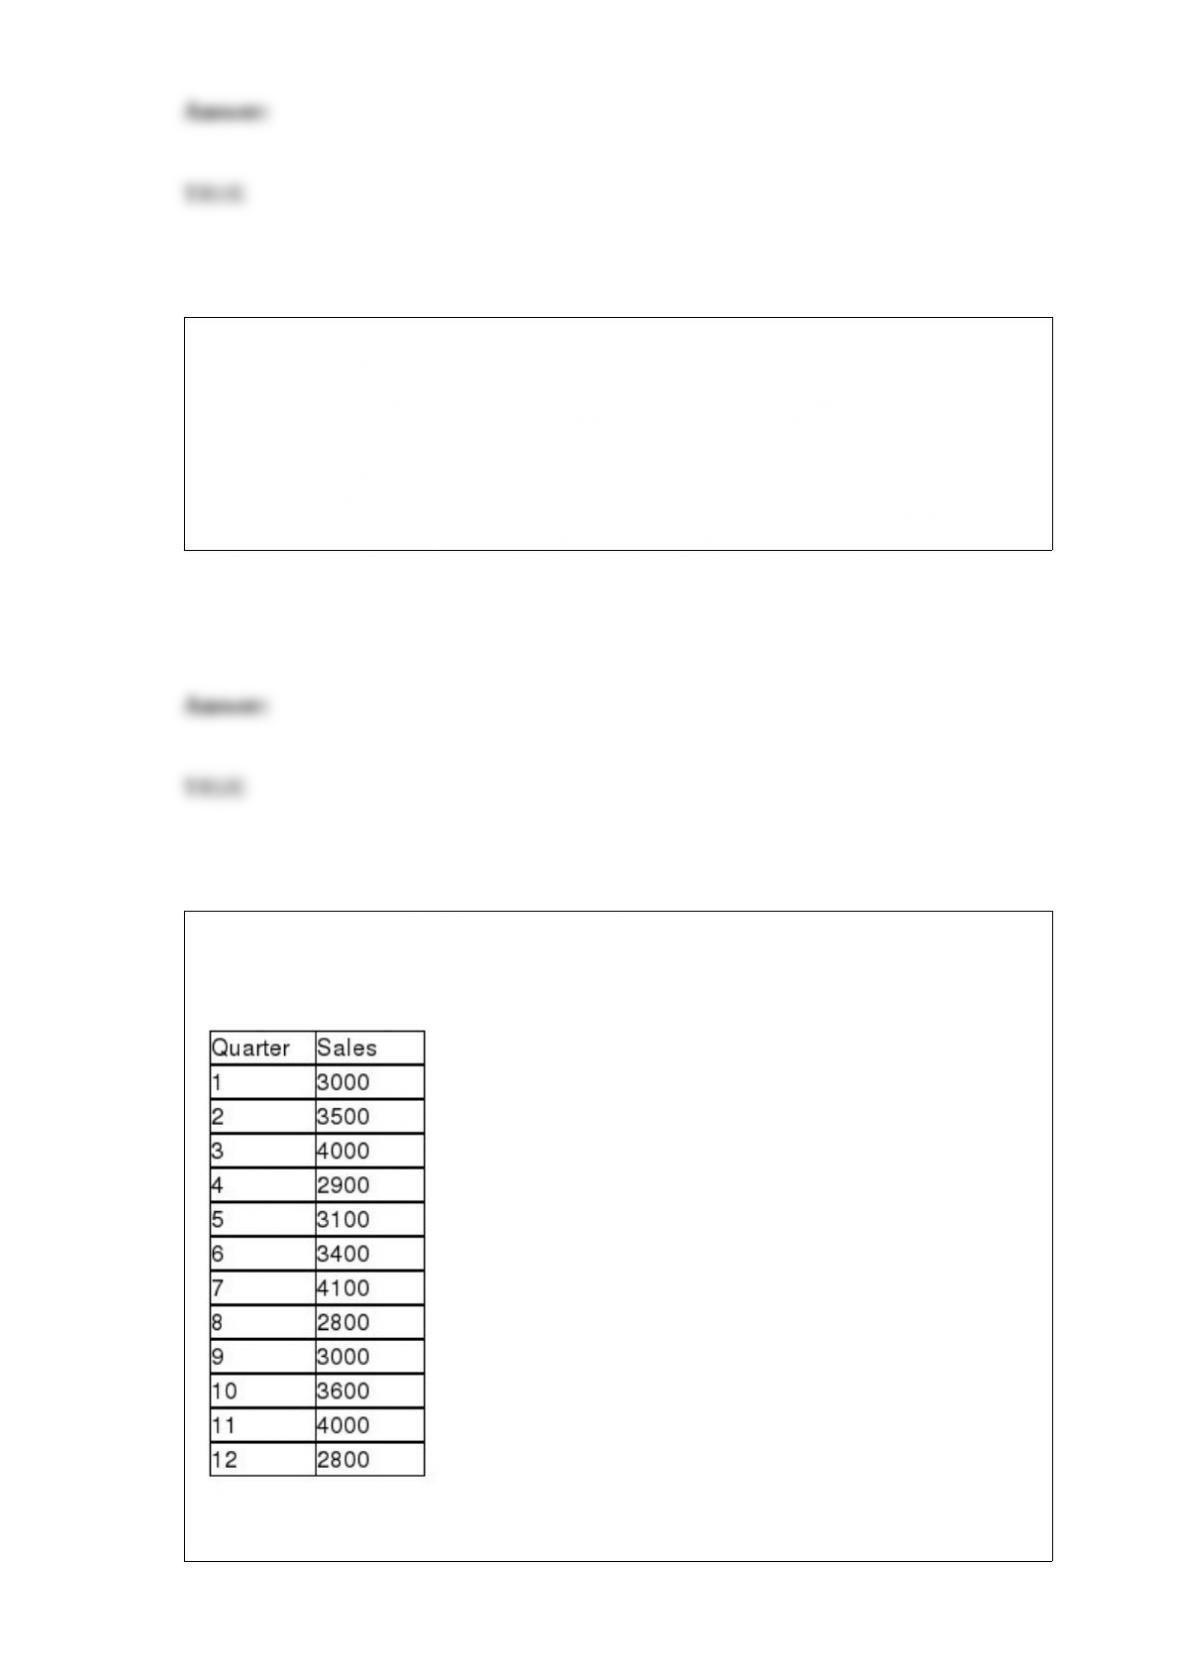
The Baker’s Candy Company has been in business for three years. The quarterly sales
data for the company are shown as follows:
Based on these data, the seasonal index for quarters 3, 7, and 11 is approximately 1.61

The six most common sources of variation are people, machines, materials, methods,
measurement, and environment.
The normal distribution is one of the most frequently used discrete probability
distributions.
Suppose a coin is flipped twice. The event of getting heads on the first toss and the
event of getting heads on the second toss could be said to be mutually exclusive.
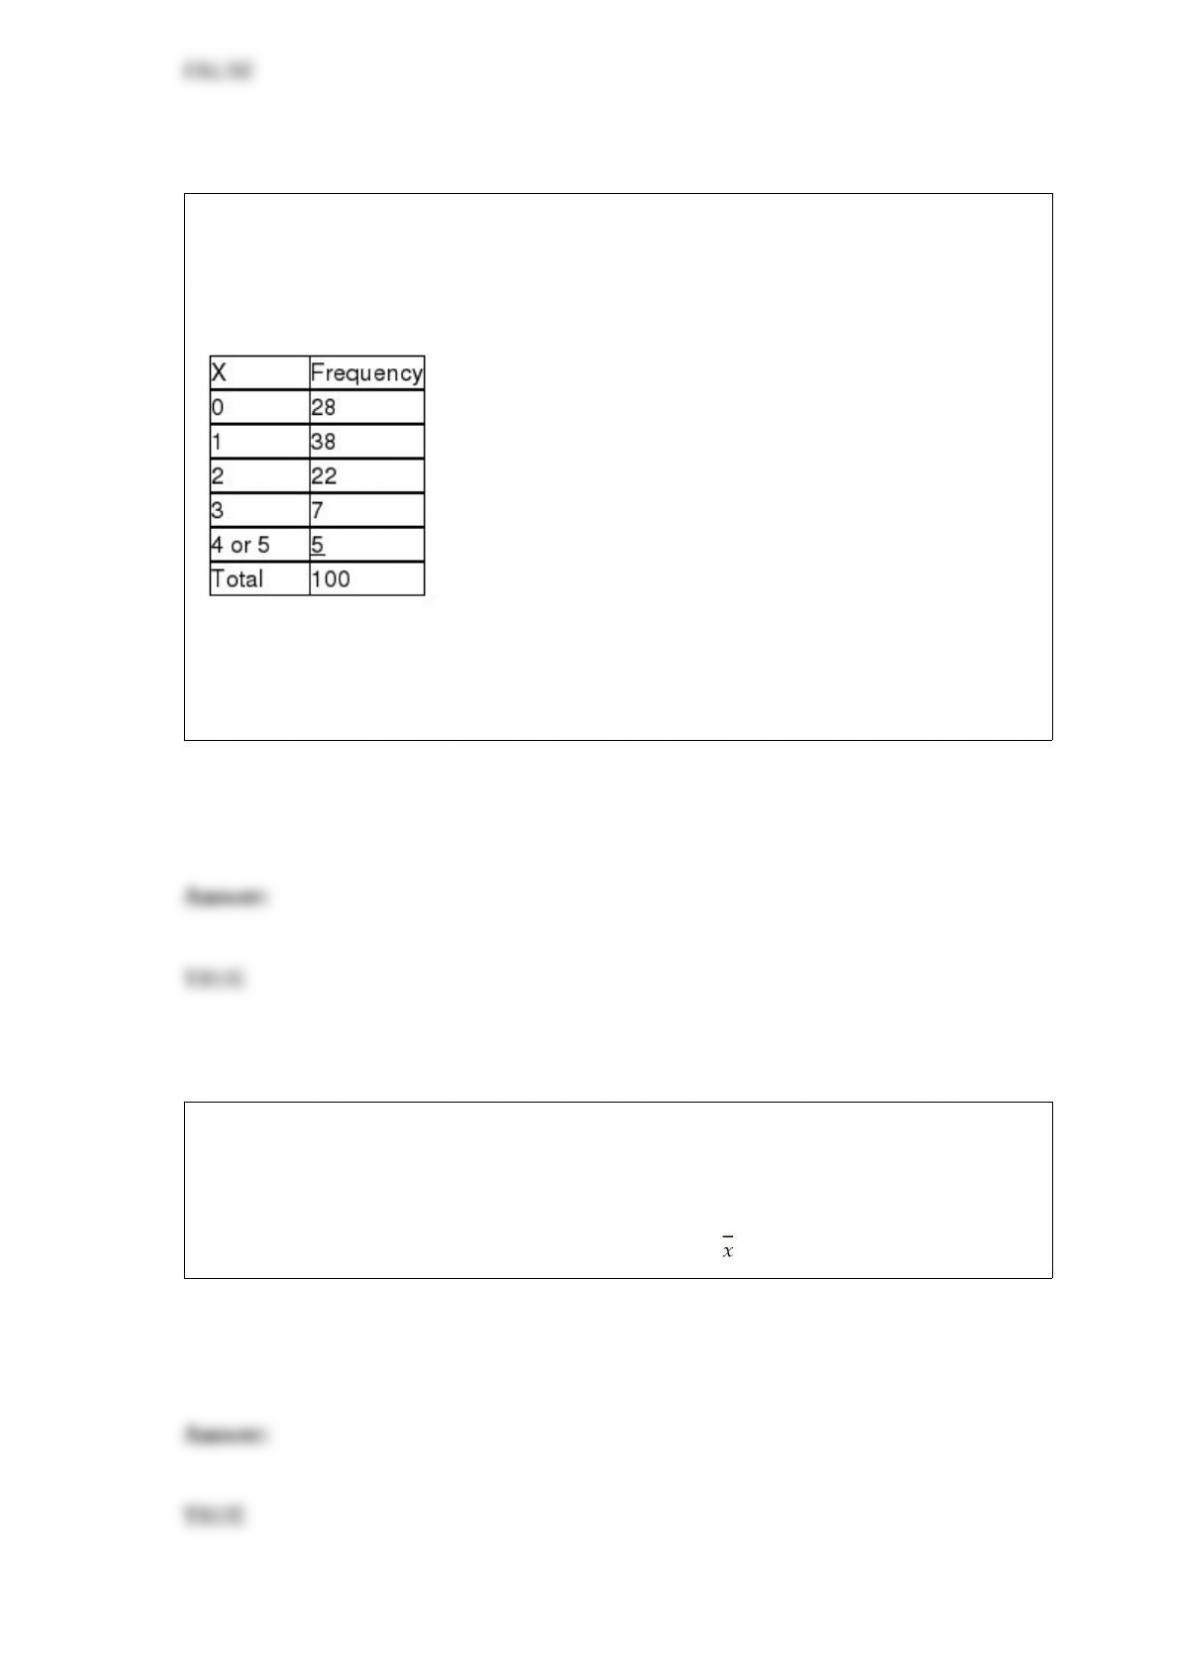
A business with 5 copy machines keeps track of how many copy machines need service
on a given day. It believes this is binomially distributed with a probability of p = 0.2 of
each machine needing service on any given day. It has collected the following based on
a random sample of 100 days.
Given this information, assuming that all expected values are sufficiently large to use
the classes as shown above, the critical value based on a 0.05 level of significance is
9.4877.
The state insurance commissioner believes that the mean automobile insurance claim
filed in her state exceeds $1,700. To test this claim, the agency has selected a random
sample of 20 claims and found a sample mean equal to $1,733 and a sample standard
deviation equal to $400. They plan to conduct the test using a 0.05 significance level.
Based on this, the null hypothesis should be rejected if > $1,854.66 approximately.

Once you have determined the class width using the formula, high-low divided by the
number of classes, it is appropriate to round to the nearest integer to make the analysis
easier.
The Conrad Real Estate Company recently conducted a statistical test to determine
whether the number of days that homes are on the market prior to selling is normally
distributed with a mean equal to 50 days and a standard deviation equal to 10 days. The
sample of 200 homes was divided into 8 groups to form a grouped data frequency
distribution. The degrees of freedom for the test will be 7.
The standard error of the estimate for a simple linear regression model measures the
variation in the slope coefficient from sample to sample.
The reason for using split samples in developing a forecasting model is to eliminate the
potential for bias in the resulting model.

Common cause variation is variation in the output of a process that is unexpected and
has an assignable cause.
A lube and oil change business believes that the number of cars that arrive for service is
the same each day of the week. If the business is open six days a week (Monday –
Saturday) and a random sample of n = 200 customers is selected, the expected number
that will arrive on Monday is about 33.33.
A report recently submitted to the managing partner for a market research company
stated “the hypothesis test may have resulted in either a Type I or a Type II error. We
won’t know which one occurred until later.” This statement is one that we might
correctly make for any hypothesis that we have conducted.

A construction company has found it has a probability of 0.10 of winning each time it
bids on a project. The probability of winning a given number of projects out of 12 bids
could be determined with a binomial distribution.
A study was recently done in which the following regression output was generated
using Excel.
SUMMARY OUTPUT
Given this output, we would reject the null hypothesis that the population regression
slope coefficient is equal to zero at the alpha = 0.05 level.

A dummy variable is a dependent variable whose value is set at either zero or one.
If the null hypothesis is not rejected, you do not need to worry when the expected cell
frequencies drop below 5.0
If two events are mutually exclusive, it is possible for them to also be independent of
each other.
Suppose the mean balance of checking accounts at Regions Bank is known to be $4320.

A random sample of 10 accounts yields a total of $41,490. This means the sampling
error is -$171.
Cross-sectional data is a set of data values observed at successive points in time.
The Colbert Real Estate Agency has determined the number of home showings given by
its agents is the same each day of the week. Then the variable, number of showings, is a
continuous distribution.
A scatter diagram can show that the relationship between two variables is actually
nonlinear.

A recent study of students at the university contained data on year in school and student
age. An appropriate tool for analyzing the relationship between these two variables
would be a joint frequency distribution.
In using simple linear regression to find the linear trend in an annual time series from
1990 to 2005, the values 1990, 1991, etc. are used as the values of the independent
variable t when the regression is conducted.
Recently, an analyst in a company’s marketing department surveyed customers
regarding how often they buy a particular product. One customer indicated that she
purchased the product 17 times in the last six months, but the analyst recorded the
response as 71 times. This is an example of observer bias.
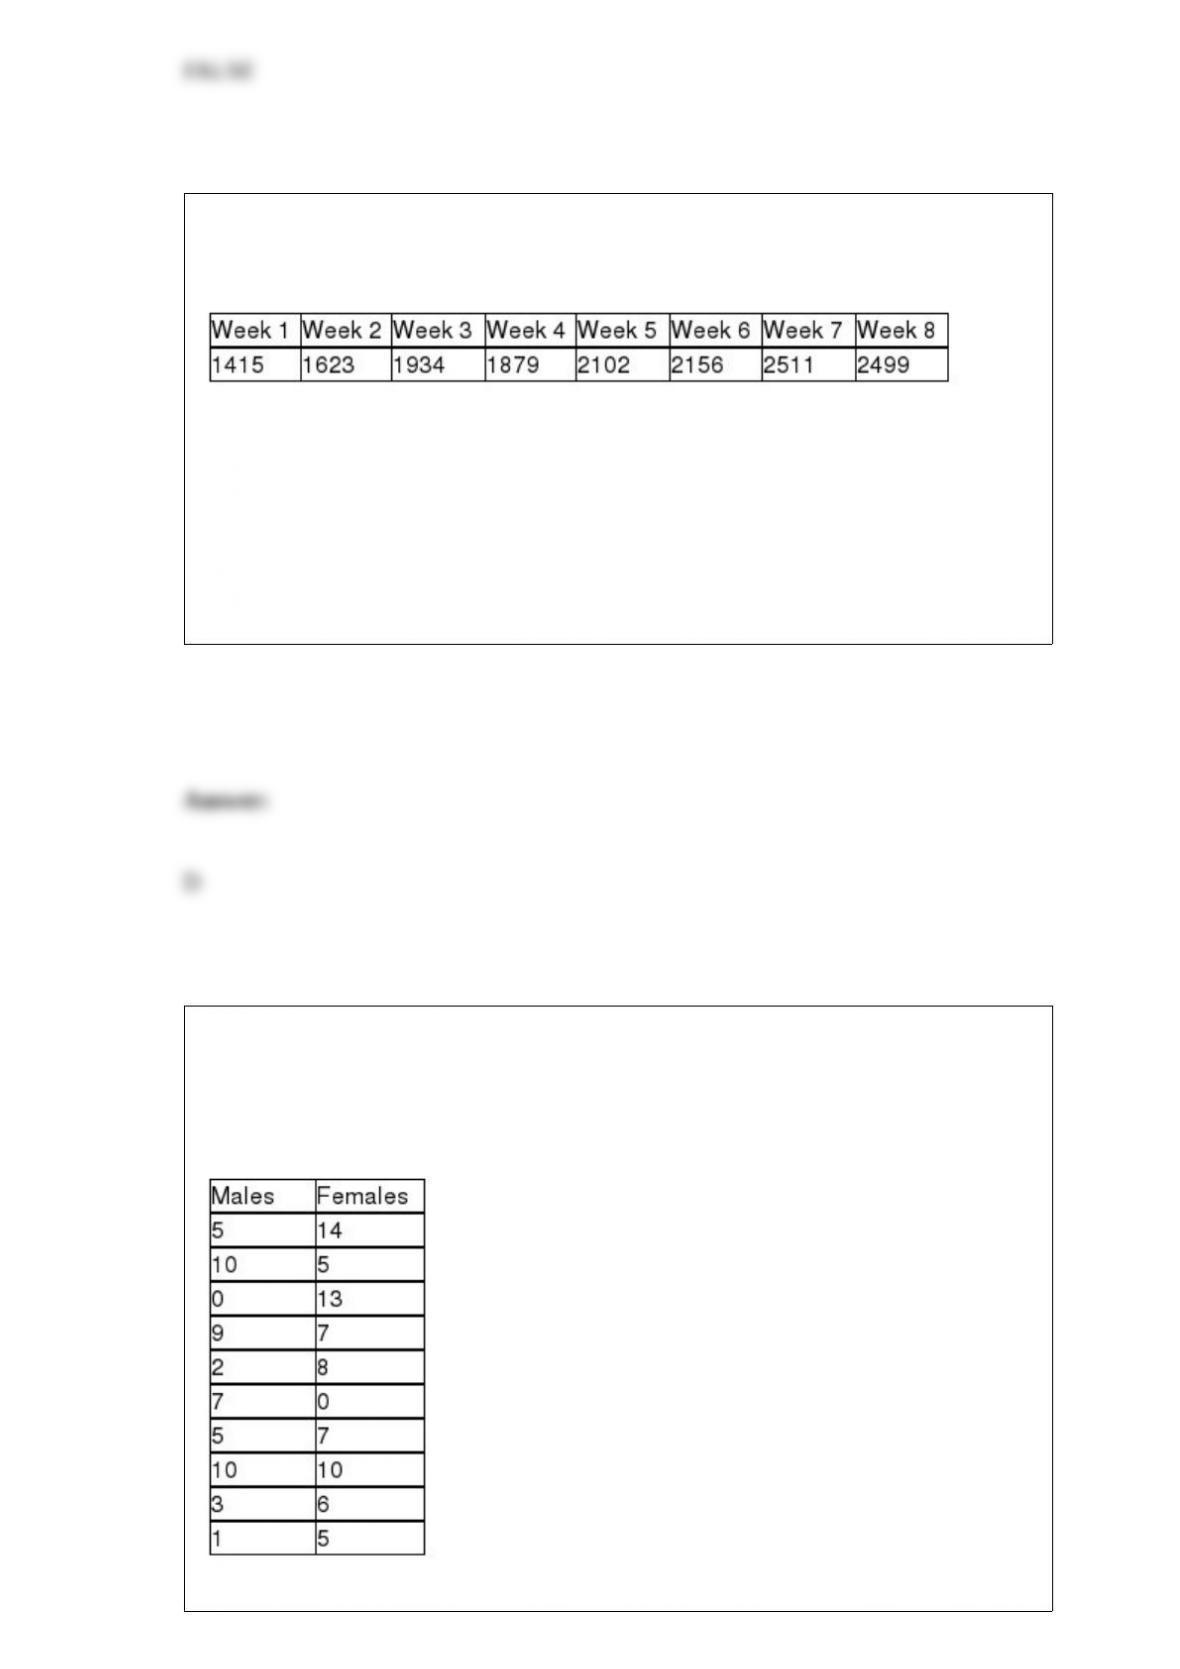
The Fitness Center manager has collected data on the number of visits to the club each
week for the past 8 weeks. These data are shown as follows. Which of the following
statements is most correct?
A) The proper graph for displaying these data is a pie chart.
B) There has been a gradual downward trend in these data.
C) A frequency histogram should be developed to help identify the trend in these data.
D) The data lend themselves to a line chart.
Consider the situation in which a human resources manager wishes to determine
whether the median number of days of sick leave per year is the same for female
employees as for male employees. The following data represent random samples of
males and females:
If the manager is unwilling to assume that the populations are normally distributed,
which of the following would be the appropriate null hypothesis to be tested?
A) H0 : μ = 0
B) H0 : = 0
C) H0 : μ1 = μ2
D) H0 : 1 = 2
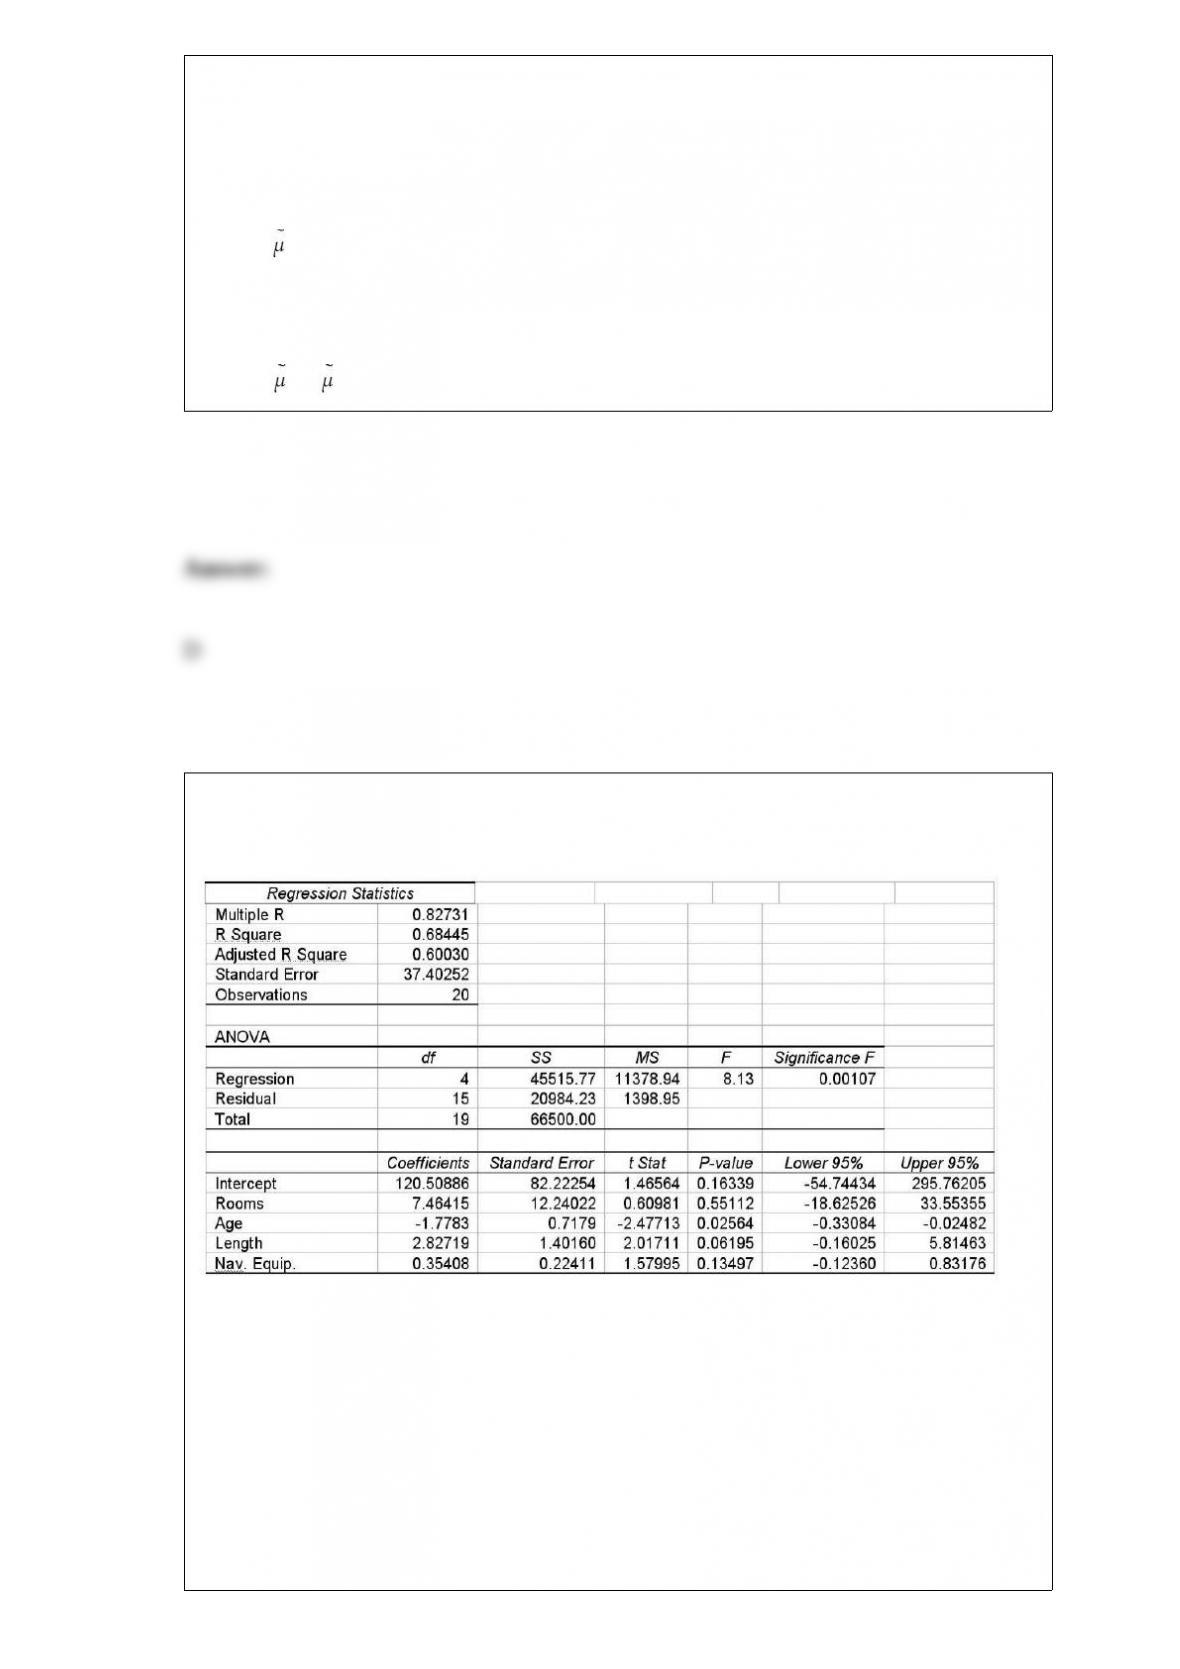
A multiple regression is shown for a data set of yachts where the dependent variable is
the price in thousands of dollars.
Based on this output, which of the independent variables appear to be significantly
helping to predict the price of a yacht, using a 0.10 level of significance?
A) Age
B) Age and length
C) Rooms and Nav. Equip.

D) Length and Nav. Equip.
College-Pro Painting does home interior and exterior painting. The company uses
inexperienced painters that do not always do a high-quality job. It believes that its
painting process can be described by a Poisson distribution with an average of 4.8
defects per 400 square feet of painting.
What is the probability that six randomly sampled sections of size 400 square feet will
each have 7 or fewer blemishes?
A) 0.2818
B) 0.3414
C) 0.4857
D) 0.6509
A cell phone company wants to determine if the use of text messaging is independent of
age. The following data has been collected from a random sample of customers.
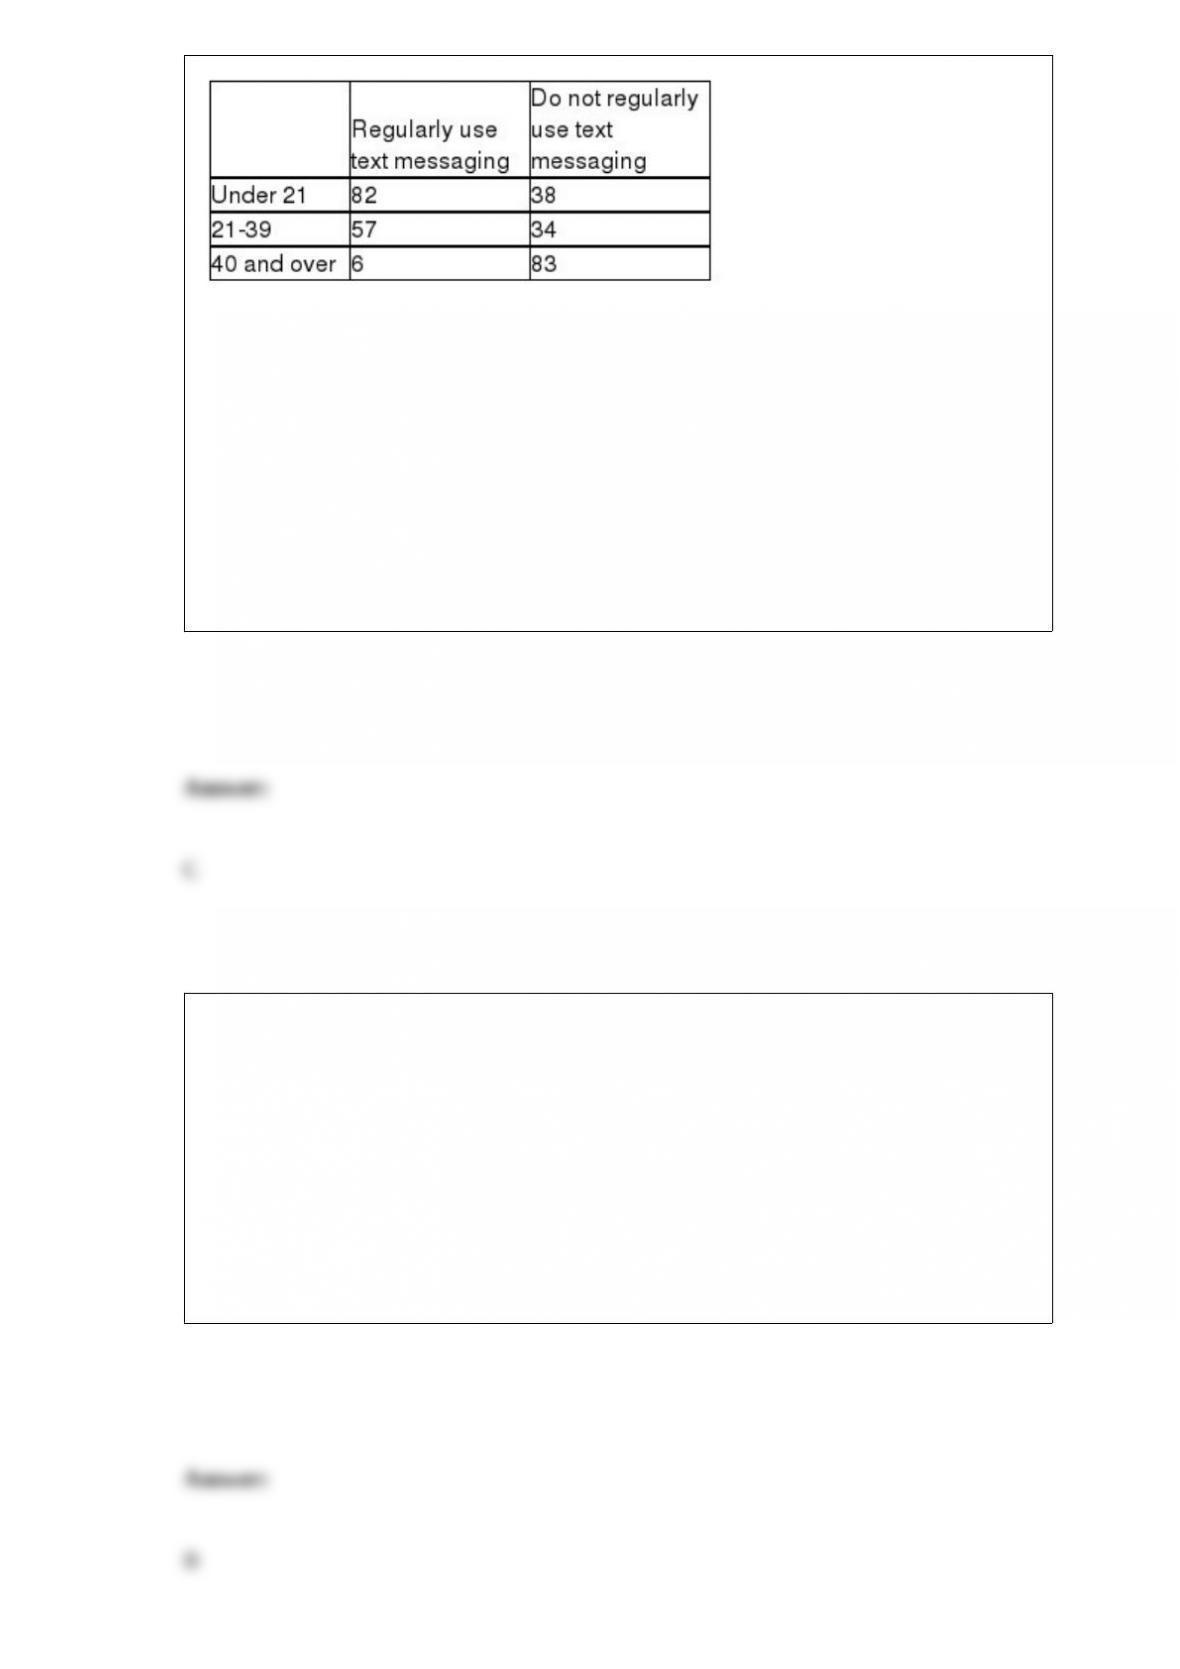
To conduct a contingency analysis using a 0.01 level of significance, the value of the
critical value is:
A) 15.0863
B) 5.9915
C) 9.2104
D) 11.0705
For a standardized normal distribution, determine a value, say z0, so that P(-z0 ≤ z < 0)
= 0.45.
A) 1.84
B) 1.645
C) 1.96
D) 1.33
Suppose a survey is taken of two groups of people where each person is asked a yes/no
question and the proportion of people who answer yes is calculated for each group.
Which of the following is true about a hypothesis test of the difference in the two
proportions?
A) Normality can be assumed if the sample size for each population is at least 30.
B) The t-distribution should be used if the standard deviations are unknown.
C) The standard deviation must be assumed equal.
D) Normality can be assumed if, in each group, at least 5 people say yes, and at 5
people say no.
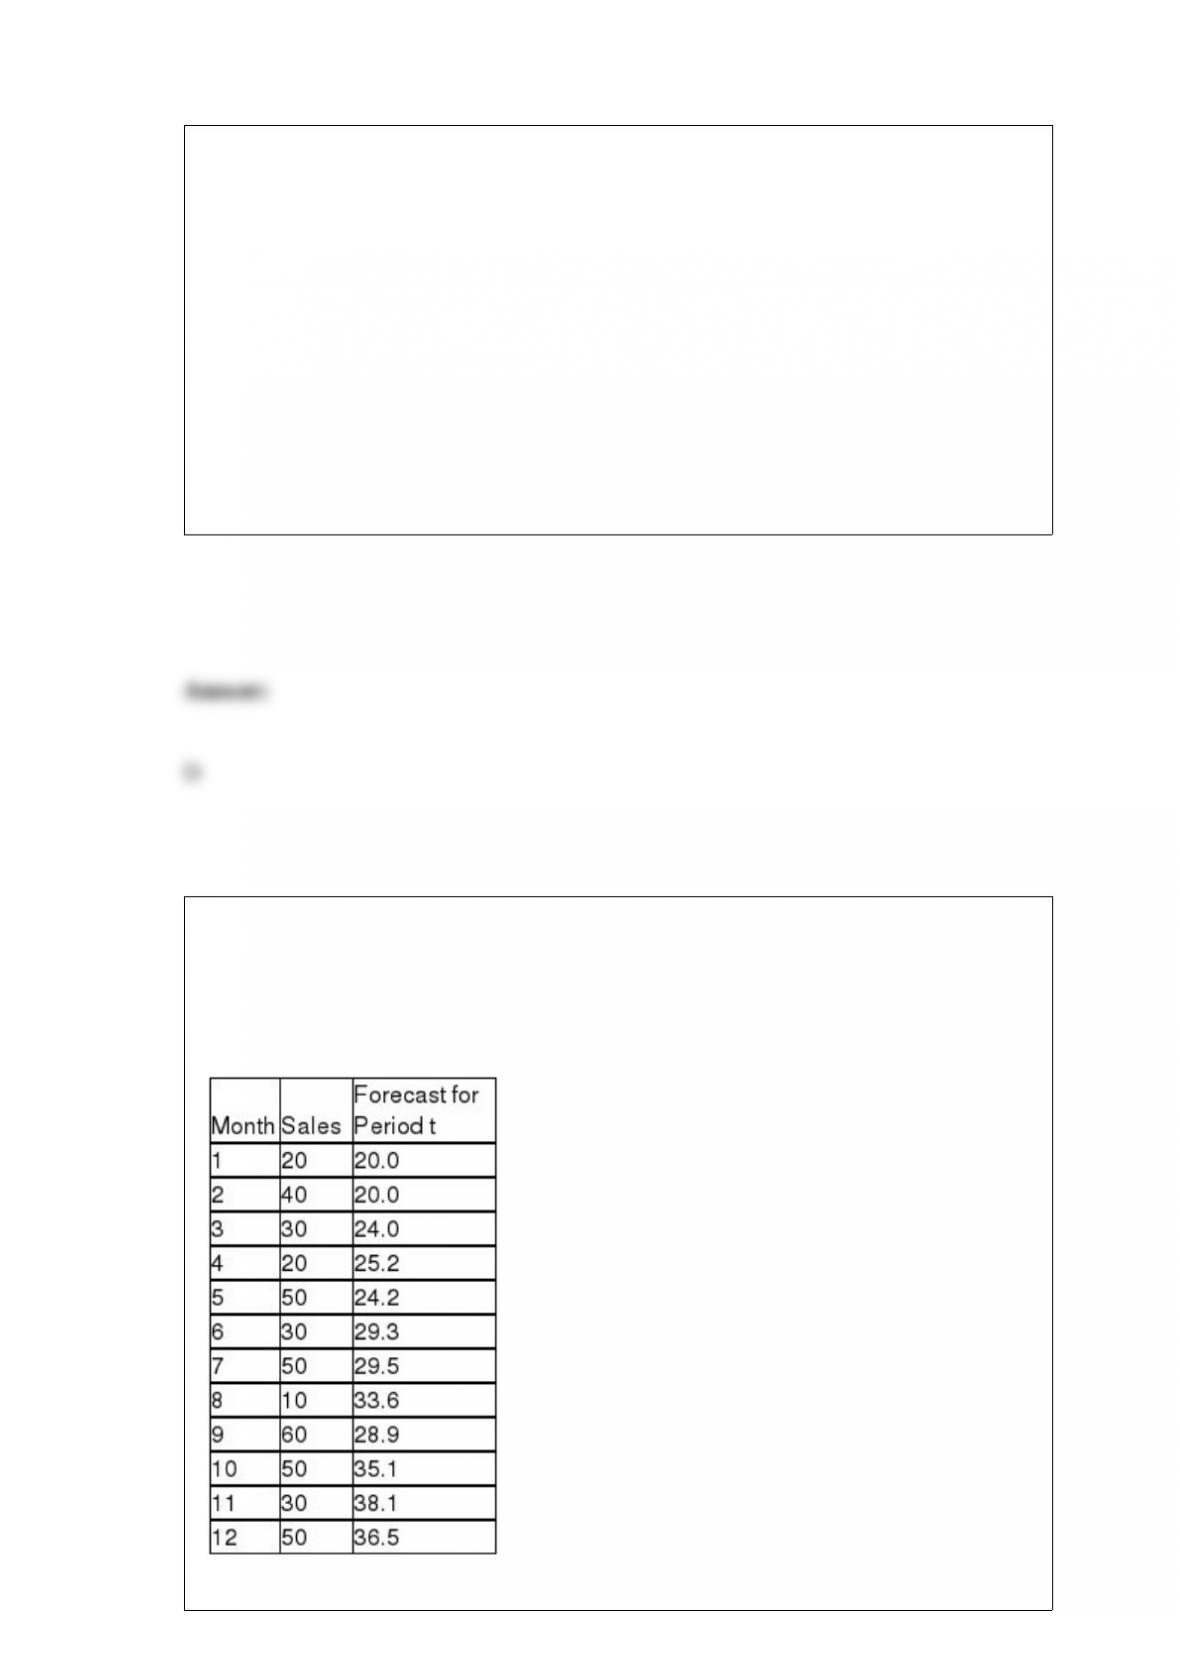
The Zocor Company is interested in forecasting period 13 sales for a product. It has 12
months of historical data. The following shows the data and the forecasted values for
periods 1-12 using a single exponential smoothing model with a smoothing constant
value equal to 0.20.

Which of the following would be the forecast for period 13?
A) 40.3
B) 39.2
C) 34.7
D) 36.5
Frequency distributions can be formed from which of the following types of data?
A) Both discrete and continuous
B) Discrete only
C) Continuous only
D) Only qualitative data
Based on weather data collected in Racine, Wisconsin, on Christmas Day, the weather
had the following distribution:

Supposing next Christmas is dry, determine the probability that it will also be cloudy.
A) 0.45
B) 0.50
C) 0.60
D) 0.70
For a standardized normal distribution, determine a value, say z0, so that P(-z0 ≤ z ≤ z0)
= 0.95.
A) 2.14
B) 1.65
C) 1.96
D) 1.24

Which of the following statements is correct?
A) A scatter plot showing two variables with a positive linear relationship will have all
points on a straight line.
B) The stronger the linear relationship between two variables, the closer the correlation
coefficient will be to 1.0.
C) Two variables that are uncorrelated with one another may still be related in a
nonlinear manner.
D) All of the above are correct.
The manager of an online shop wants to determine whether the mean length of calling
time of its customers is significantly more than 3 minutes. A random sample of 100
customers was taken. The average length of calling time in the sample was 3.1 minutes
with a standard deviation of 0.5 minutes. At a 0.05 level of significance, it can be
concluded that the mean of the population is:
A) significantly greater than 3.
B) not significantly greater than 3.
C) significantly less than 3.
D) not significantly different from 3.10.

The St. Joe Company grows pine trees and the average annual increase in tree diameter
is 3.1 inches with a standard deviation of 0.5 inch. A random sample of n = 50 trees is
collected. What is the probability of the sample mean being less the 2.9 inches?
A) 0.4977
B) 0.0023
C) 0.9977
D) 0.9954
For a given sample size n, if the level of significance (α) is decreased, the power of the
test:
A) will increase.
B) will decrease.
C) will remain the same.
D) cannot be determined.
A report on spending by adults on recreation stated the following: At least 75 percent of
the people in the survey spend between $750 and $1,250 per year. The report also said
that at least 88 percent spend between $625 and $1,375 per year. Given this
information, which of the following is most apt to be true?

A) The standard deviation is approximately $125.
B) The distribution of spending on recreation can be assumed to be bell-shaped.
C) The standard deviation is approximately $187.5.
D) The standard deviation is approximately $250.
Which of the following is not an assumption of the Mann-Whitney U test?
A) The sample sizes are equal.
B) The samples are independent.
C) The value measured is continuous.
D) The population distributions are the same for shape and spread.
The manager of a computer help desk operation has collected enough data to conclude
that the distribution of time per call is normally distributed with a mean equal to 8.21
minutes and a standard deviation of 2.14 minutes. The manager has decided to have a
signal system attached to the phone so that after a certain period of time, a sound will
occur on her employees’ phone if she exceeds the time limit. The manager wants to set
the time limit at a level such that it will sound on only 8 percent of all calls. The time
limit should be:

A) 10.35 minutes.
B) approximately 5.19 minutes.
C) about 14.58 minutes.
D) about 11.23 minutes.
Assuming that the change in daily closing prices for stocks on the New York Stock
Exchange is a random variable that is normally distributed with a mean of $.35 and a
standard deviation of $.33. Based on this information, what is the probability that a
randomly selected stock will close up $.75 or more?
A) 0.3869
B) 0.1131
C) 0.7100
D) 0.8869
State University recently randomly sampled seven students and analyzed grade point
average (GPA) and number of hours worked off-campus per week. The following data
were observed:

A regression model with HOURS as the independent variable has an R-square equal to
approximately .46.
The summaries of data, which may be in forms of tabular, graphical, or numerical, are
referred to as:
A) inferential statistics.
B) descriptive statistics.
C) statistical inference.
D) report generation.

A survey of 499 women for the American Orthopedic Foot and Ankle Society revealed
that 38% wear flats to work.
Suppose the society also wishes to estimate the proportion of women who wear athletic
shoes to work with a margin of error of 0.01 with 95% confidence. Determine the
sample size required.
A) 7241
B) 9604
C) 10021
D) 9715
Which of the following statements is false?
A) Increasing the sample size will always reduce the size of the sampling error when
the sample mean is used to estimate the population mean.
B) Increasing the sample size will reduce the potential for extreme sampling error.
C) Sampling error can occur when differs from μ due to the fact that the sample was
not a perfect reflection of the population.
D) There is no way to prevent sampling error short of taking a census of the entire
population.

The following information is based on independent random samples taken from two
normally distributed populations having equal variances:
Based on the sample information, determine the 90% confidence interval estimate for
the difference between the two population means.
A) -6.54 ≤ (1 – 2) ≤ 0.54
B) -4.25 ≤ (1 – 2) ≤ 1.25
C) -5.98 ≤ (1 – 2) ≤ 1.88
D) -2.25 ≤ (1 – 2) ≤ 5.25
Recording vehicle type as sedan, minivan, pick-up truck, etc. is an example of
qualitative data.

In a standard normal distribution, the probability P(-1.00< z < 1.20) is the same as:
A) P(1< z < 1.20) – P(0 < z < 1.00).
B) P(1< z < 1.20) – 2*P(0 < z < 1.00).
C) 2 P(1< z < 1.20) – P(0 < z <1.00).∗
D) P(1 < z < 1.20) + 2 P(0 < z <1.00). ∗
For a standardized normal distribution, calculate P(0.00 < z < 2.33).
A) 0.7181
B) 0.5099
C) 0.4901
D) 0.2819
The number of weeds that remain living after a specific chemical has been applied
averages 1.3 per square yard and follows a Poisson distribution. Based on this, what is
the probability that a 1-square yard section will contain less than 4 weeds?
A) 0.0324
B) 0.0998

C) Nearly 0.5000
D) 0.9569
A production process that fills 12-ounce cereal boxes is known to have a population
standard deviation of 0.009 ounce. If a consumer protection agency would like to
estimate the mean fill, in ounces, for 12-ounce cereal boxes with a confidence level of
92% and a margin of error of 0.001, what size sample must be used?
A) 249
B) 351
C) 512
D) 211
Suppose that a population is known to be normally distributed with mean = 2,000 and
standard deviation = 230. If a random sample of sizen = 8 is selected, calculate the
probability that the sample mean will exceed 2,100.
A) 0.2141
B) 0.1871
C) 0.0712

D) 0.1093