
Data summarized in a frequency distribution or histogram form are often called
weighted data.
What sample size is needed to estimate with 95 percent confidence the mean intake of
daily calcium within 20 units of the true mean if the intake is normally distributed with
a variance of 1900 units?
A. 34,671
B. 187
C. 32
D. 19
The set of all possible outcomes for an experiment is called a(n) ____________.
A. sample space
B. event
C. experiment
D. probability

Recently, a case of food poisoning was traced to a particular restaurant chain. The
source was identified and corrective actions were taken to make sure that the food
poisoning would not reoccur. Despite the response from the restaurant chain, many
consumers refused to visit the restaurant for some time after the event. A survey was
conducted three months after the food poisoning occurred, with a sample of 319 former
customers contacted. Of the 319 contacted, 29 indicated that they would not go back to
the restaurant because of the potential for food poisoning. What sample size would be
needed in order to be 99 percent confident that the sample proportion is within .02 of ρ,
the true proportion of customers who refuse to go back to the restaurant?
A. 14
B. 38
C. 129
D. 1,371
E. 1,777
Two percent of the customers of a store buy cigars. Half of the customers who buy
cigars buy beer. 25 percent who buy beer buy cigars. Determine the probability that a
customer buys beer.
A. 0.25
B. 0.01
C. 0.04
D. 0.50

E. 0.005
A research study investigated differences between male and female students. Based on
the study results, we can assume the population mean and standard deviation for the
GPA of male students are = 3.5 and σ = 0.5. Suppose a random sample of 100 male
students is selected and the GPA for each student is calculated. What is ?
A. 0.5
B. 3.5
C. 7.0
D. 0.05
The population of lengths of aluminum-coated steel sheets is normally distributed with
a mean of 30.05 inches and a standard deviation of 0.2 inches. A sample of four metal
sheets is randomly selected from a batch. What is the probability that the average length
of a sheet is between 30.25 and 30.35 inches long?
A. .9773
B. .0227
C. .0386
D. .0215

A study shows that employees who begin their workday at 9:00 a.m. vary their times of
arrival uniformly from 8:40 a.m. to 9:30 a.m. The probability that a randomly chosen
employee reports to work between 9:00 and 9:10 is
A. 40 percent.
B. 20 percent.
C. 10 percent.
D. 30 percent.
E. 16.7 percent.
For the same value of X (independent variable), the confidence interval for the average
value of Y (dependent variable) is __________________ the prediction interval for the
individual value of Y.
A. larger than
B. smaller than
C. the same as
D. sometimes larger than, sometimes smaller than

A _____________ displays the frequency of each group with qualitative data and a
_____________ displays the frequency of each group with quantitative data.
A. histogram, stem-and-leaf display
B. bar chart, histogram
C. scatter plot, bar chart
D. stem-and-leaf, pie chart
When employing measurement data to study a process, the __________ monitors the
process variation.
A. chart
B. R chart
C. p chart
D. natural tolerance
E. pattern analysis
Given the following information about a hypothesis test of the difference between two

means based on independent random samples, what is the calculated value of the test
statistic? Assume that the samples are obtained from normally distributed populations
having equal variances.
HA: μA > μB, = 12, = 9, s1 = 5, s2 = 3, n1 = 13, n2 = 10.
A. t = 1.96
B. t = 1.5
C. t = 2.823
D. t = 1.674
E. t = 1.063
When testing a null hypothesis about a single population mean and the population
standard deviation is unknown, if the sample size is less than 30, one compares the
computed test statistic for significance with a value from the ___________ distribution.
A. t
B. z
C. binomial
D. hypergeometric
An aptitude test has a mean score of 80 and a standard deviation of 5. The population of
scores is normally distributed. What raw score corresponds to the 70th percentile?

A. 77.4
B. 83.5
C. 82.6
D. 76.5
Determine whether these two events are mutually exclusive:
someone with three sisters and someone with four siblings.
A. mutually exclusive
B. not mutually exclusive
In a statistics class, 10 scores were randomly selected with the following results: 74, 73,
77, 77, 71, 68, 65, 77, 67, 66.
What are the lower and upper limits?
A. 67, 77
B. 57, 87
C. 37, 107
D. 52, 92

E. 47, 97
Rational subgrouping allows us to detect changes ____________ subgroups.
A. within
B. between
C. in the sizes of
D. None of the other choices is correct.
Consider a Poisson distribution with an average of 3 customers per minute at the local
grocery store. Determine the expected number of customer arrivals for a five-minute
period.
A. 15
B. 3
C. 243
D. 125

How well a process is able to meet the requirements set forth by the process design is
called the quality of _____________.
A. performance
B. conformance
C. design
D. control
The local amusement park was interested in the average wait time at their most popular
roller coaster at the peak park time (2 p.m.). They selected 13 patrons and had them get
in line between 2 and 3 p.m. Each was given a stopwatch to record the time they spent
in line. The times recorded were as follows (in minutes).
118, 124, 108, 116, 99, 120, 148, 118, 119, 121, 45, 130, 118
What is the 10th percentile?
A. 99
B. 120
C. 130
D. 112
E. 45

Find z when the area between 0 and z is .4750.
A. −1.96
B. 1.96
C. 0.68
D. −0.68
The __________________ detects whether the probability distribution of one
population is shifted to the right or to the left of the probability distribution of another
population.
A. sign test
B. Wilcoxon rank sum test
C. Wilcoxon signed ranks test
D. Kruskal-Wallis test

If two events are independent, we can _____________ their probabilities to determine
the intersection probability.
A. divide
B. add
C. multiply
D. subtract
Assume that the following data set is not normally distributed.
(21, 18, 4, 9, 14, 16, 17, 12, 15, 8, 7, 5)
If Ha: Md < 16, then the p value is
A. .1208.
B. .1937.
C. .0537.
D. .3874.
E. .1458.
At a college, 70 percent of the students are women and 50 percent of the students
receive a grade of C. 25 percent of the students are neither female nor C students. Use
this contingency table.

If a student has received a grade of C, what is the probability that the student is female?
A. 0.45
B. 0.90
C. 0.70
D. 0.64
E. 0.50
The population of lengths of aluminum-coated steel sheets is normally distributed with
a mean of 30.05 inches and a standard deviation of 0.2 inches. What is the probability
that a sheet selected at random from the population is between 30.25 and 30.65 inches
long?
A. .9987
B. .1574
C. .1587
D. .8413

Health insurers and the federal government are both putting pressure on hospitals to
shorten the average length of stay (LOS) of their patients. In 2003, the average LOS for
non-heart patients was 4.6 days. A random sample of 20 hospitals in one state had a
mean LOS for non-heart patients in 2008 of 3.8 days and a standard deviation of 1.2
days. Calculate a 95 percent confidence interval for the population mean LOS for
non-heart patients in these hospitals in 2008.
A. [3.24, 4.36]
B. [3.67, 3.93]
C. [3.34, 4.26]
D. [3.38, 4.22]
E. [3.27, 4.33]
The value of χ2
α in a particular situation depends on
A. the left-hand tail area α.
B. the number of degrees of freedom.
C. the right-hand tail area α.
D. the left-hand tail area α and the number of degrees of freedom.
E. the number of degrees of freedom and the right-hand tail area α.

A plant manager knows that the number of boxes of supplies received weekly is
normally distributed with a mean of 200 and a standard deviation of 20. What
percentage of the time will fewer than 160 boxes of supplies arrive in a week?
A. 2.28%
B. 57.93%
C. 42.07%
D. 4.56%
The yearly proportional return for stock G = x, the yearly proportional return for stock
H = y, μx = .16, μy = .07, σx = .11, σy = .11, and σxy
2 = .0321. Find the mean and
standard deviation of the portfolio return: P = .45x + .55y.
In testing H0: p = .2; versus HA: p ≠ .2 using the critical value rule, with = .26 and n =
100, what is the value of the test statistic?
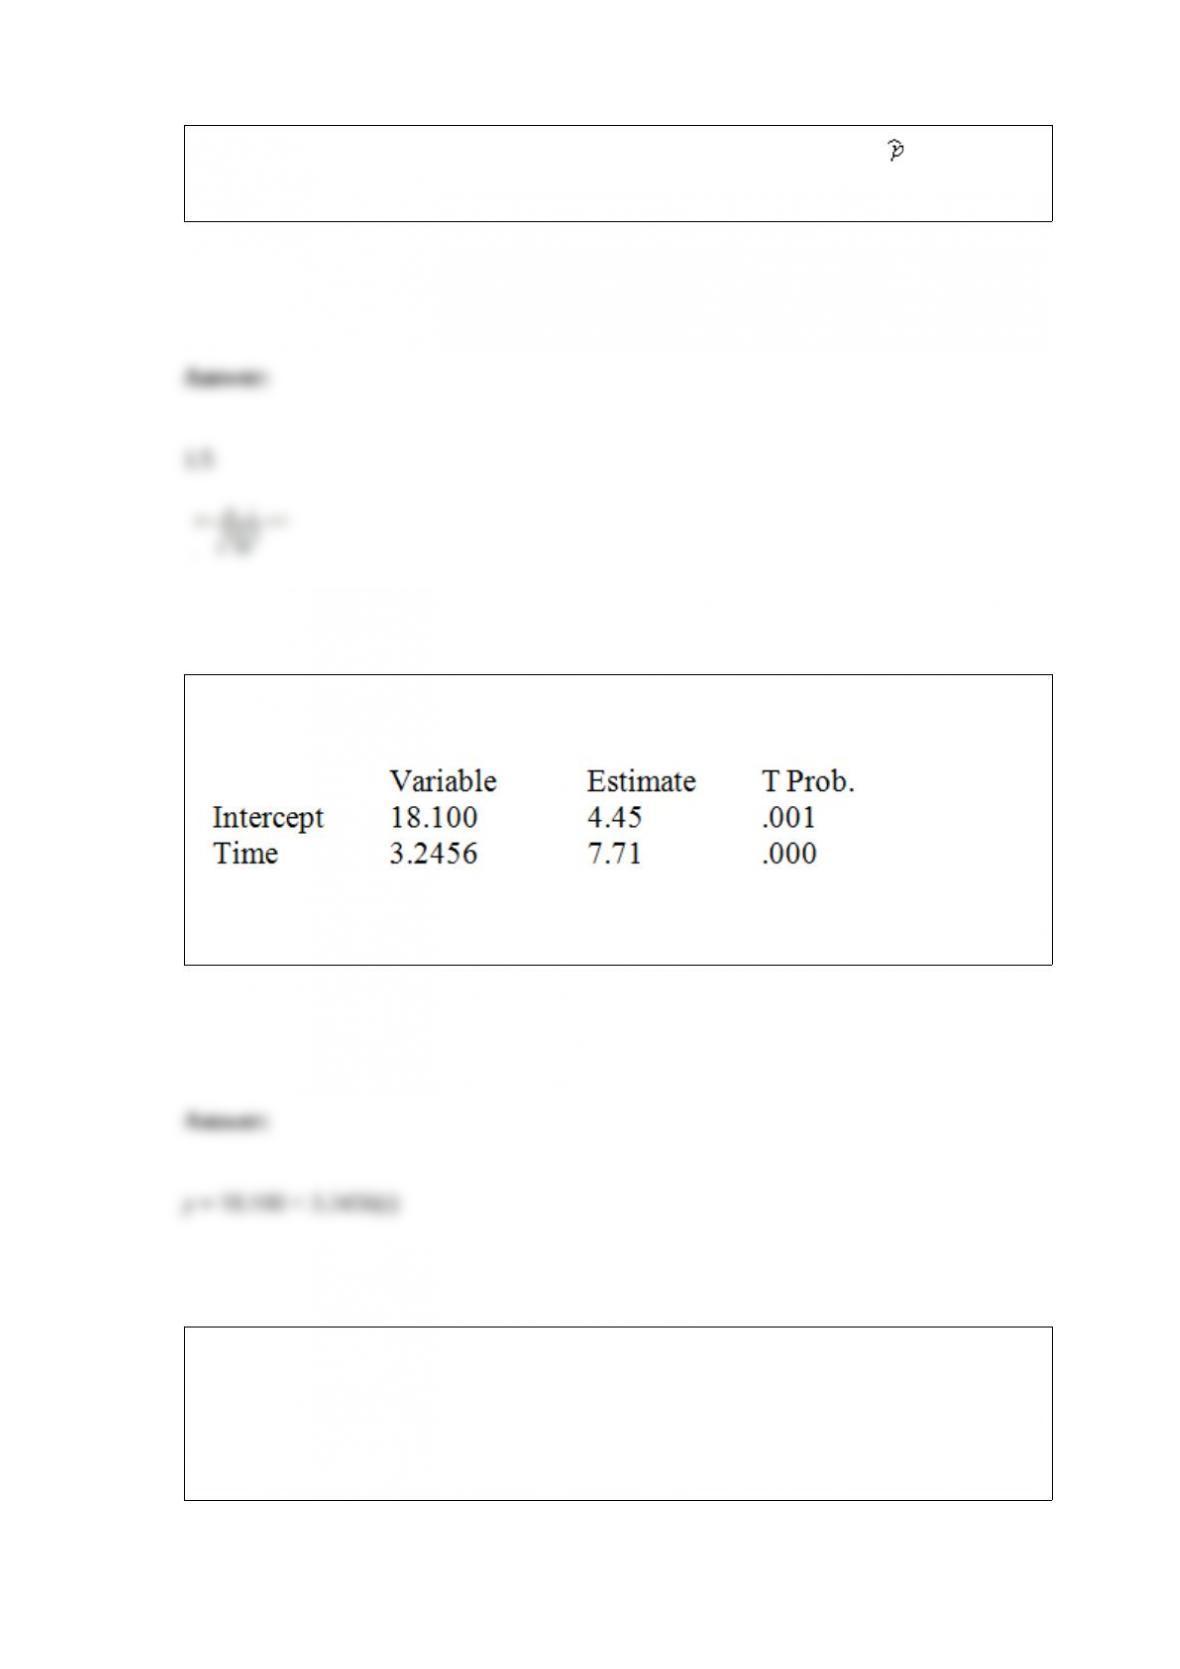
The linear regression trend model was applied to a time series of sales data based on the
last 16 months of sales. The following partial computer output was obtained.
Write the prediction equation.
A local tire dealer wants to predict the number of tires sold each month. He believes
that the number of tires sold is a linear function of the amount of money invested in
advertising. He randomly selects 6 months of data consisting of tire sales (in thousands
of tires) and advertising expenditures (in thousands of dollars). Based on the data set
with 6 observations, the simple linear regression model yielded the following results.

Calculate the sample correlation coefficient.