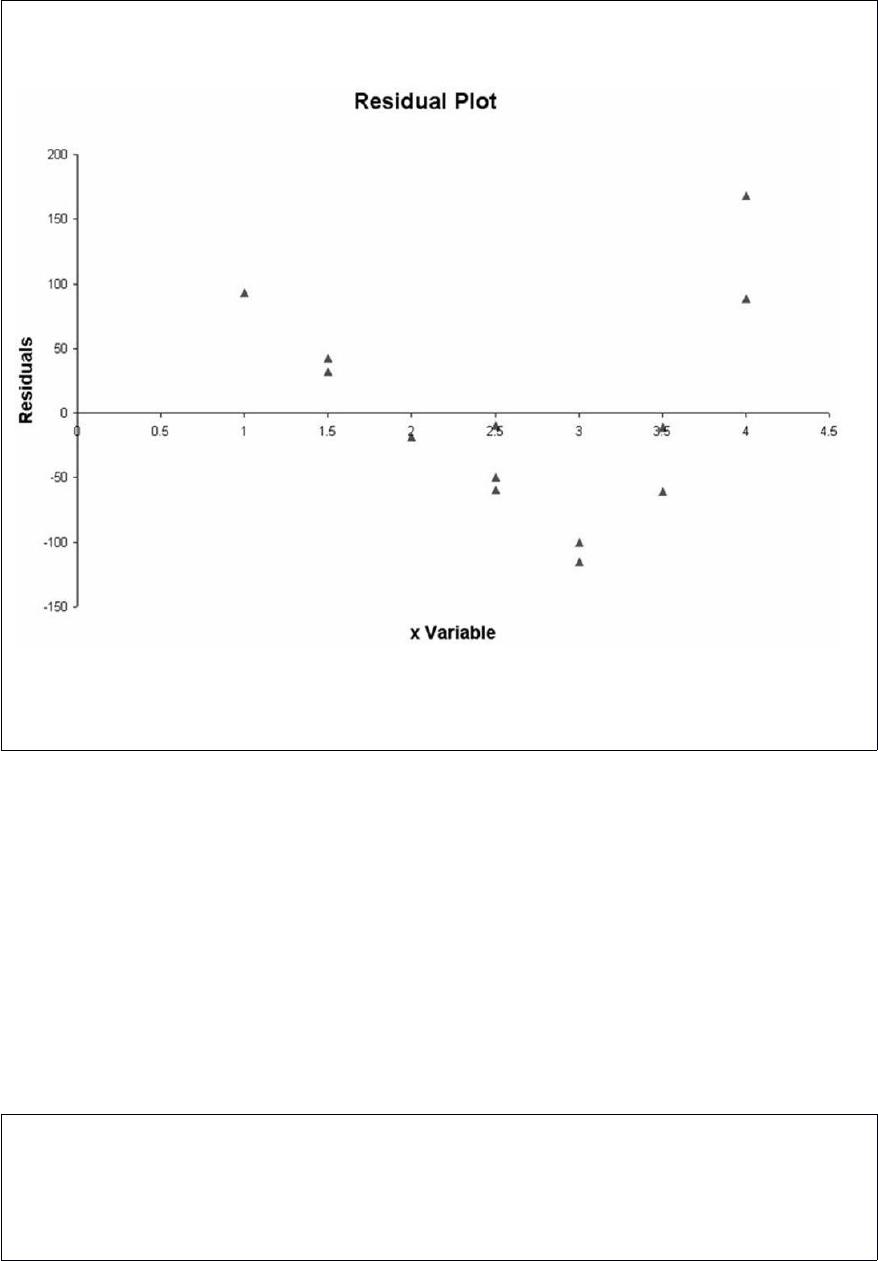
The following residual plot was constructed based on a simple linear regression model.
Based on this plot, there appears to be no basis for concluding that a curvilinear model
may be more appropriate than a linear model to explain the variation in the y variable.
A Parks and Recreation official surveyed 200 people at random who have used one of
the city’s parks. The survey revealed that 26 resided outside the city limits. If she had to
arrive at one single value to estimate the true proportion of park users who are residents
of the city it would be 0.13.
Suppose it is known that the mean purchase price for all homes sold last year in
Blacksburg, Virginia was $203,455. Recently, two studies were done on home sales
prices. In the first study, a random sample of 200 homes was selected from the
population. In the second study, a random sample of 60 homes was selected. Based on
this information, we know that the second study would contain more sampling errors
than the first study due to the smaller sample size.
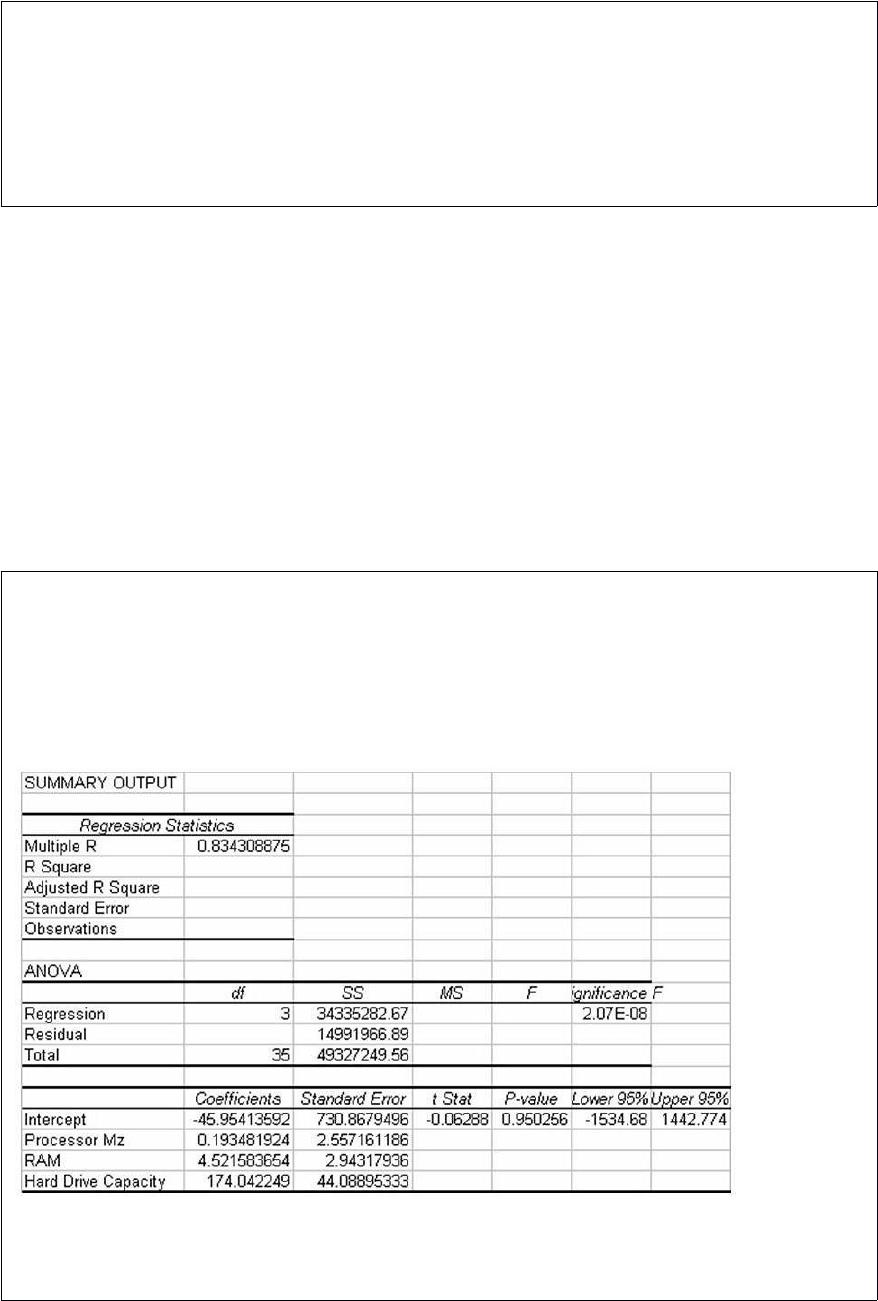
A study has recently been conducted by a major computer magazine publisher in which
the objective was to develop a multiple regression model to explain the variation in
price of personal computers. Three independent variables were used. The following
computer printout shows the final output. However, several values are omitted from the
printout.
Given this information, the calculated test statistic for the regression slope coefficient
on the variable RAM, is approximately 1.54.
In a study of employees at a local company, the human resource manager wants to
develop a multiple regression model to explain the difference in employee wage rates.
She is thinking of including a variable, degree status, in which the following categories
exist: no degree, H.S. degree, junior college degree, bachelor degree, graduate degree.
One appropriate approach for including this variable is to code the categories 1, 2, 3, 4,
and 5.
A smaller sample might provide less sampling error than a larger sample from a given
population.
In determining the required sample size in an application involving an estimate for the
population mean, if the population standard deviation is known, there is no compelling
reason to select a pilot sample.
A data set in which the mean, median, and mode are all equal is said to be a skewed
distribution.
A study was recently conducted to see whether the mean starting salaries for graduates
of engineering, business, healthcare, and computer information systems majors differ. A
random sample of 8 graduates was selected from each major. Based upon this
information, the appropriate null hypothesis to be tested is H0 : μ1 – μ2 – μ3 – μ4 = 0
If the historical data on which the model is being built consist of weekly data, the
forecasting period would also be weekly.
Recently the managers for a large retail department store stated that a study has
revealed that female shoppers spend on average 23.5 minutes longer in the store per
visit than do male shoppers. Based on this information, the managers can be confident
that female shoppers, as a population, do spend longer times in the store than do males
shoppers, as a population.
The within sample variation is the dispersion that exists because the sample means for
the various factor levels are not all equal.
The basic logic of the Wilcoxon signed rank test is that if about half the data values fall
above the hypothesized median, and about half fall below, the null hypothesis should
not be rejected.
Cross-sectional data is a set of data values observed at successive points in time.
Recently, a company tested three different machine types to see if there was a difference
in the mean thickness of products produced by the three. A random sample of ten
products was selected from the output from each machine. Given this information, the
proper design to test whether the means are equal is a one-way ANOVA balanced
design.
Type II errors are typically greater for two-tailed hypothesis tests than for one-tailed
tests.
It is possible for a nonstatistical sample to yield statistics that have values closer to the
corresponding parameter than will a statistical sample.
A company has 20 cars that are available for use by company executives for official
business purposes. Six of these cars are SUVs, 8 are luxury type cars, and the rest are
basic sedans. Suppose the cars are randomly assigned each week. If 5 cars are put into
use, the chance that none of the SUVs or luxury cars will be in the group is
approximately .0004.
When using the p-value method for a two-tailed hypothesis, the p-value is found by
finding the area in the tail beyond the test statistic, then doubling it.
One of the major automobile makers has developed two new engines. At question is
whether the two engines have the same variability with respect to miles per gallon. To
test this using a significance level equal to 0.10, the following information is available:
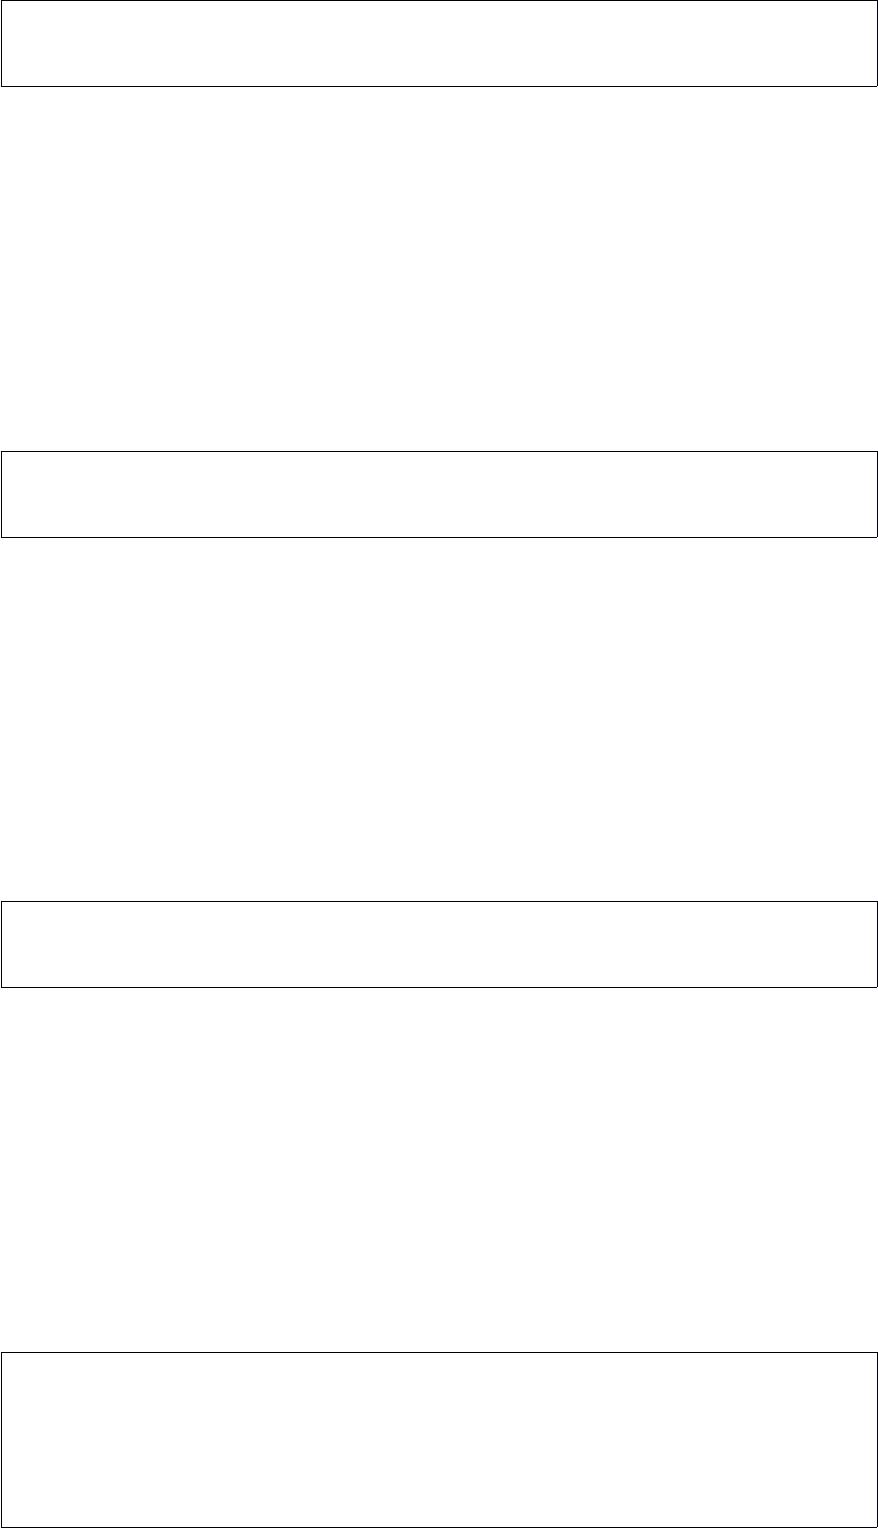
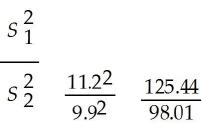
Based on this situation and the information provided, the critical value is F = 4.147 .
The probability of a Type II error decreases as the “true” population value gets farther
from the hypothesized population value, given that everything else is held constant.
In conducting a hypothesis test on the correlation between a pair of variables, we
assume that each variable is normally and independently distributed.
The Dilmart Company has 8,000 parts in inventory. The mean dollar value of these
parts is $10.79 with a standard deviation equal to $3.34. Suppose the inventory manager
selected a random sample of n = 64 parts from the inventory and found a sample mean
equal to $11.27. The probability of getting a sample mean at least as large as $11.27 is
approximately 0.444.
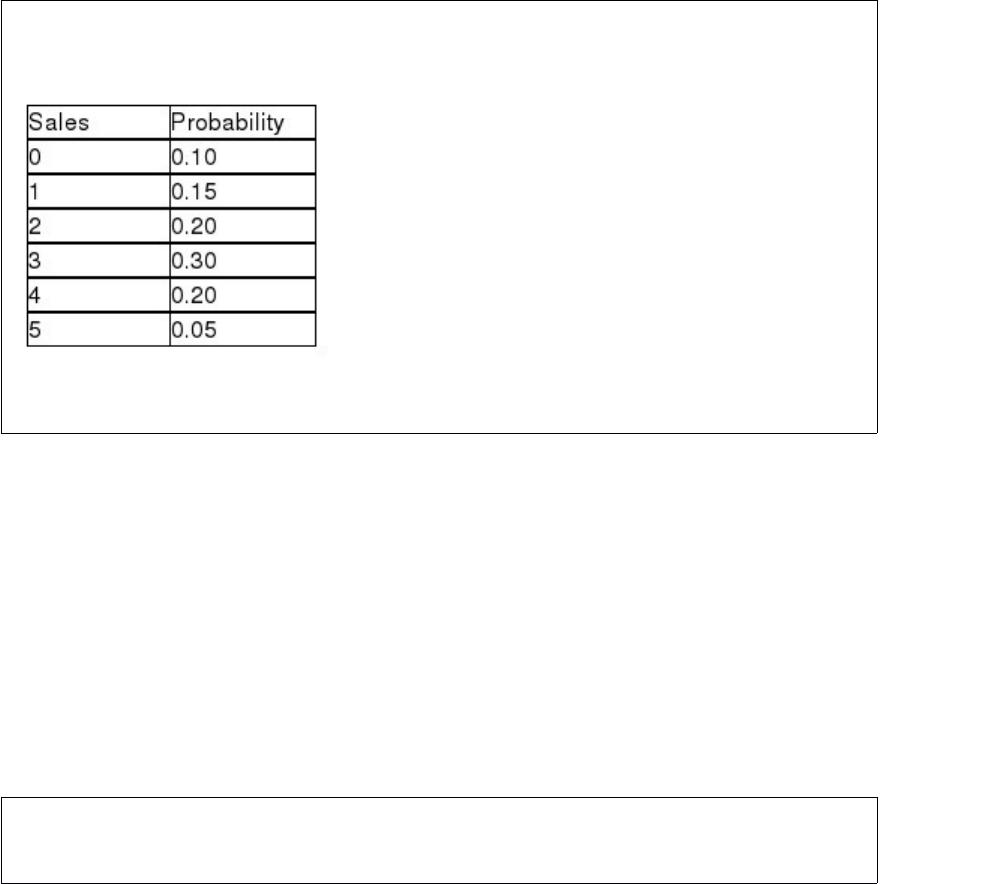
The following probability distribution was subjectively assessed for the number of sales
a salesperson would make if he or she made five sales calls in one day.
Given this distribution, the probability that the number of sales is 2 or 3 is 0.50.
A scatter diagram can show that the relationship between two variables is actually
nonlinear.
If one or more of the regression assumptions has been violated this means that the
current regression model is not the best one for this data set, and another model should
be sought.
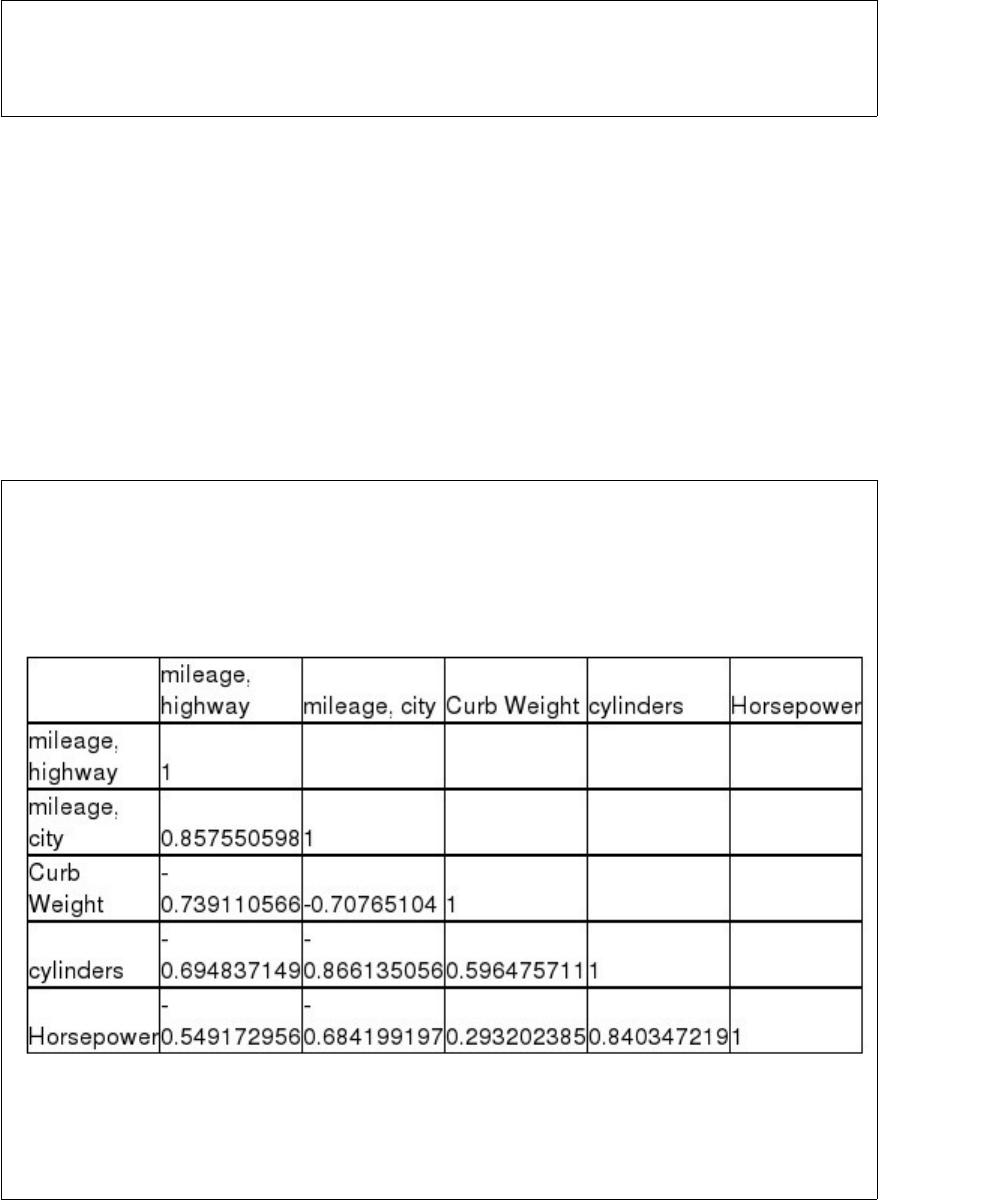
A major car magazine has recently collected data on 30 leading cars in the U.S. market.
It is interested in building a multiple regression model to explain the variation in
highway miles. The following correlation matrix has been computed from the data
collected:
The analysts also produced the following multiple regression output using curb weight,
cylinders, and horsepower as the three independent variables. Note, a number of the
output fields are missing, but can be determined from the information provided.
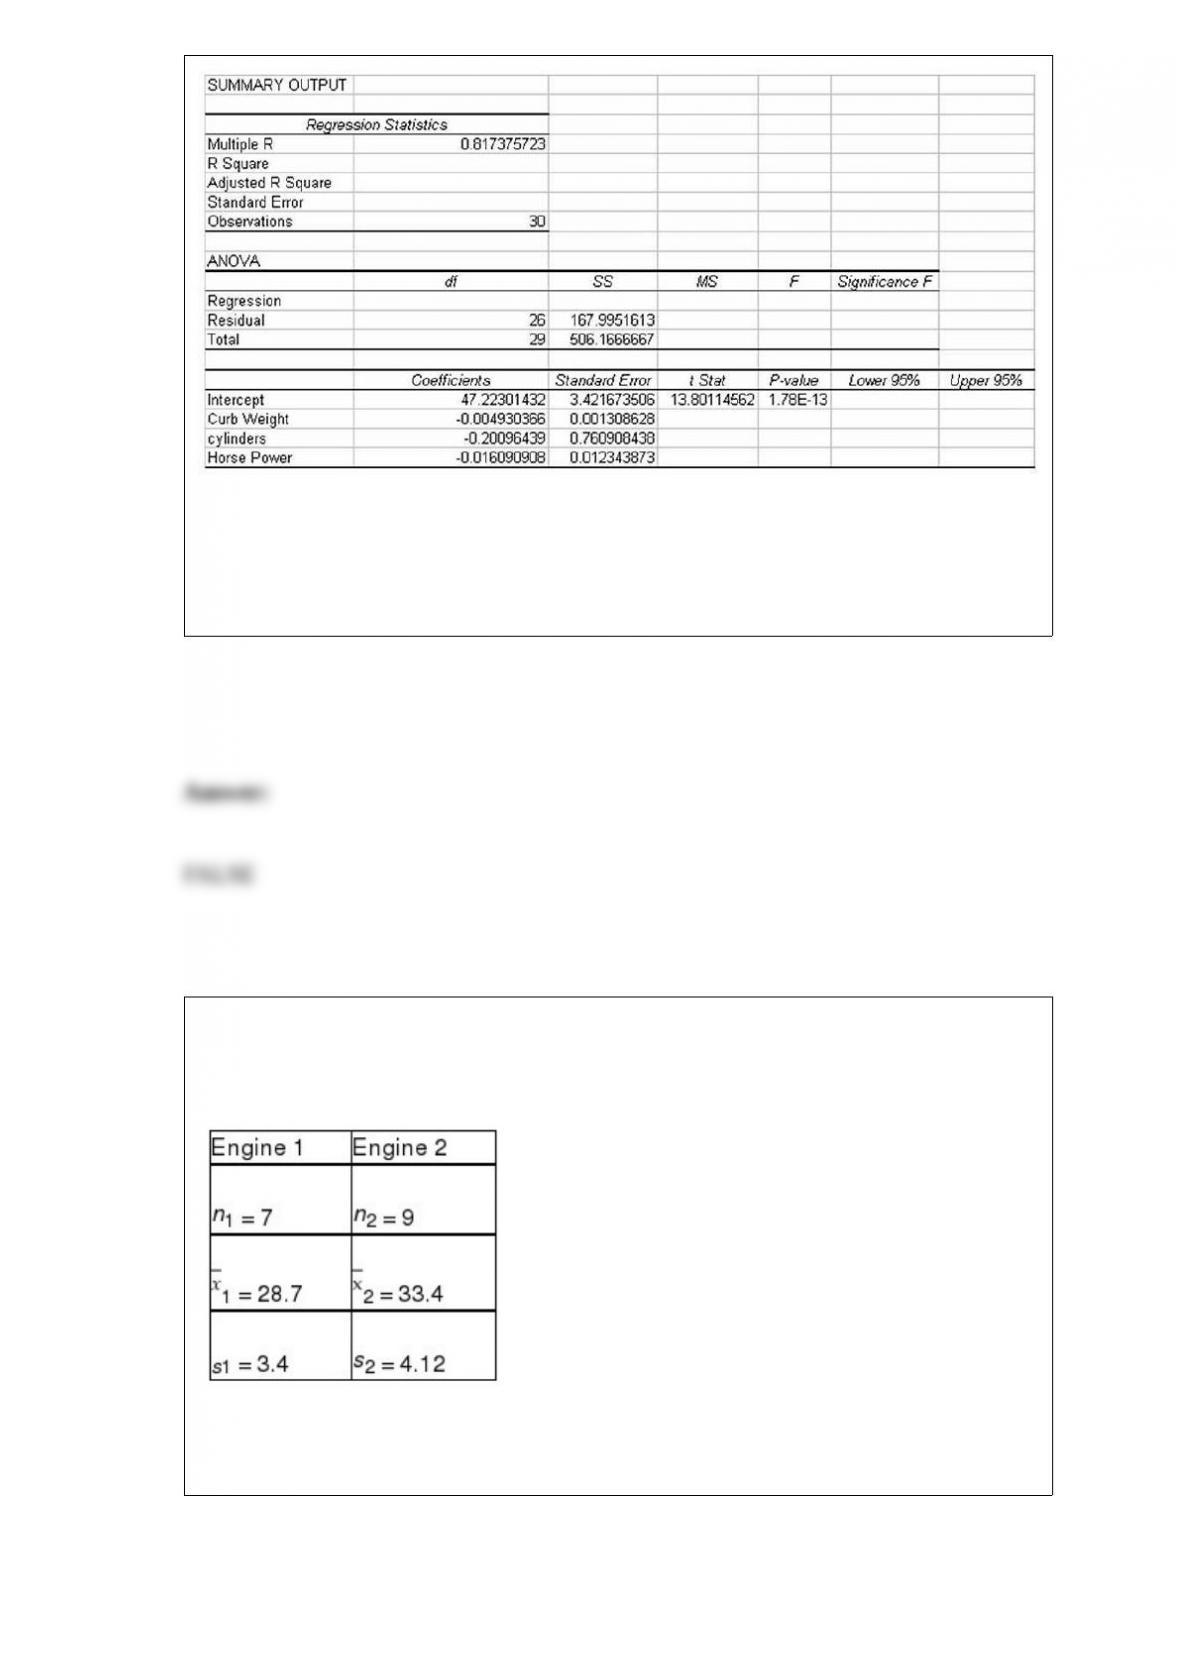
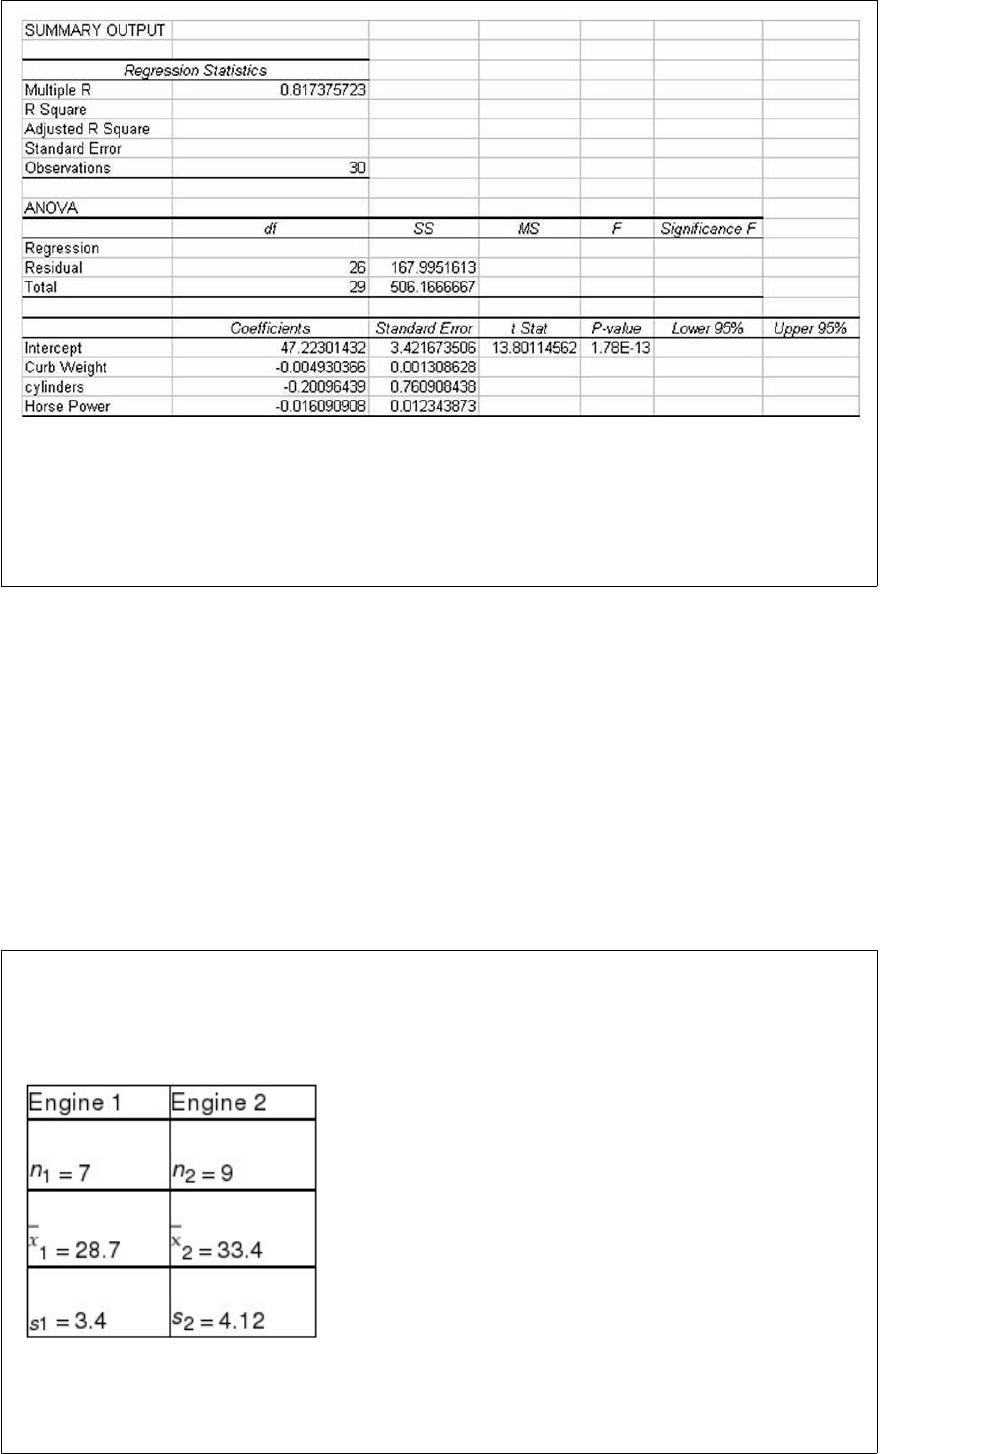
Based on the information provided, using a 0.05 level of statistical significance, both
curb weight and horsepower are statistically significant variables in explaining the
variation in the dependent variable when they are included in the model along with
cylinders.
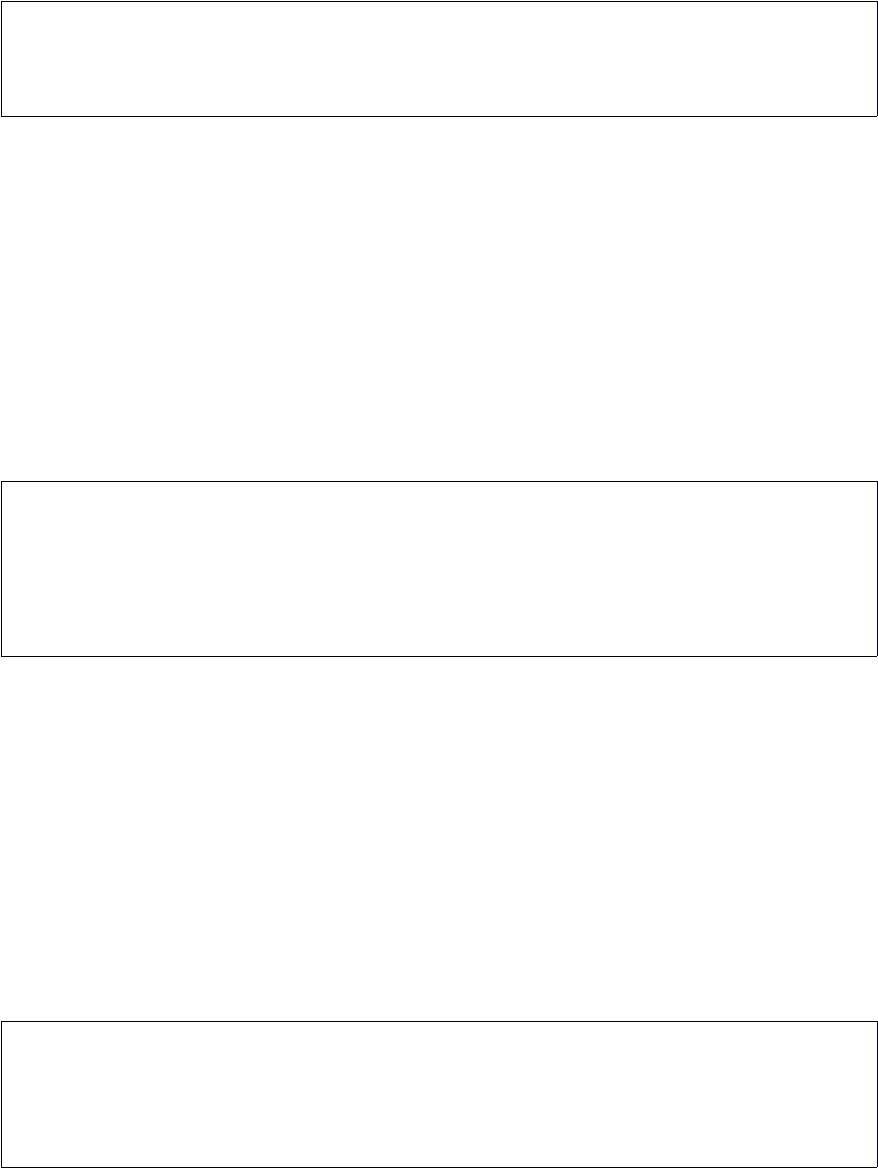
One of the major automobile makers has developed two new engines. At question is
whether the two engines have the same variability with respect to miles per gallon. To
test this using a 0.10 level of significance, the following information is available:
Based on this situation and the information provided, the null hypothesis cannot be
rejected and it is possible that the two engines produce the same variation in mpg.
In analyzing a single quantitative variable, you will generally choose to use a scatter
diagram if the variable is measured over time and a histogram if the variable is
cross-sectional.
The amount of drying time for the paint applied to a plastic component part is thought
to be uniformly distributed between 30 and 60 minutes. Currently, the automated
process selects the part from the drying bin after the part has been there for 50 minutes.
The probability that none of three parts picked are still wet when they are selected is
approximately 0.04.
The Parks and Recreation manager for the city of Detroit recently submitted a report to
the city council in which he indicated that a random sample of 500 park users indicated
that the average number of visits per month was 4.56. This value should be viewed as a
statistic by the city council.
Twenty one (21) customers out of a simple random sample of 50 said that they came to
the grocery store within one month after getting a card from the company. Based on the
data, the marketing manager thinks that the number of total customers who would come
in to the grocery store within one month is 4,200 because 10,000 cards were mailed.
In developing a confidence interval estimate, the margin of error is directly dependent
on the value of the point estimate.
Suppose the mean of dogs a pet shop grooms each day is know to be 14.2 dogs. If a
sample of n = 12 days is chosen and a total of 178 dogs are groomed during those 12
days, then the sampling error is:
A) 163.8.
B) about 0.63.
C) about -0.63.
D) -163.8.
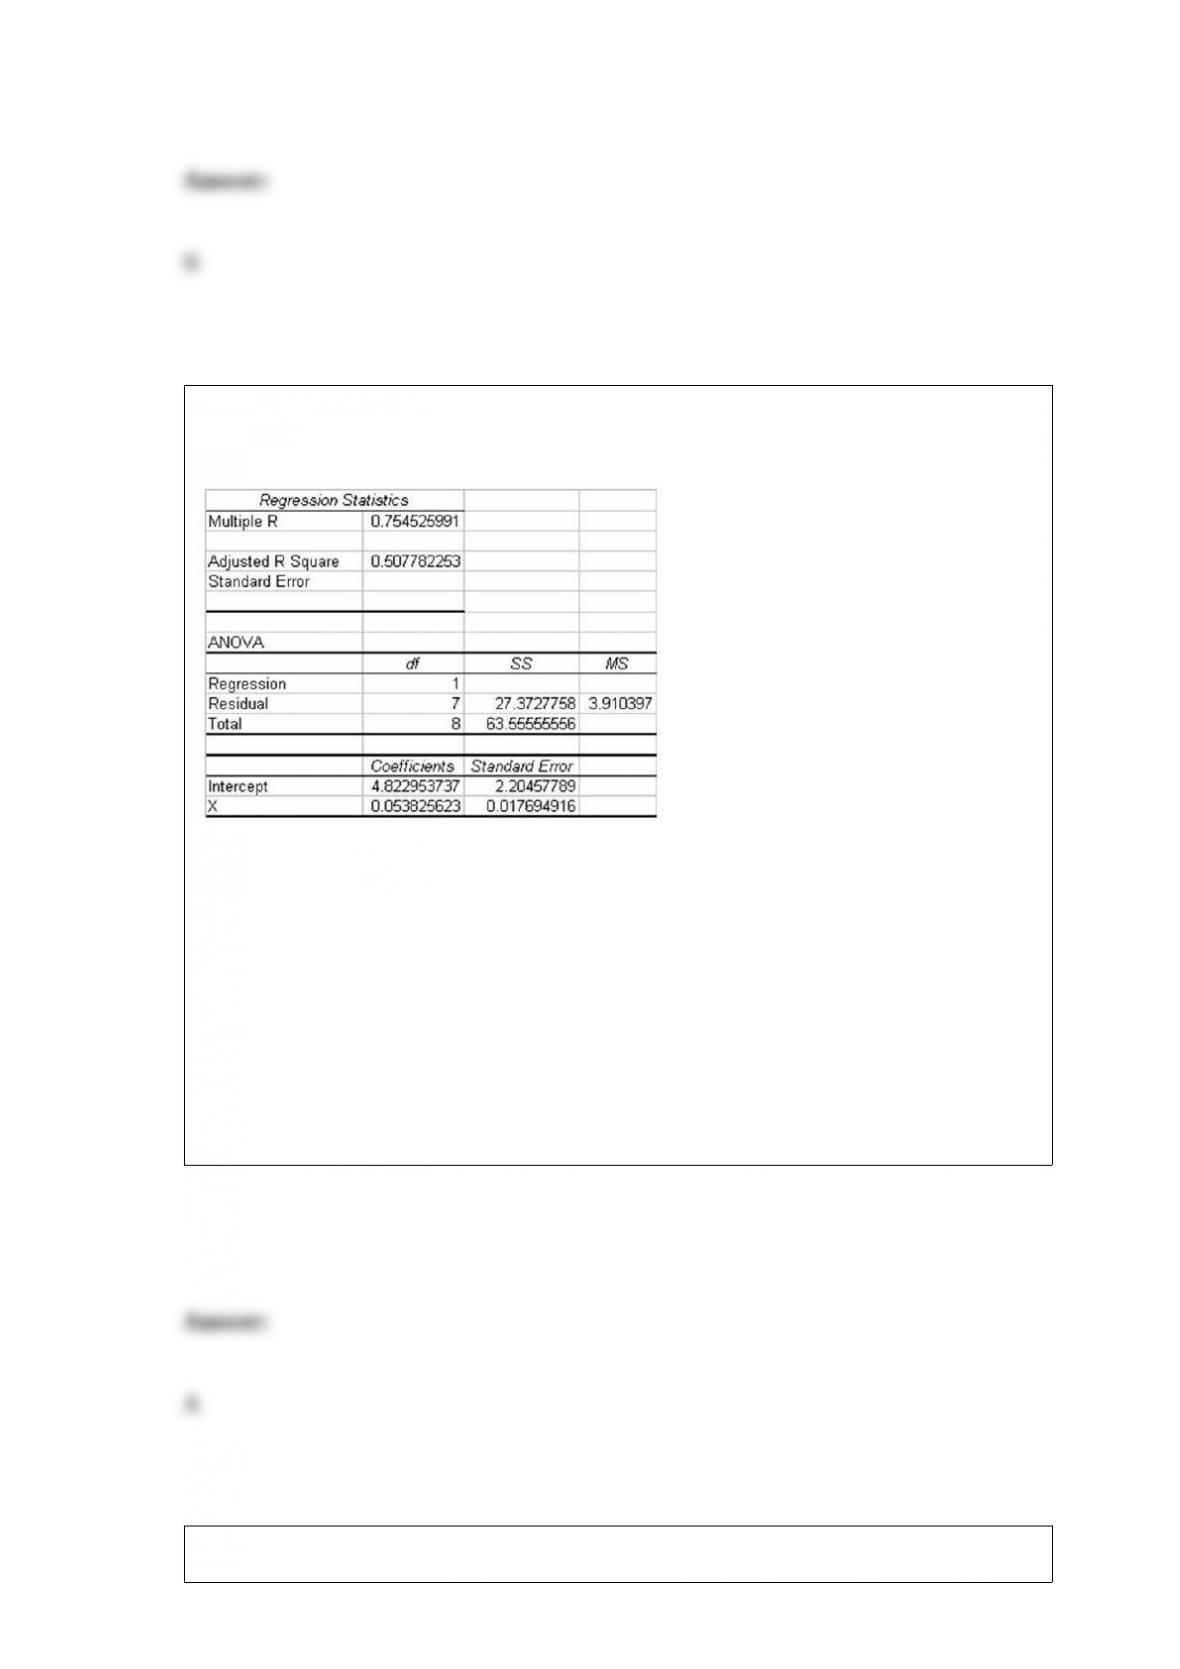
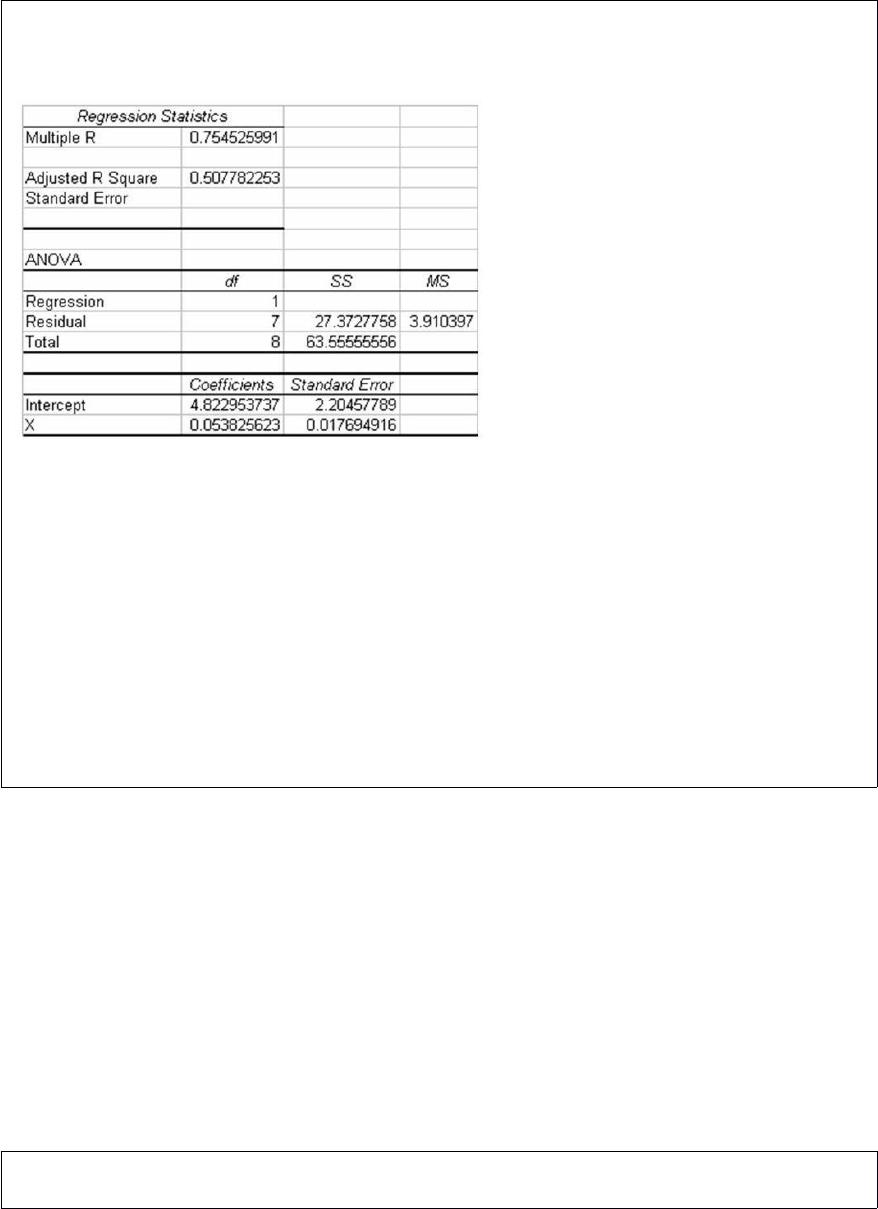
The following regression output is available. Notice that some of the values are
missing.
Given this information, what is the test statistic for testing whether the regression slope
coefficient is equal to zero?
A) Approximately t = 3.04
B) About t = 2.19
C) About t = 9.24
D) About t = 2.39
In order for a one-way analysis of variance to be considered a balanced design, which
of the following must hold?
A) The population variances must be equal.
B) The sample sizes selected from each population must be equal.
C) The study must have the same number of rows as it does columns.
D) All of the above are true.
A company that fills soft drinks into bottles has established an -chart and an R-chart to
monitor the average fill level in the bottles. To do this, the company has taken a series
of samples of size n = 4 bottles. The overall average fill is 12.03 ounces. The average
range for the subgroups has been .06 ounces. Suppose, after developing the control
chart, a subgroup of size 4 yields a sample mean of 12.09 ounces and a range of .08,
which of the following statements is true?
A) The process is in control on both the -chart and the R-chart.
B) The process is out of control on the R-chart but in control on the -chart.
C) The process is out of control on the -chart but in control on the R-chart.
D) The process is out of control on both the -chart and the R-chart.
In conjunction with the housing foreclosure crisis of 2009, many economists expressed
increasing concern about the level of credit card debt and efforts of banks to raise
interest rates on these cards. The banks claimed the increases were justified. A Senate
subcommittee decided to determine if the average credit card balance depends on the
type of credit card used. Under consideration are Visa, MasterCard, Discover, and
American Express. The sample sizes to be used for each level are 25, 25, 26, and 23,
respectively.
State the number of degrees of freedom available for determining the between-samples
variation.
A) 6
B) 5
C) 2
D) 3
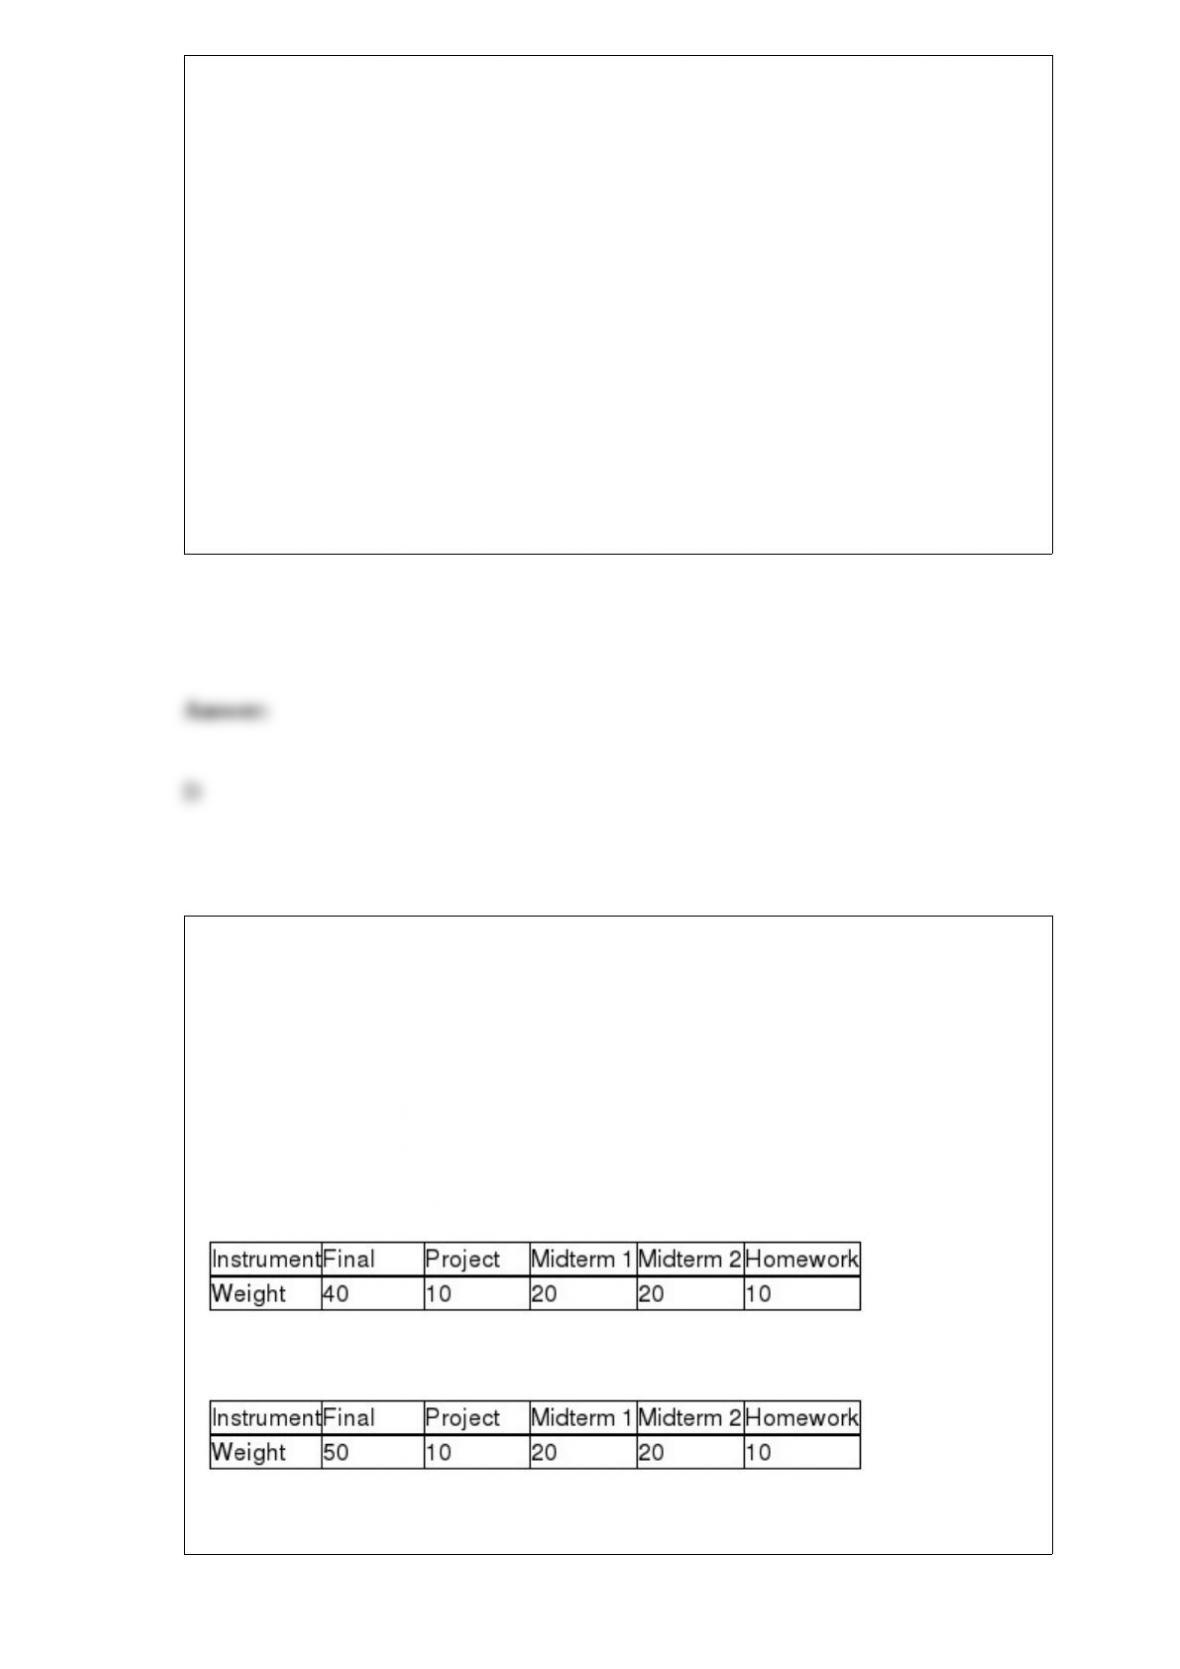
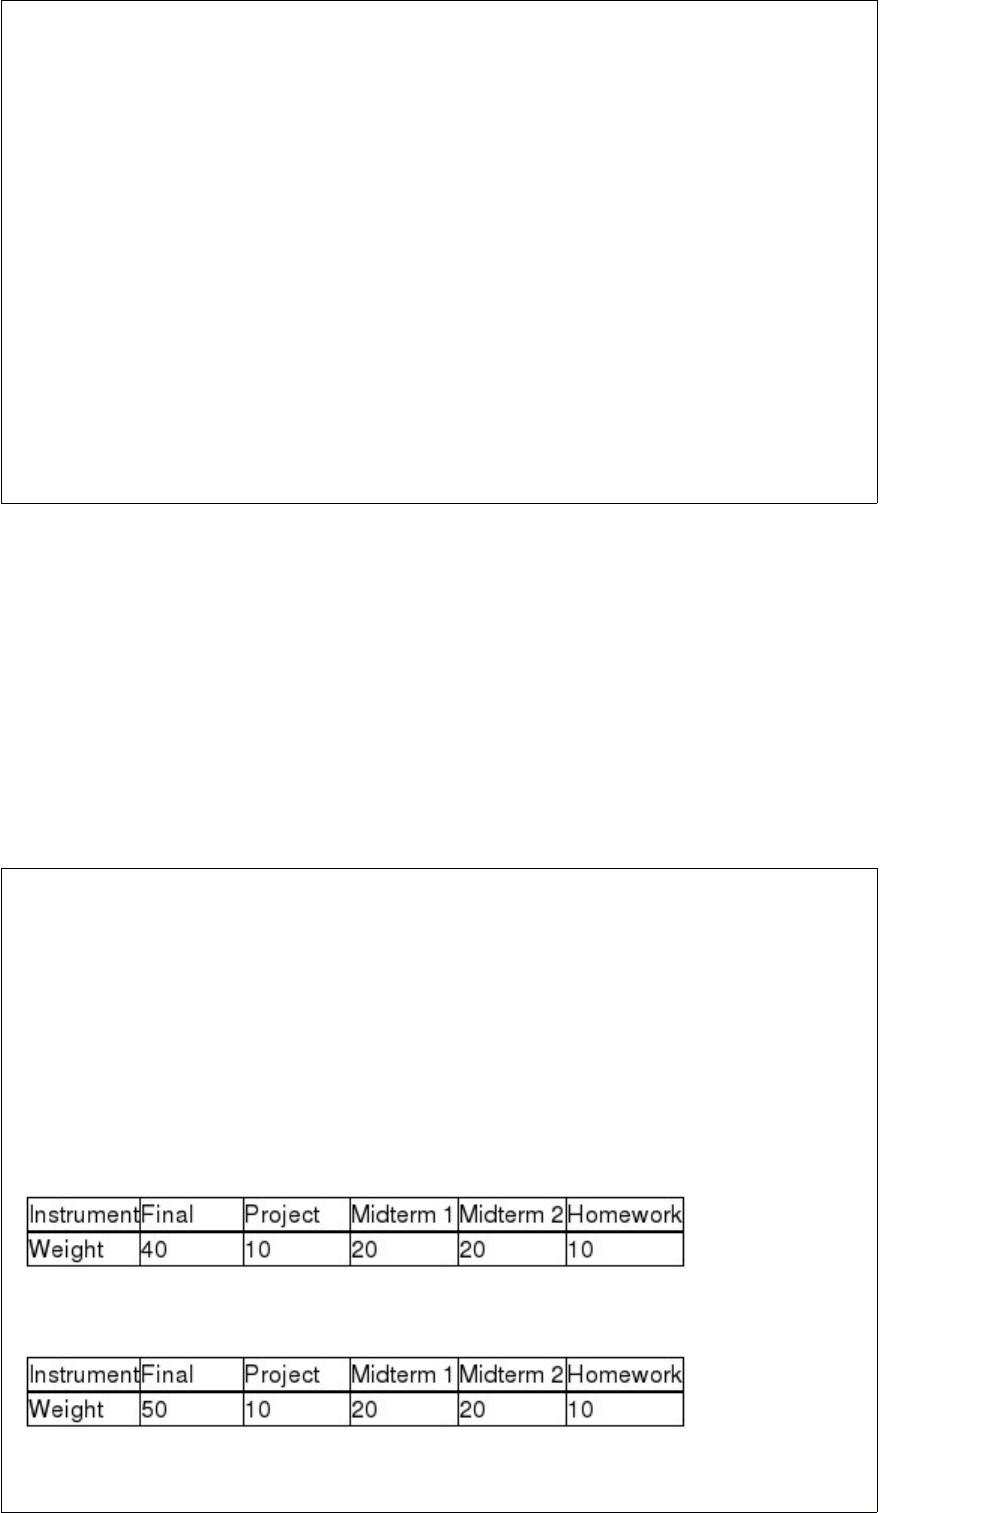
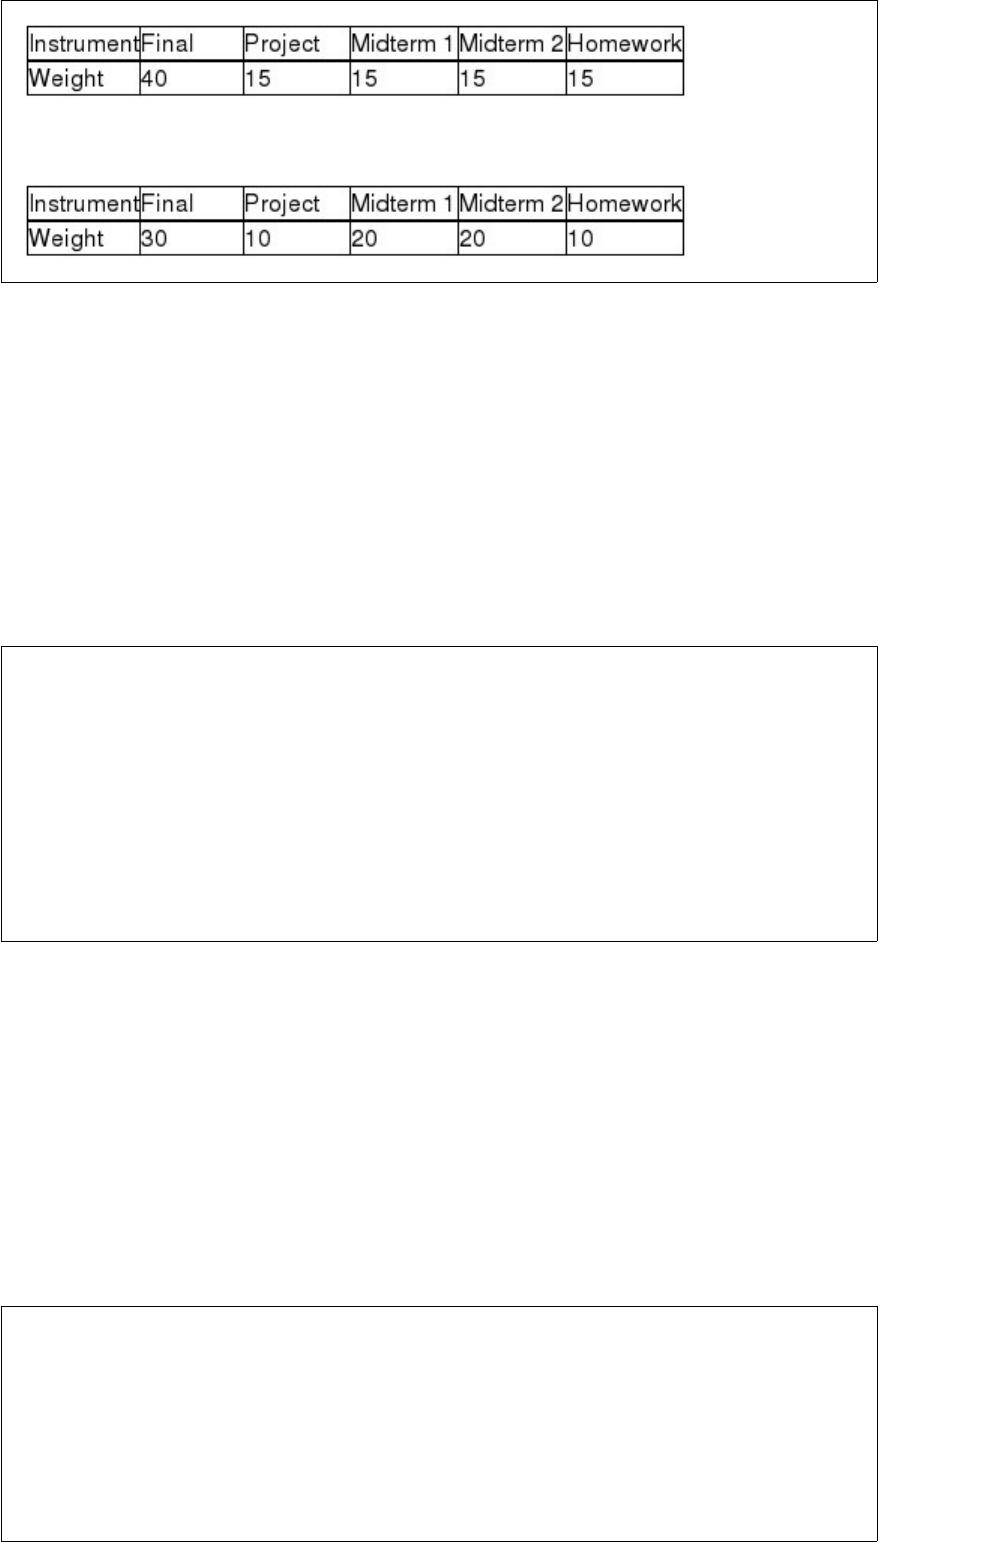
A professor wishes to develop a numerical method for giving grades. He intends to base
the grade on homework, two midterms, a project, and a final examination. He wishes
the final exam to have the largest influence on the grade. He wants the project to have
10%, each midterm to have 20%, and the homework to have 10% of the influence of
the semester grade.
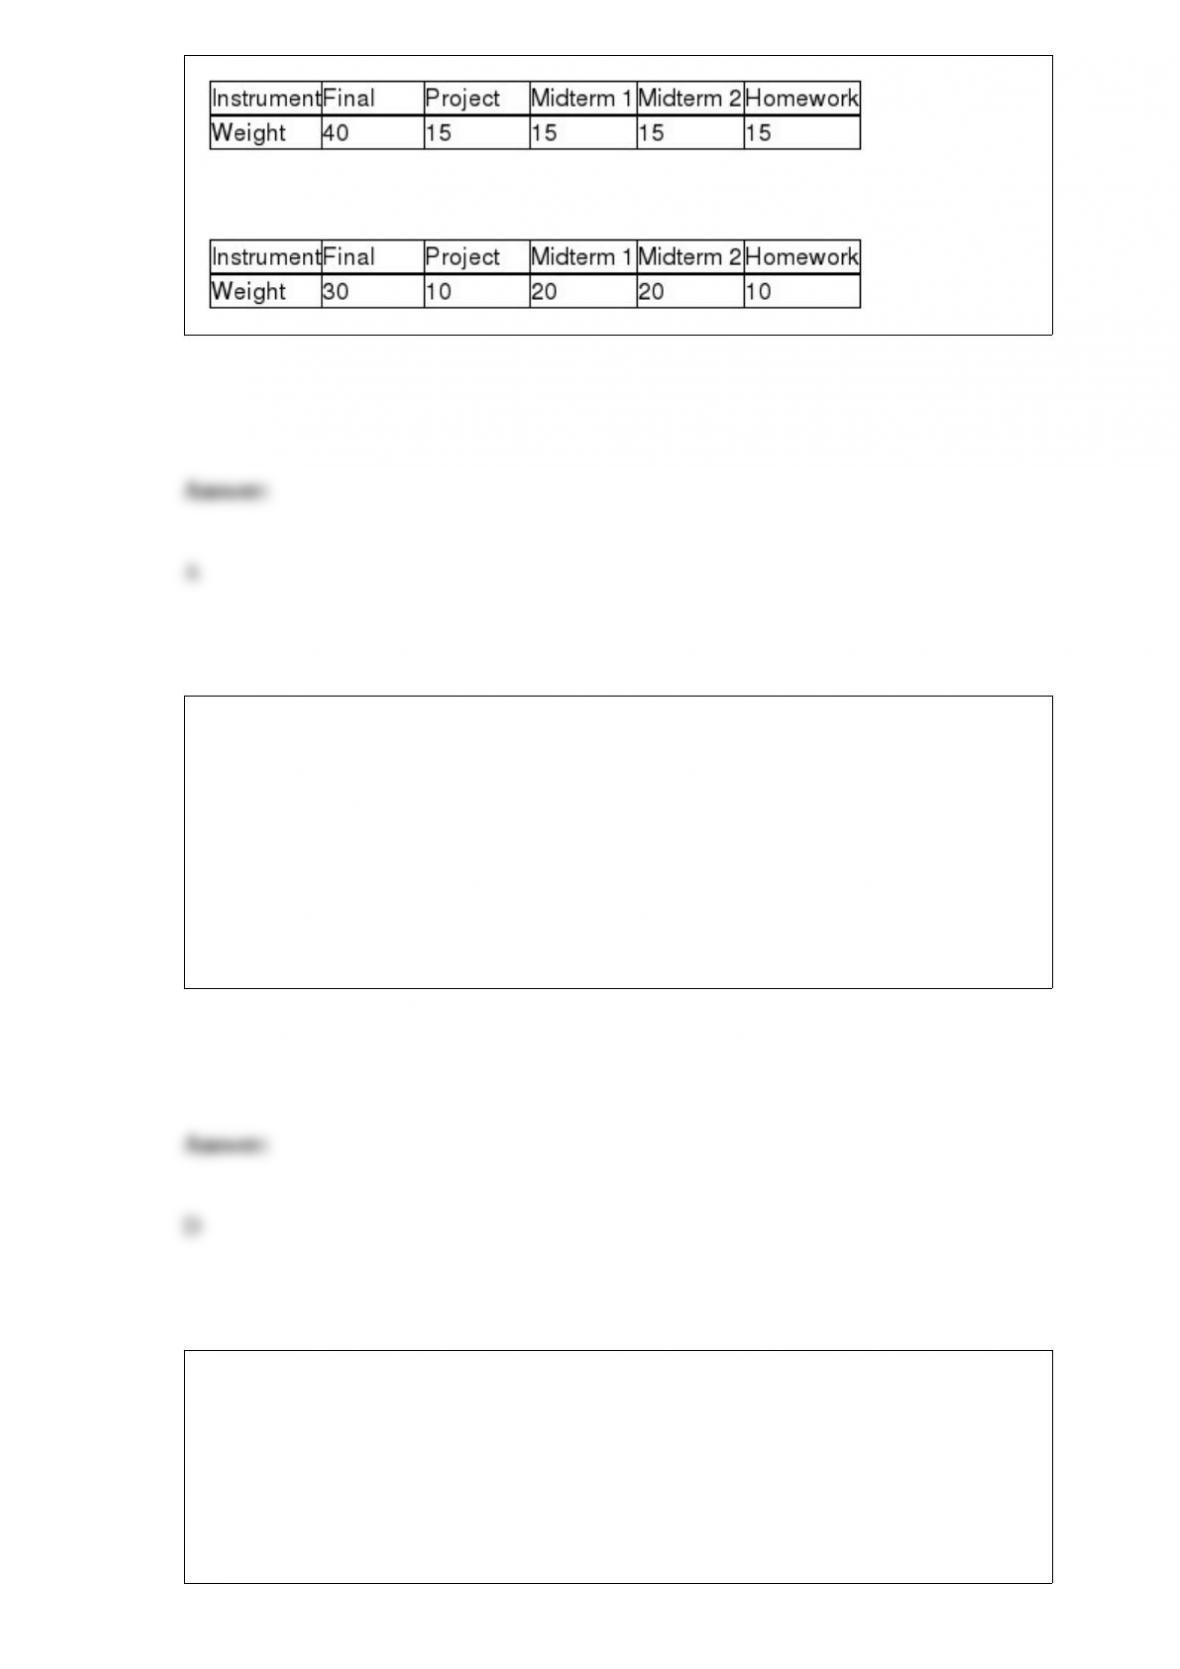
Determine the weights the professor should use to produce a weighted average for
grading purposes.
A)
B)
C)
D)
The Wilcoxon matched-pairs signed rank test assumes that the two samples are:
A) equal in size.
B) independent and random.
C) paired.
D) Both A and C
The asking price for homes on the real estate market in Baltimore has a mean value of
$286,455 and a standard deviation of $11,200. The mean and standard deviation in
asking price for homes in Denver are $188,468 and $8,230, respectively. Recently, one
home sold in each city where the asking price for each home was $193,000. Based on
these data, which of the following conclusions can be made?
A) The two homes have approximately the same standardized values.

B) The distribution of asking prices in the two cities is bell-shaped.
C) The house in Baltimore is relatively farther from the mean than the house in Denver.
D) The asking prices of homes in Denver is less variable than those in Baltimore.
Assume P(A) = 0.6, P(B) = 0.7, and P(A and B) = 0.42, which means that events A and
B are independent of each other.
A mail-order business prides itself in its ability to fill customers’ orders in six calendar
days or less on the average. Periodically, the operations manager selects a random
sample of customer orders and determines the number of days required to fill the
orders. Based on this sample information, he decides if the desired standard is not being
met. He will assume that the average number of days to fill customers’ orders is six or
less unless the data suggest strongly otherwise. On one occasion where a sample of 40
customers was selected, the average number of days was 6.65, with a sample standard
deviation of 1.5 days. Can the operations manager conclude that his mail-order business
is achieving its goal? Use a significance level of 0.025 to answer this question. Conduct
the test using this p-value.
A) Since 0.024 > 0.0041, reject the null hypothesis.
B) Since 0.046 > 0.0025, reject the null hypothesis.
C) Since 0.0046 < 0.025, reject the null hypothesis.
D) Since 0.0024 < 0.041, reject the null hypothesis.
Parts and Materials for the skis made by the Downhill Adventures Company are
supplied by two suppliers. Supplier A’s materials make up 30% of what is used, with
supplier B providing the rest. Past records indicate that 15% of supplier A’s materials
are defective and 10% of B’s are defective. Since it is impossible to tell which supplier
the materials came from once they are in inventory, the manager wants to know which
supplier most likely supplied the defective materials the foreman has brought to his
attention. Provide the manager this information.
A) Supplier A
B) Supplier B
C) Both are equally likely
D) Cannot be determined from this information
An educational organization in California is interested in estimating the mean number
of minutes per day that children between the age of 6 and 18 spend watching television
per day. A previous study showed that the population standard deviation was 21.5
minutes. The organization selected a random sample of n = 200 children between the
age of 6 and 18 and recorded the number of minutes of TV that each person watched on
a particular day. The mean time was 191.3 minutes. If the leaders of the organization
wish to develop an interval estimate with 95 percent confidence, what will the margin
of error be?
A) Approximately 1.52 minutes
B) About 2.98 minutes
C) z = 1.96
D) Approximately 42.14 minutes
In a one-way design, which of the following is true?
A) The populations must have equal means.
B) The sample sizes must be equal.
C) The mean squares between will be larger than the mean squares within if the null
hypothesis is rejected.
D) The sample sizes must all differ.
Which of the following CANNOT be shown effectively with a histogram?
A) A frequency distribution
B) A joint frequency distribution
C) A relative frequency distribution
D) The center, shape and spread of a distribution
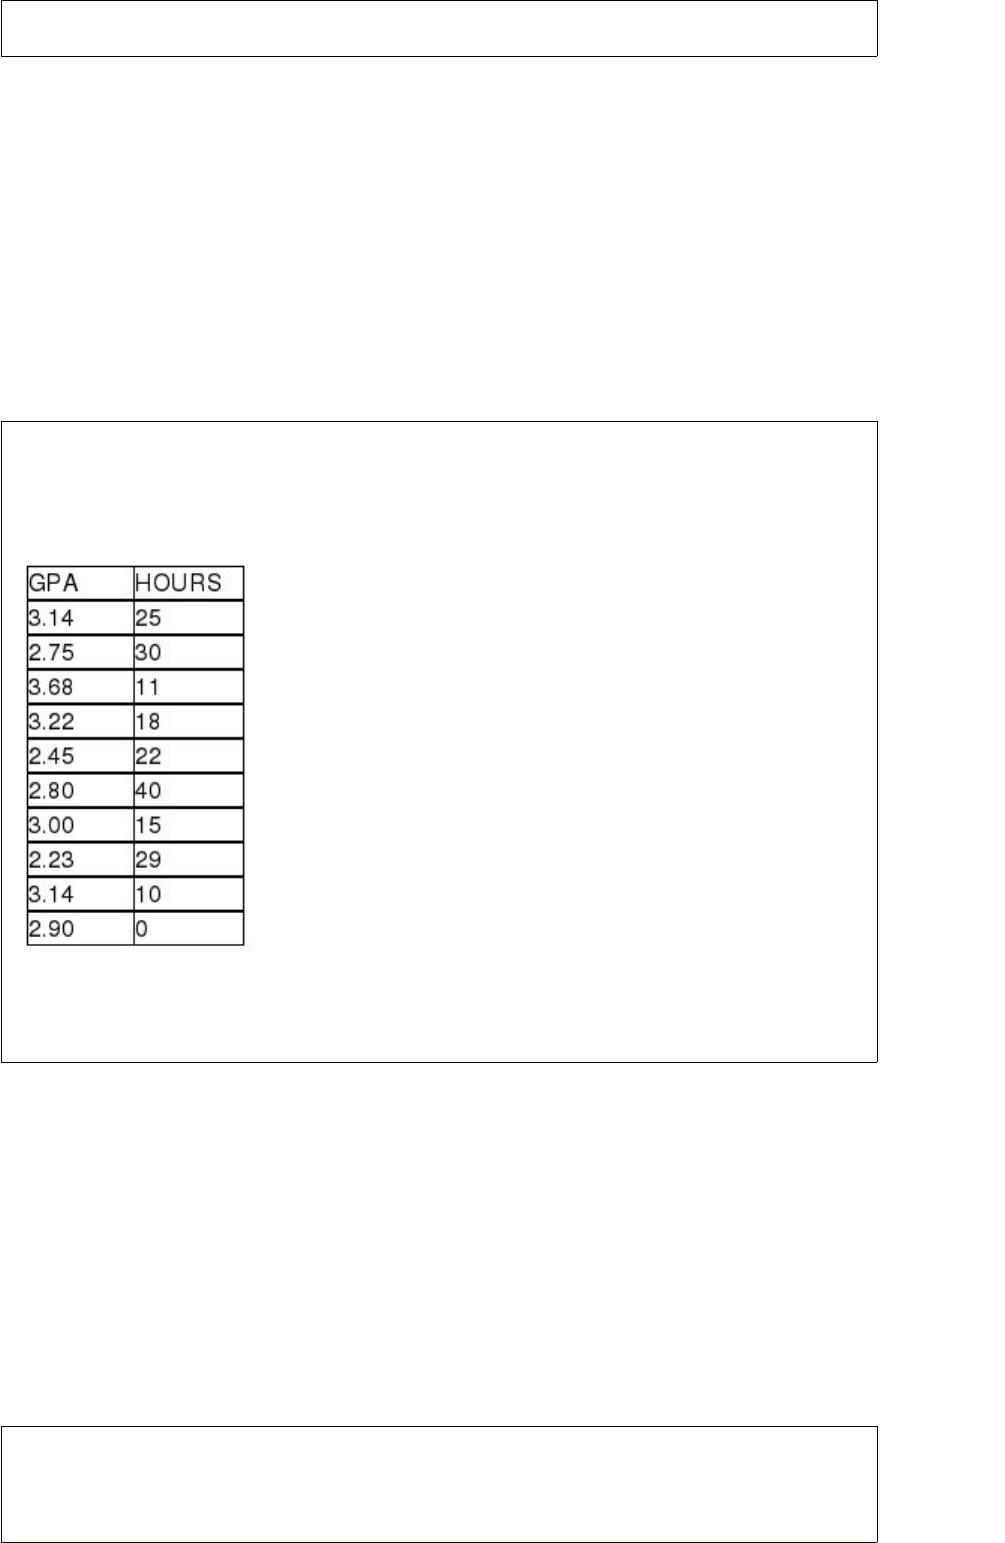
State University recently randomly sampled seven students and analyzed grade point
average (GPA) and number of hours worked off-campus per week. The following data
were observed:
In testing the significance of the regression slope coefficient for the independent
variable, HOURS, the calculated test statistic is approximately t = -1.47.
Dynamic random-access memory (DRAM) memory chips are made from silicon wafers
in manufacturing facilities through a very complex process called wafer fabs. The
wafers are routed through the fab machines in an order that is referred to as a recipe.
The wafers may go through the same machine several times as the chip is created. The
data file DRAM Chips contains a sample of processing times, measured in fractions of
hours, at a particular machine center for one chip recipe.
Compute the mean processing time.
A) 0.24 minutes
B) 0.22 minutes
C) 0.31 minutes
D) 0.33 minutes
The J.R. Simplot Company produces frozen French fries that are then sold to customers
such as McDonald’s. The “prime” line of fries has an average length of 6.00 inches with
a standard deviation of 0.50 inch. To make sure that Simplot continues to meet the
quality standard for “prime” fries, they plan to select a random sample of n = 100 fries
each day. Yesterday, the sample mean was 6.05 inches. What is the probability that the
mean would be 6.05 inches or more if they are meeting the quality standards?
A) 0.2350
B) 0.3413
C) 0.9413
D) 0.1587
A consumer products company wants to interview customers regarding a new product.
If it wishes to adhere to a predetermined pattern of questions in the interview, which of
the following would likely be used?
A) Structured interview
B) Open-end questioning
C) Unstructured interview
D) Written questionnaire
The human resources department at a major high tech company recently conducted an
employee satisfaction survey of 100 of its 3,000 employees. Data were collected on
such variables as age, gender, marital status, current salary, level of overall satisfaction
on a scale from 1 to 5, number of years with the company, and job title. Which of the
variables would be considered to be qualitative data?
A) Gender, marital status, job satisfaction, and job title
B) Age
C) Years with the company
D) All variables listed are qualitative.
If you were going to develop a scatter plot for the purpose of determining whether one
of the assumptions of the regression model is being satisfied, which of the following is
true?
A) The plot should illustrate a bell-shaped distribution to show that the residuals are
normally distributed.
B) The horizontal axis should show the fitted values for the dependent variable.
C) The plot should illustrate a cone shaped look.
D) The points should fall in a straight line.
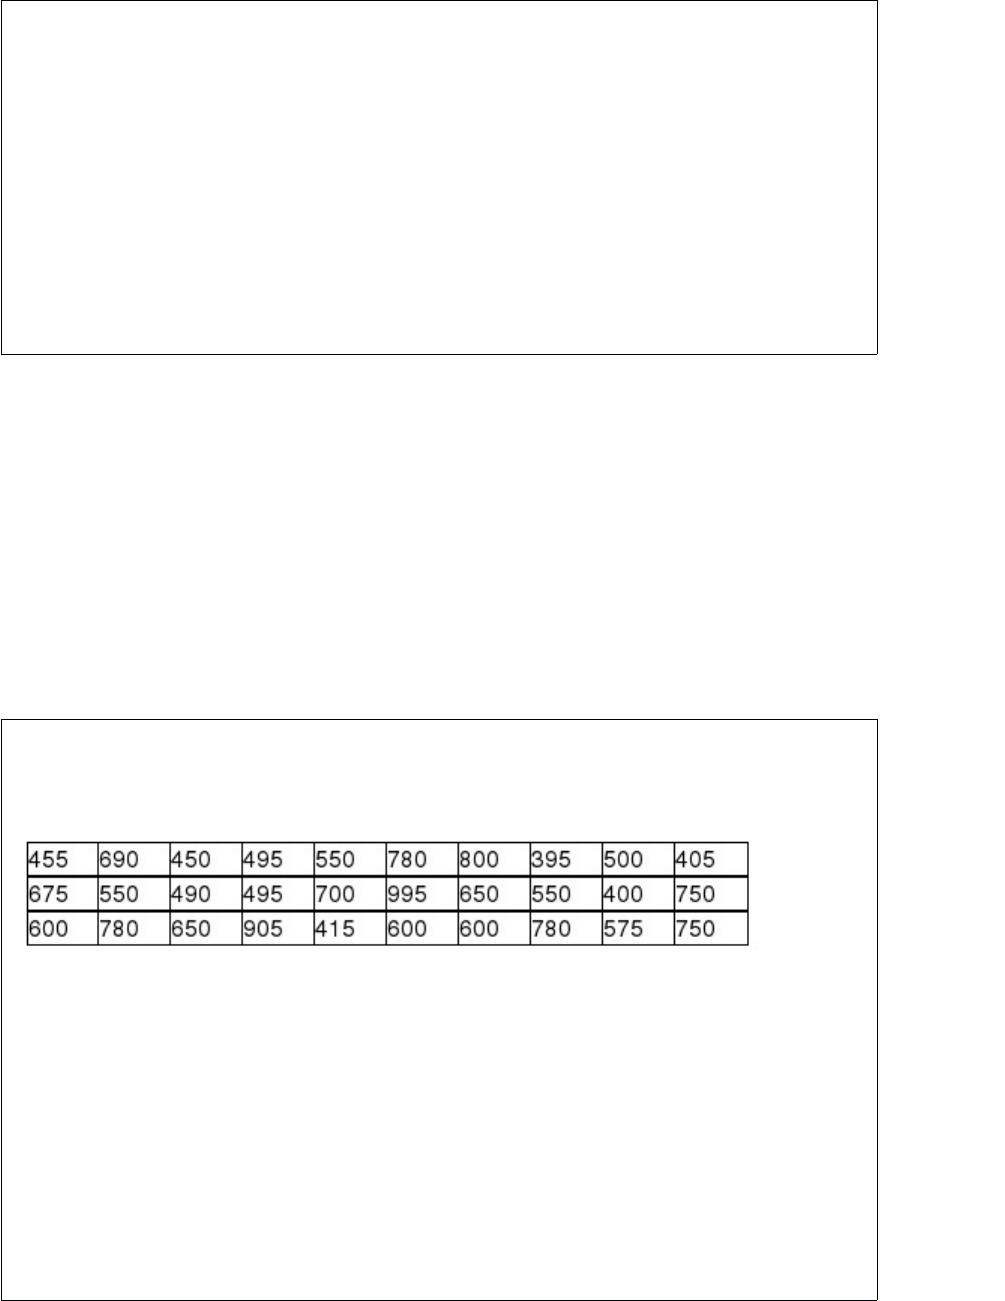
Hillman Management Services manages apartment complexes in Tulsa, Oklahoma.
They currently have 30 units available for rent. The monthly rental prices (in dollars)
for this population of 30 units are:
What is the range of possible sampling error if a random sample of sizen = 6 is selected
from the population?
A) -194.33 to 225.67
B) -245.23 to 271.86
C) -184.15 to 215.61
D) -172.52 to 234.04
According to CNN business partner Careerbuilder.com, the average starting salary for
accounting graduates in 2008 was at least $47,413. Suppose that the American Society
for Certified Public Accountants planned to test this claim by randomly sampling 200
accountants who graduated in 2008.
Compute the power of the hypothesis test to reject the null hypothesis if the true
average starting salary is only $47,000. Assume that the population standard deviation
is known to be $4,600 and the test is to be conducted using an alpha level equal to 0.01.
A) 0.0872
B) 0.1323
C) 0.8554
D) 0.9812
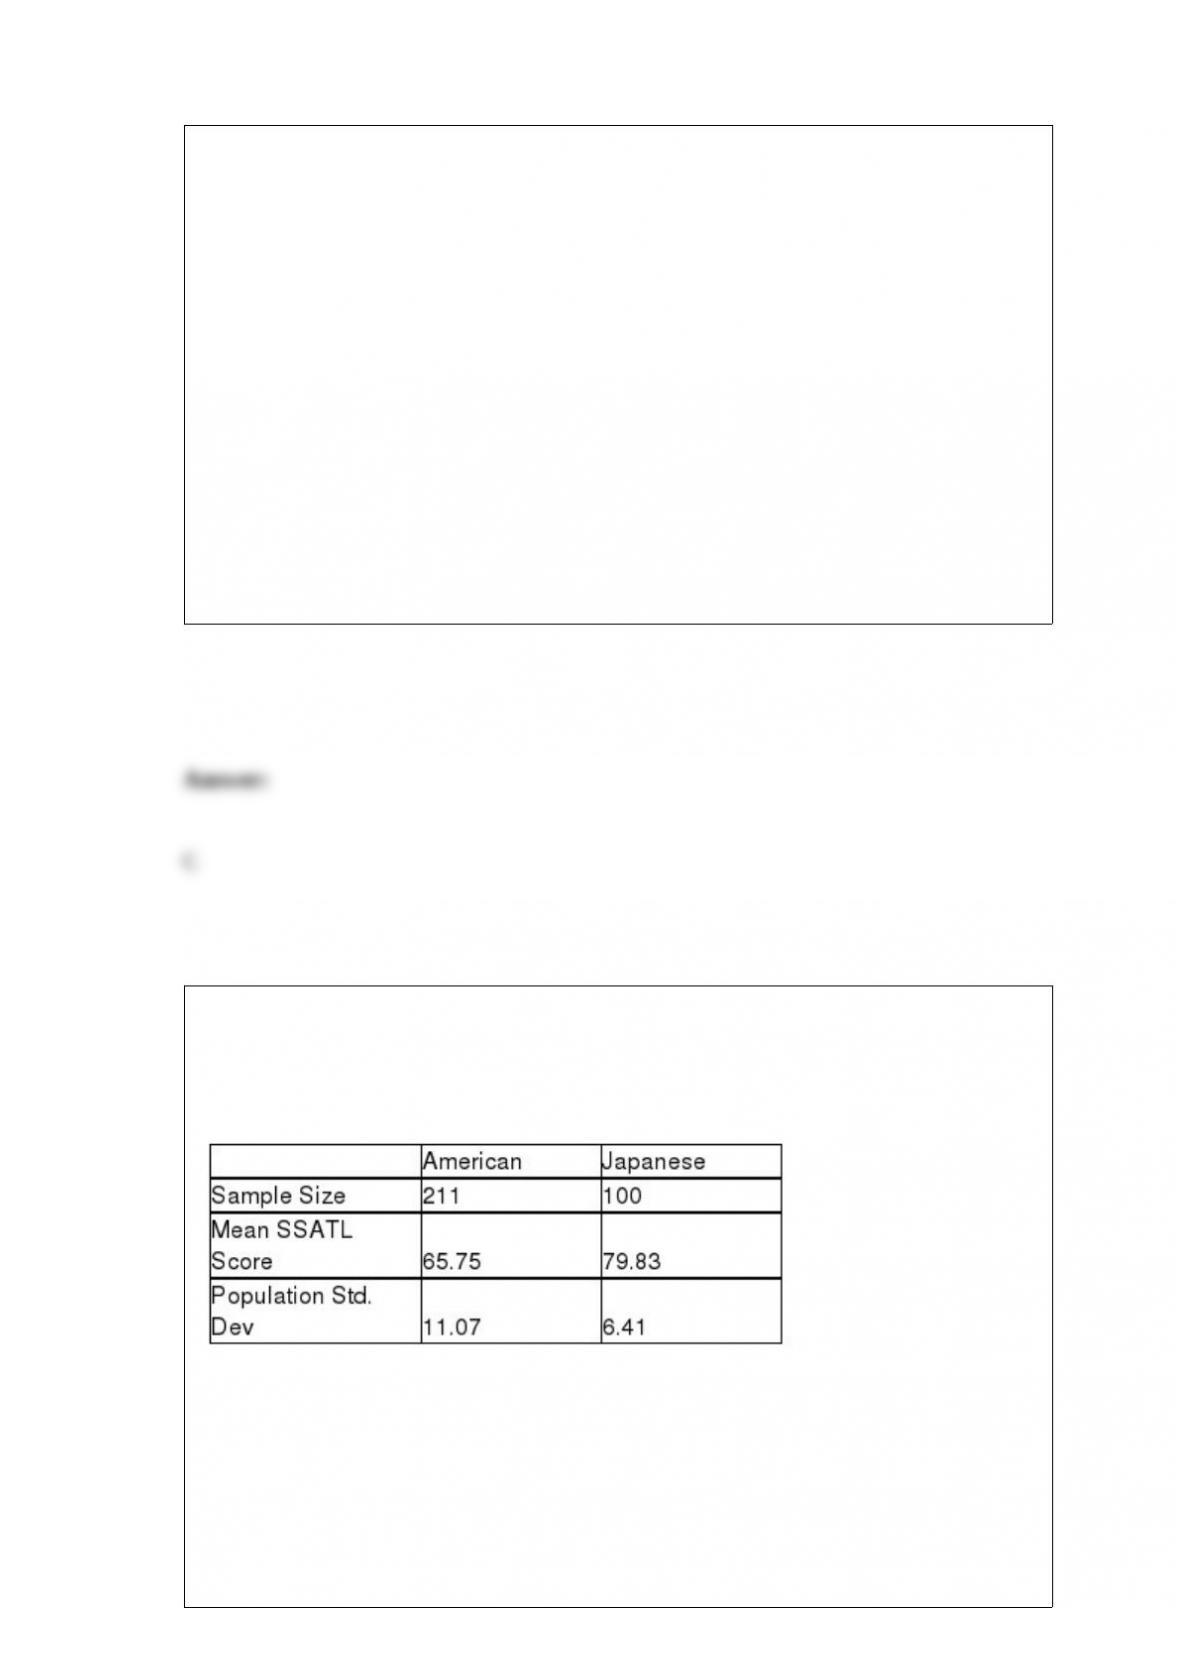
A recent study posed the question about whether Japanese managers are more
motivated than American managers. A randomly selected sample of each was
administered the Sarnoff Survey of Attitudes Toward Life (SSATL), which measures
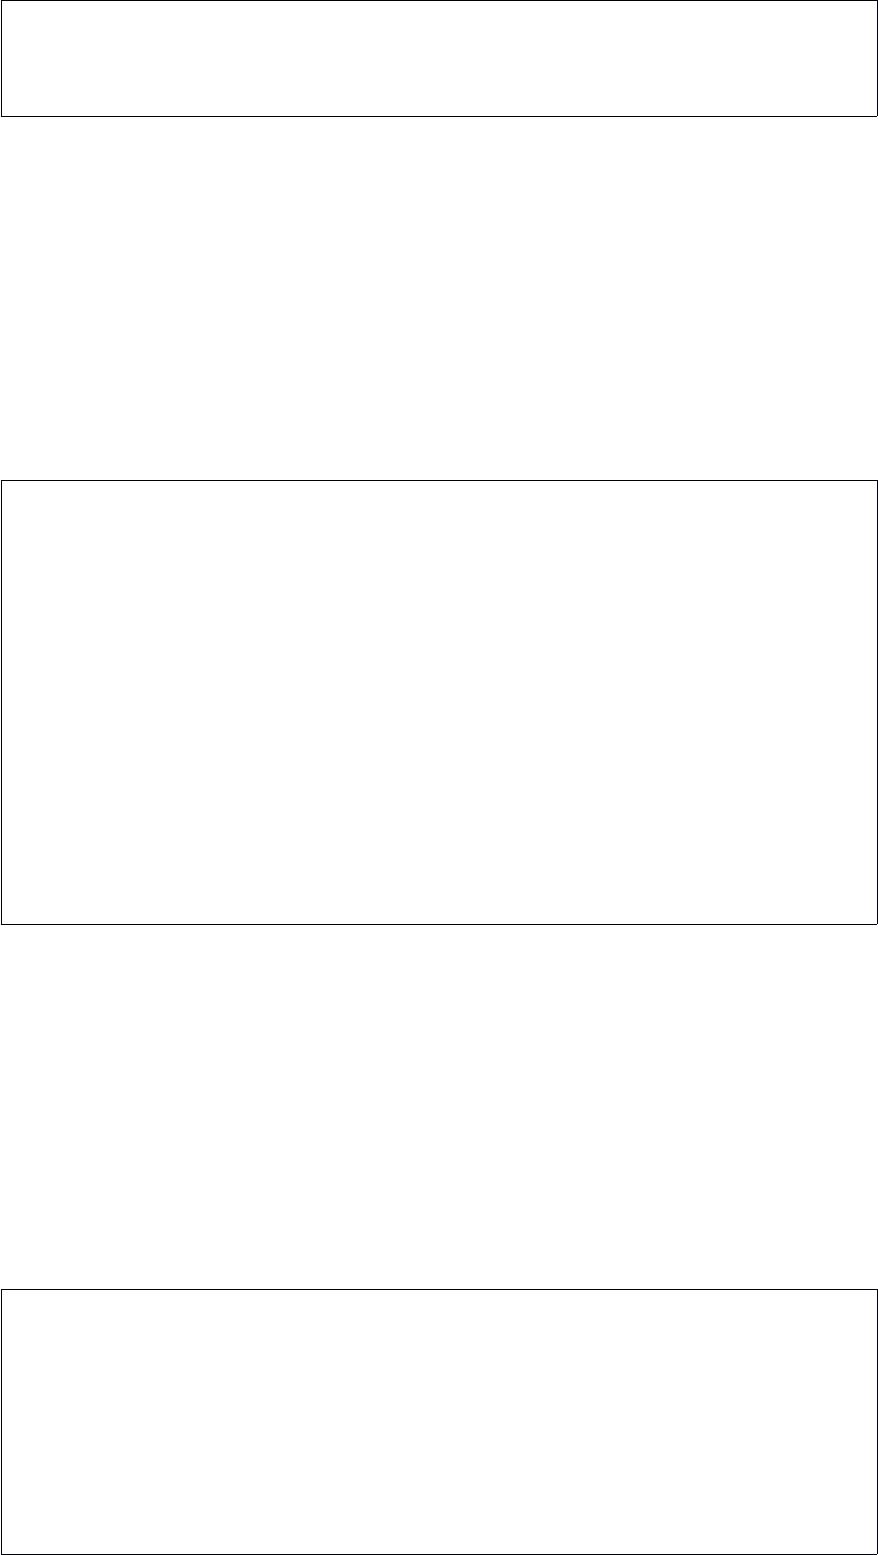
motivation for upward mobility. The SSATL scores are summarized below.
Judging from the way the data were collected, which test would likely be most
appropriate?
A) Related samples t-test for mean difference
B) Pooled-variance t-test for the difference in means
C) Independent samples Z-test for the difference in means
D) Related samples Z-test for mean difference
A decision maker is considering including two additional variables into a regression
model that has as the dependent variable, Total Sales. The first additional variable is the
region of the country (North, South, East, or West) in which the company is located.
The second variable is the type of business (Manufacturing, Financial, Information
Services, or Other). Given this, how many additional variables will be incorporated into
the model?
A) 2
B) 6
C) 8
D) 9
In forming the classes for a frequency distribution and histogram, suppose there were a
number of empty classes. You should:
A) increase the class width.
B) decrease the class width.
C) keep the current class width.
D) use an ogive instead.
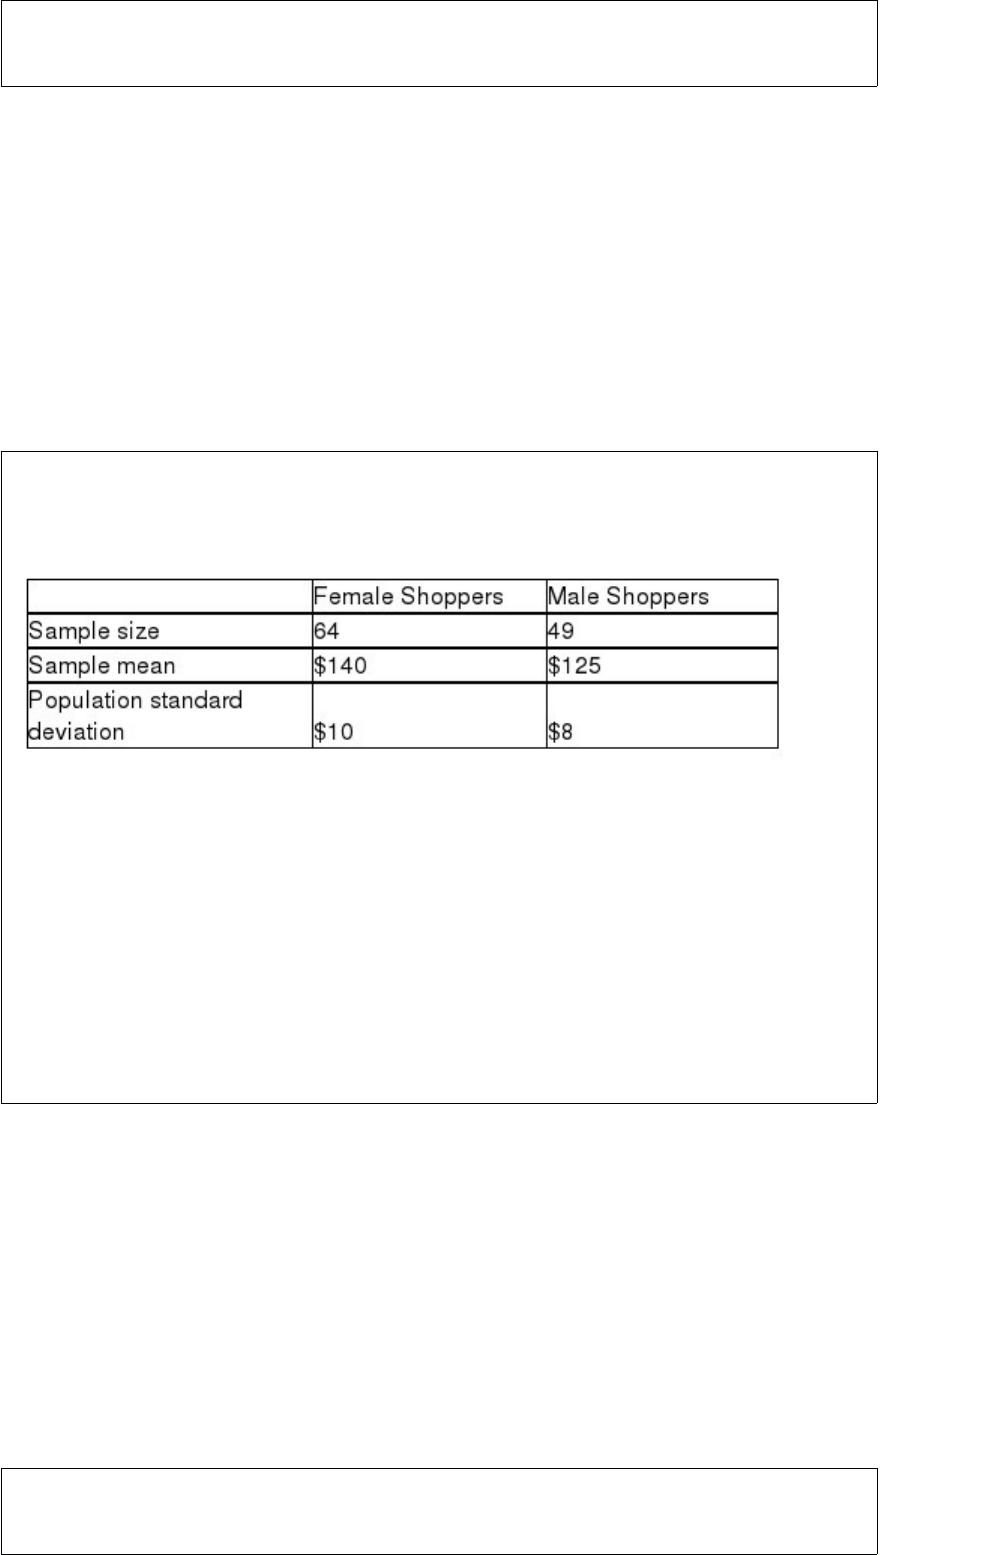
The management of a department store is interested to estimate the difference in the
amount of money spent by female and male shoppers. You are given the following
information.
A 95 percent confidence interval estimate for the difference between the average
purchases of the customers using the two different credit cards is:
A) 49 to 64
B) 11.68 to 18.32
C) 125 to 140
D) 8 to 10
At the end of the school term, students are asked to rate the course and instructor by
indicating on a scale of 1-5 how well they liked the course. The data generated from
this question are examples of ordinal data.
A company that makes shampoo wants to test whether the average amount of shampoo
per bottle is 16 ounces. The standard deviation is known to be 0.20 ounces. Assuming
that the hypothesis test is to be performed using 0.10 level of significance and a random
sample of n = 64 bottles, which of the following would be the upper tail critical value?
A) 1.28
B) 1.645
C) 1.96
D) 2.575
A study was recently conducted at a major university to determine whether there is a
difference in the proportion of business school graduates who go on to graduate school
within five years after graduation and the proportion of non-business school graduates
who attend graduate school. A random sample of 400 business school graduates showed
that 75 had gone to graduate school while in a random sample of 500 non-business
graduates, 137 had gone on to graduate school. Based on these sample data, and testing
at the 0.10 level of significance, what is the value of the test statistic?
A) Approximately z = 1.645
B) About z = -3.04
C) Approximately z = 3.45
D) About z = 1.96
The J.R. Simplot Company produces frozen French fries that are then sold to customers
such as McDonald’s. The “prime” line of fries has an average length of 6.00 inches with
a standard deviation of 0.50 inch. To make sure that Simplot continues to meet the
quality standard for “prime” fries, they plan to select a random sample of n = 100 fries
each day. The quality analysts will compute the mean length for the sample. They want
to establish limits on either side of the 6.00 inch mean so that the chance of the sample
mean falling within the limits is 0.99. What should these limits be?
A) Approximately 0.13 inches
B) Within the approximate range of 5.87 inches to 6.13 inches
C) Within the range of about 4.71 inches to 7.29 inches
D) Approximately 1.29 inches
The roll of a pair of dice has the following probability distribution, where the random
variable is the sum of the values produced by each die:
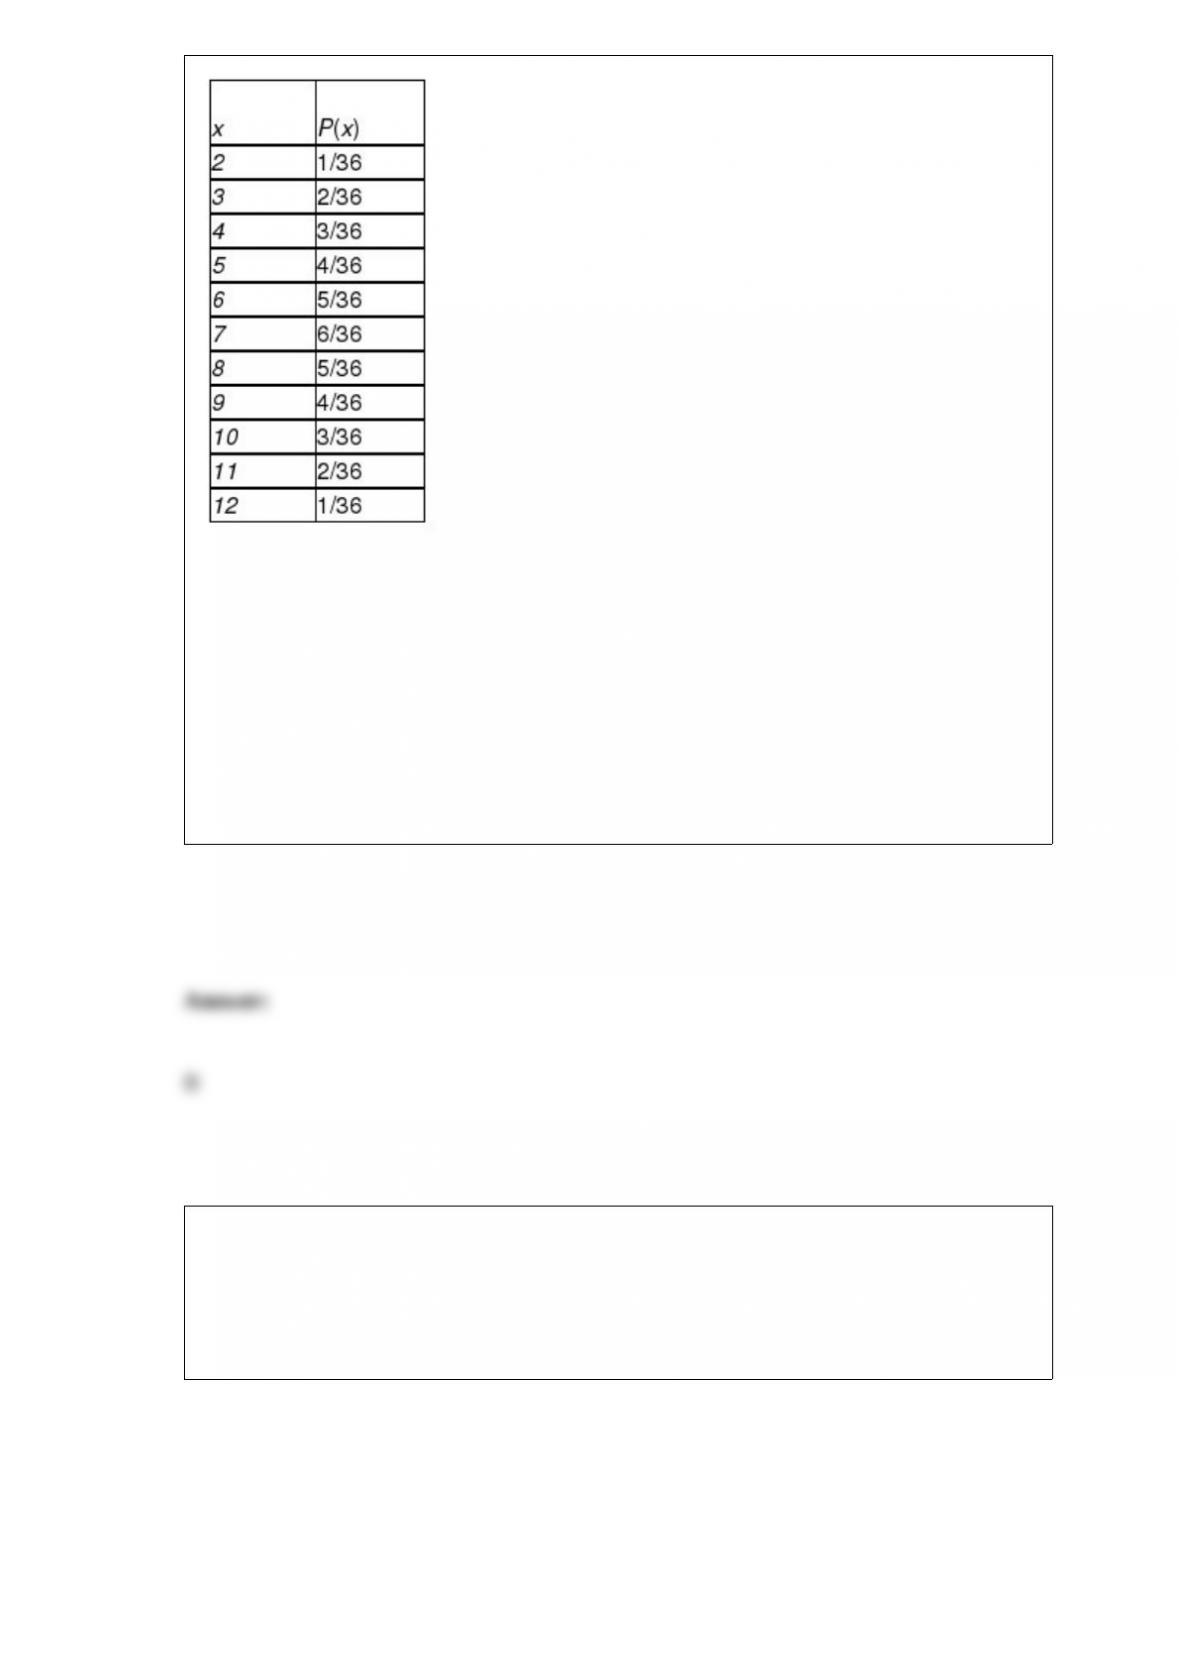
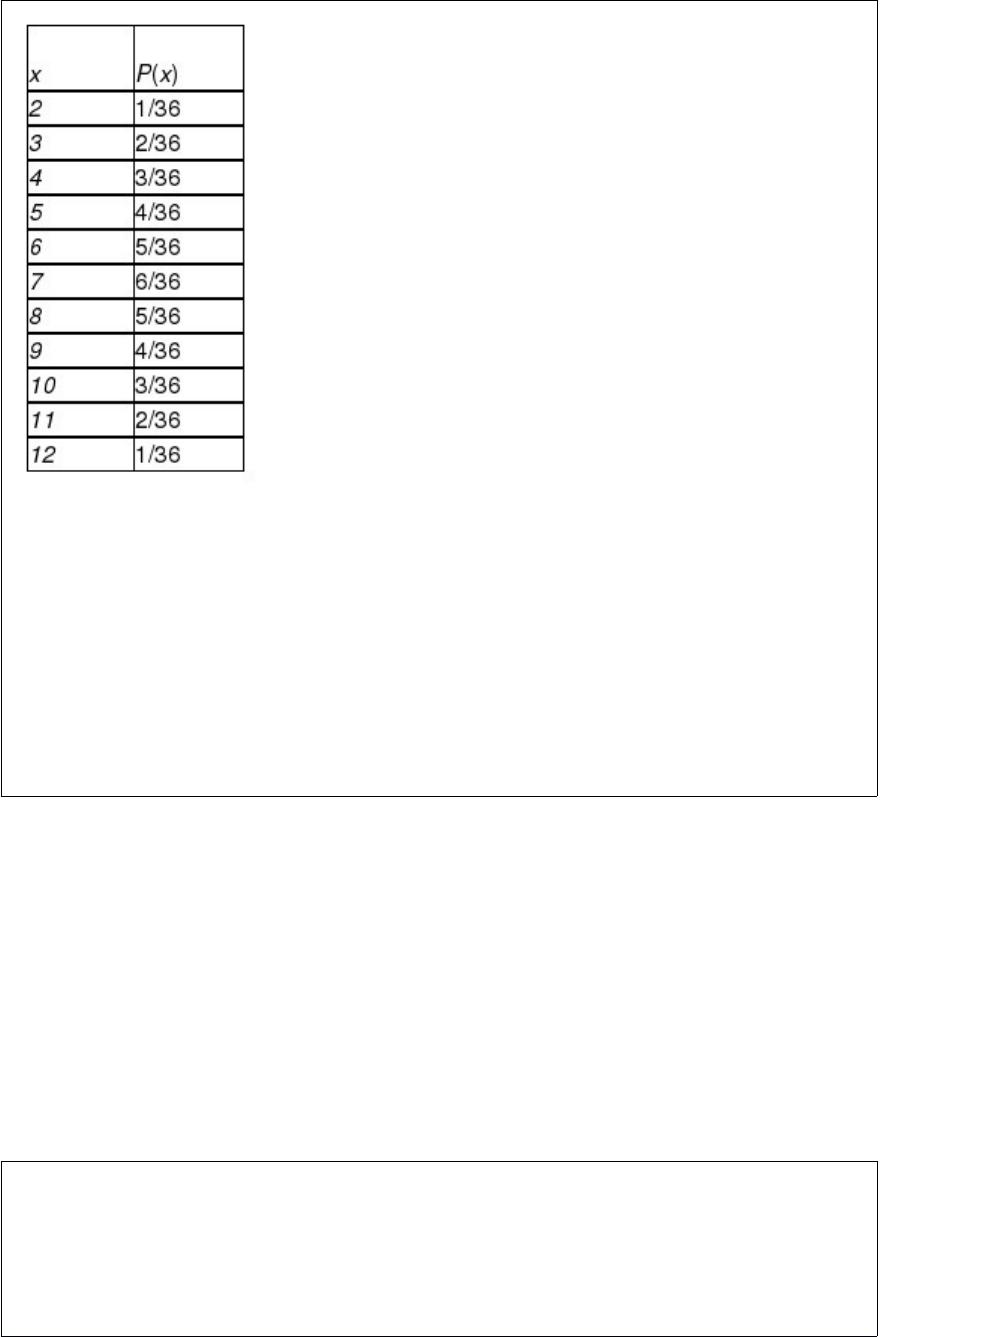
Calculate the expected value of x.
A) 6
B) 7
C) 8
D) 9
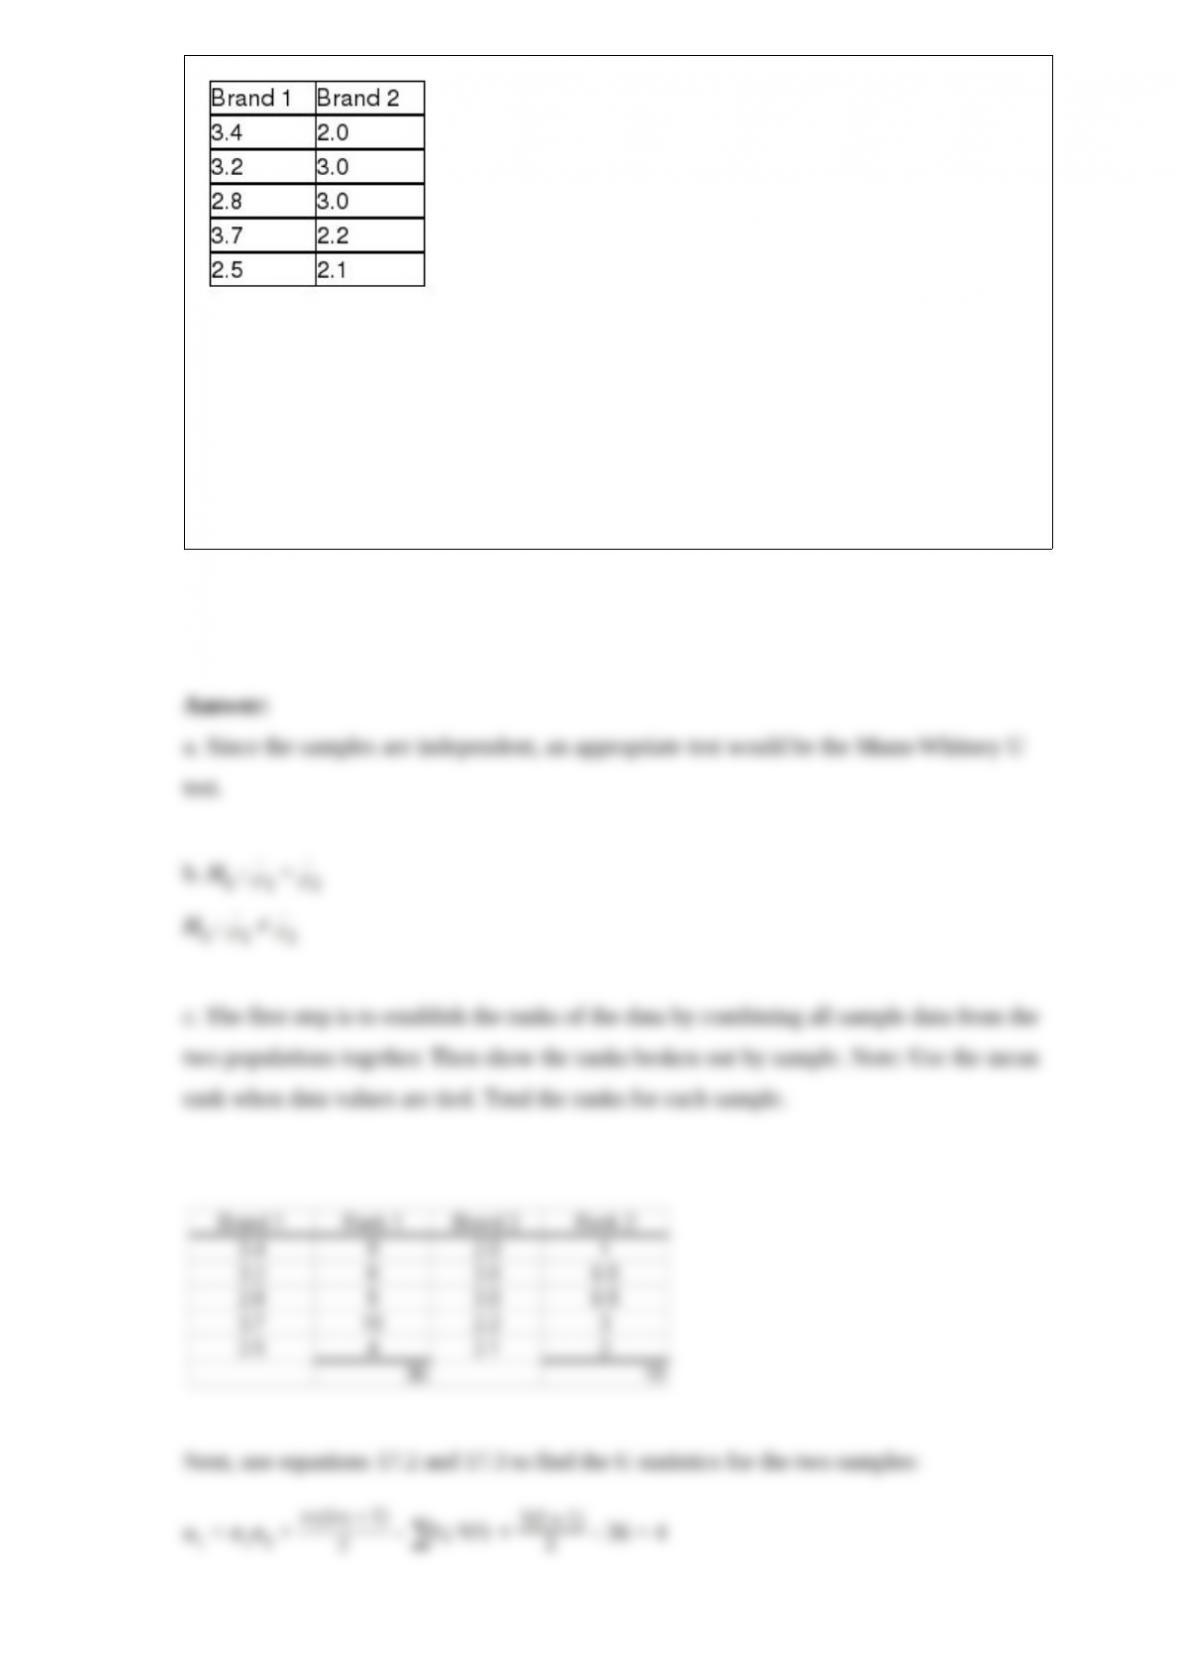
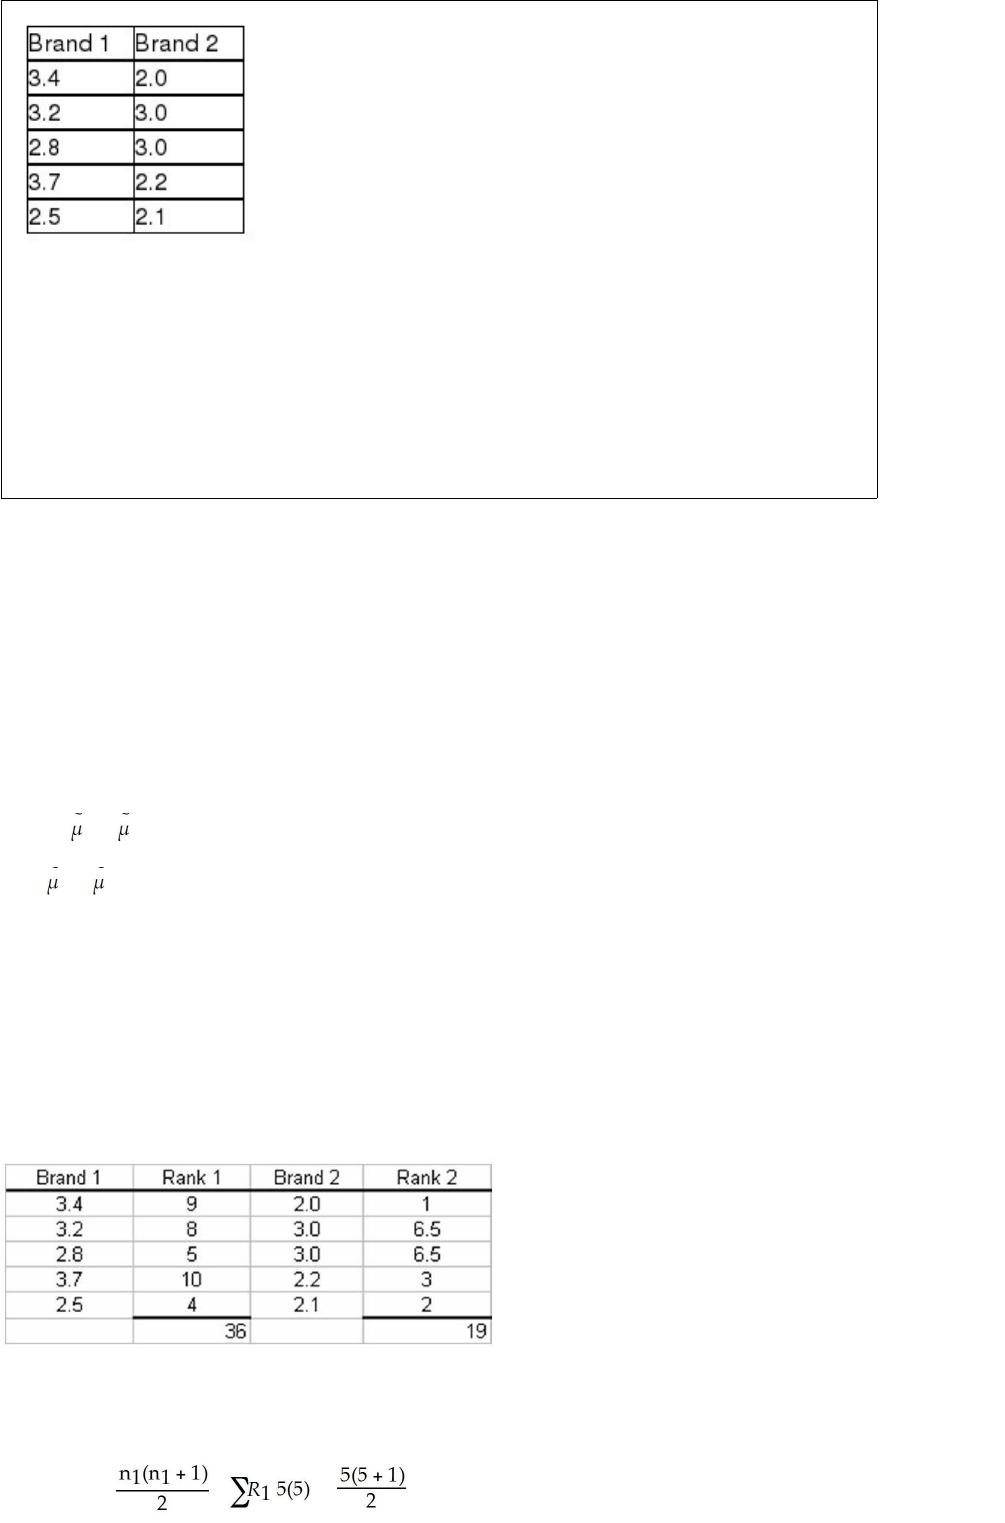
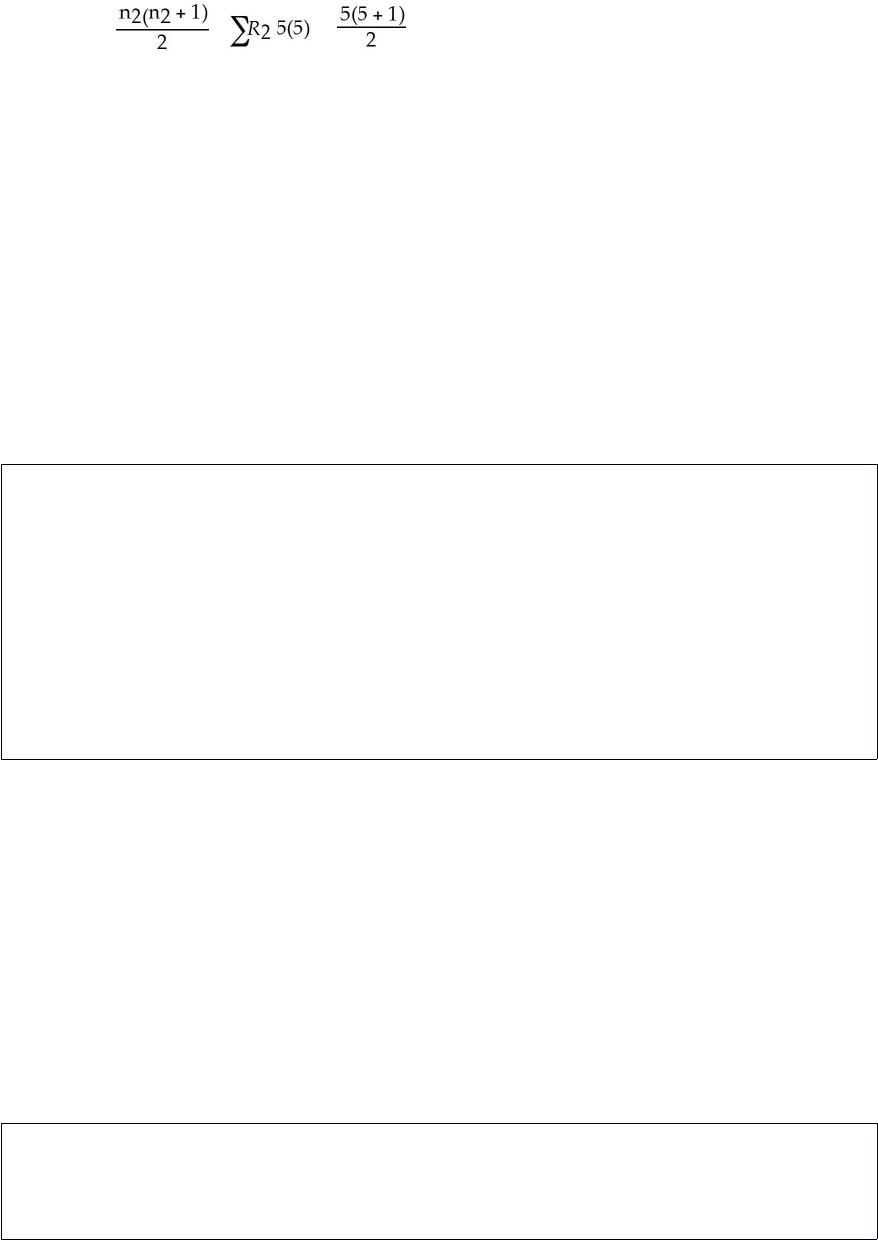
A paint manufacturer is interested in determining whether there is a difference in the
median time it takes for two different brands of paint to dry once they have been
applied to a wall surface. To test this, the company has selected a random sample of 5
walls and applied brand 1 and another 5 walls and applied brand 2. The following data
reflect the actual drying time in hours:
a. If you are unwilling to make the assumptions necessary to use a t-test, what test
would you recommend in this situation?
b. What would be the appropriate null and alternative hypothesis?
c. Using an alpha level equal to .05, conduct the hypothesis test and state the
conclusion.
The most frequently used measure of central tendency is:
A) median.
B) mean.
C) mode.
D) middle value.
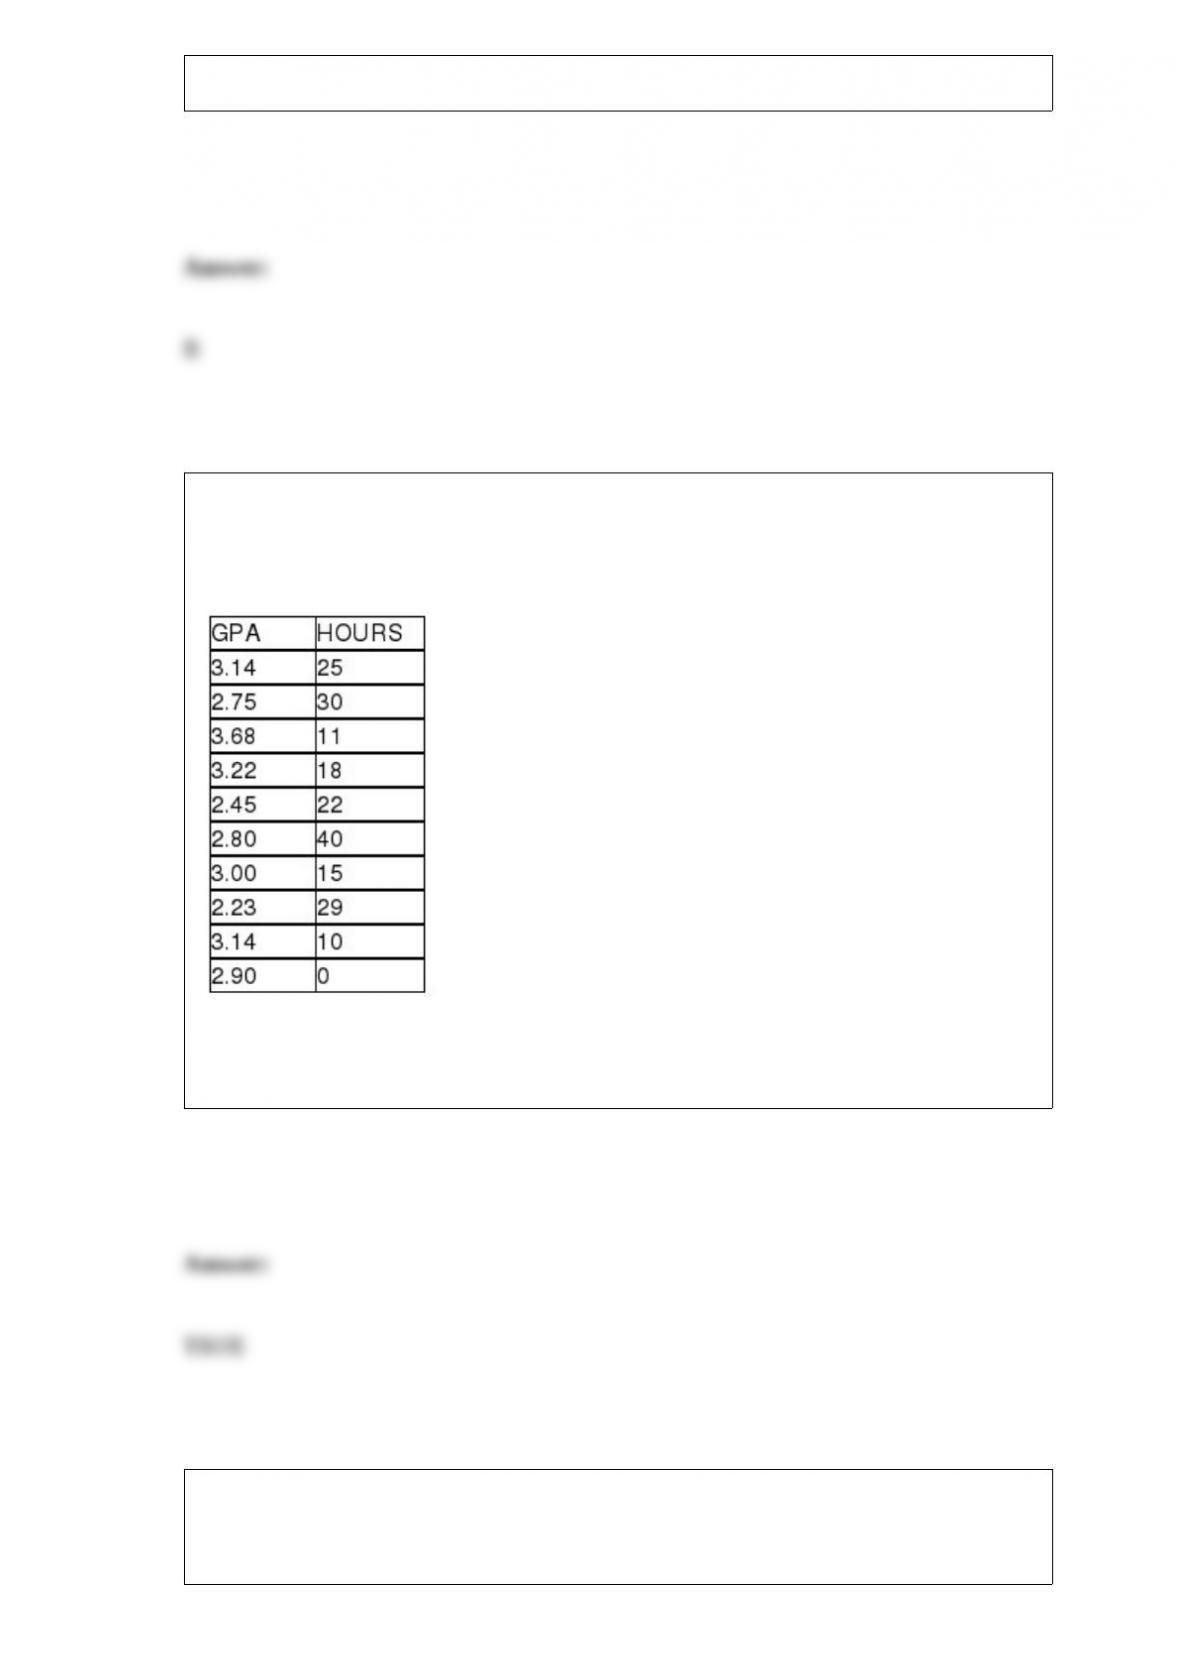
State University recently randomly sampled ten students and analyzed grade point
average (GPA) and number of hours worked off-campus per week. The following data
were observed:
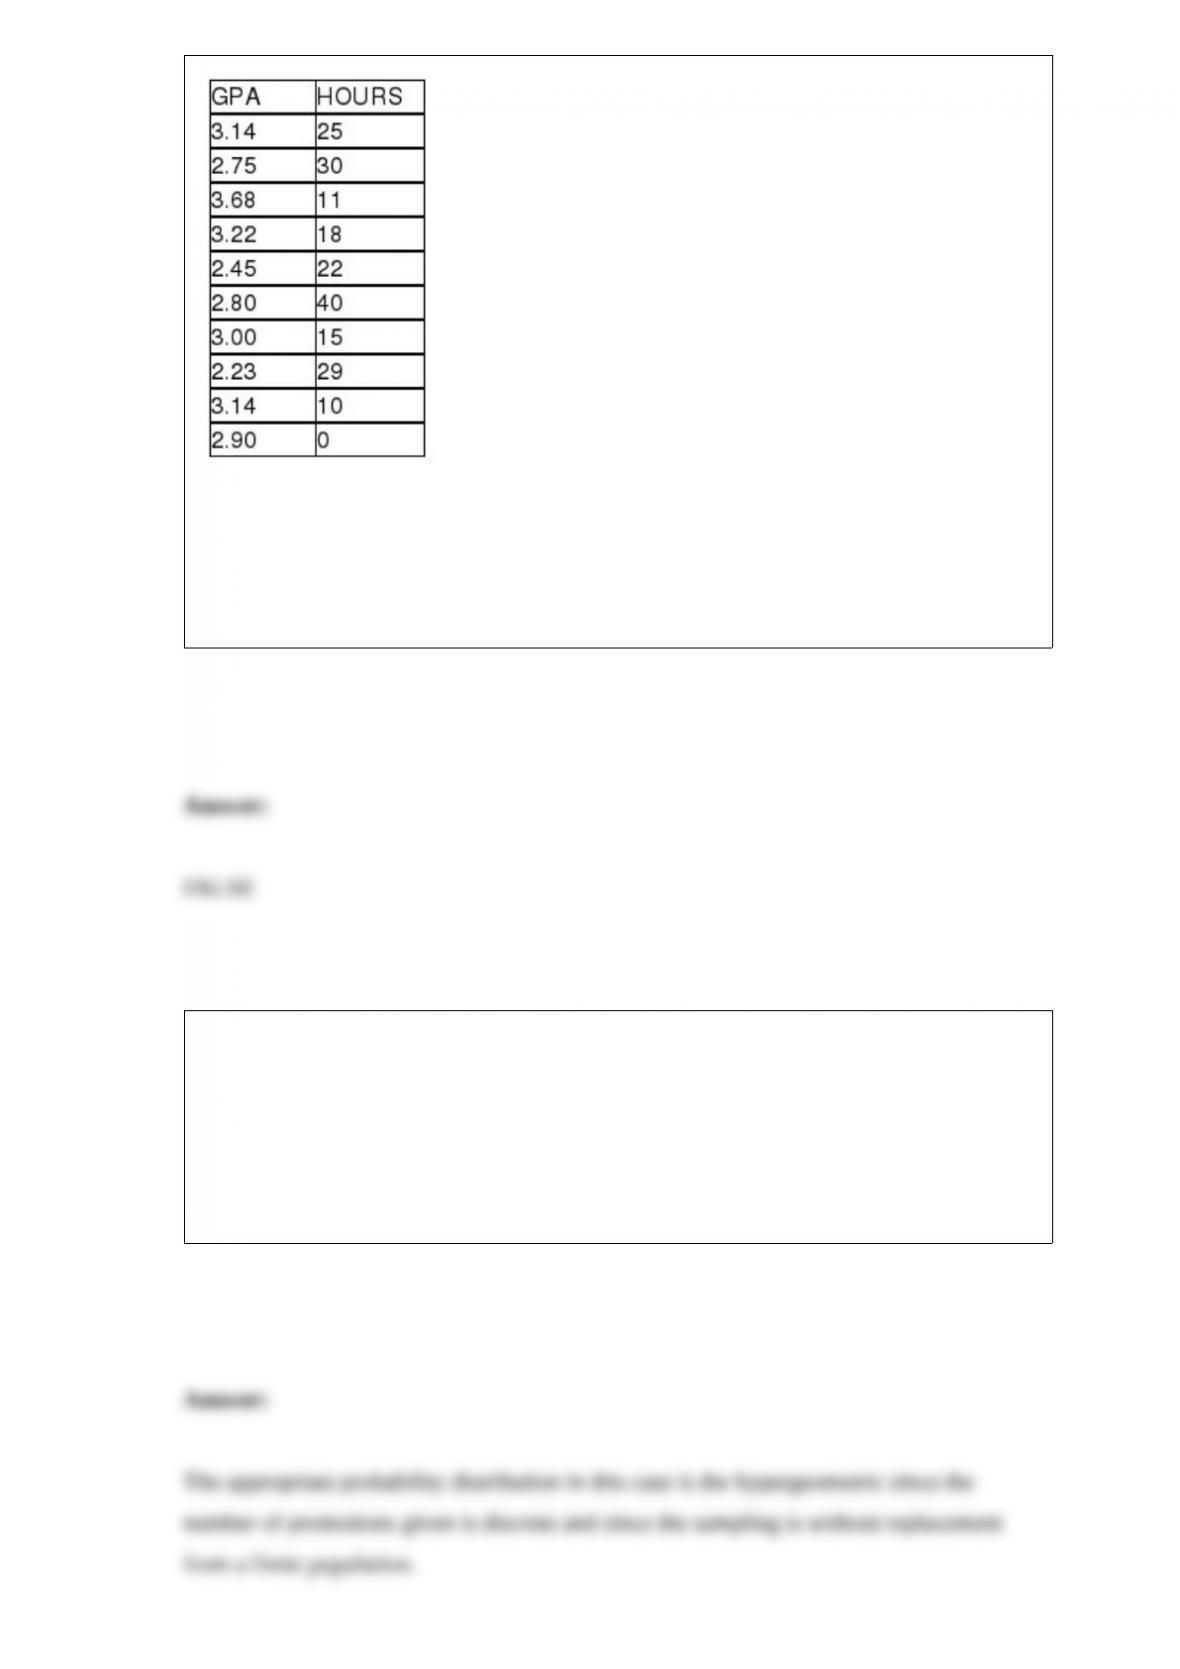
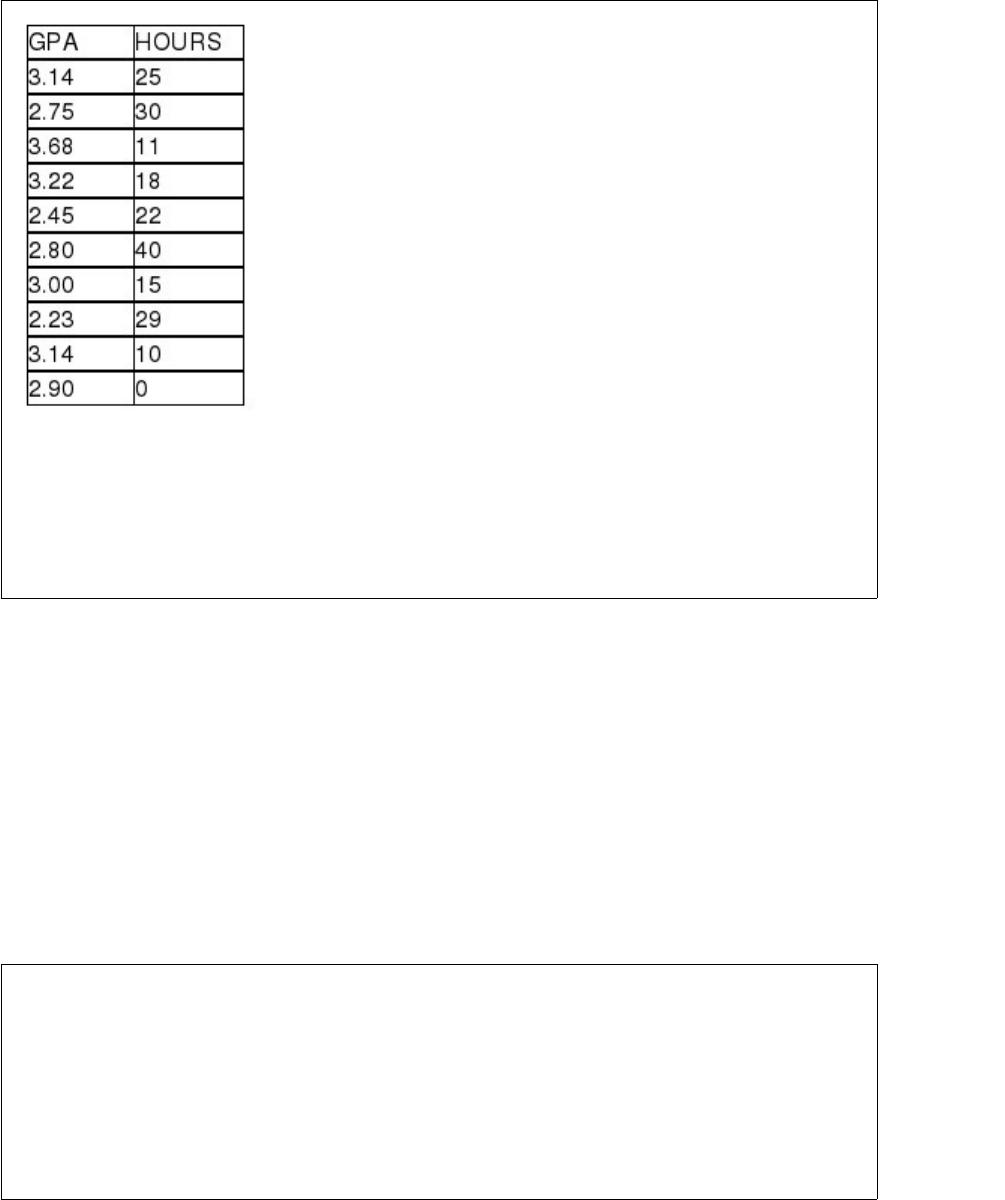
If the university wished to test the claim that the correlation between hours worked and
GPA is negative, the following null and alternative hypotheses would be appropriate:
H0 : ρ < 0.0
Ha : ρ ≥ 0.0
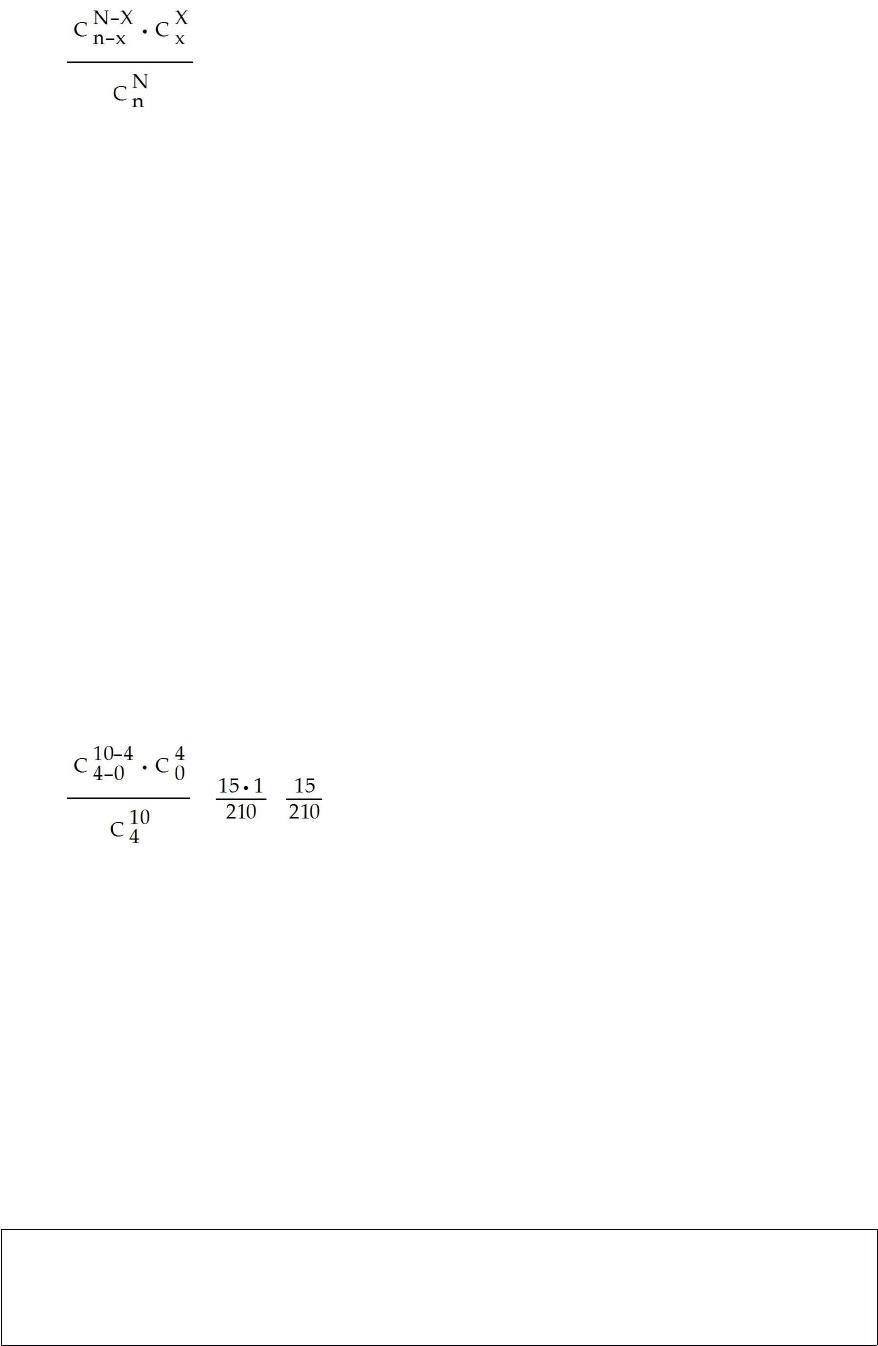
A mid-management team consists of 10 people, 6 males and 4 females. Recently top
management selected 4 people from this team for promotion. It was stated that the
selections were based on random selection. All 4 people selected were males. The
females are upset and believe that there may have been more than random selection
involved here. What probability distribution should be used to analyze this situation and
what is the probability that all 4 promotions would go to males if the selections were
random? Do you believe that the females have a valid complaint in this situation?
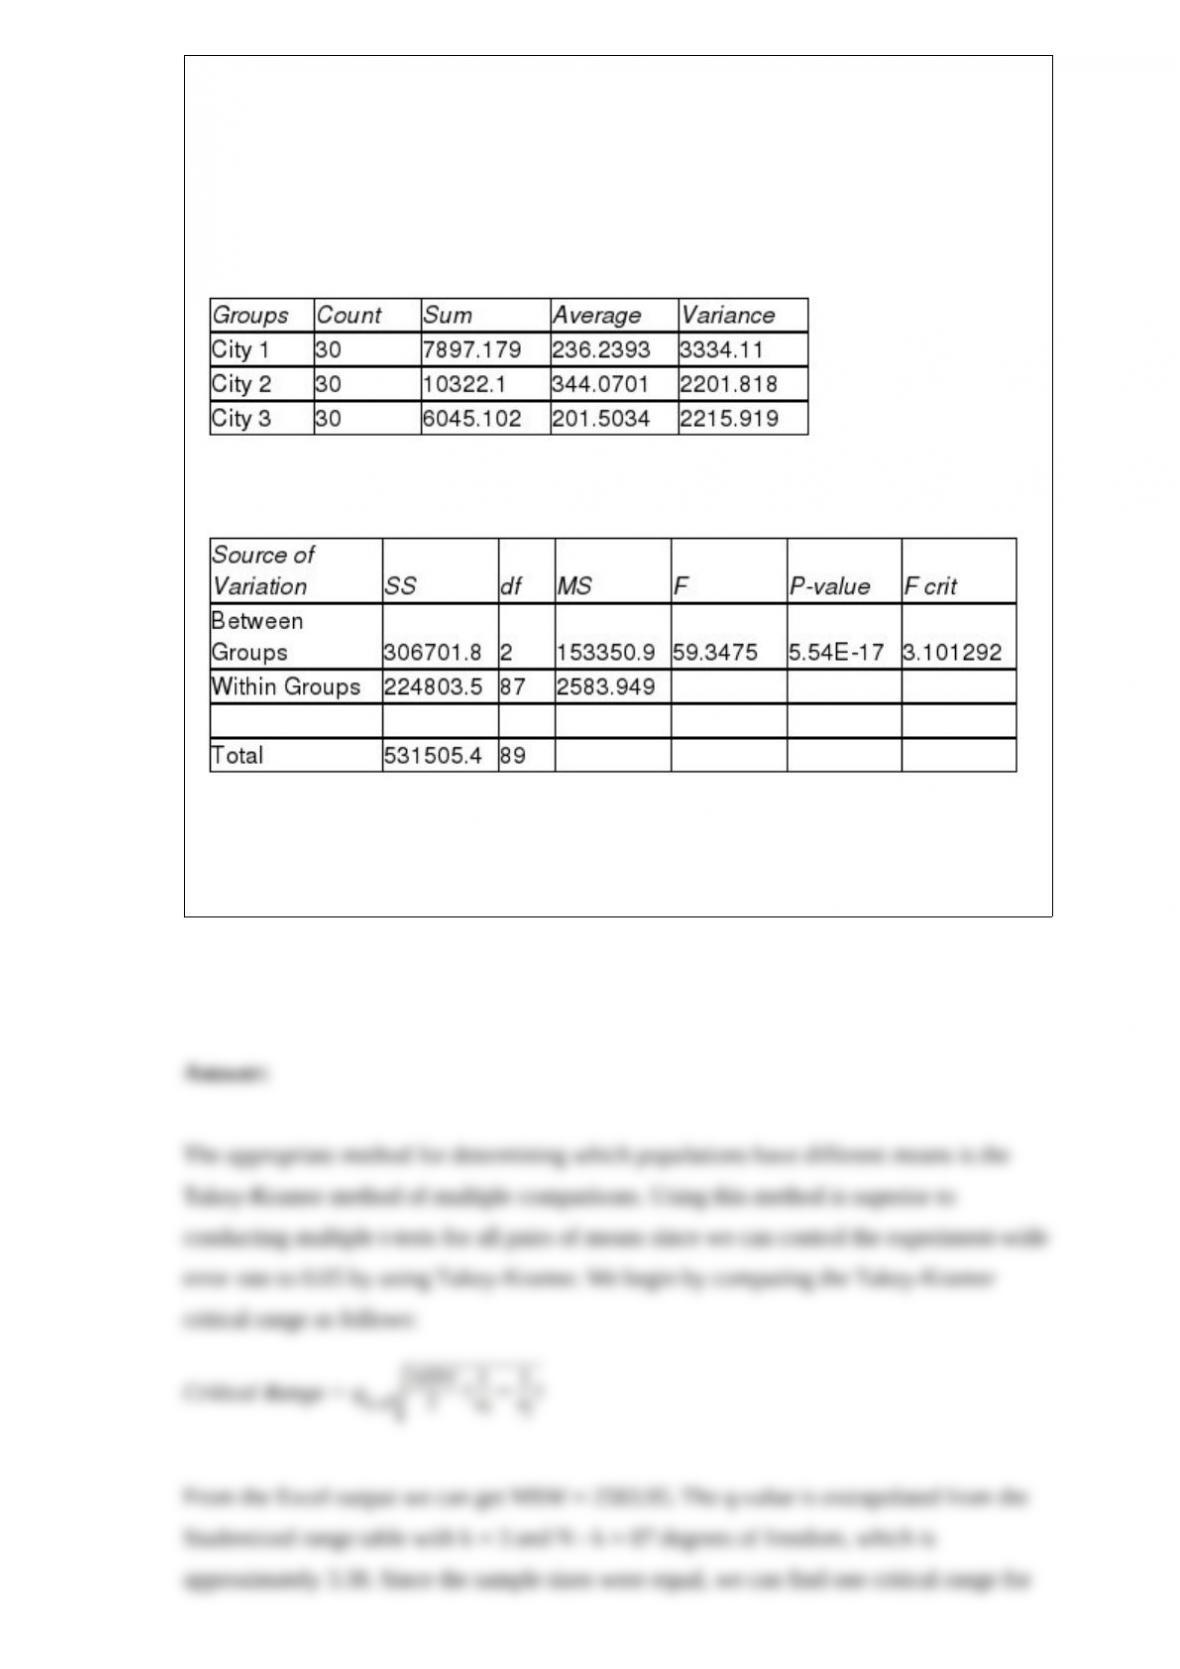
A study has been conducted to determine whether the mean spending for recreational
activities during the month of August differs for residents of three cities. Random
samples of 30 people were selected from each city and their spending on recreation was
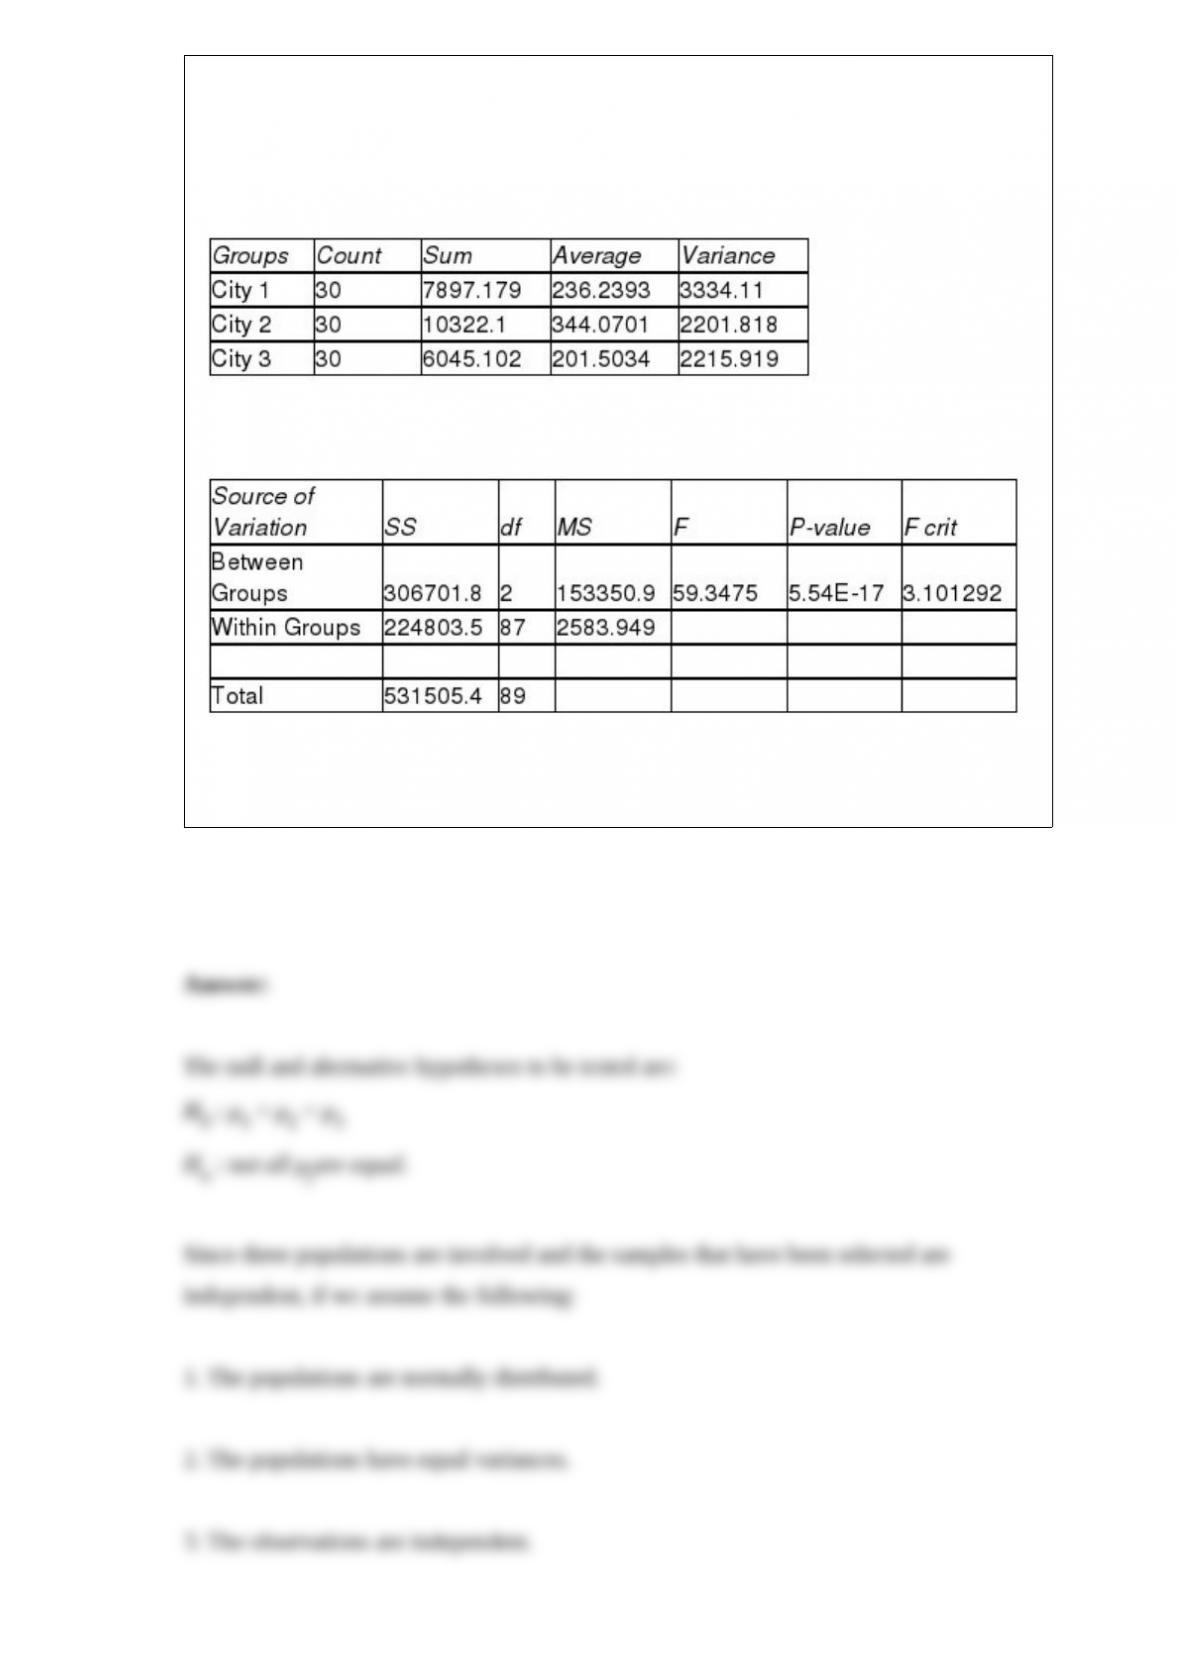
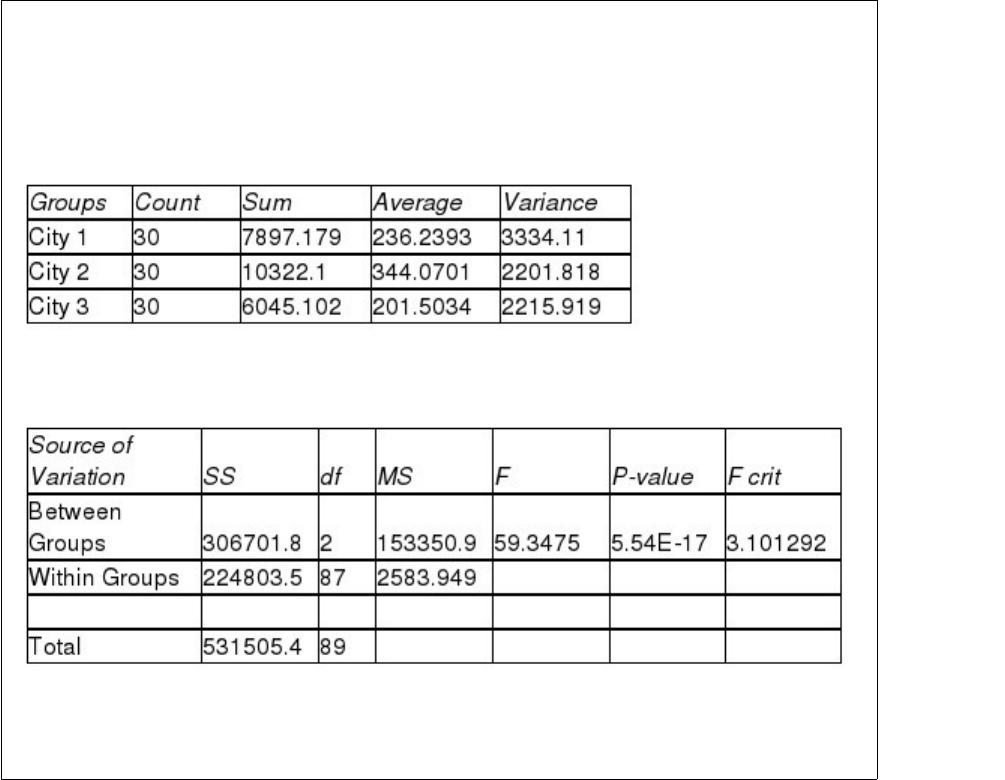
recorded during August. The following output was generated using Excel:
ANOVA: Single Factor
SUMMARY
ANOVA
Based on the information provided, should we conclude that the three populations
(cities) have equal mean spending during August? Test at the 0.05 level of significance.
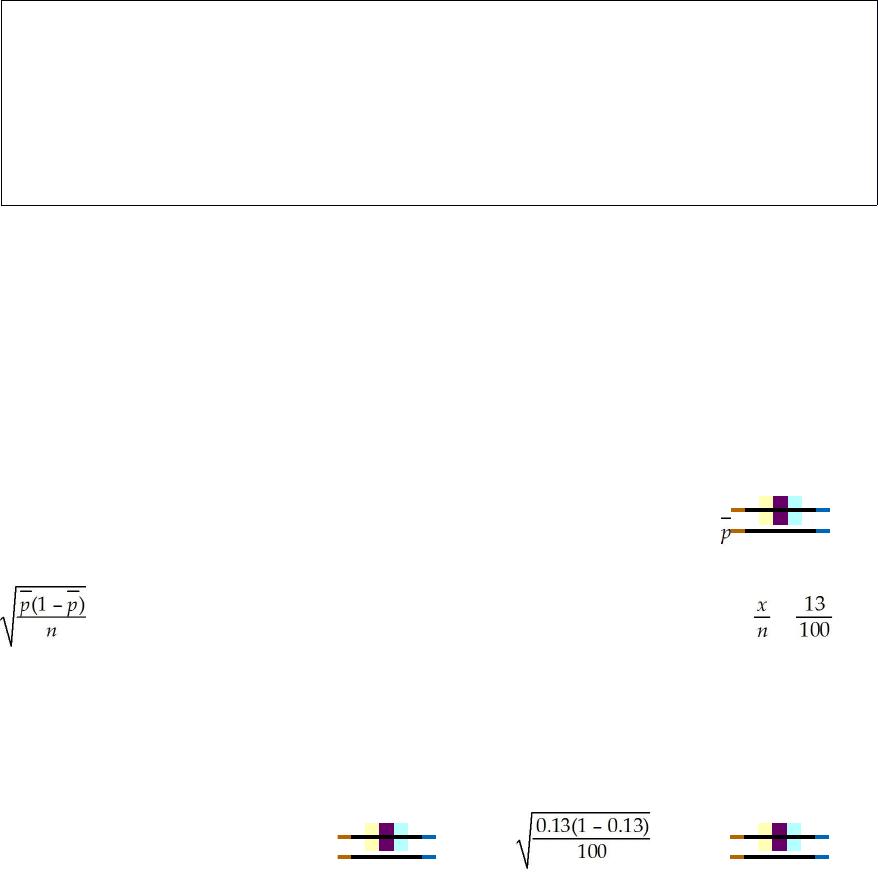
A financial analyst is interested in estimating the proportion of publicly traded
companies on the New York Stock Exchange that have cash balances that are more than
10 percent of the total assets of the company. A random sample of n = 100 companies
shows that 13 had cash balances of more than 10 percent of assets. Based on this
information, develop and interpret a 90 percent confidence interval estimate for the
population proportion.
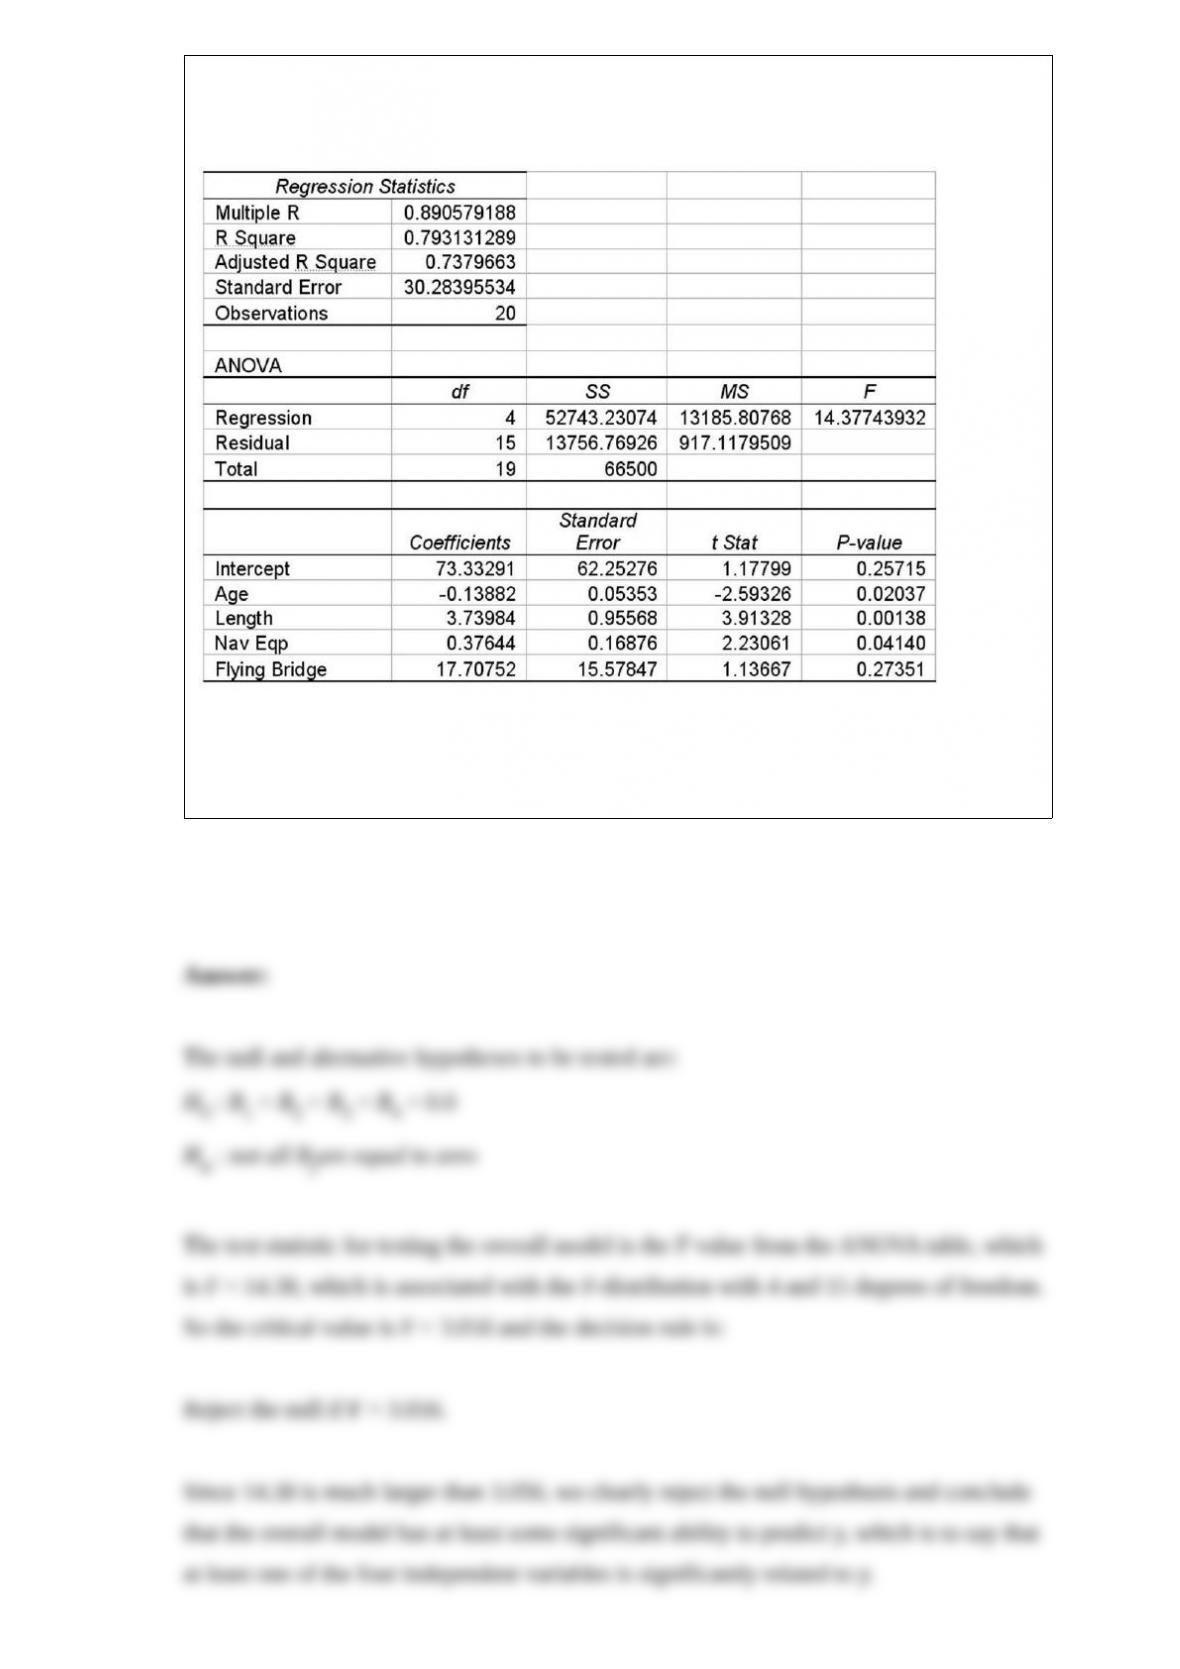
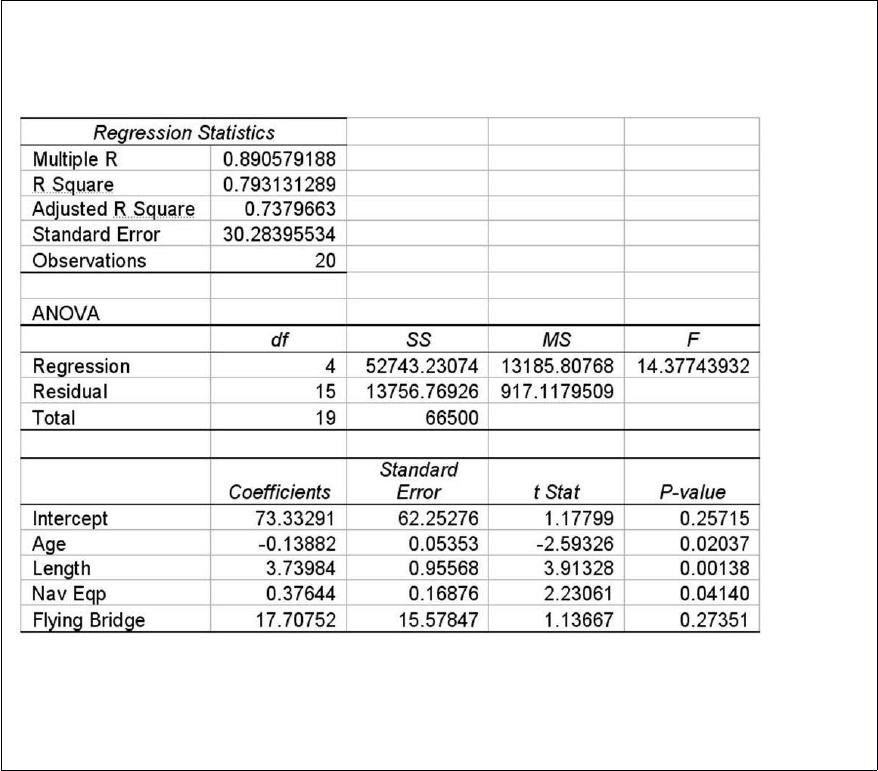
The following multiple regression was conducted to attempt to predict the price of
yachts based on the independent variables shown.
Given this information and your knowledge of multiple regression, conduct the
appropriate test to determine whether the overall regression model is statistically
significant at the 0.05 level of significance using the critical value method.
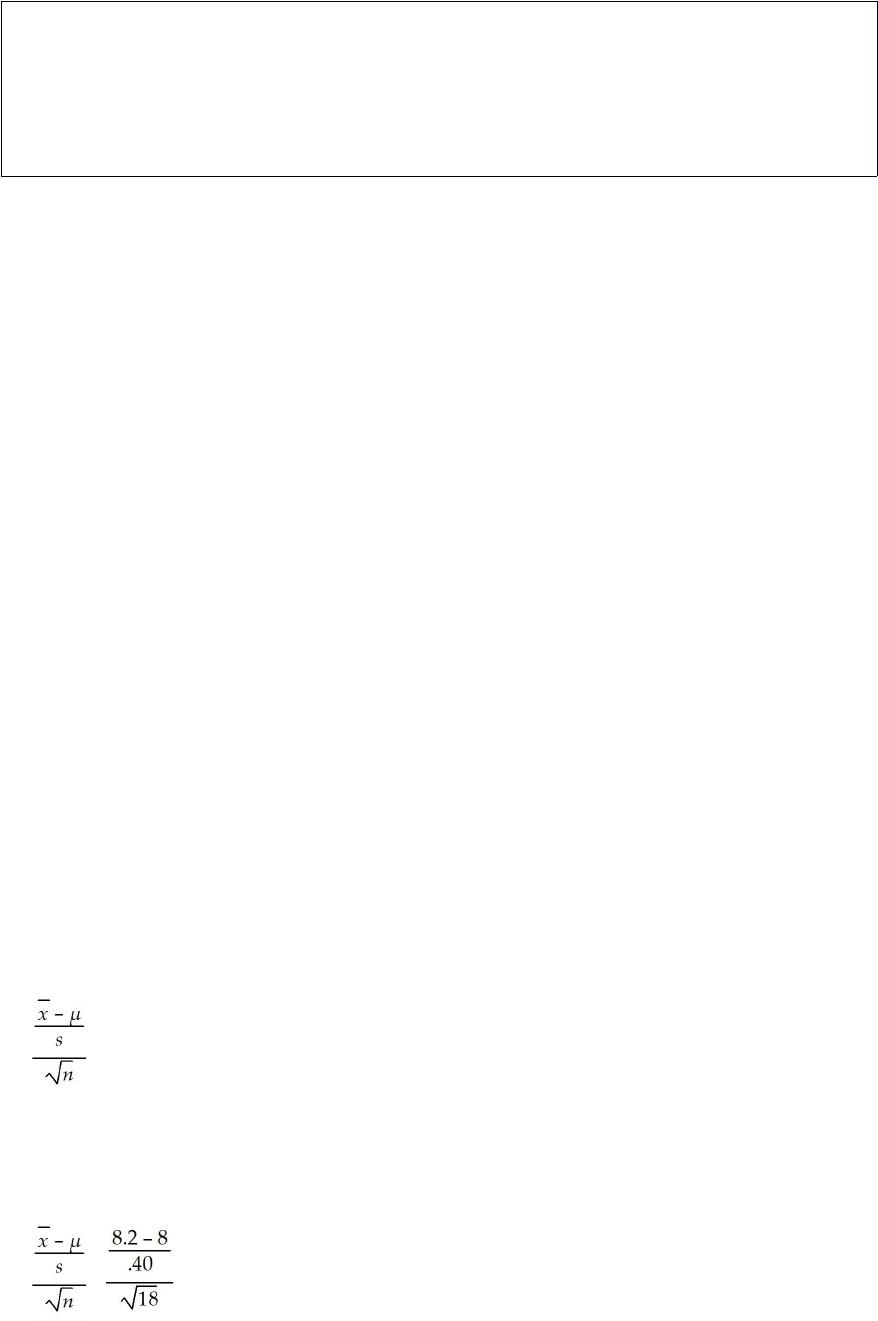
A cell phone manufacturer claims that its phone will last for more than 8 hours of
continuous talk time when the battery is fully charged. To test this claim a sample of n =
18 phones were tested. The results showed a sample mean of 8.2 hours and a sample
standard deviation of 0.4 hour. Conduct the hypothesis test using a 0.5 level of
significance and determine whether or not the company’s claim is supported.
A PC company uses two suppliers for rechargeable batteries for its notebook computers.
Two factors are important quality features of the batteries: mean use time and variation.
It is desirable that the mean use time be high and the variability be low. Recently, the
PC maker conducted a test on batteries from the two suppliers. In the test, 9 randomly
selected batteries from Supplier 1 were tested and 12 randomly selected batteries from
Supplier 2 were tested. The following results were observed:
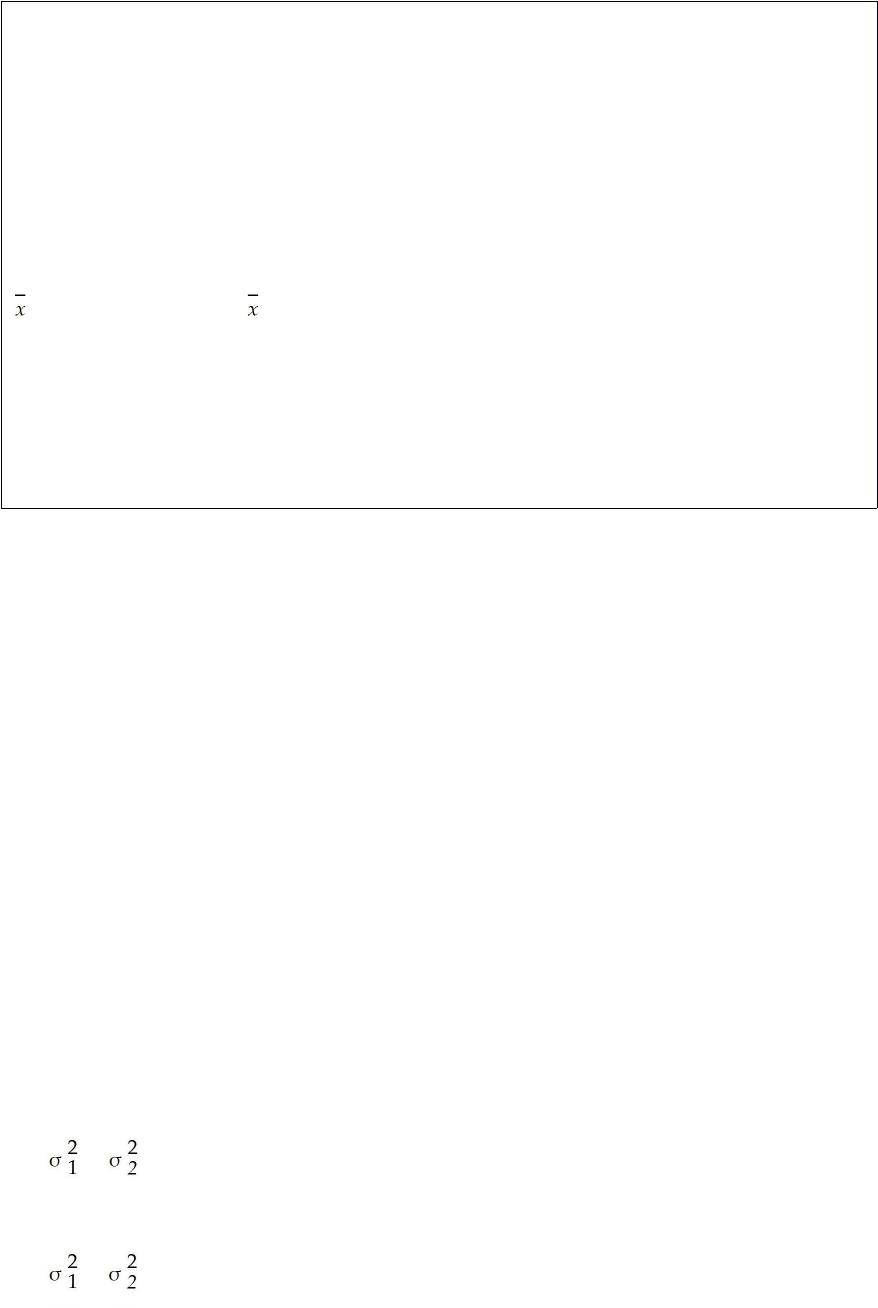
Supplier 1 Supplier 2
n1 = 9 n2 = 12
1 = 67.25 min 2 = 72.4 min
s1 = 11.2 min s2 = 9.9 min
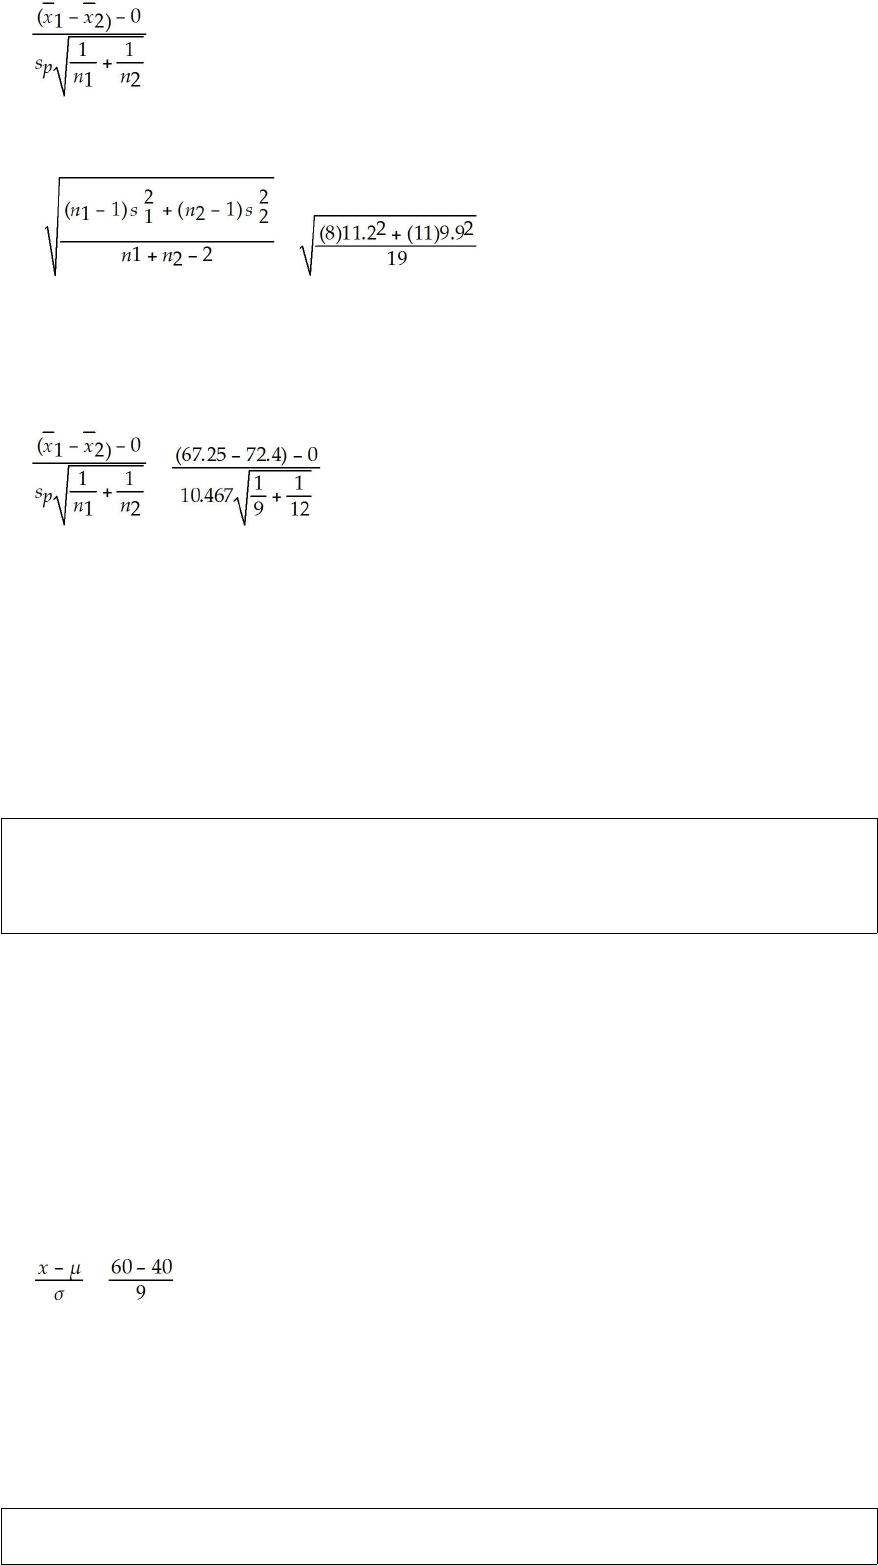
Based on these sample results, can the PC maker conclude that a difference exists
between the two batteries with respect to the population mean use time? Test using a
0.10 level of significance.
A class takes an exam where the average time to complete the exam is normally
distributed with a time of 40 minutes and standard deviation of 9 minutes. If the class
lasts 1 hour, what percent of the students will have turned in the exam after 60 minutes?
A study has been conducted to determine whether the mean spending for recreational
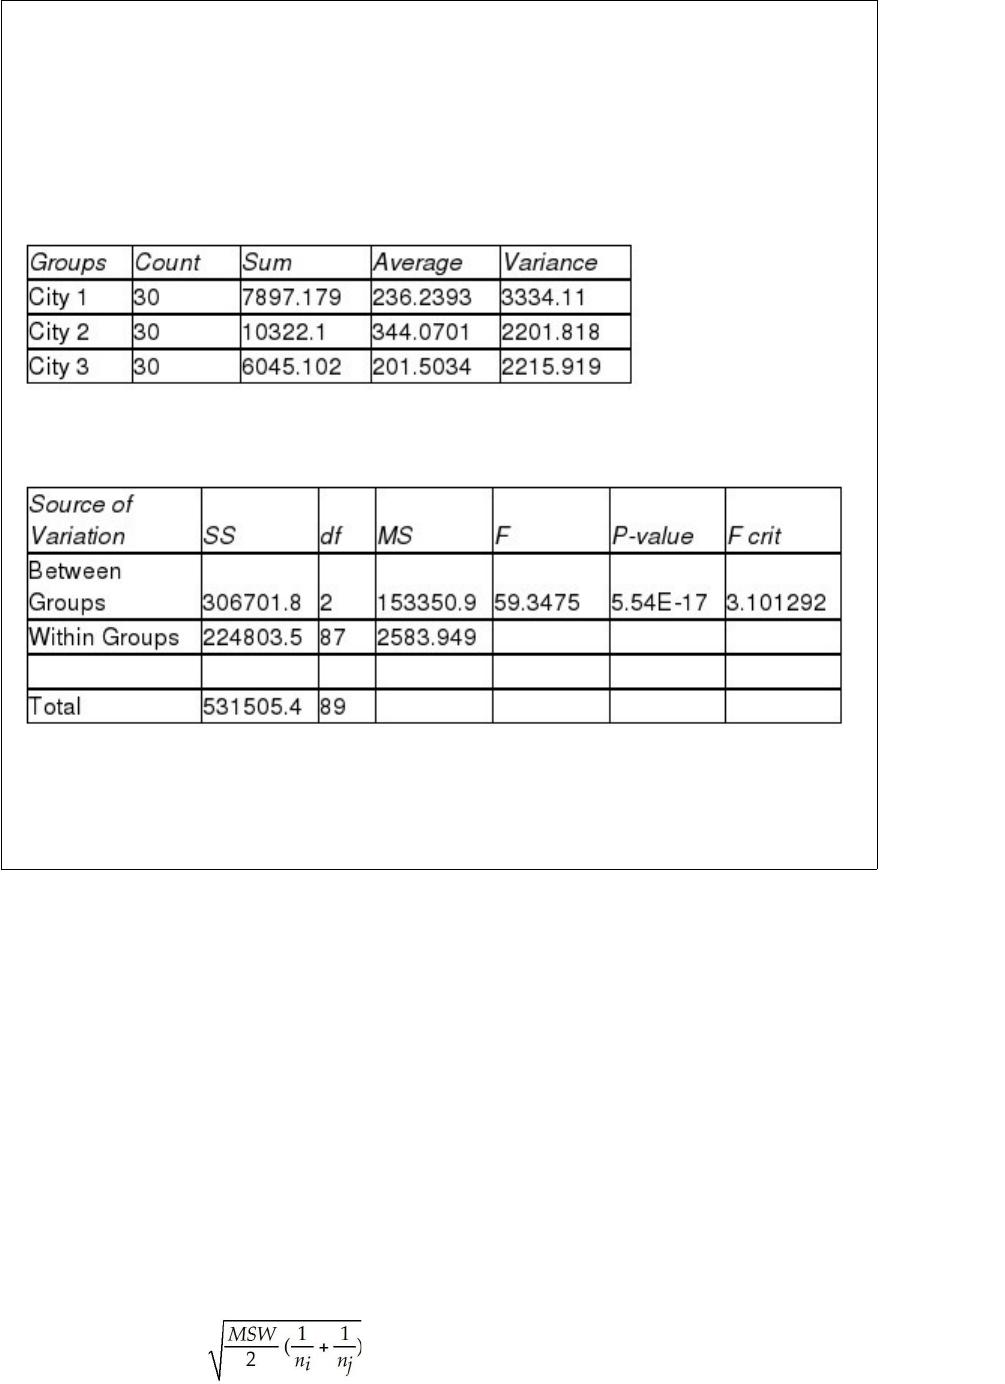
activities during the month of August differs for residents of three cities. Random
samples of 30 people were selected from each city and their spending on recreation was
recorded during August. The following output was generated using Excel:
ANOVA: Single Factor
SUMMARY
ANOVA
The Excel output shows that the null hypothesis of equal means should be rejected.
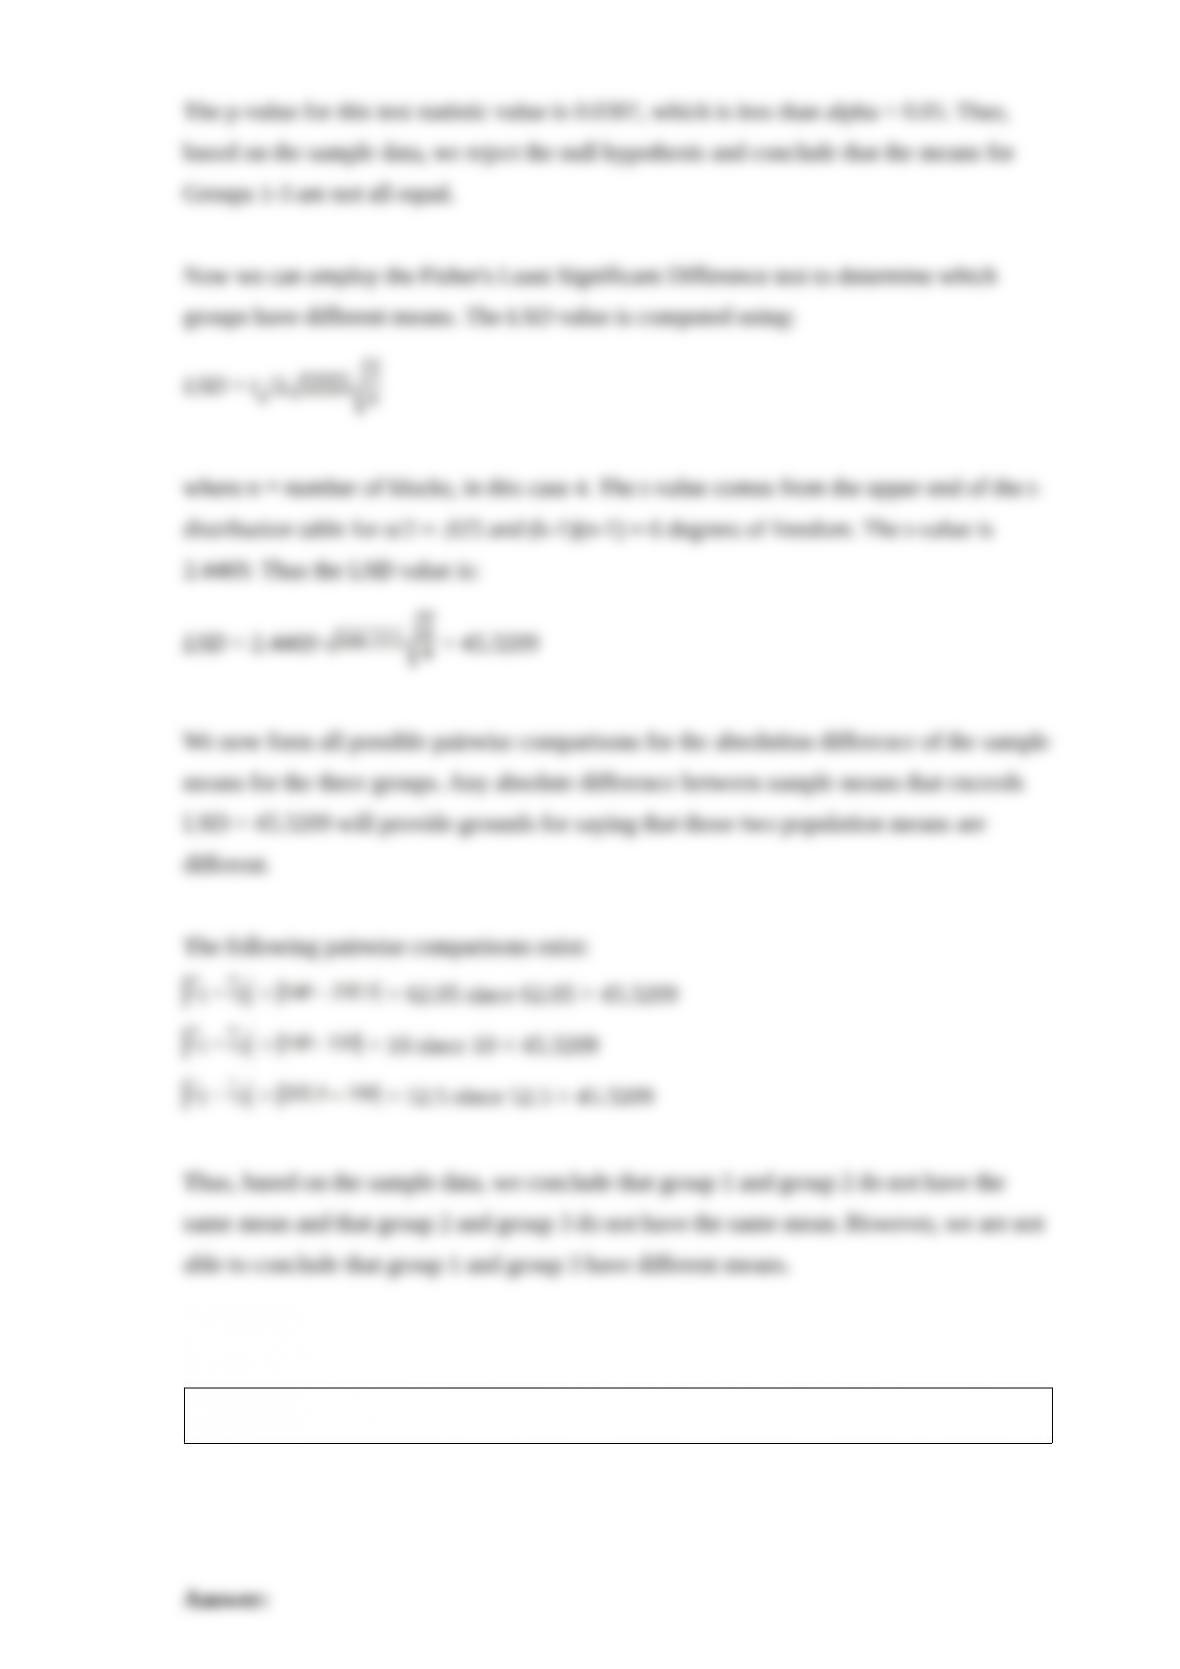
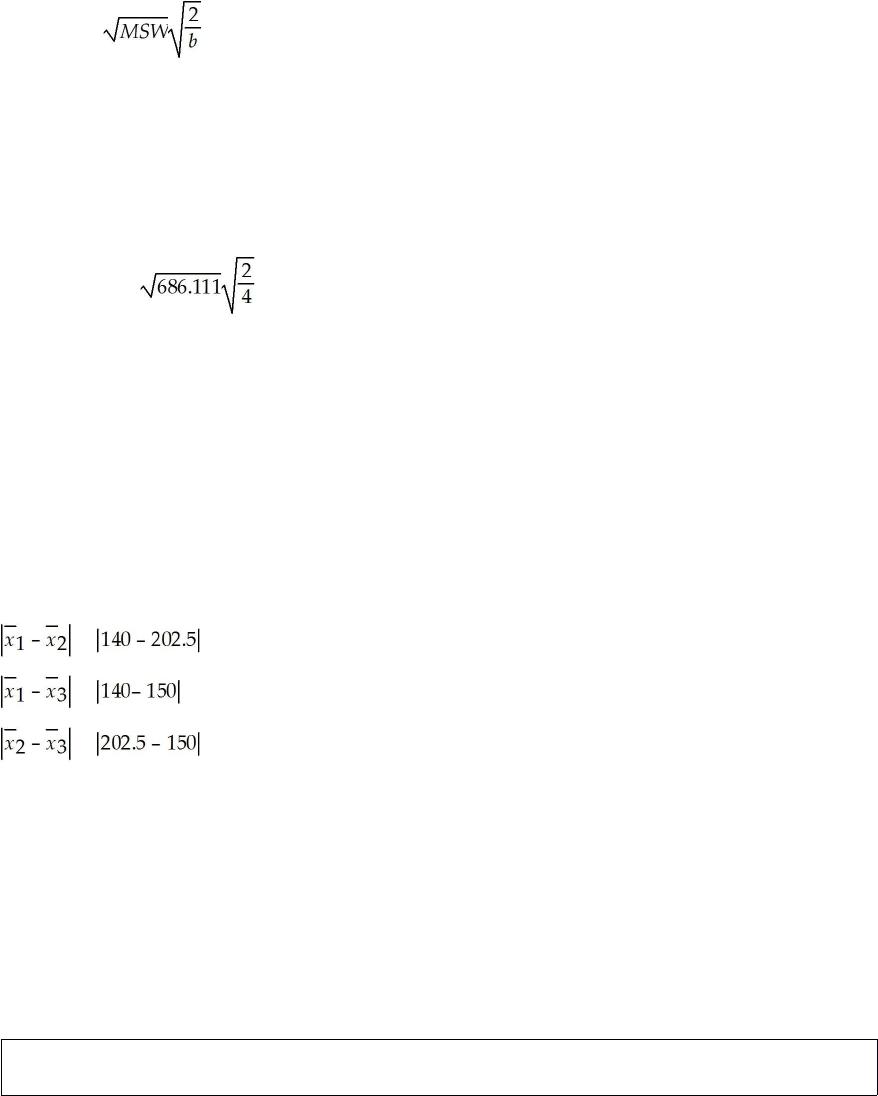
Given this, perform the appropriate method for determining which population means
are different. Conduct the test using an alpha = 0.05 level.
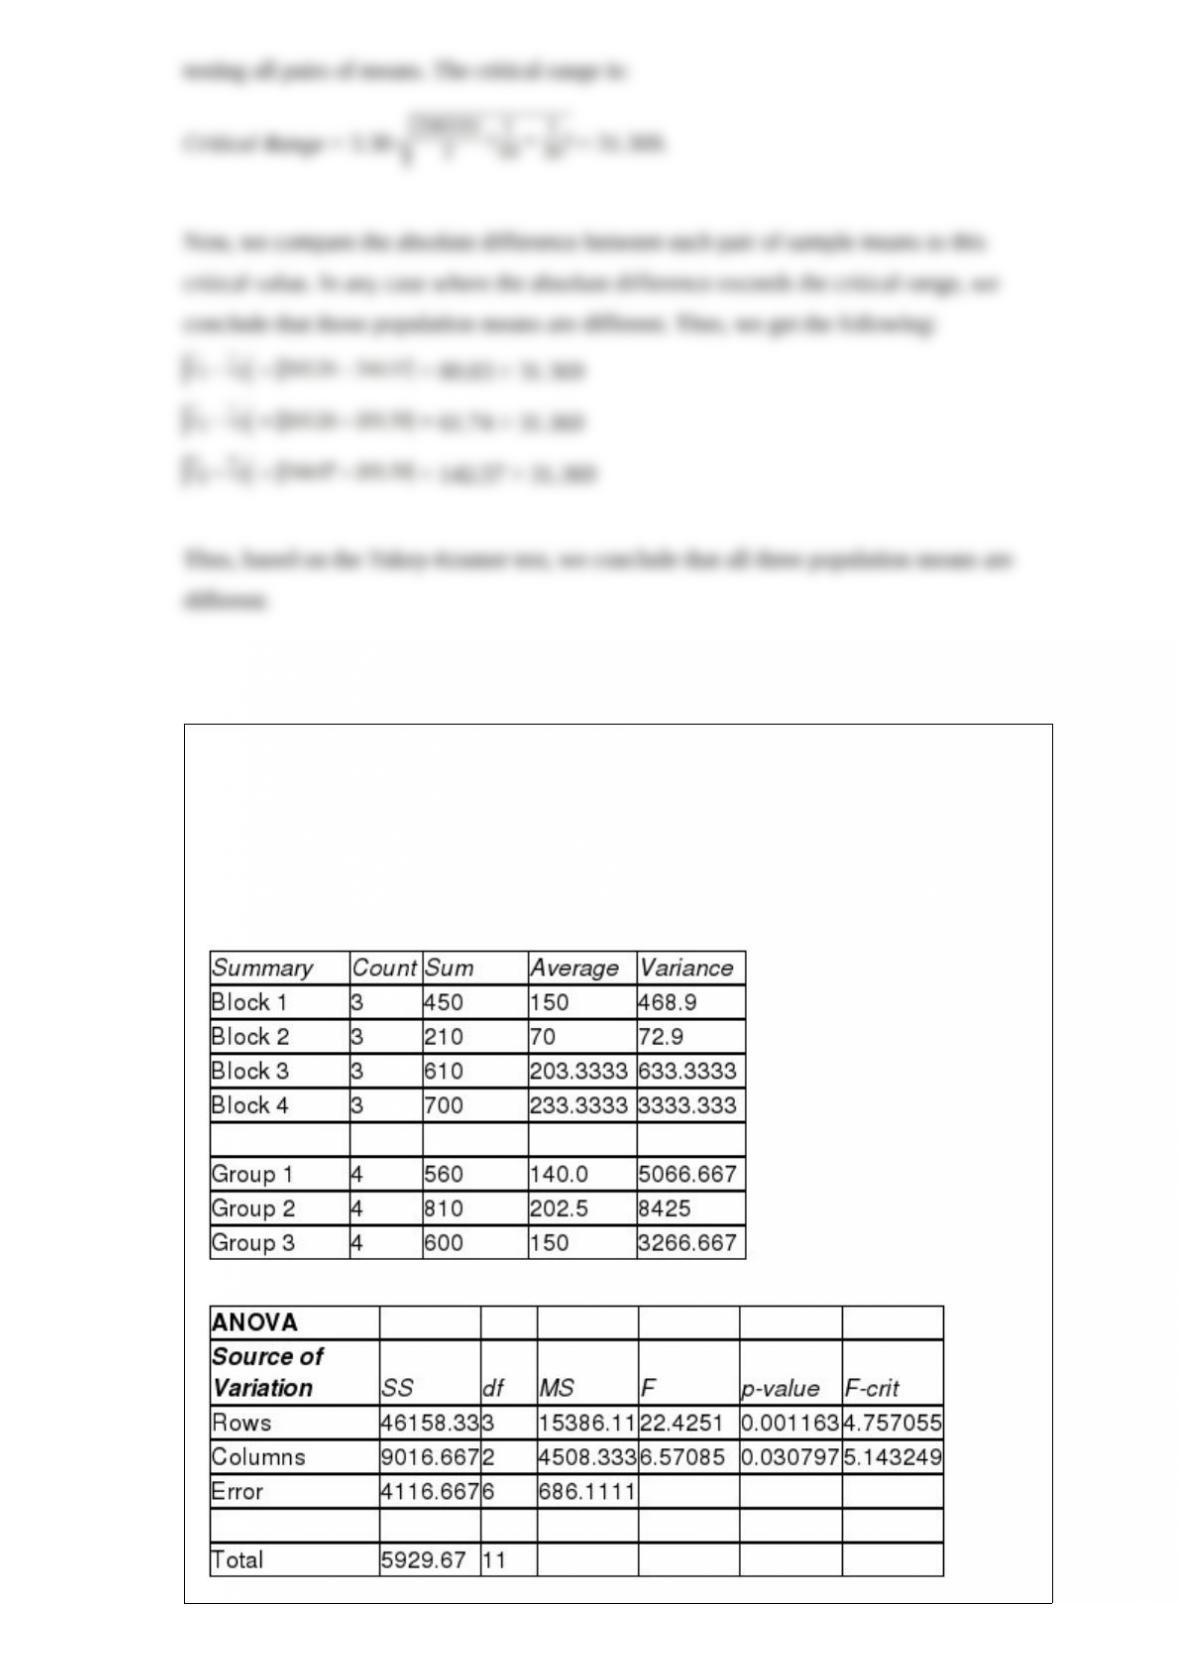
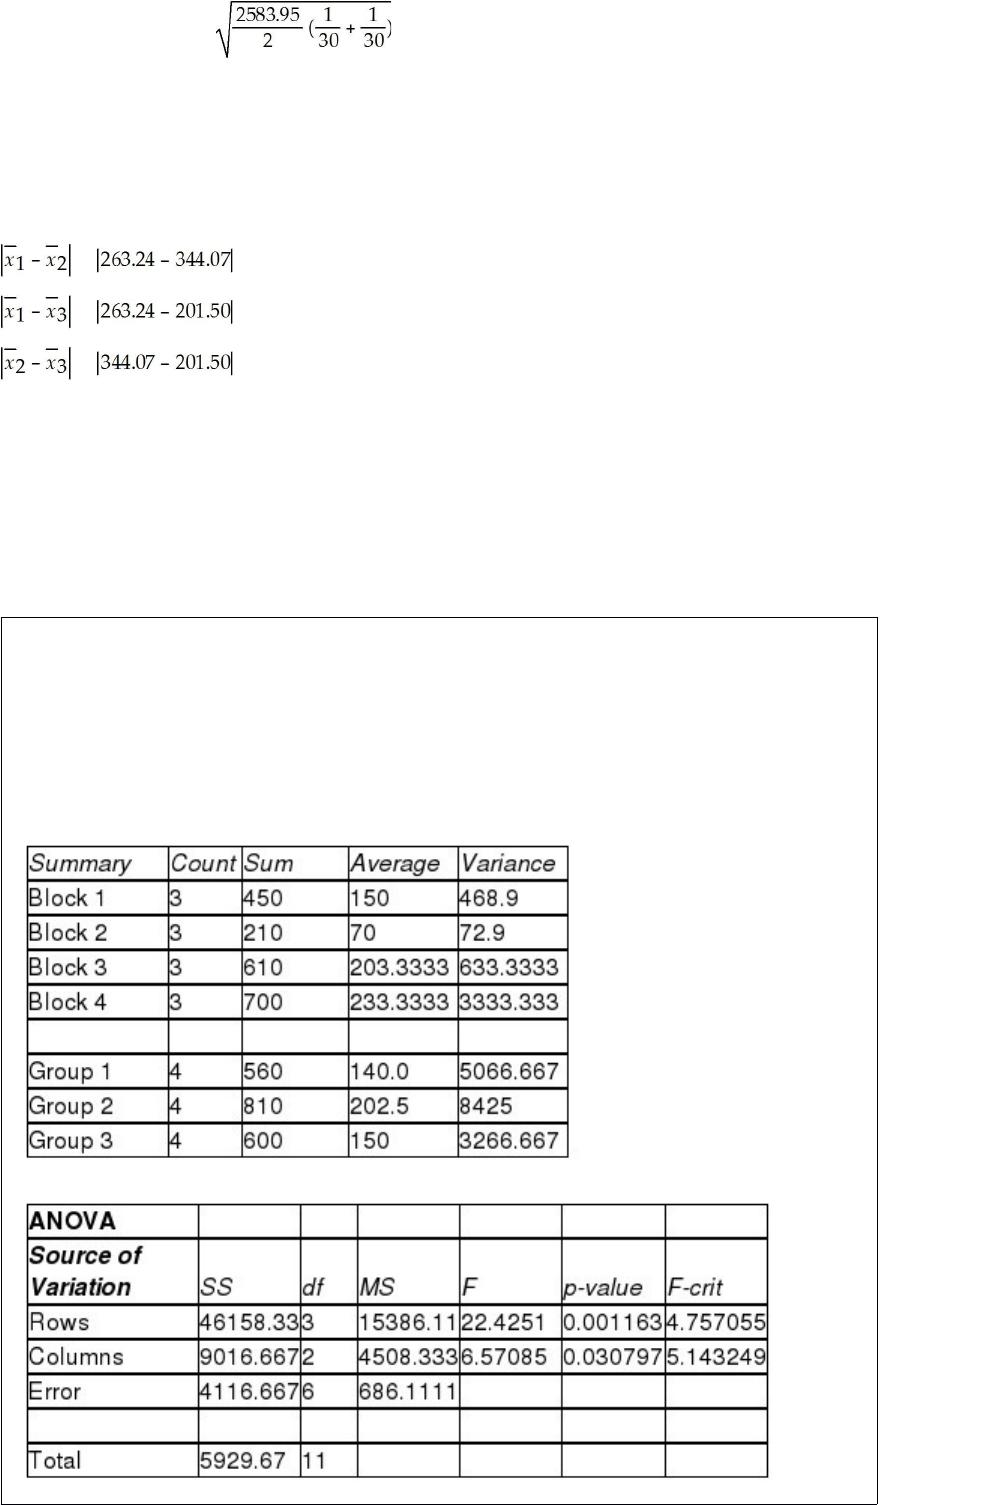
Suppose that you have just performed an experiment using the randomized complete
block analysis of variance design and the output from Excel is shown as follows. The
primary null hypothesis to be tested involves whether the means of the three groups are
equal.
ANOVA: Two-Factor Without Replication
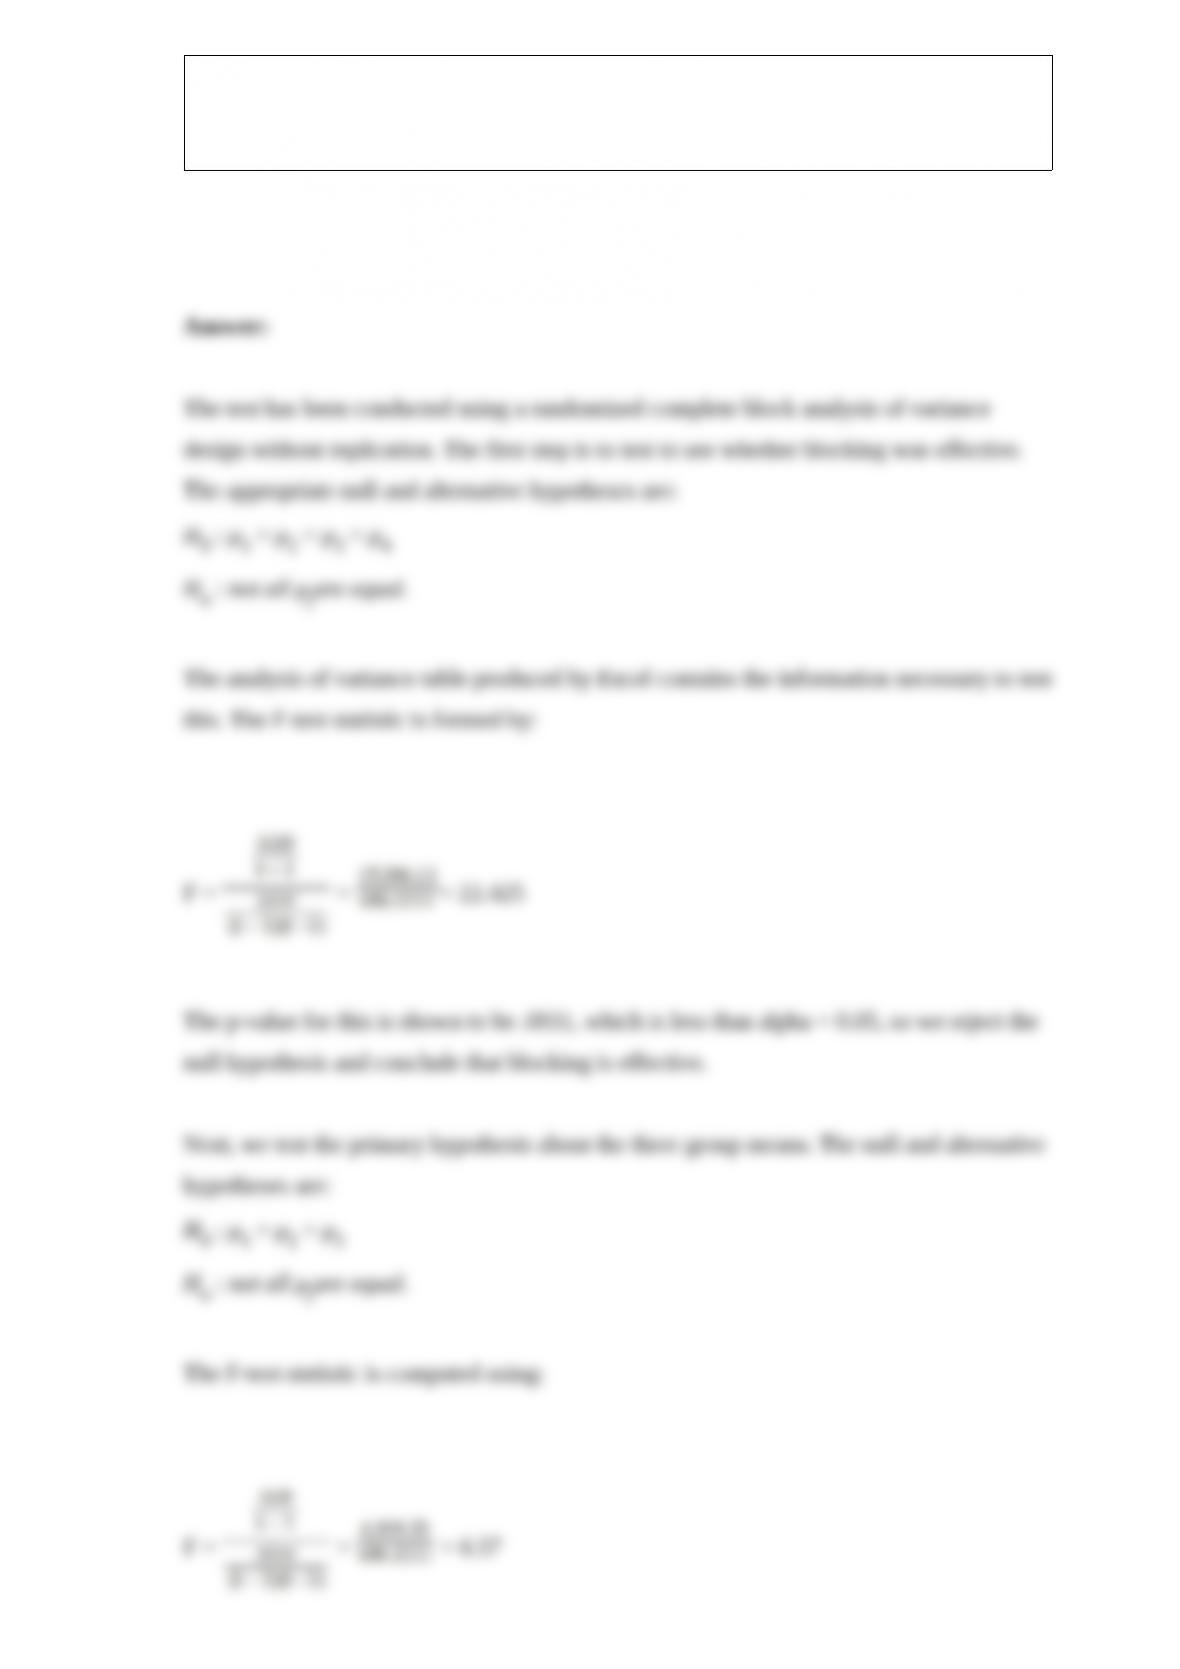
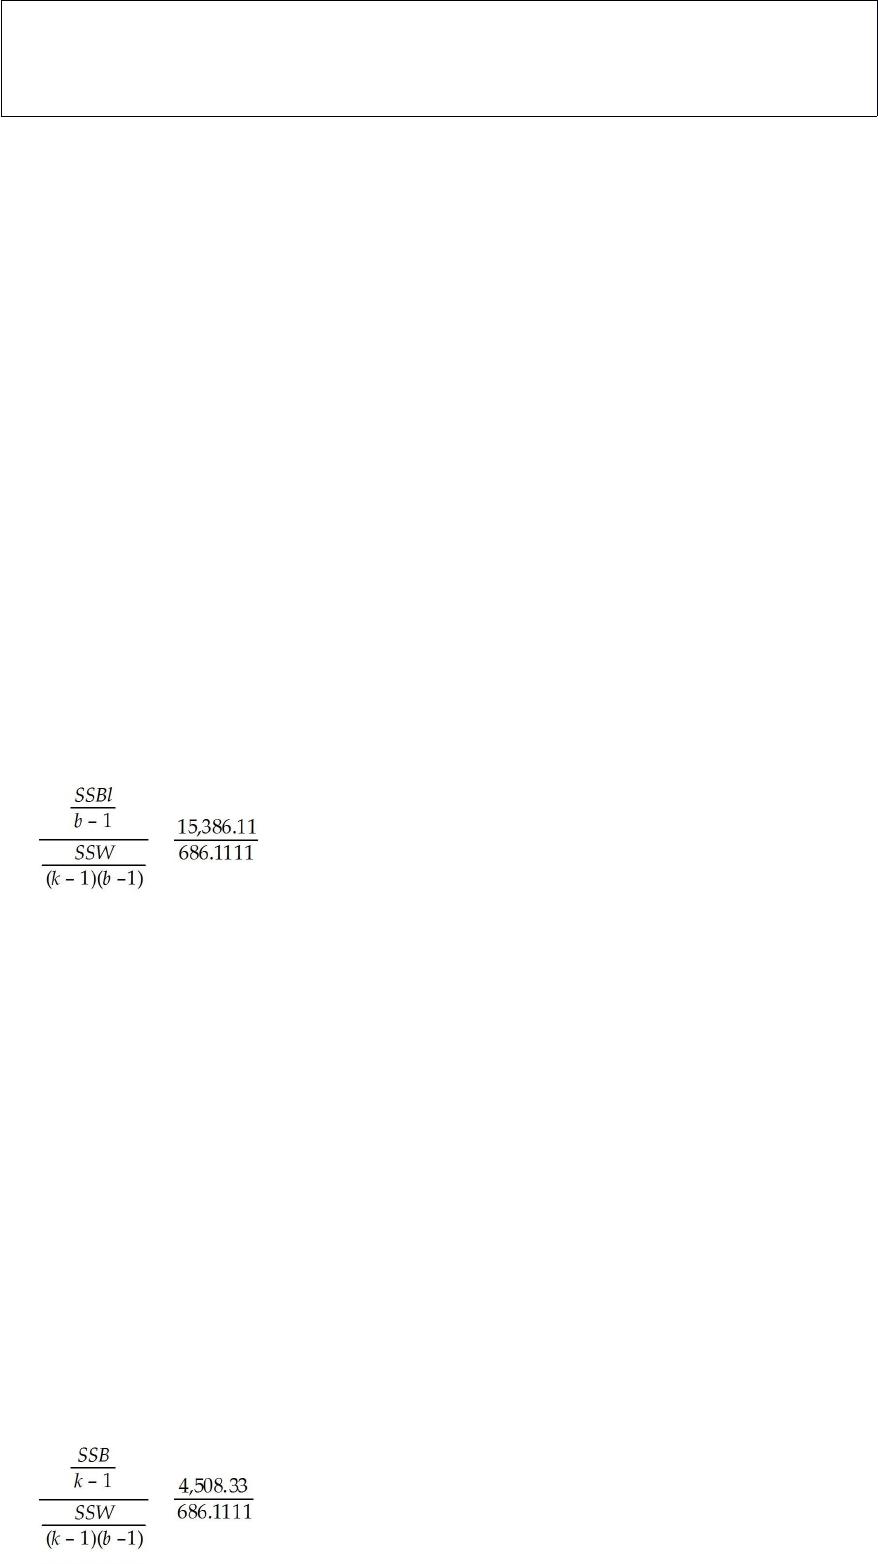
Using a significance level of 0.05, what conclusions should be made about the three
groups? Which groups have different means? Discuss.
Explain the relationship between control limits and specification limits.
Explain what an experimental design is.
In estimating a population mean, under what conditions would the t-distribution be
used?
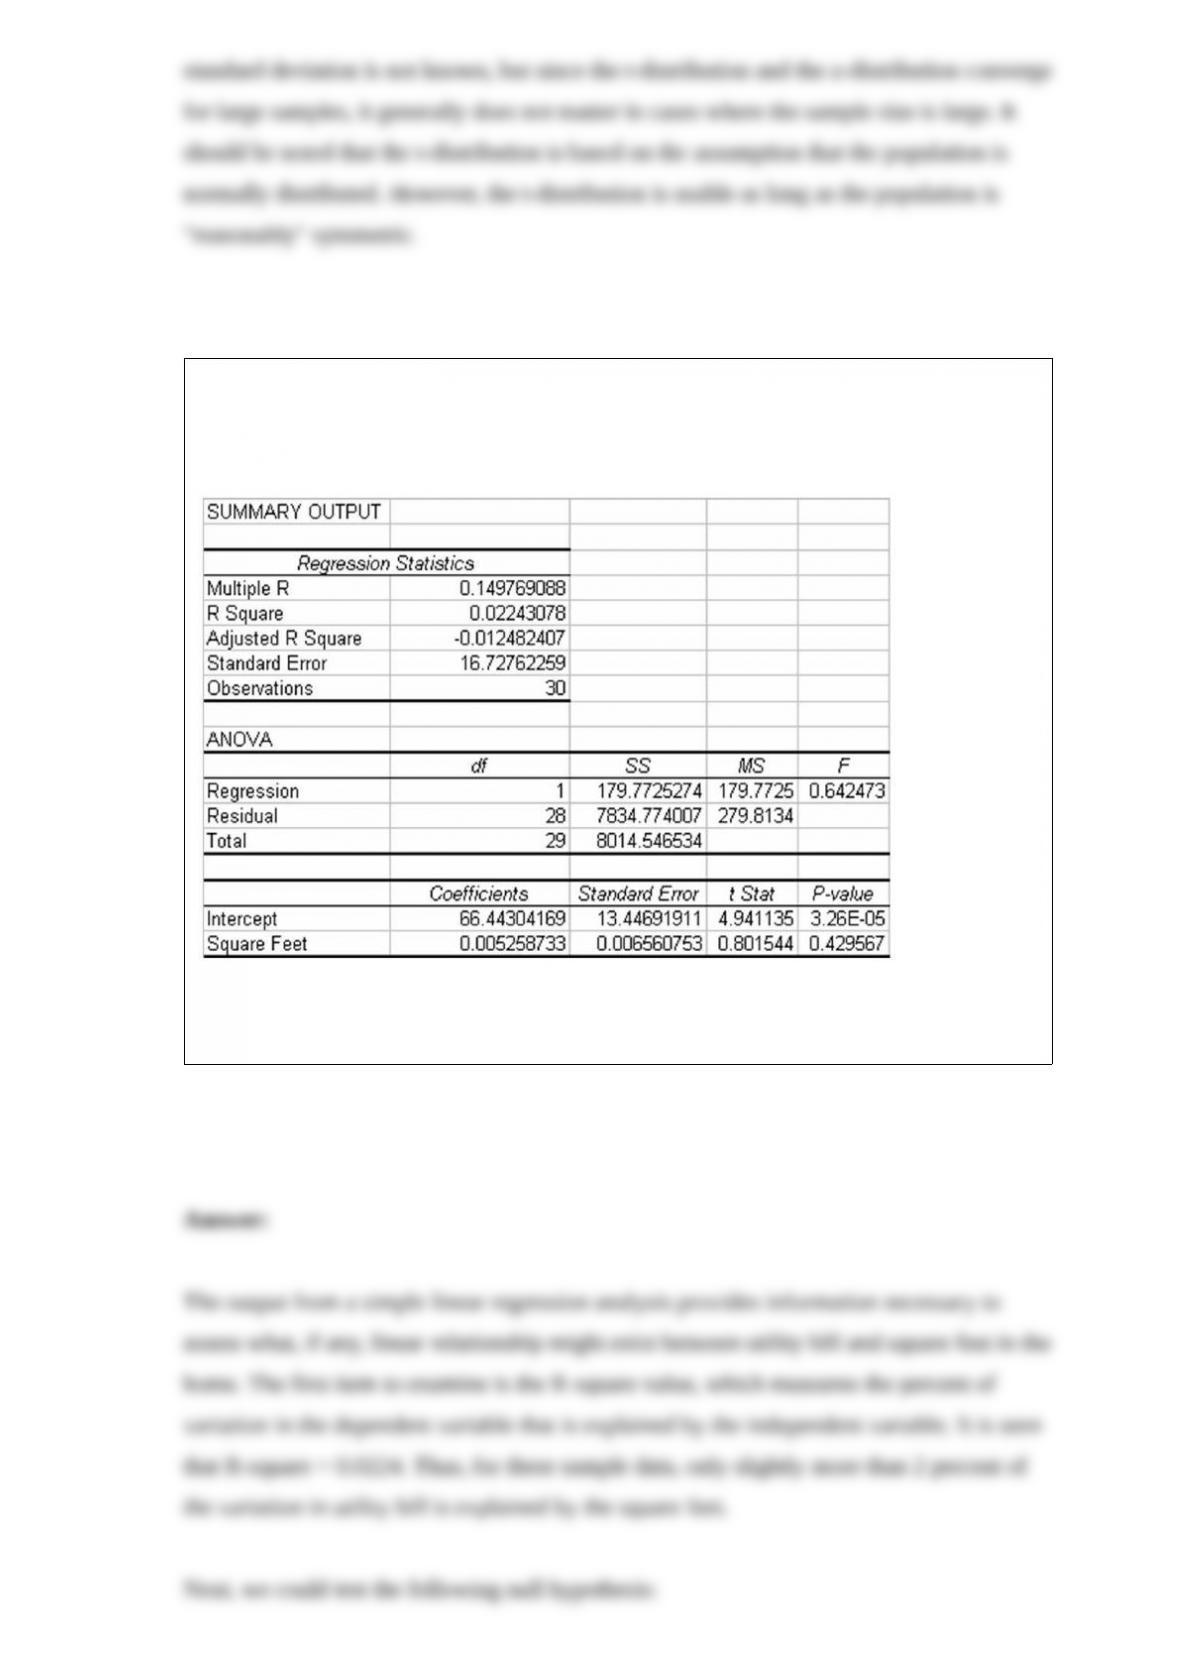
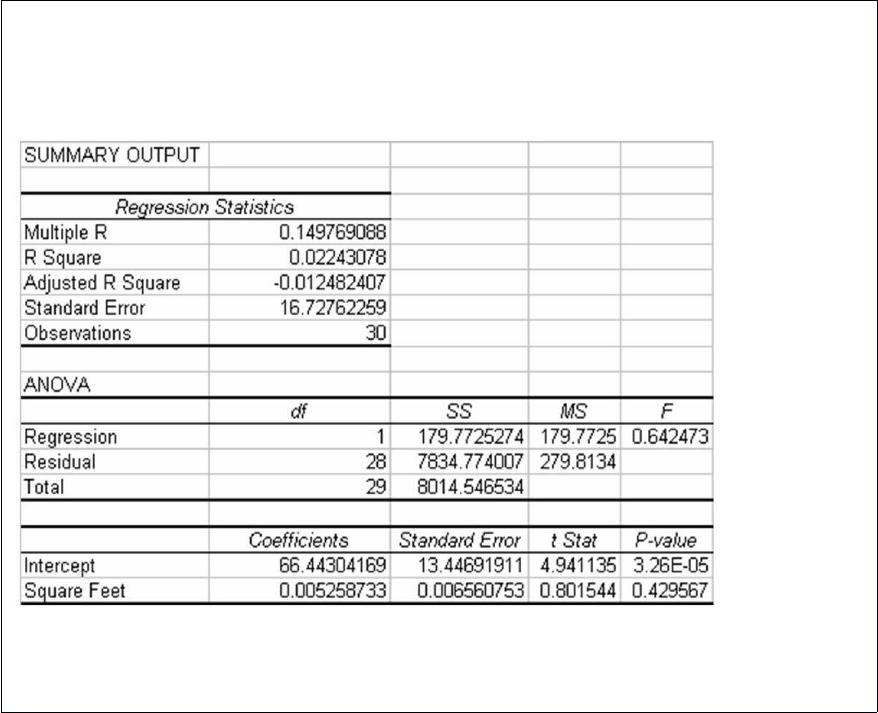
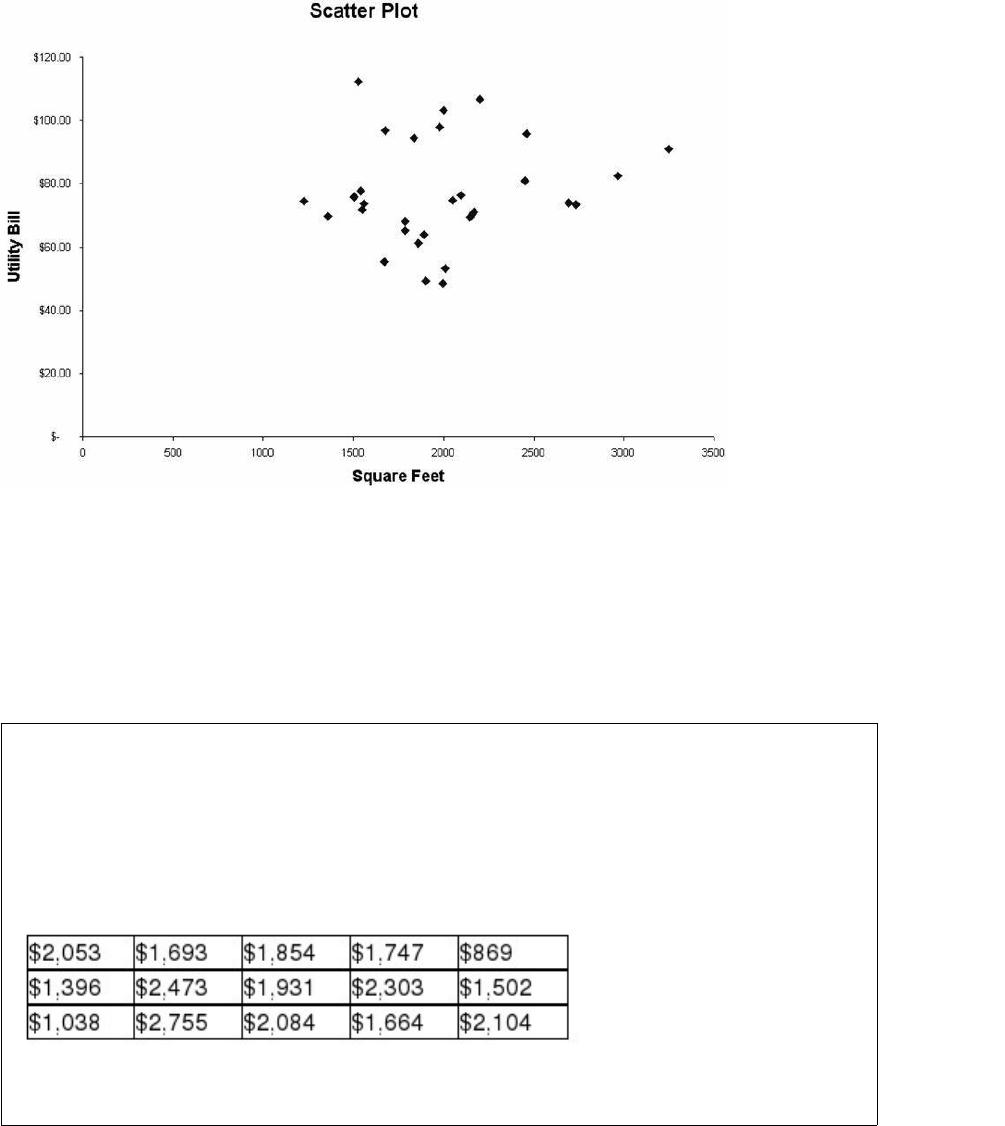
The Public Utility Commission in a southern state is interested in describing the
relationship between household monthly utility bills and the size of the house. A recent
study of 30 randomly selected household resulted in the following regression results:
Based on the information provided, indicate what, if any, conclusions can be reached
about the relationship between utility bill and the size of the house in square feet.

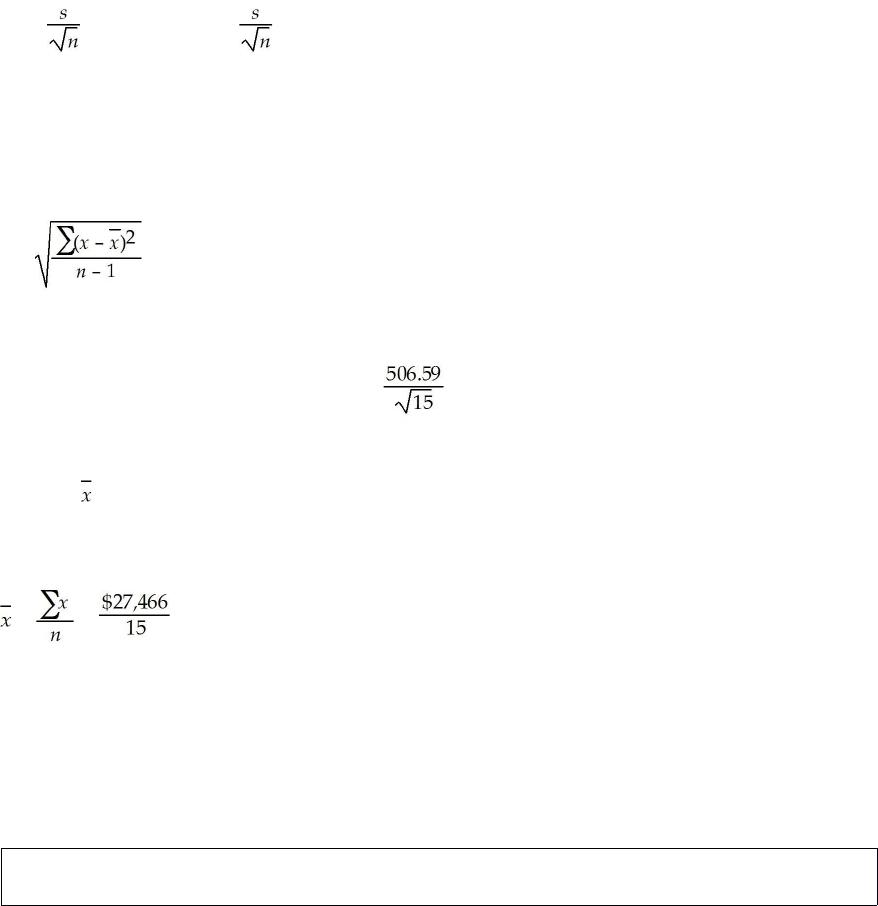
If a real estate market is strong there will be a close relationship between the asking
price for homes and the selling price. Suppose that one analyst believes that the mean
difference between asking price and selling price for homes in a particular market area
is less than $2,000. To test this using an alpha level equal to 0.05, a random sample of n
= 15 homes that have sold recently was selected. The sample differences between
asking price and selling price are in the following table:
Based on these sample data, what is the critical value expressed in dollars?
What are the assumptions for a one-way analysis of variance design?

Explain the relationship between control limits and specification limits.