Process control charts are used to provide signals to indicate when the output of a
process is out of control.
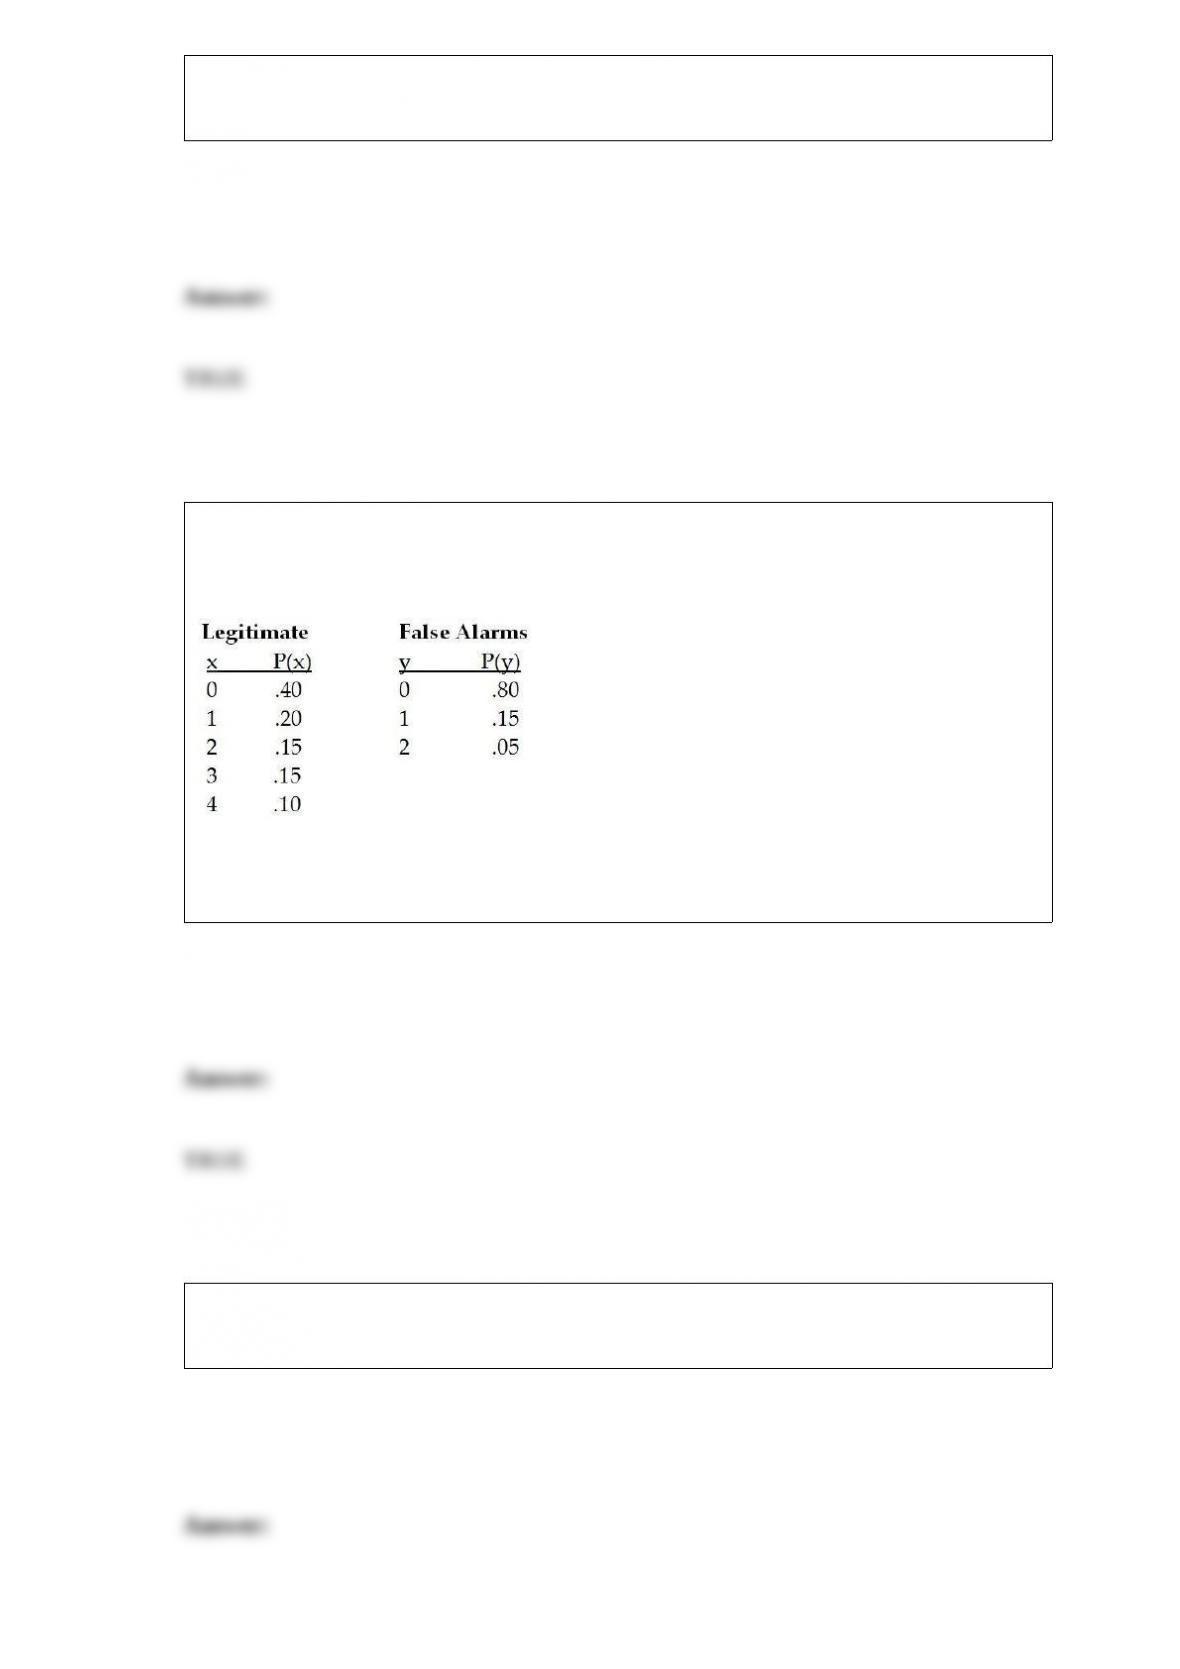
In a Florida town, the probability distribution for the number of legitimate emergency
calls per day for the Fire Department is given as follows. Also shown is the probability
distribution for the number of false alarms:
Given this information, the expected number of total calls to the fire department is 1.60
calls.
In a simple regression model, the slope coefficient represents the average change in the
independent variable for a one-unit change in the dependent variable.
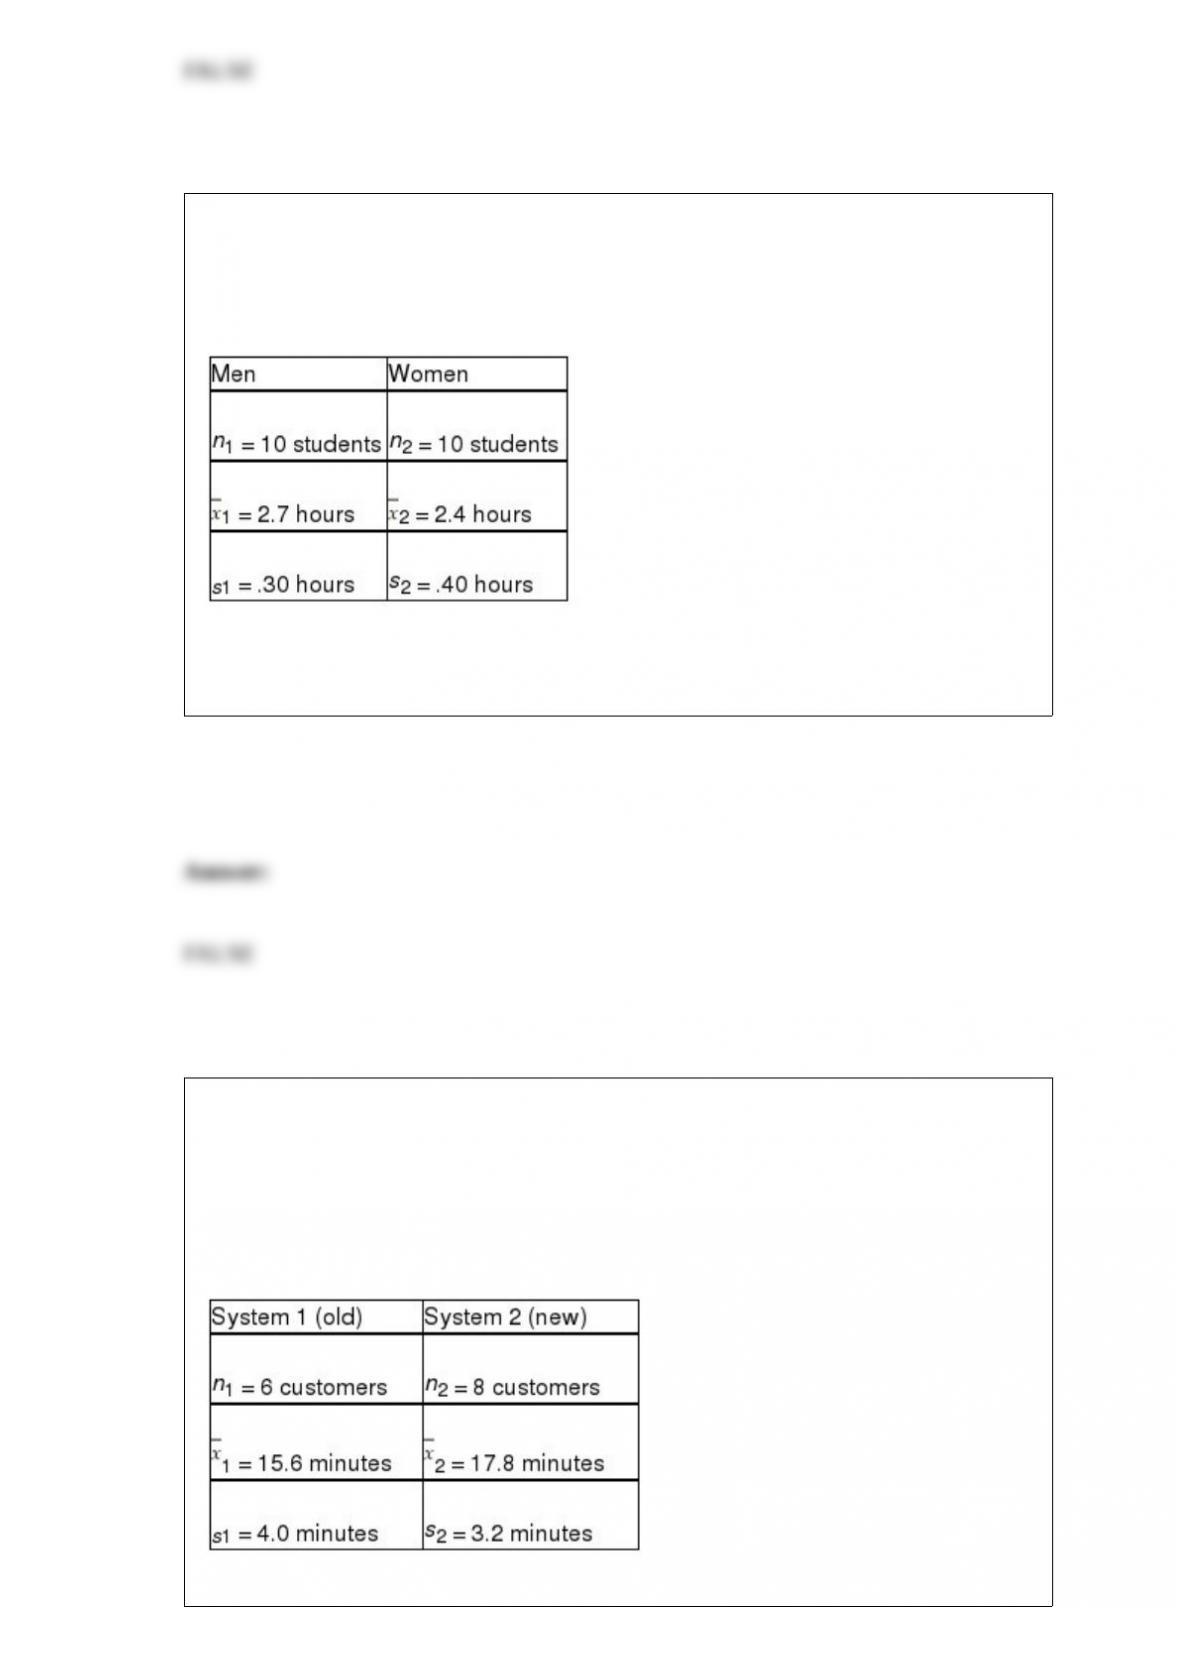
The NCAA is interested in estimating the difference in mean number of daily training
hours for men and women athletes on college campuses. It wants 95 percent confidence
and will select a sample of 10 men and 10 women for the study. The variances are
assumed equal and the populations normally distributed. The sample results are:
Based on these data, the lower limit for the difference between population means is 0.15
hours.
One of the key quality characteristics in many service environments is that the variation
in service time be reasonably small. Recently, a major amusement park company
initiated a new line system at one of its parks. It then wished to compare this new
system with the old system in place at a comparable park in another state. At issue is
whether the standard deviation in waiting time is less under the new line system than
under the old line system. The following information was collected:
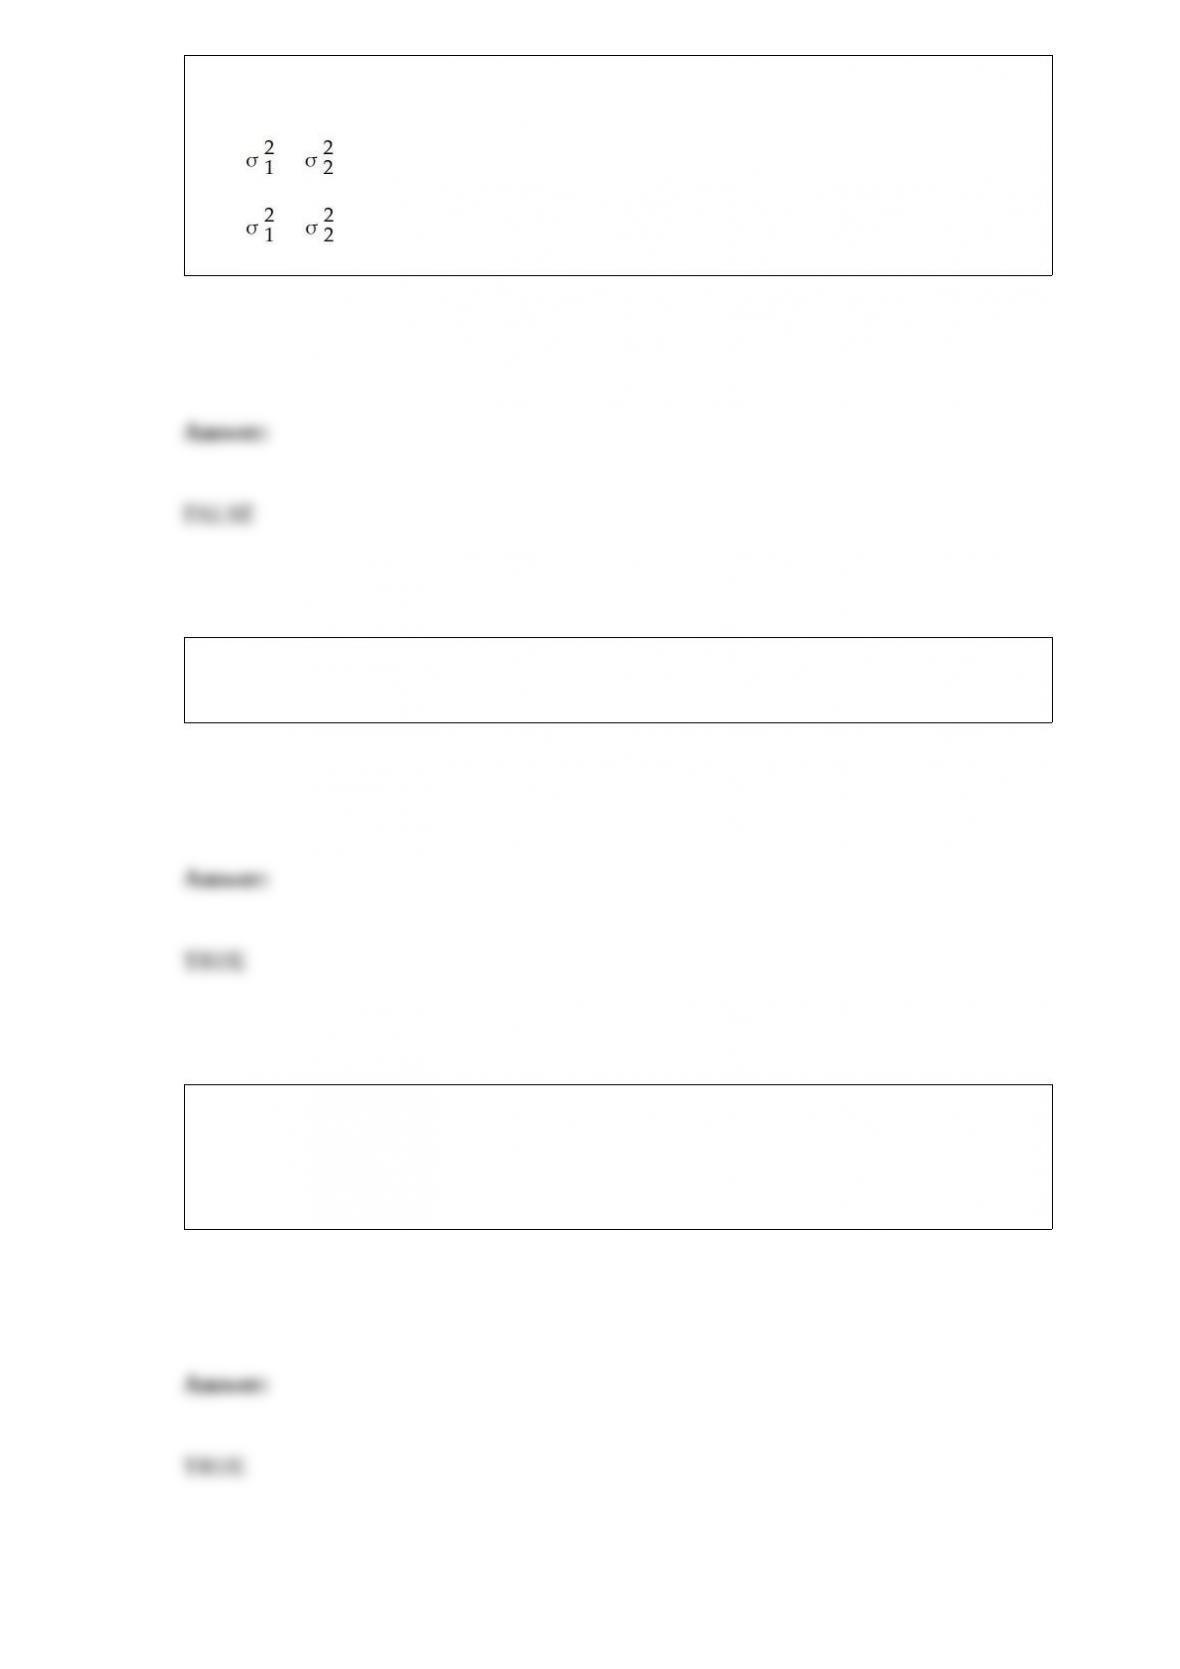
Assuming that it wishes to conduct the test using a 0.05 level of significance, the
correct null and alternative hypotheses would be:
H0 : ≠
Ha : =
Two football teams play in the Super Bowl. The event of team A winning and the event
of team B winning can be said to be mutually exclusive.
A New Jersey company relies on a steady supply of power to keep its manufacturing
going. Recently at a planning meeting, the general manager stated that the chance of a
rolling blackout affecting production is 0.15. She most likely made this assessment
using subjective probability assessment.
If you are sampling from a very large population, a doubling of the sample size will
reduce the standard error of the sampling distribution by one-fourth.
The Tukey-Kramer method for multiple comparison is used after the analysis of
variance F-test has lead us to reject the null hypothesis that all population means are
equal.
Selection bias occurs when the respondent decides which of the questions on the survey
to answer.
A construction company has found it has a probability of 0.10 of winning each time it
bids on a project. The probability of winning a given number of projects out of 12 bids
could be determined with a binomial distribution.

If you wish to construct a graph of a relative frequency distribution, you would most
likely construct an ogive.
One of the nation’s biggest regional airlines has tracked 4,000 landings and take-offs
during the past month. Treating these data as the population of interest, the company
found that the average time the planes spent on the ground (called the turn time) was
17.23 minutes with a standard deviation of 3.79 minutes. Further, they determined that
the distribution of turn times is normally distributed. Then, the probability that a single
turn time selected at random from this population would exceed 20 minutes is
approximately 0.2327.
A scatter plot is useful for identifying a linear relationship between the independent and
dependent variable, but it is not particularly useful if the relationship is curvilinear.
The number of cells in a two-factor analysis of variance design is equal to the number
of levels of factor A plus the number of levels of factor B.
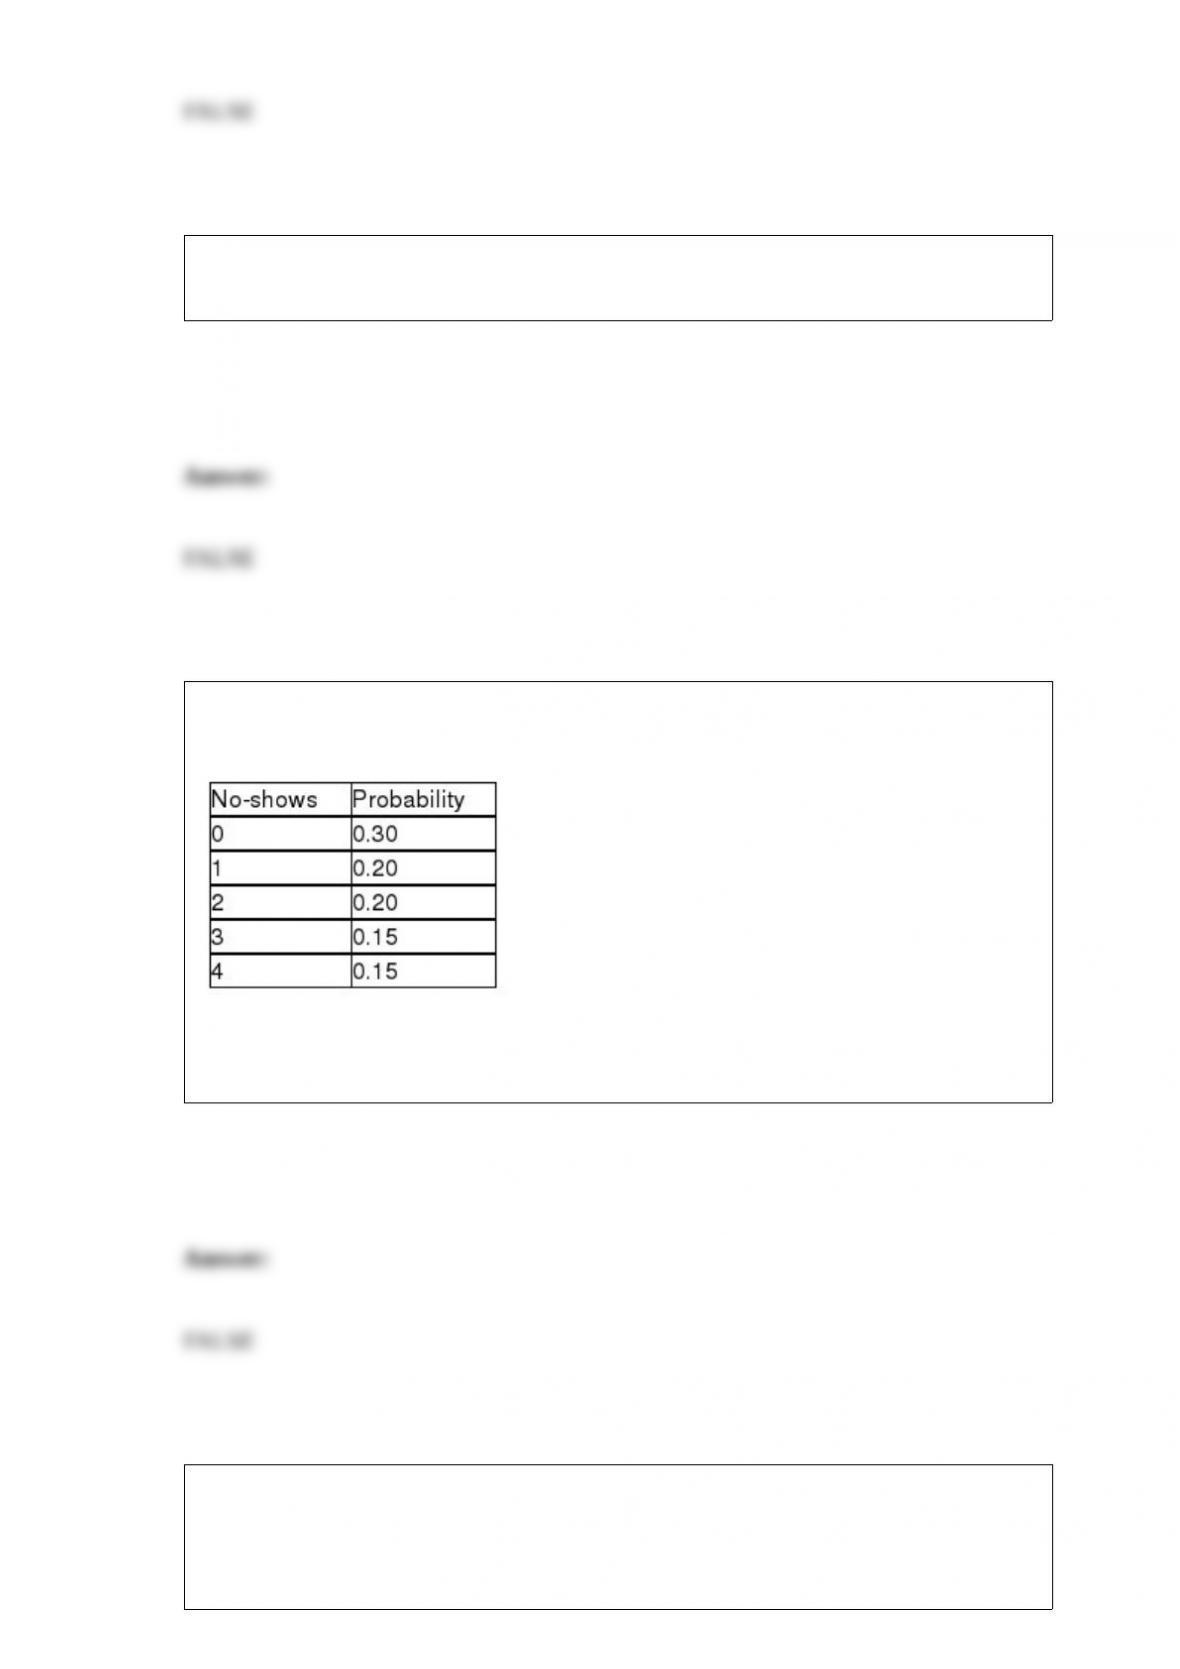
The number of no-shows each day for dinner reservations at the Cottonwood Grille is a
discrete random variable with the following probability distribution:
Based on this information, the standard deviation for the number of no-shows is about
0.36 customers.
To check out whether the regression assumption involving normality of the error terms
is valid, it is appropriate to construct a normal probability plot. If this plot forms a
straight line from the lower left-hand corner diagonally up to the upper right-hand
corner, the error terms may be assumed to be normally distributed.
In a contingency analysis, we expect the actual frequencies in each cell to
approximately match the corresponding expected cell frequencies when H0 is true.
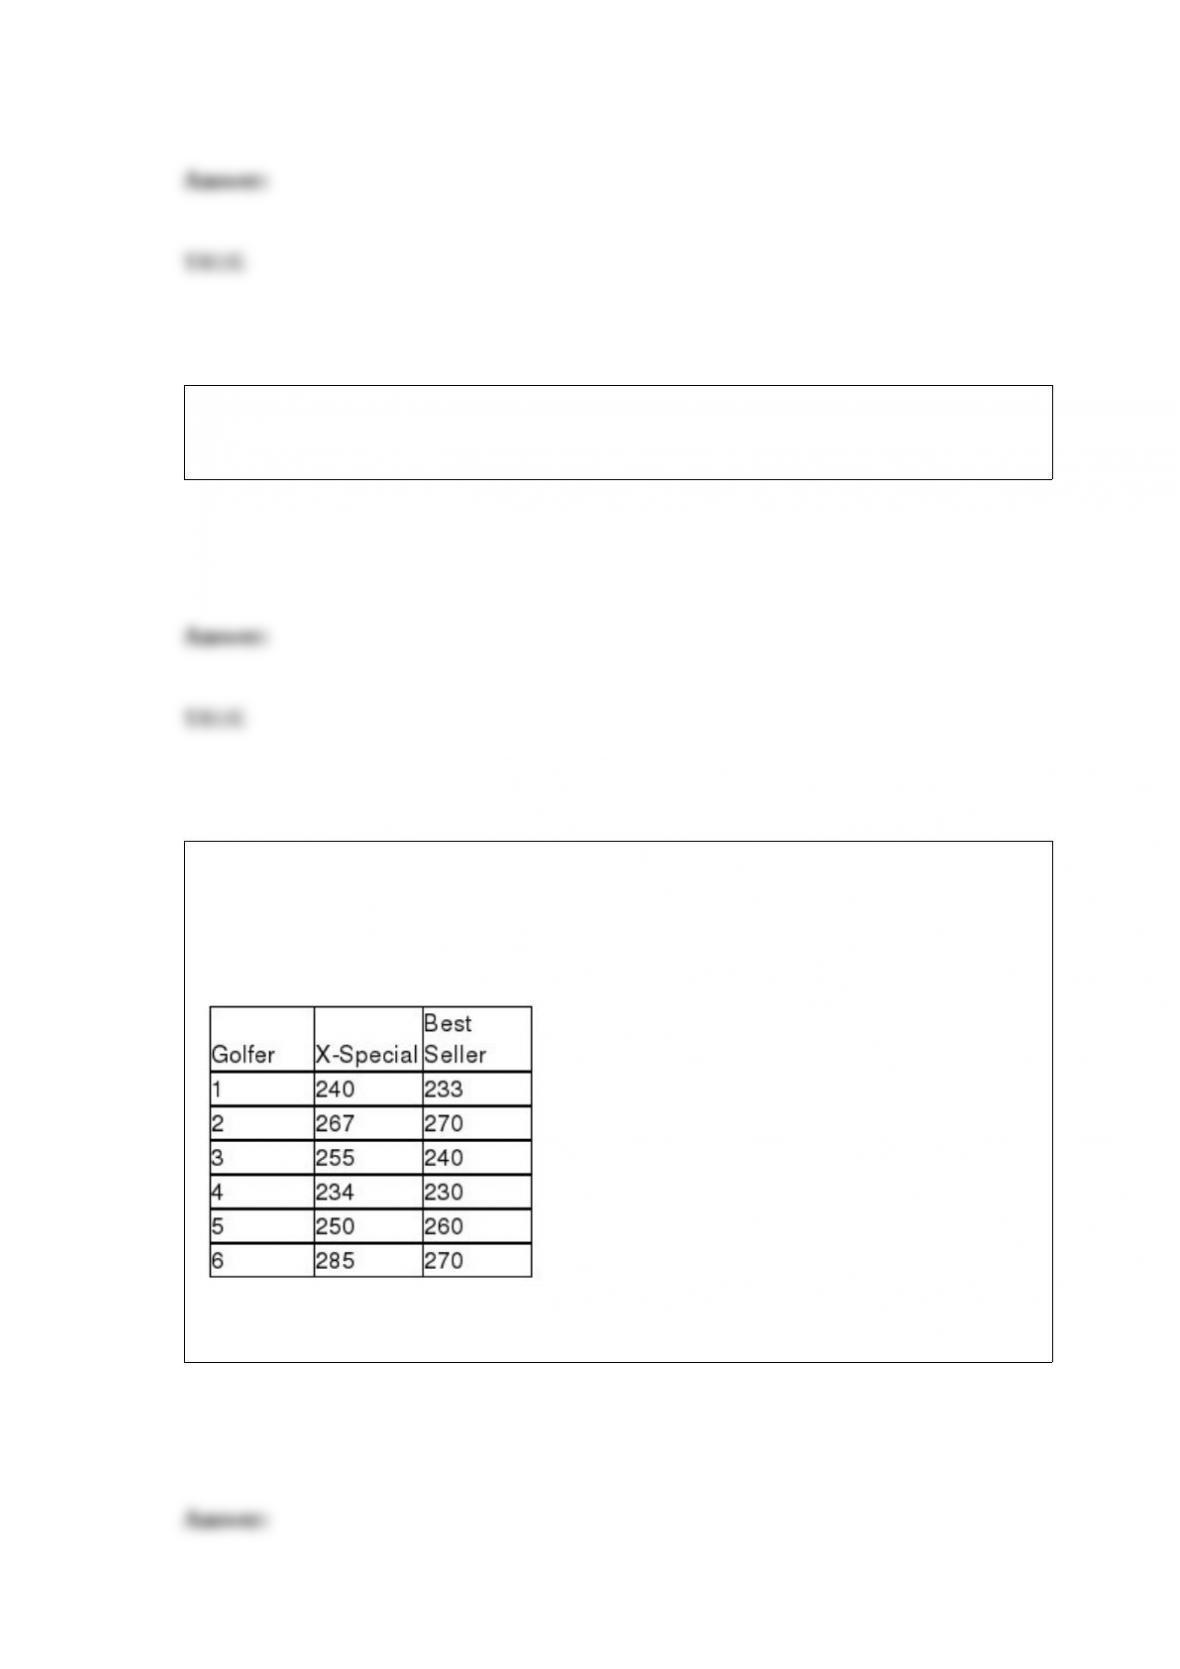
In order to determine whether the median distance for the X-Special golf ball exceeds
the median distance for the best-selling golf ball, six golfers were selected and asked to
hit each ball with their driver. The distance was recorded. The following data were
observed.
Based on these, the appropriate test is the Kruskal-Wallis one-way analysis of variance.

When conducting a hypothesis test to determine whether or not two groups differ, using
paired samples rather than independent samples has the advantage of controlling for
sources of variation that might distort the conclusions of the study.
A process control chart can be used to determine whether the process average has
shifted up or down, but is not useful for determining whether the process is just drifting
in an upward or downward direction.
In a hypothesis test, the p-value measures the probability that the alternative hypothesis
is true.
In a multiple regression analysis with three independent variables the null hypothesis
for conducting the test of the overall model is:
H0: β0= β1= β2= β3= 0.
If the population is not normally distributed, the t-distribution cannot be used.
A 95 percent confidence interval estimate will have a margin of error that is
approximately 95 percent of the size of the population mean.
A major car magazine has recently collected data on 30 leading cars in the U.S. market.
It is interested in building a multiple regression model to explain the variation in
highway miles. The following correlation matrix has been computed from the data
collected:
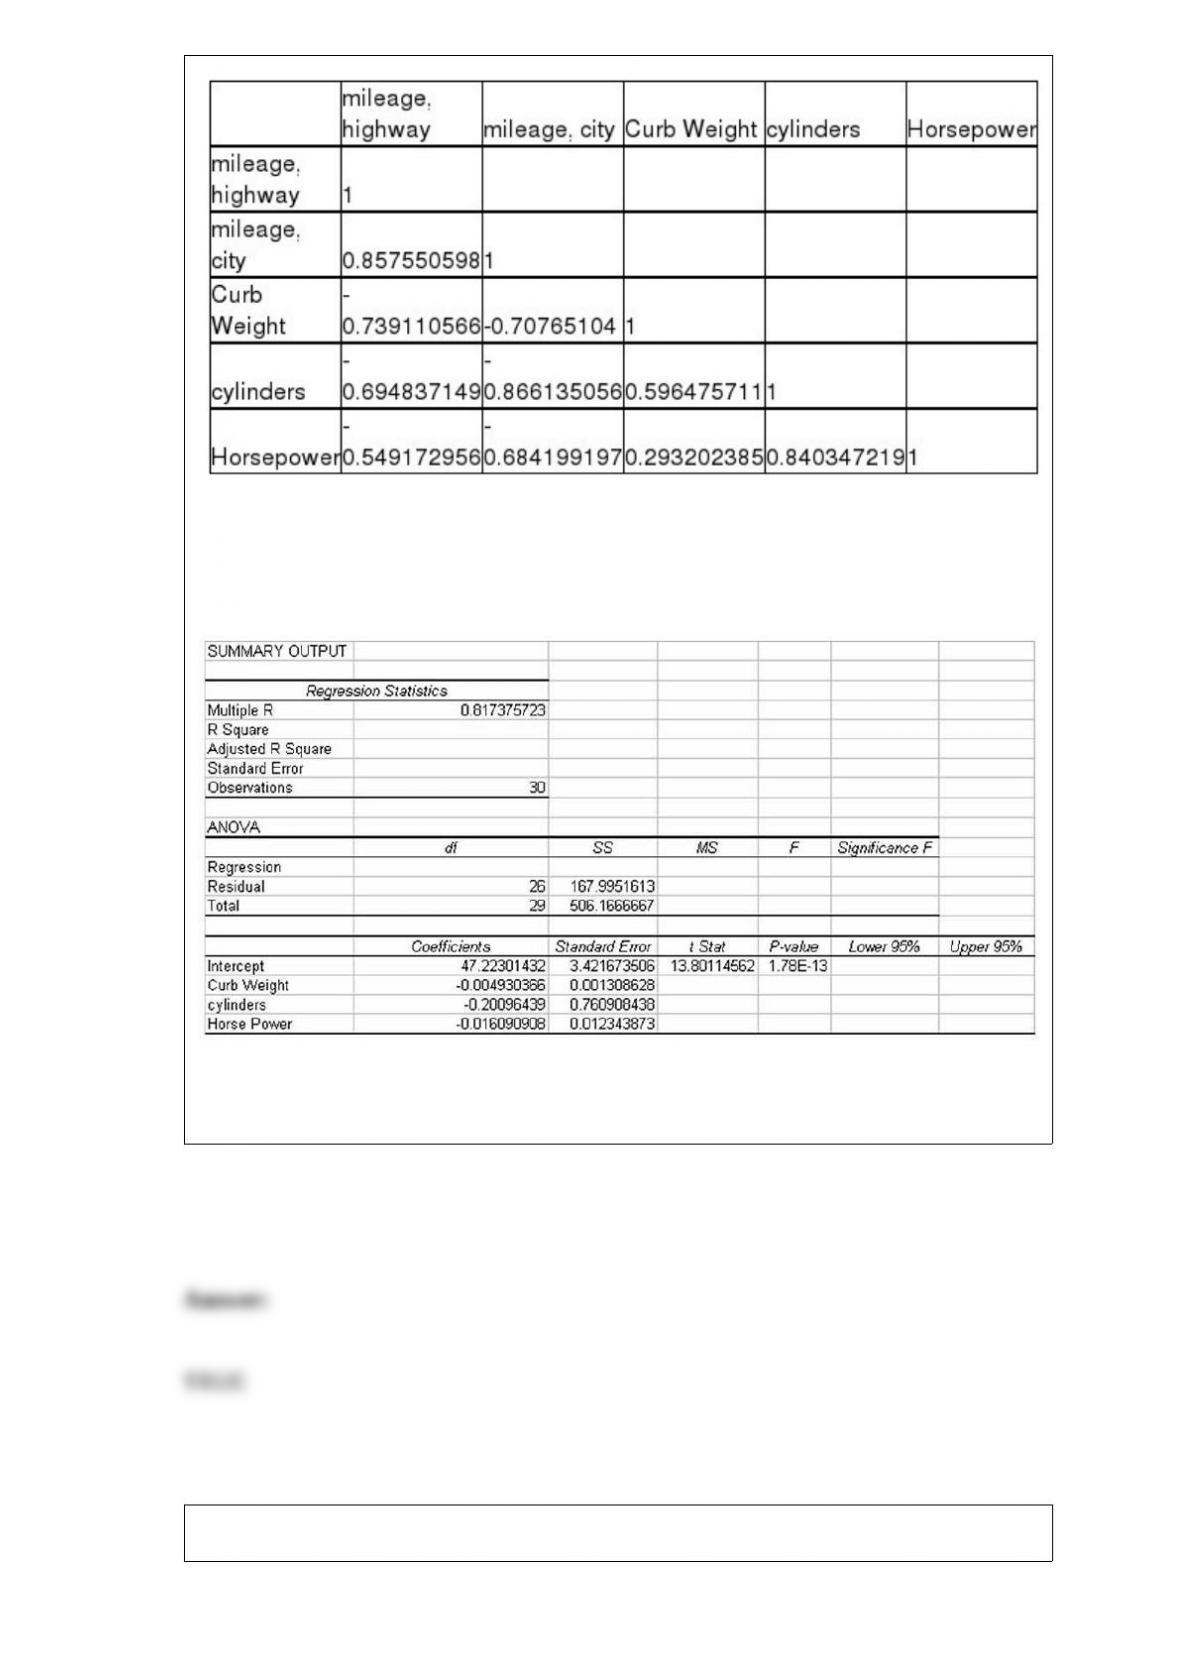
The analysts also produced the following multiple regression output using curb weight,
cylinders, and horsepower as the three independent variables. Note, a number of the
output fields are missing, but can be determined from the information provided.
Based on the above information, the test statistic for testing whether the overall model
is statistically significant is approximately F = 17.4
All symmetric distributions can be assumed normally distributed.
Suppose a professor collects survey data by passing out surveys in his/her classes,
where the population of interest is defined as all students enrolled at that university.
This is an example of nonstatistical sampling technique.
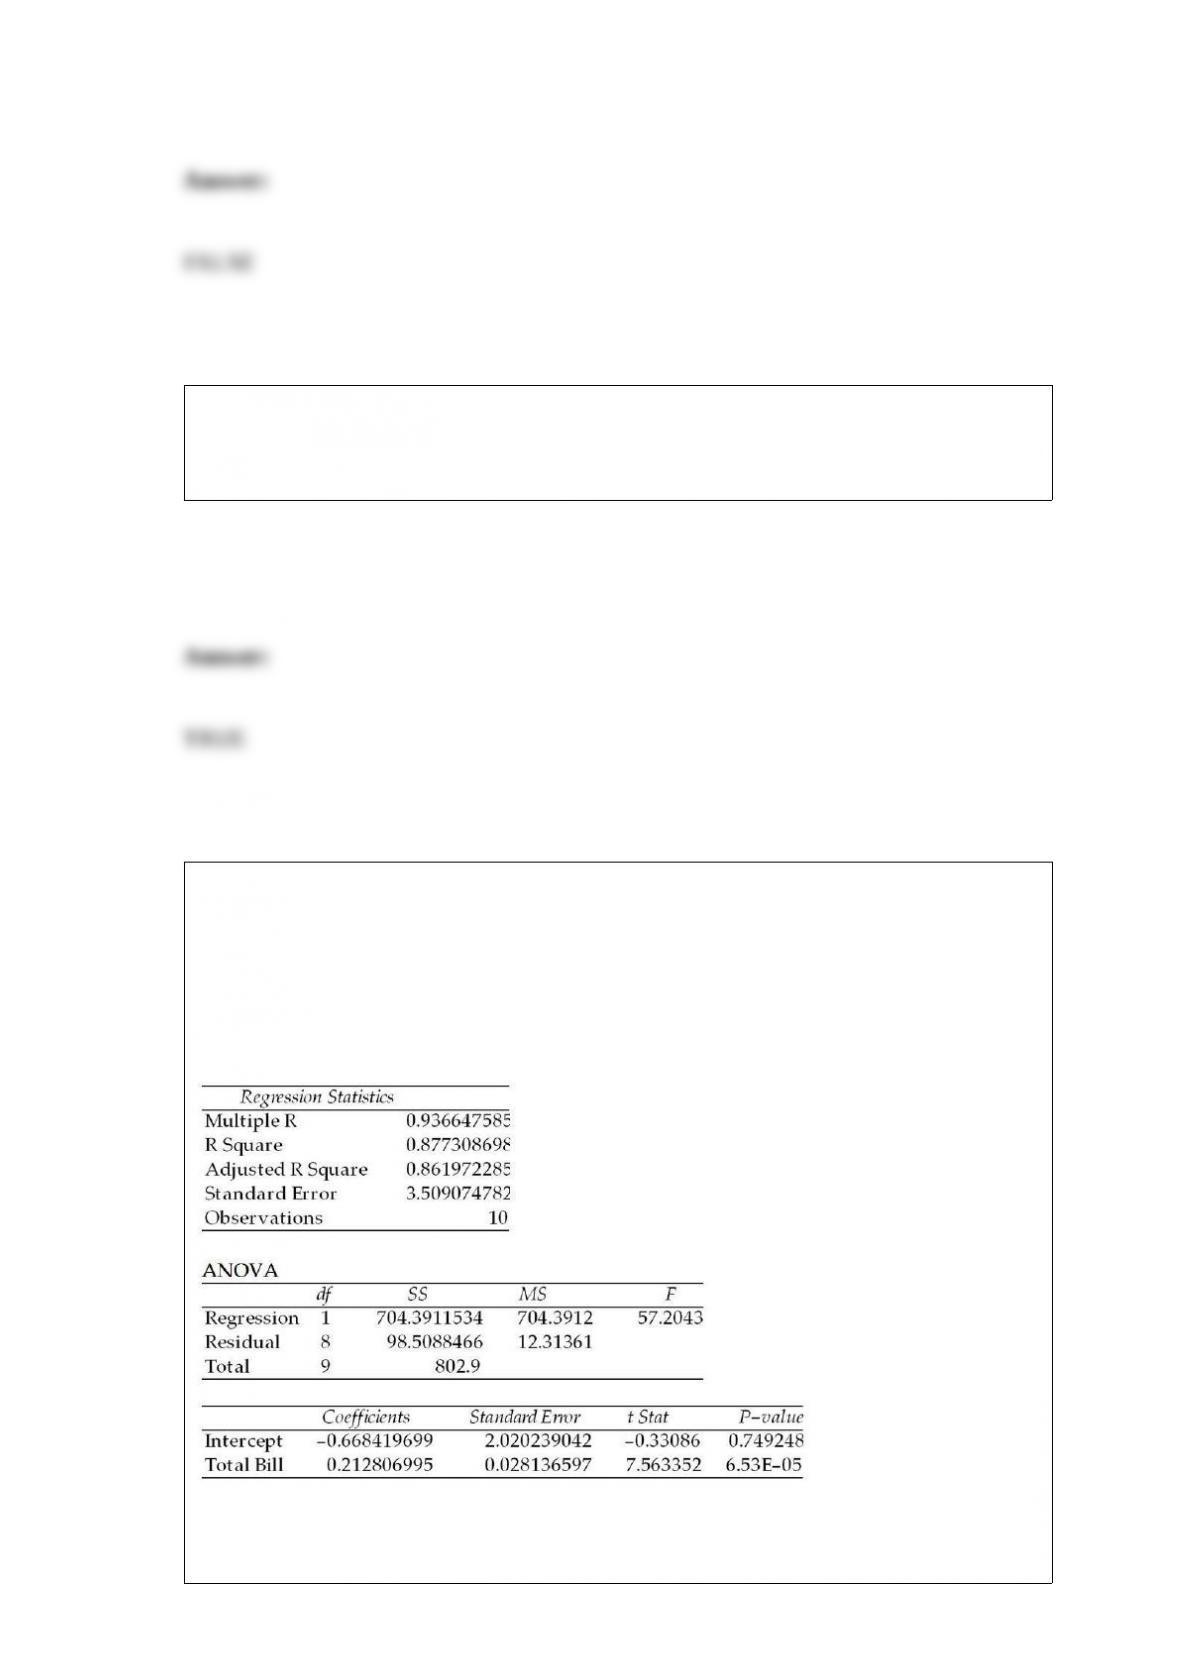
A study was recently performed by the Internal Revenue Service to determine how
much tip income waiters and waitresses should make based on the size of the bill at
each table. A random sample of bills and resulting tips were collected and the following
regression results were observed:
SUMMARY OUTPUT
Given this output, the upper limit for the 95 percent confidence interval estimate for the
true regression slope coefficient is approximately 0.28.

The random variable, number of customers entering a store between 9 AM and noon, is
an example of a discrete random variable.
Mutually exclusive means that the occurrence of event A has no effect on the
probability of the occurrence of event B, and independent means the occurrence of
event A prevents the occurrence of event B.
In a test for determining whether two population variances are the same or different, the
larger the sample sizes from the two populations, the lower will be the chance of
making a Type I statistical error.

The manager in charge of concessions at an NFL football stadium is interested in
estimating the mean dollars that are spent per person attending the games. A pilot
sample of n = 50 people has revealed a sample mean and standard deviation of $12.35
and $2.35 respectively. He wishes to estimate the population mean within $0.20 of the
true mean and wishes to have a confidence level of 95 percent. Given this, he needs to
sample an additional 481 people.
When a decision maker determines the required sample size for estimating a population
mean, a change in the confidence level will result in a change in the required sample
size, provided that the margin of error is also modified accordingly.
A test is conducted to compare three different income tax software packages to
determine whether there is any difference in the average time it takes to prepare income
tax returns using the three different software packages. Ten different person’s income
tax returns are done by each of the three software packages and the time is recorded for
each. Given this format and testing using an alpha level equal to 0.05, the critical value
associated with the primary hypothesis test is:
A) 3.555
B) 2.456
C) 19.385
D) 4.256
Suppose we want to test H0 : μ ≥ 30 versus H1 : μ < 30. Which of the following
possible sample results based on a sample of size 36 gives the strongest evidence to
reject H0 in favor of H1?
A) = 28, s = 6
B) = 27, s = 4
C) = 32, s = 2
D) = 26, s = 9
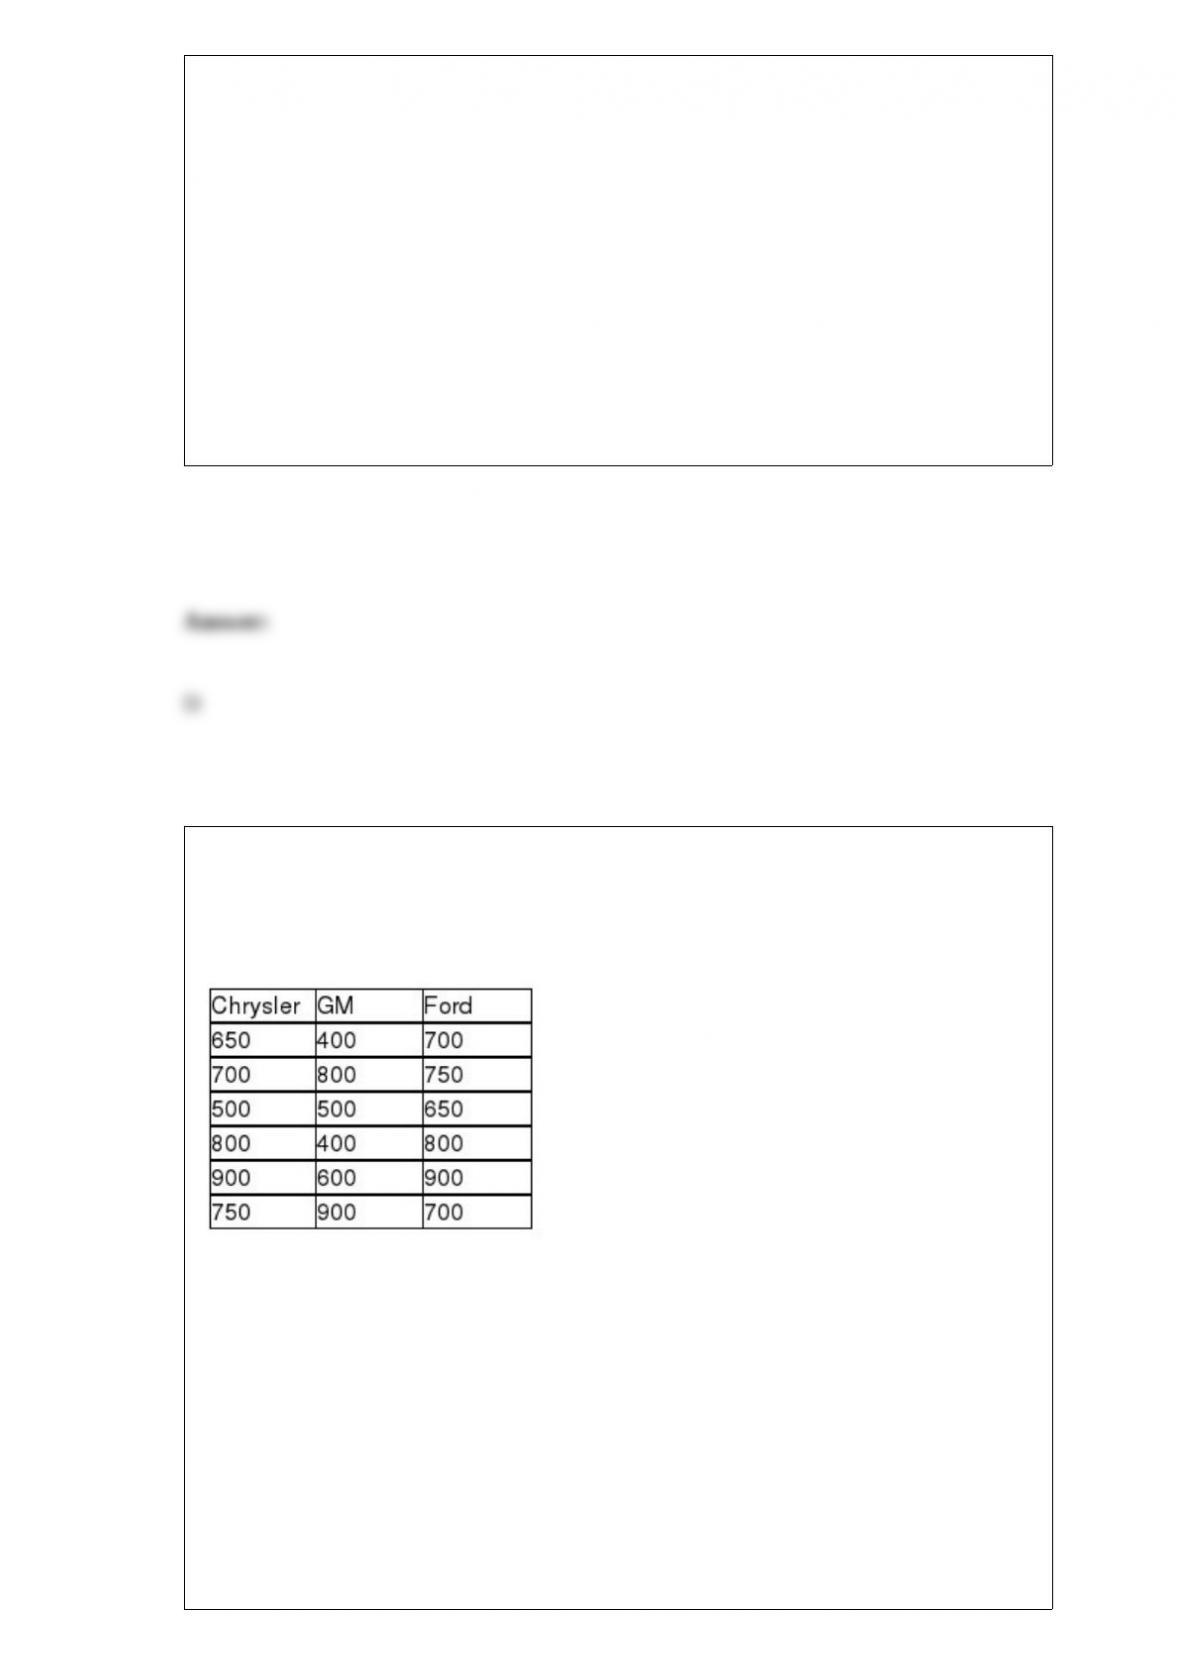
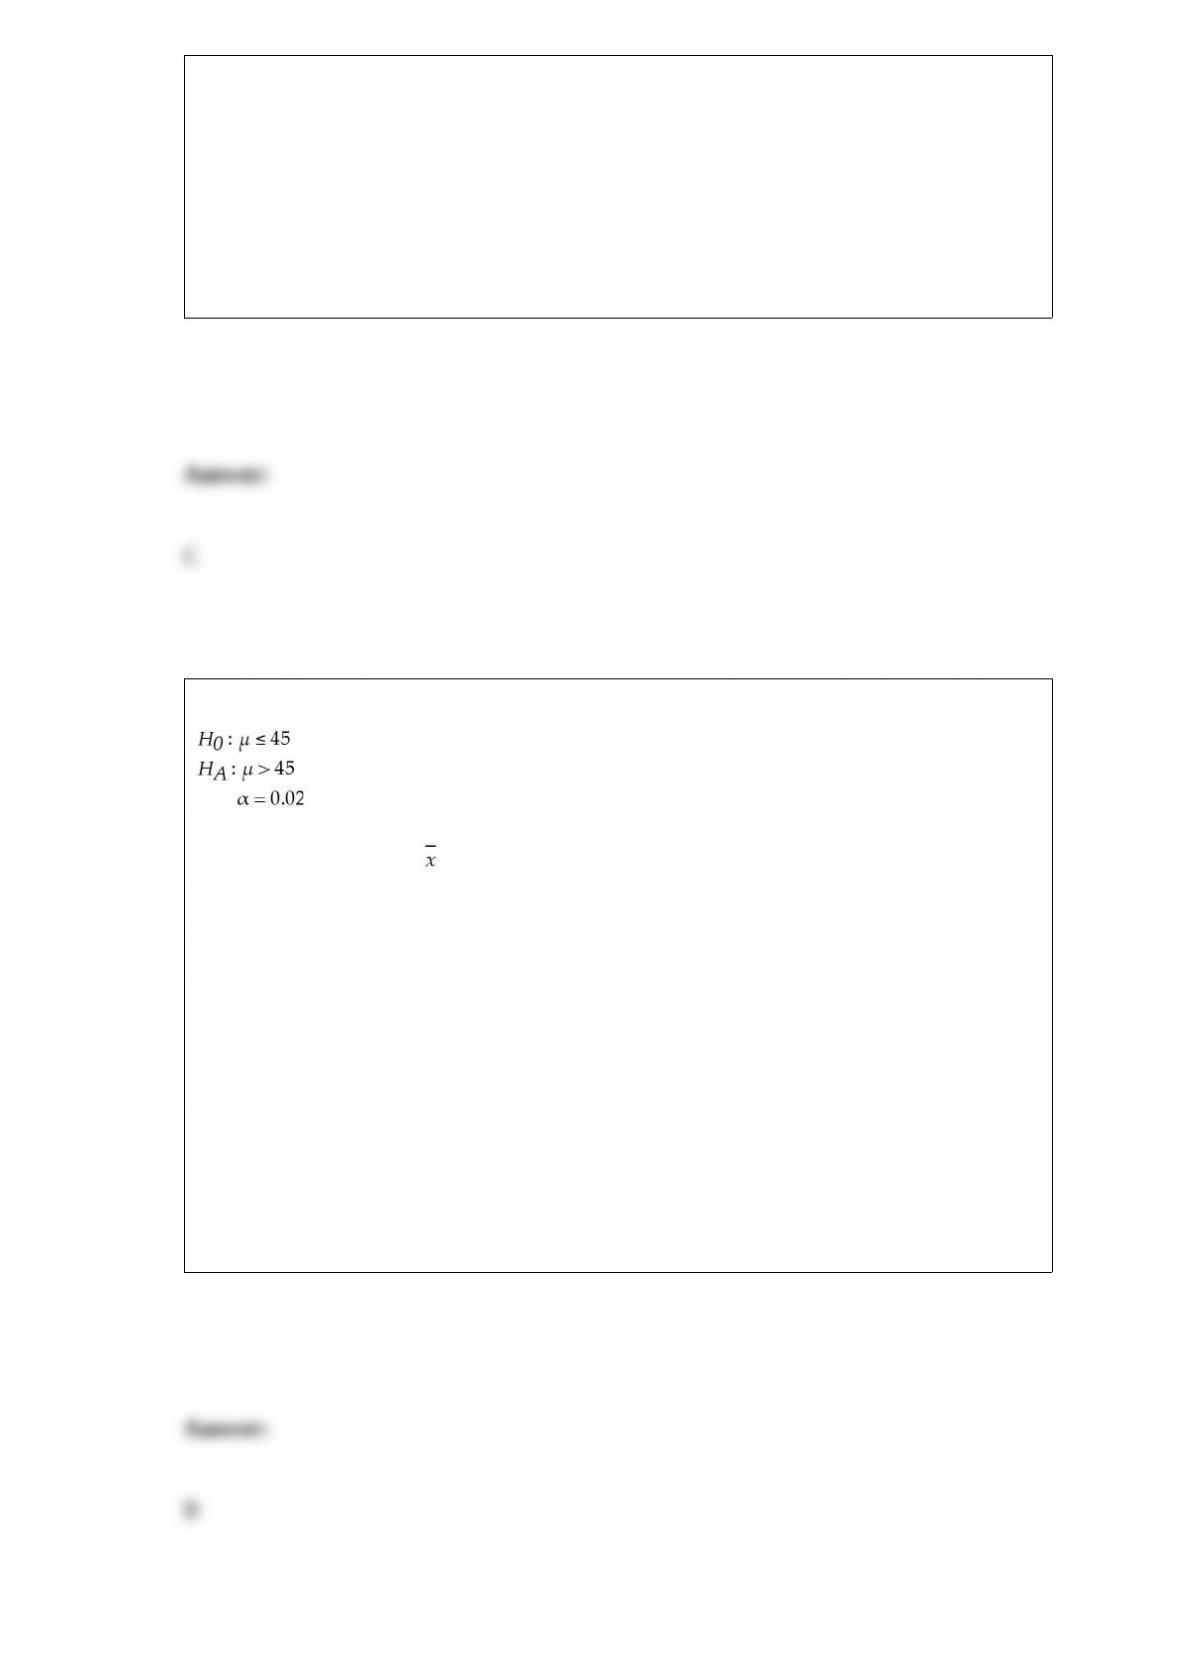
For the following hypothesis test:
With n = 80, σ = 9, and = 47.1, state the conclusion.
A) Because the computed value of z = 3.012 is greater than 2.05, accept the null
hypothesis and conclude the mean is greater than 45. Also because the p-value is less
than 0.02
B) Because the computed value of z = 3.012 is greater than 2.05, reject the null
hypothesis and conclude the mean is greater than 45. Also because the p-value is less
than 0.02
C) Because the computed value of z = 2.087 is greater than 2.05, accept the null
hypothesis and conclude the mean is greater than 45. Also because the p-value is less
than 0.02
D) Because the computed value of z = 2.087 is greater than 2.05, reject the null
hypothesis and conclude the mean is greater than 45. Also because the p-value is less
than 0.02
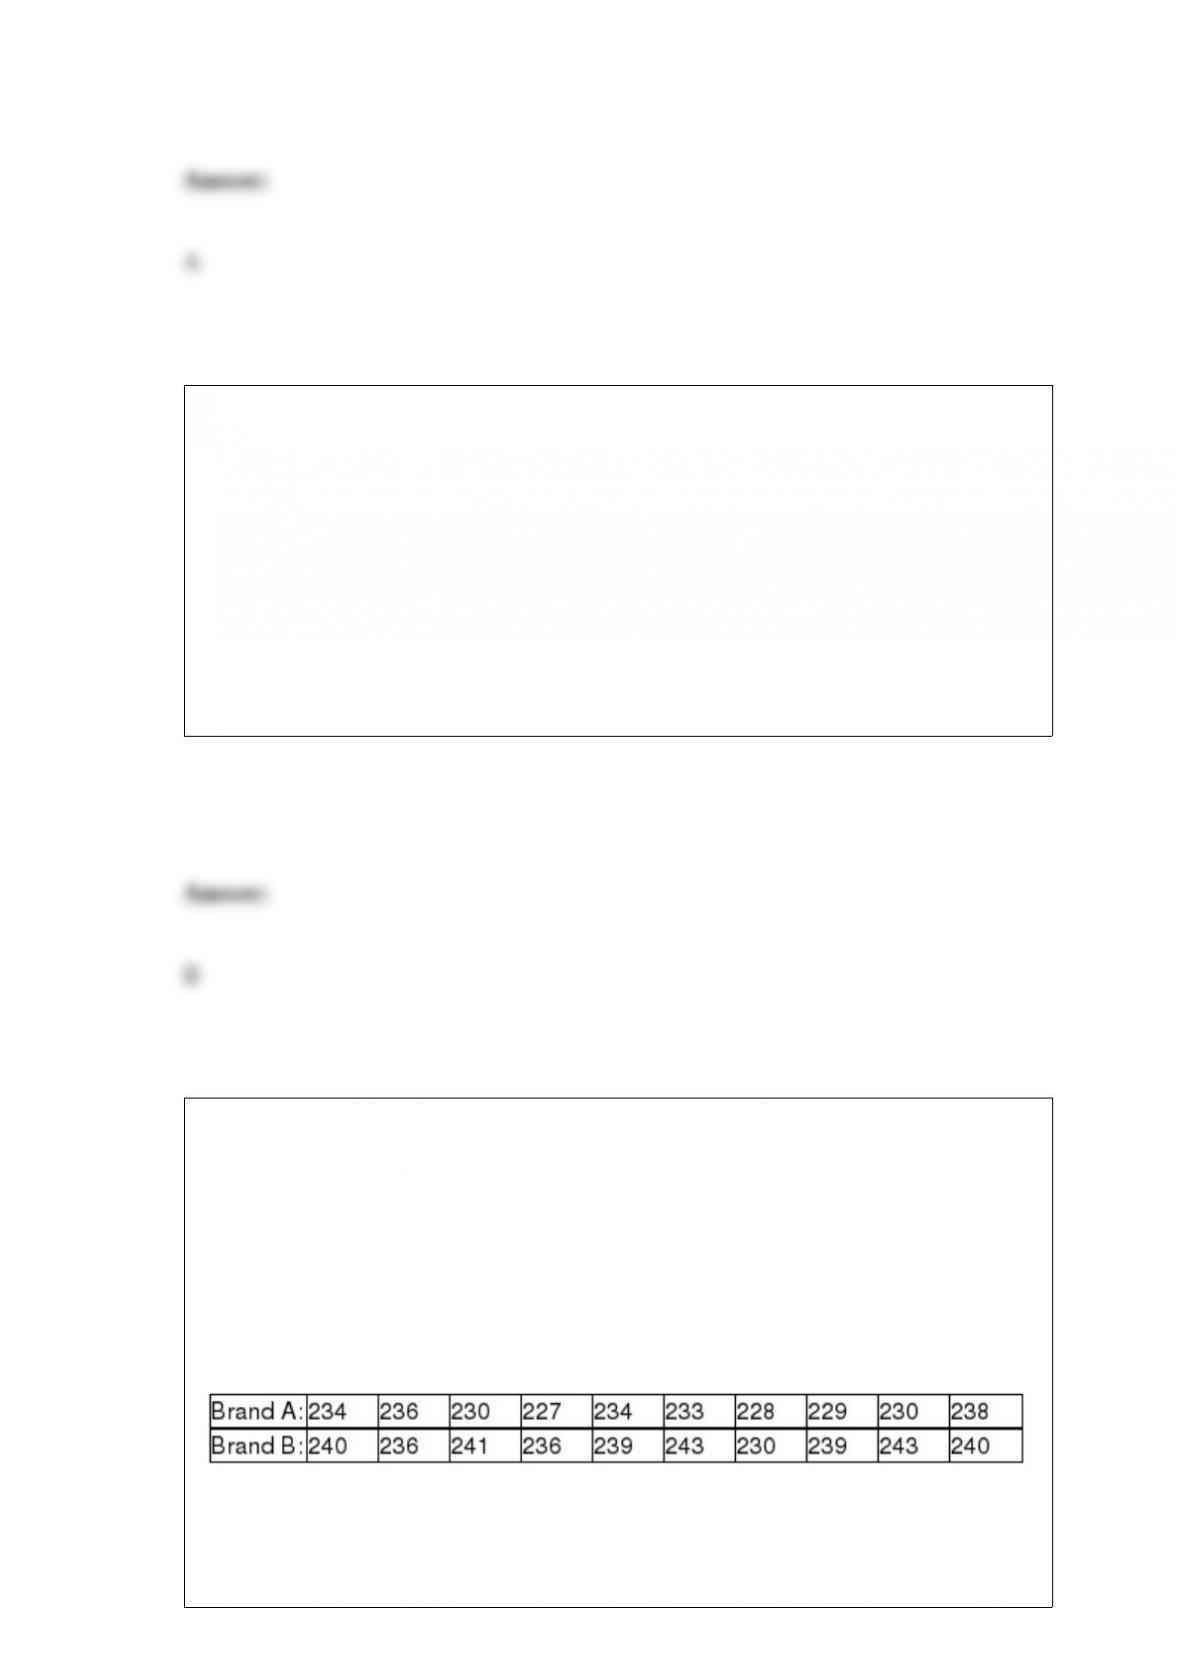
A survey was recently conducted in which random samples of car owners of Chrysler,
GM, and Ford cars were surveyed to determine their satisfaction. Each owner was
asked to rate overall satisfaction on a scale of 1 (poor) to 1000 (excellent). The
following data were recorded:
If the analysts are not willing to assume that the population ratings are normally
distributed and will use the Kruskal-Wallis test to determine if the three companies have
different median ratings, what is correct test statistic for these data?
A) H = 1.965
B) t = 1.96
C) H = 3.34
D) H = .65
A random sample of 340 people in Chicago showed that 66 listened to WJKT-1450, a
radio station in South Chicago Heights. Based on this sample information, what is the
point estimate for the proportion of people in Chicago that listen to WJKT-1450?
A) 340
B) About 0.194
C) 1450
D) 66
The U.S. Golf Association provides a number of services for its members. One of these
is the evaluation of golf equipment to make sure that the equipment satisfies the rules of
golf. For example, they regularly test the golf balls made by the various companies that
sell balls in the United States. Recently they undertook a study of two brands of golf
balls with the objective to see whether there is a difference in the mean distance that the
two golf ball brands will fly off the tee. To conduct the test, the U.S.G.A. uses a robot
named “Iron Byron,” which swings the club at the same speed and with the same swing
pattern each time it is used. The following data reflect sample data for a random sample
of balls of each brand.
Given this information, what is the test statistic for testing whether the two population
means are equal?
A) t = 1.115
B) t = 1.96
C) t = -4.04
D) t = -2.58
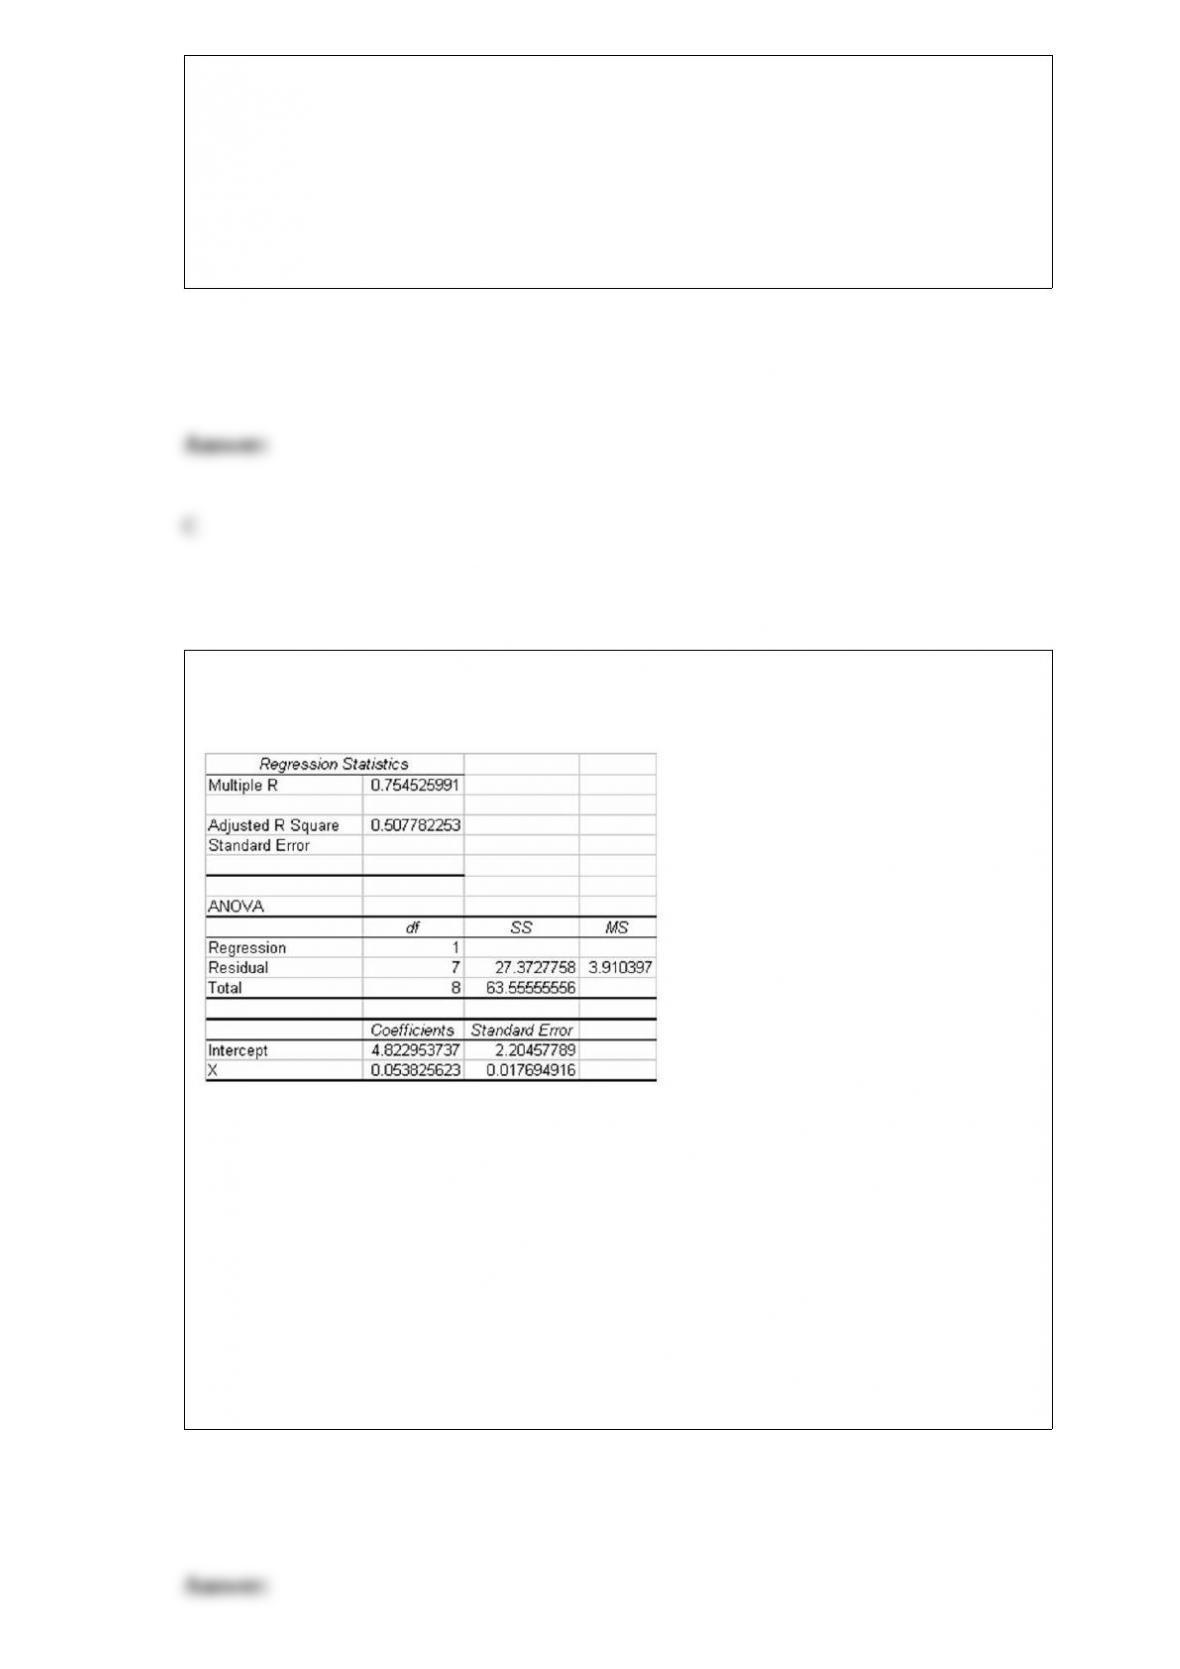
The following regression output is available. Notice that some of the values are
missing.
Given this information, what is the standard error of the estimate for the regression
model?
A) About 36.18
B) Approximately 6.02
C) About 1.98
D) 3.91

Long-time friends, Pat and Tom, agree on many things, but not the outcome of the
American League pennant race and the World Series. Pat is originally from Boston, and
Tom is from New York. They have a steak dinner bet on next year’s race, with Pat
betting on the Red Sox and Tom on the Yankees. Both are convinced they will win.
What probability assessment technique is being used by the two friends?
A) Subjective probability
B) Classical probability
C) Relative frequency probability
D) Independent probability
Six food critics each visited and rated four different restaurants. Each critic visited each
restaurant on three separate occasions and recorded a score for each visit. The correct
method for analyzing this data is two-factor ANOVA.
A study was conducted to determine if differences in new textbook prices exist between
on-campus bookstores, off-campus bookstores, and Internet bookstores. To control for
differences in textbook prices that might exist across disciplines, the study randomly
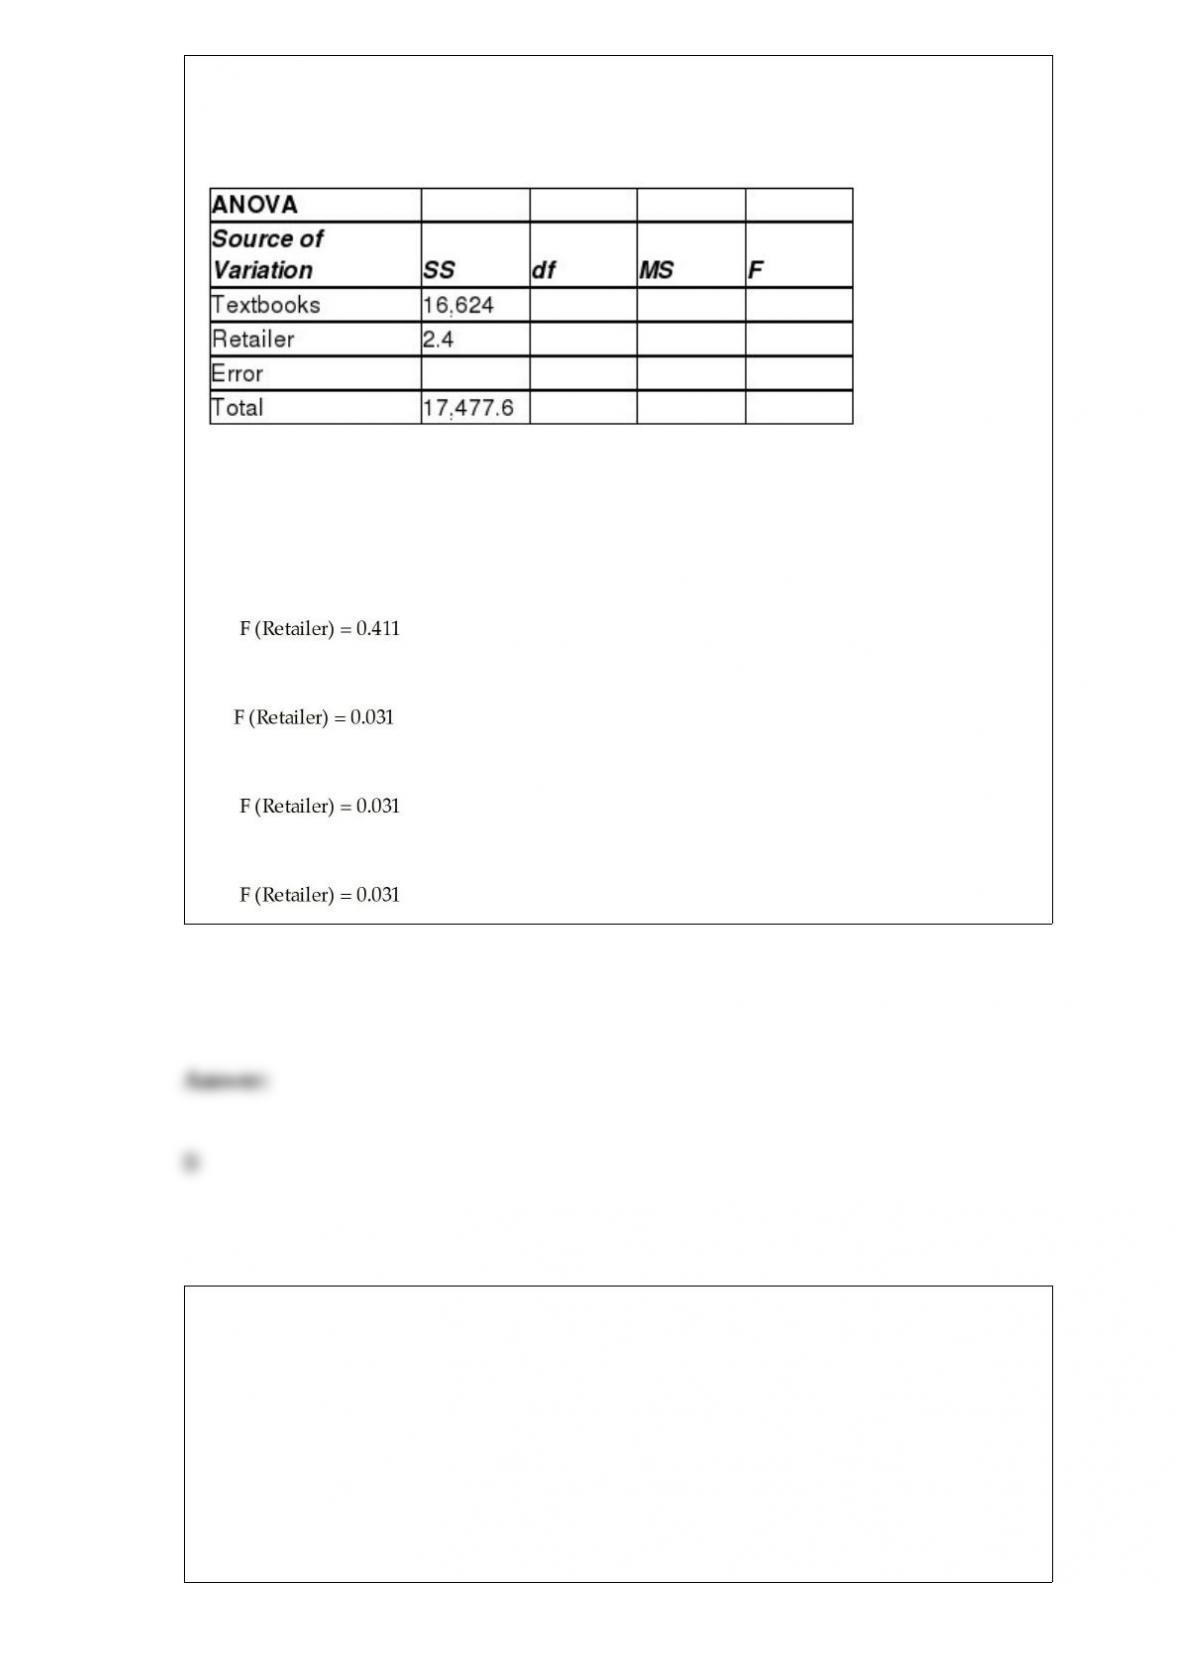
selected 12 textbooks and recorded the price of each of the 12 books at each of the three
retailers. You may assume normality and equal-variance assumptions have been met.
The partially completed ANOVA table based on the study’s findings is shown here:
Complete the ANOVA table by filling in the missing sums of squares, the degrees of
freedom for each source, the mean square, and the calculated F-test statistic for each
possible hypothesis test.
A) Textbooks df = 11, MSBL = 1,511.3, F (Textbooks) = 40.05, Retailer df = 2, MSB =
1.2, , SSW = 851.2, Error df = 22, MSW = 38.7, Total df = 35
B) Textbooks df = 11, MSBL = 1,511.3, F (Textbooks) = 39.05, Retailer df = 2, MSB =
1.2, , SSW = 851.2, Error df = 22, MSW = 38.7, Total df = 35
C) Textbooks df = 12, MSBL = 1,511.3, F (Textbooks) = 39.05, Retailer df = 2, MSB =
1.2, , SSW = 851.2, Error df = 22, MSW = 38.7, Total df = 36
D) Textbooks df = 11, MSBL = 1,511.3, F (Textbooks) = 39.05, Retailer df = 2, MSB =
1.2, , SSW = 831.2, Error df = 22, MSW = 38.7, Total df = 36
A large retail company gives an employment screening test to all prospective
employees. If a prospective employee receives a report saying that she scored at the
40th percentile:
A) she scored above the median.
B) she scored better than 40 percent of people who took the test.
C) she scored in the top 40 percent of people who took the test.
D) her z-score was a 40.
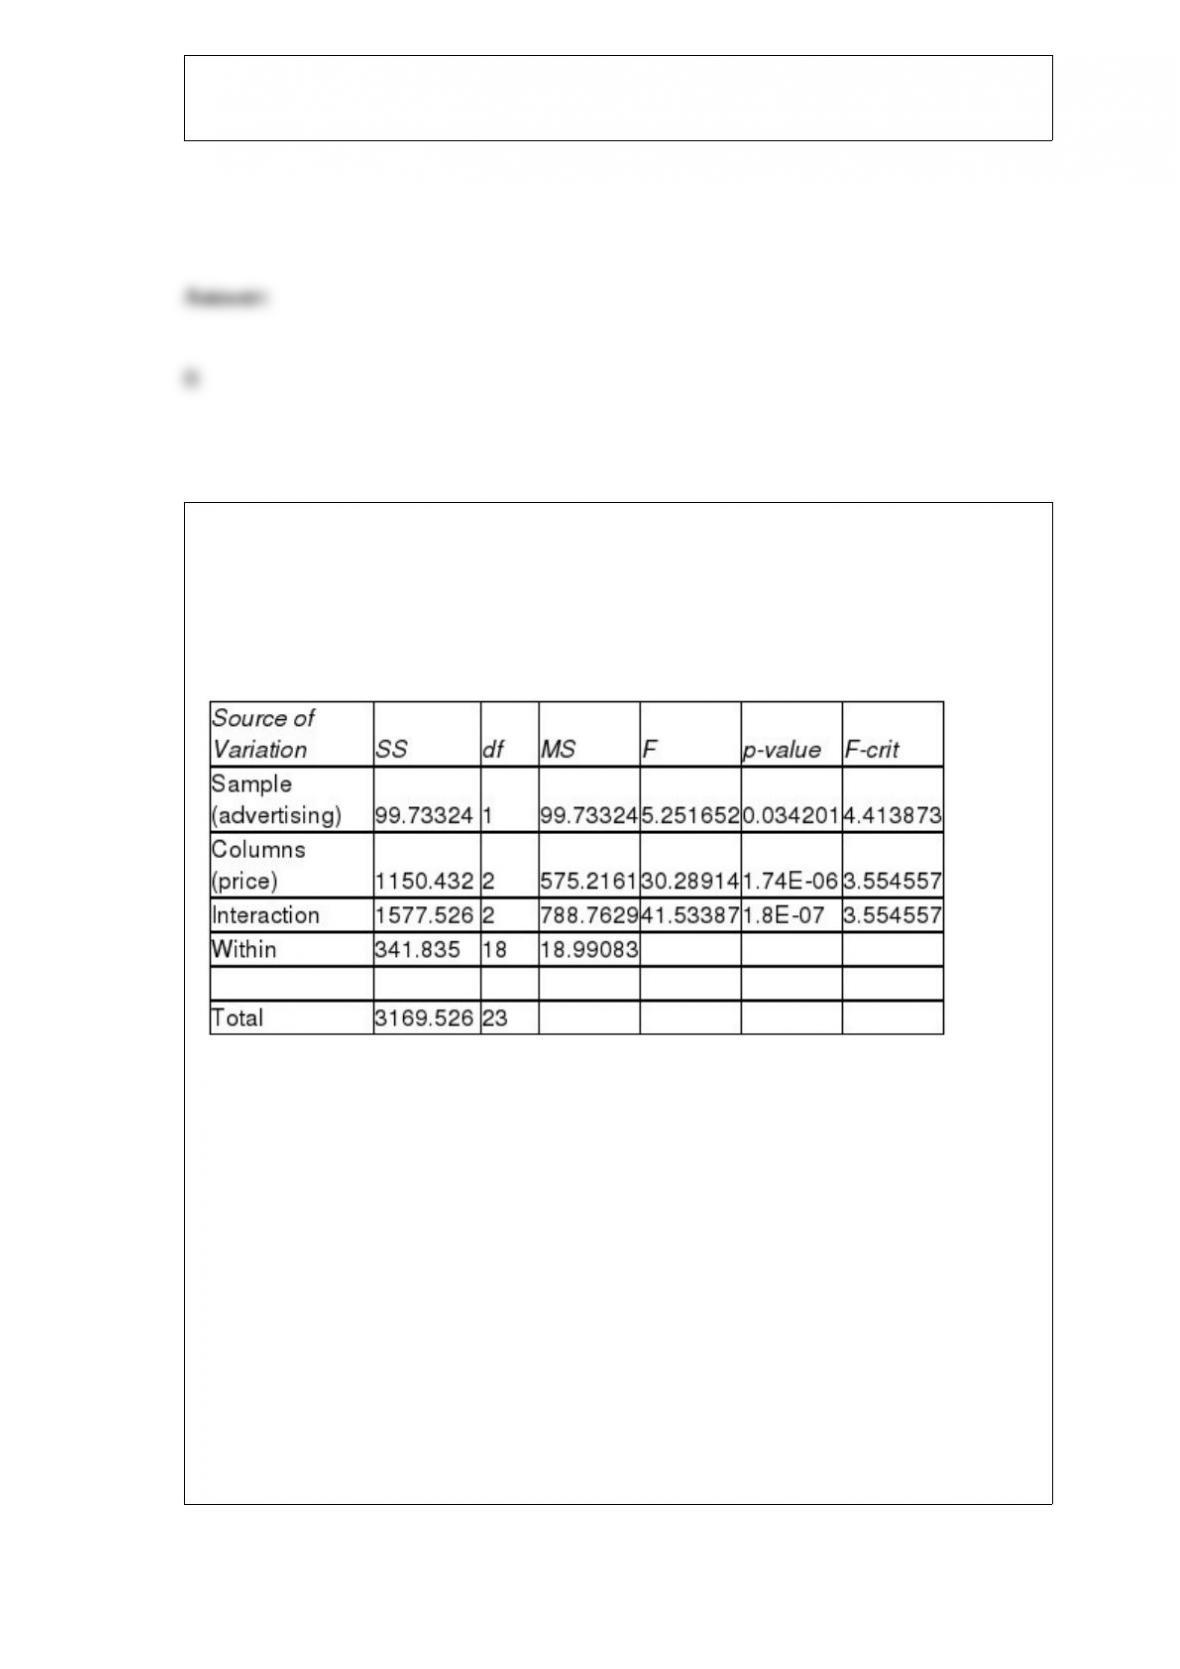
A two-factor analysis of variance is conducted to test the effect that price and
advertising have on sales of a particular brand of bottled water. Each week a
combination of particular levels of price and advertising are used and the sales amount
is recorded. The computer results are shown below.
ANOVA
Based on the results above and a 0.05 level of significance, which of the following is
correct?
A) There is no interaction between price and advertising, so results for individual
factors may be misleading.
B) There is interaction between price and advertising, so the above results for individual
factors may be misleading.
C) There is no interaction between price and advertising, and both factors significantly
affect sales.
D) There is interaction between price and advertising, so the above results conclusively
show that both factors affect price.
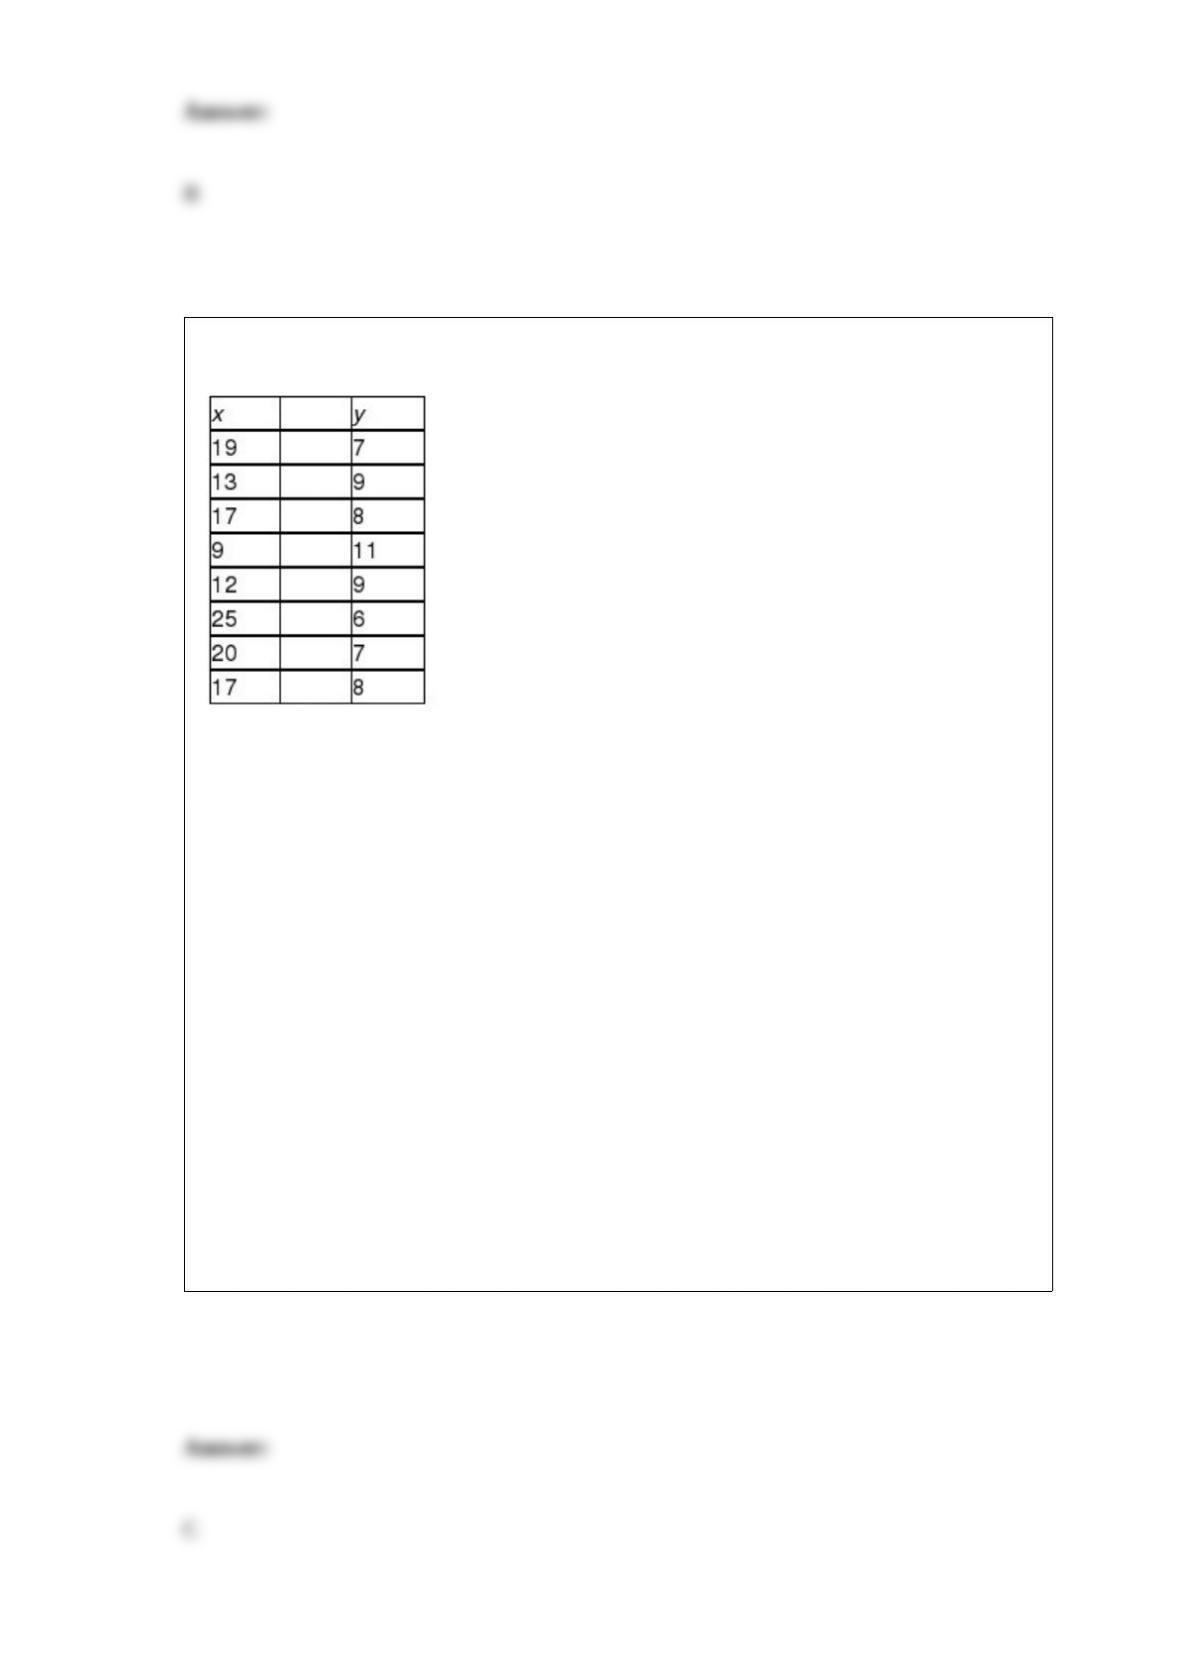
A random sample of two variables, x and y, produced the following observations:
Test to determine whether the population correlation coefficient is negative. Use a
significance level of 0.05 for the hypothesis test.
A) Because t = -4.152 < -1.9432, reject the null hypothesis. Because the null hypothesis
is rejected, the sample data does support the hypothesis that there is a negative linear
relationship between x and y.
B) Because t = -4.152 < -1.9432, do not reject the null hypothesis. Because the null
hypothesis is not rejected, the sample data support the hypothesis that there is a
negative linear relationship between x and y.
C) Because t = -9.895 < -1.9432, reject the null hypothesis. Because the null hypothesis
is rejected, the sample data does support the hypothesis that there is a negative linear
relationship between x and y.
D) Because t = -9.895 < -1.9432, do not reject the null hypothesis. Because the null
hypothesis is not rejected, the sample data support the hypothesis that there is a
negative linear relationship between x and y.
The makers of Mini-Oats Cereal have an automated packaging machine that can be set
at any targeted fill level between 12 and 32 ounces. Every box of cereal is not expected
to contain exactly the targeted weight, but the average of all boxes filled should. At the
end of every shift (eight hours), 16 boxes are selected at random and the mean and
standard deviation of the sample are computed. Based on these sample results, the
production control manager determines whether the filling machine needs to be
readjusted or whether it remains all right to operate. Use α = 0.05. Establish the
appropriate null and alternative hypotheses to be tested for boxes that are supposed to
have an average of 24 ounces.
A) H0 : μ = 32 ounces Ha: μ ≠ 32 ounces
B) H0: μ = 16 ounces Ha: μ ≠ 16 ounces
C) H0: μ = 22 ounces Ha: μ ≠ 22 ounces
D) H0: μ = 24 ounces Ha: μ ≠ 24 ounces
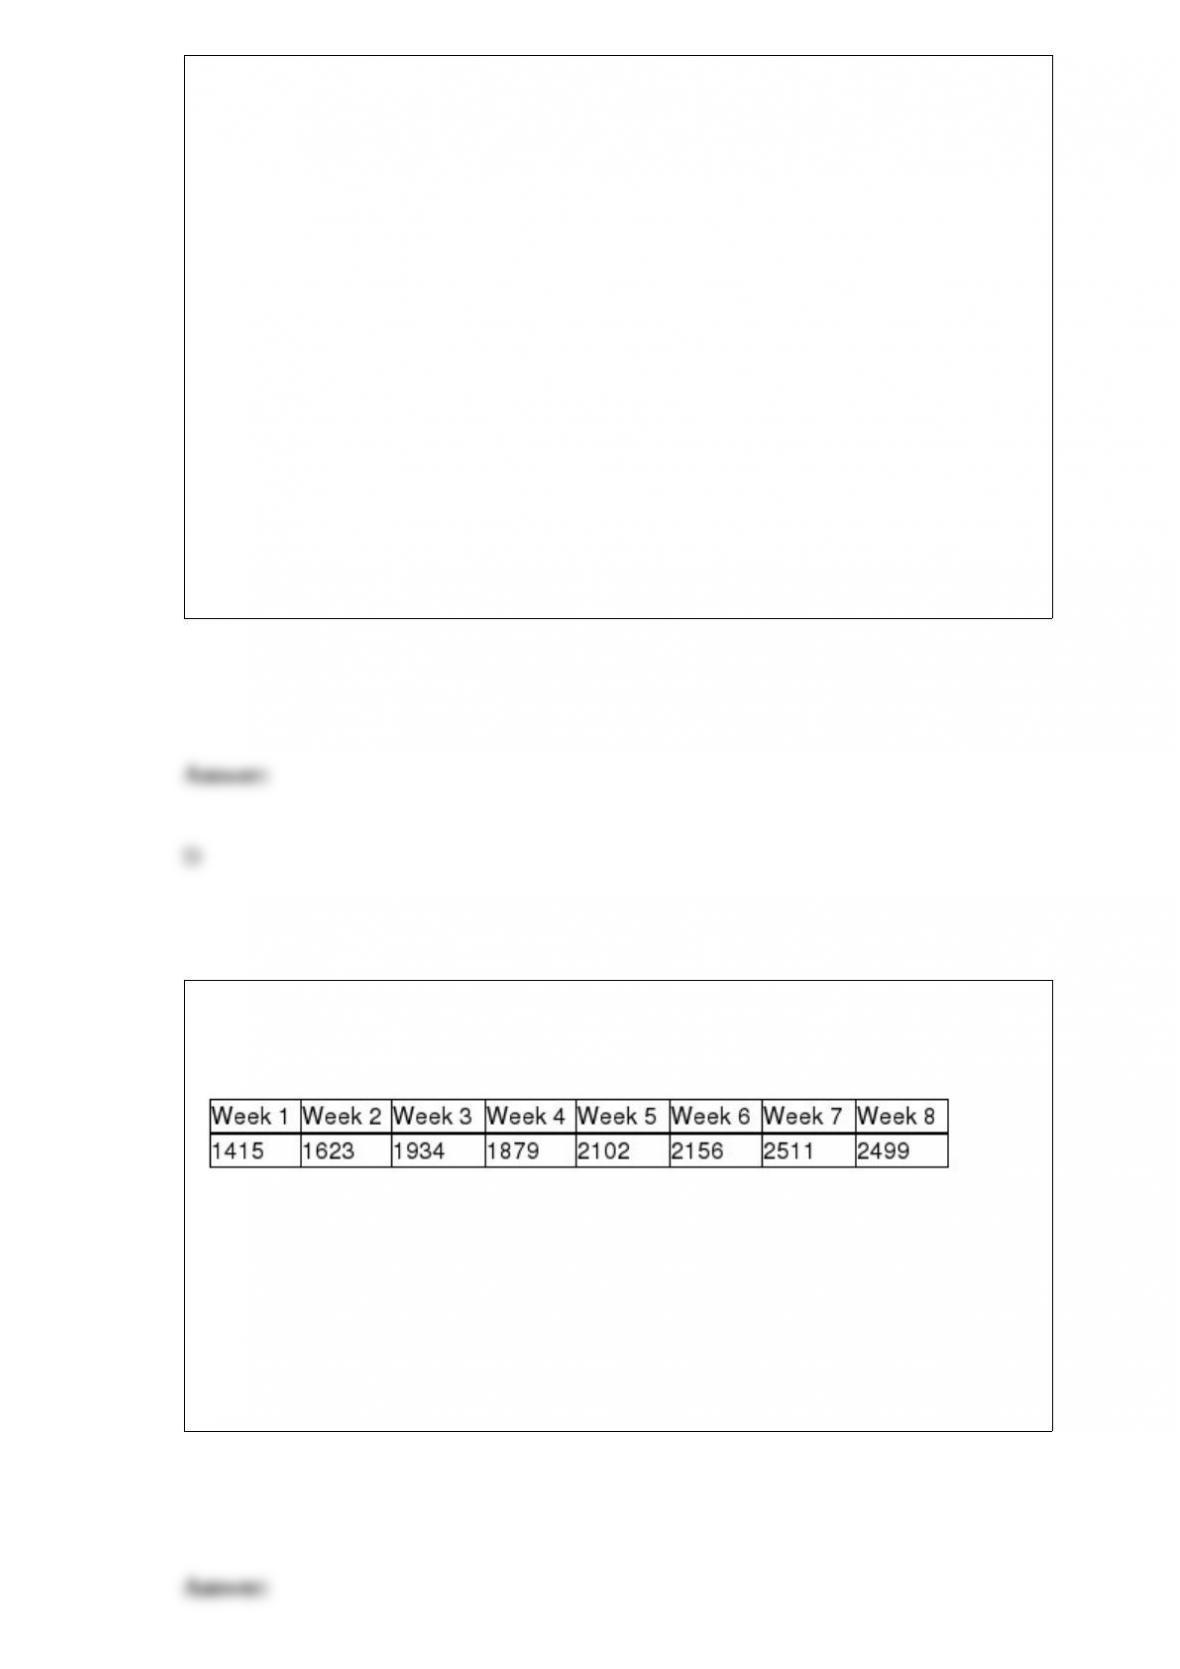
The Fitness Center manager has collected data on the number of visits to the club each
week for the past 8 weeks. These data are shown as follows. Which of the following
statements is most correct?
A) The proper graph for displaying these data is a pie chart.
B) There has been a gradual downward trend in these data.
C) A frequency histogram should be developed to help identify the trend in these data.
D) The data lend themselves to a line chart.

The distribution of the actual weight of potato chips in a 16 ounce sack is thought to be
bell-shaped with a mean equal to 16 ounces and a standard deviation equal to 0.45
ounces. Based on this, between what two limits could we expect 95 percent of all sacks
to weigh?
A) 14 to 18 ounces
B) 15.10 to 16.90 ounces
C) 15.55 to 16.45 ounces
D) 14.65 to 17.35 ounces
For a binomial distribution with a sample size equal to 10 and a probability of a success
equal to 0.30, what is the probability that the sample will contain exactly three
successes? Use the binomial formula to determine the probability.
A) 0.3277
B) 0.3288
C) 0.2668
D) 0.2577
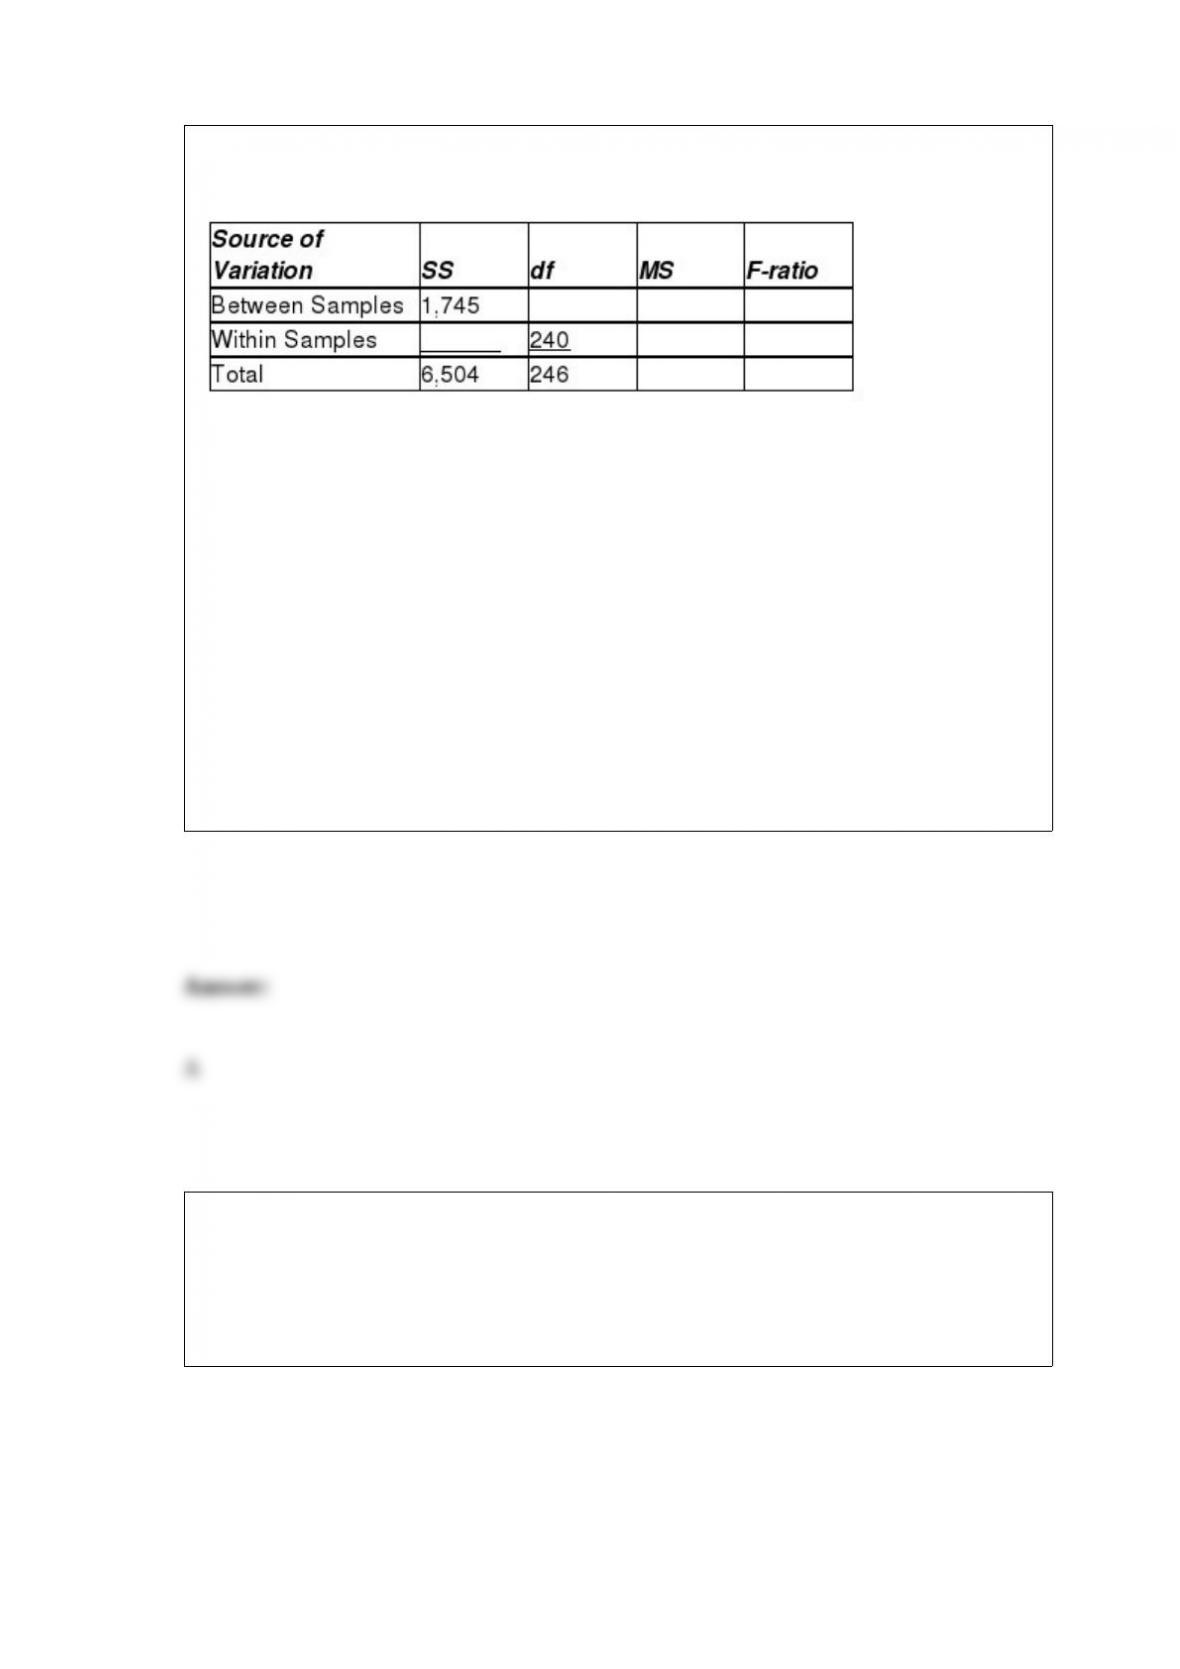
Respond to the following questions using this partially completed one-way ANOVA
table:
Fill in the ANOVA table with the missing values.
A) Between Samples df = 6, MSB = 290.833, F-ratio = 14.667, SSW = 4,759, MSW =
19.829
B) Between Samples df = 6, MSB = 290.833, F-ratio = 7.948, SSW = 4,759, MSW =
19.829
C) Between Samples df = 5, MSB = 290.833, F-ratio = 14.667, SSW = 4,759, MSW =
19.829
D) Between Samples df = 5, MSB = 290.833, F-ratio = 7.948, SSW = 4,759, MSW =
19.829
An Internet service provider is interested in testing to see if there is a difference in the
mean weekly connect time for users who come into the service through a dial-up line,
DSL, or cable Internet. To test this, the ISP has selected random samples from each
category of user and recorded the connect time during a week period. The following
data were collected:
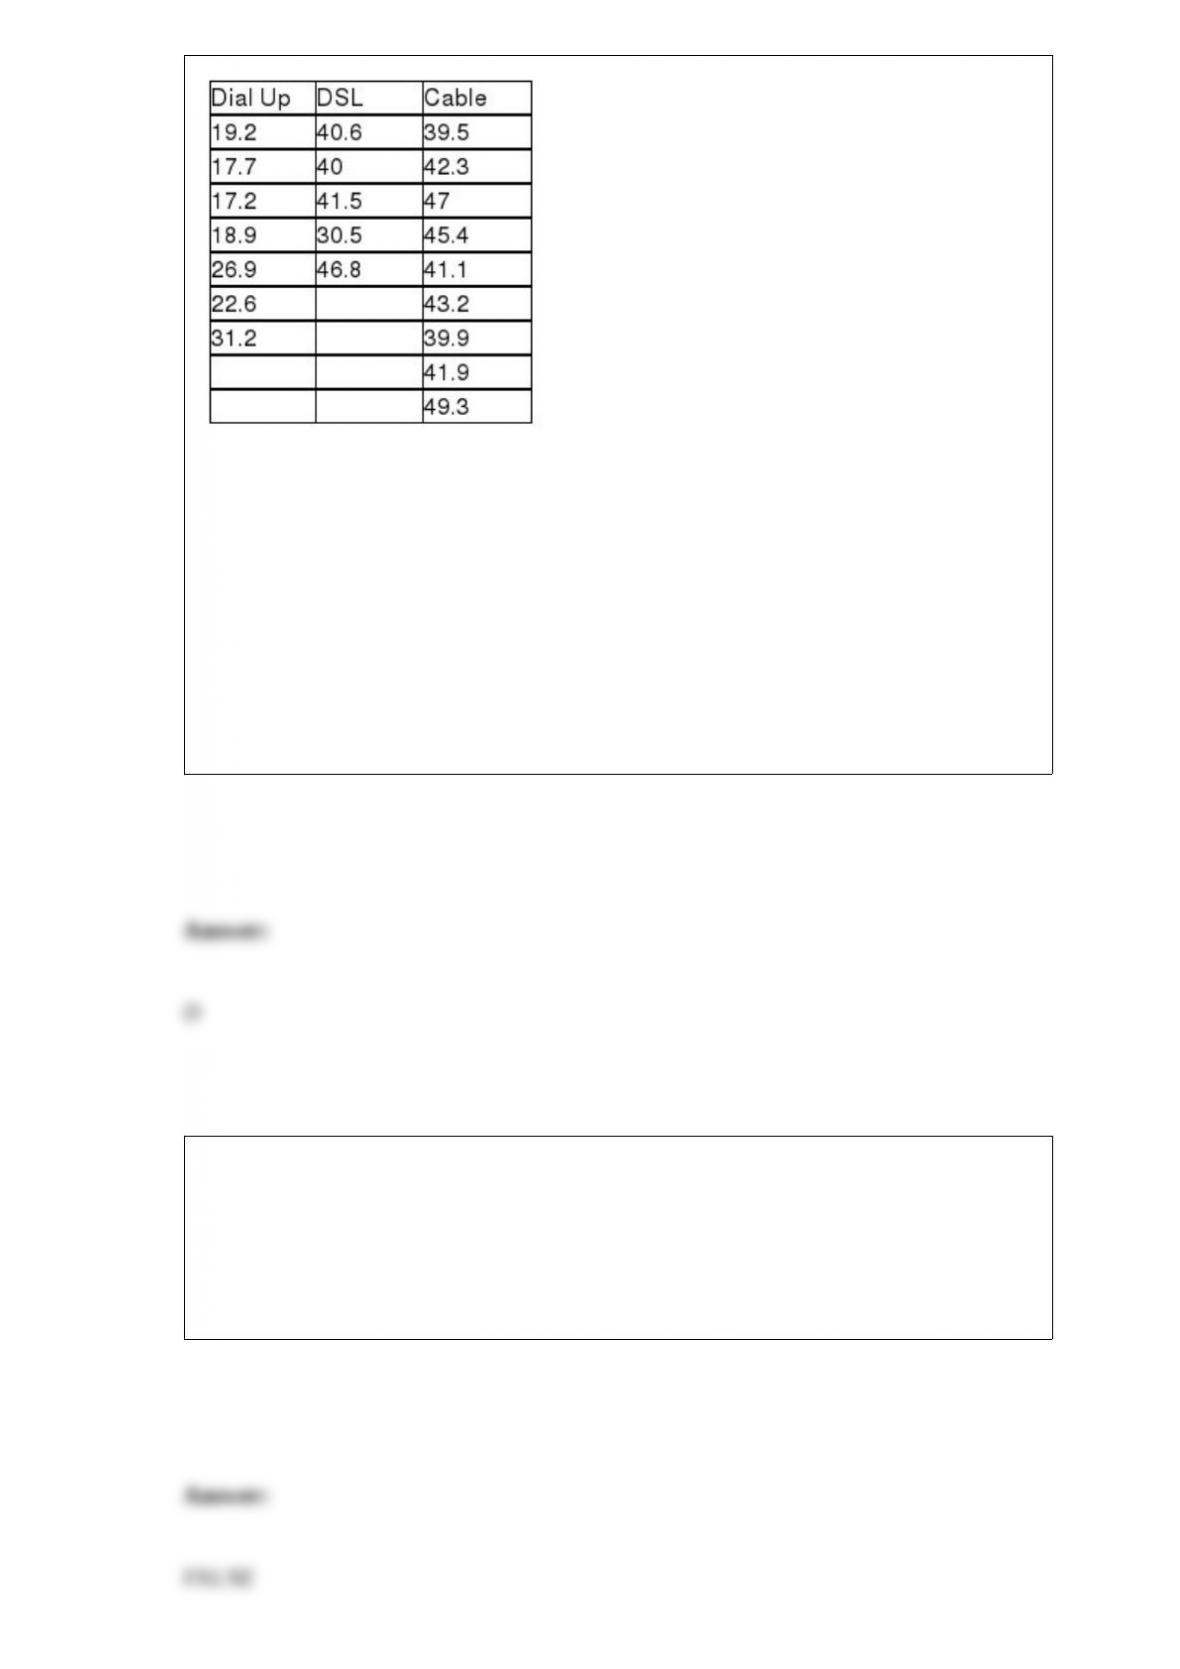
Assuming that the test is to be conducted at a 0.01 level of significance, what would the
critical value be for this test?
A) F = 1.93
B) F = 3.555
C) t = 2.8784
D) F = 6.013
Chicago Connection, a local pizza company, delivers pizzas for free within the market
area. The delivery drivers are paid $2.00 per delivery plus they get to keep any tips. To
estimate the proportion of deliveries that result in a tip to the driver, a random sample of
64 deliveries was selected. Of these, 48 times a tip was received. Based on this
information, and using a 95 percent confidence level, the upper limit for the confidence
interval estimate is about .1061.

What does the term observed cell frequencies refer to?
A) The frequencies found in the population being examined
B) The frequencies found in the sample being examined
C) The frequencies computed from H0
D) The frequencies computed from H1
Most major airlines allow passengers to carry two pieces of luggage (of a certain
maximum size) onto the plane. However, their studies show that the more carry-on
baggage passengers have, the longer it takes to unload and load passengers. One
regional airline is considering changing its policy to allow only one carry-on per
passenger. Before doing so, it decided to collect some data. Specifically, a random
sample of 1,000 passengers was selected. The passengers were observed, and the
number of bags carried on the plane was noted. Out of the 1,000 passengers, 345 had
more than one bag.
Based on this sample, develop and interpret a 95% confidence interval estimate for the
proportion of the traveling population that would have been impacted had the one-bag
limit been in effect.
A) (0.3155, 0.3745)
B) (0.3220, 0.3680)
C) (0.3216, 0.3684)
D) (0.3336, 0.3564)

If a hypothesis test for a single population variance is to be conducted using a
significance level of 0.10, a sample size of n = 16, and the test is a one-tailed upper-tail
test, the critical value is:
A) z = 1.28
B) t = 1.345
C) x2 = 22.3071
D) x2 = 24.9958
Applebee’s International, Inc., is a U.S. company that develops, franchises, and operates
the Applebee’s Neighborhood Grill and Bar restaurant chain. It is the largest chain of
casual dining restaurants in the country, with over 1,500 restaurants across the United
States. The headquarters is located in Overland Park, Kansas. The company is
interested in determining if mean weekly revenue differs among three restaurants in a
particular city. The file entitled Applebees contains revenue data for a sample of weeks
for each of the three locations.
Test to determine if blocking the week on which the testing was done was necessary.
Use a significance level of 0.05.
A) The p-value = 0.078 > α = 0.05. This indicates that inserting the week on which the
testing was done was necessary.
B) The p-value = 0.078 > α = 0.05. This indicates that inserting the week on which the
testing was done was not necessary.
C) The p-value = 0.000 < α = 0.05. This indicates that inserting the week on which the
testing was done was necessary.
D) The p-value = 0.000 < α = 0.05. This indicates that inserting the week on which the
testing was done was not necessary.
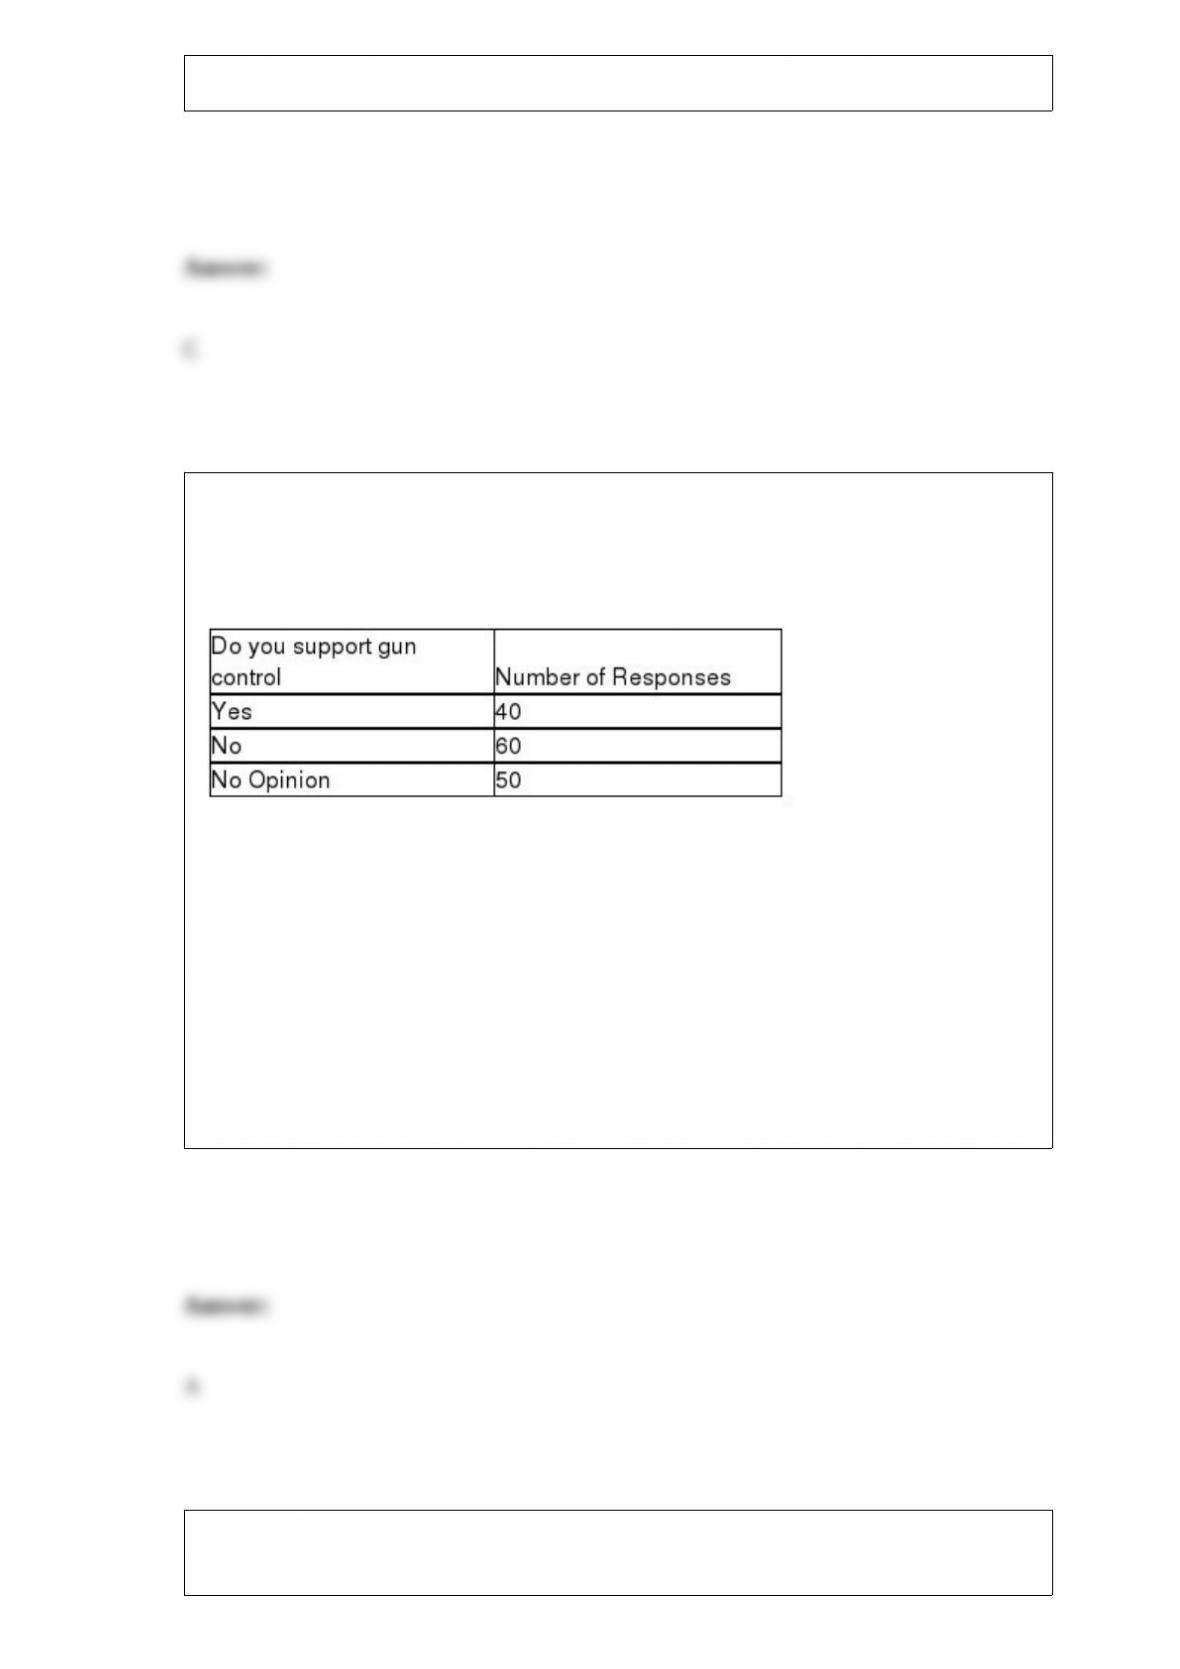
We are interested in determining whether the opinions of the individuals on gun control
(as to Yes, No, and No Opinion) are uniformly distributed.
A sample of 150 was taken and the following data were obtained.
The conclusion of the test with alpha = 0.05 is that the views of people on gun control
are:
A) uniformly distributed.
B) not uniformly distributed.
C) inconclusive.
D) None of the above
If the age distribution of customers at a major retail chain is thought to be bell-shaped
with a mean equal to 43 years and a standard deviation equal to 7 years, the percentage

of customers between the ages of 29 and 57 years is:
A) approximately 81.5.
B) approximately 68.
C) at least 75.
D) approximately 95.
A hospital emergency room has collected a sample of n = 40 to estimate the mean
number of visits per day. It has found the standard deviation is 32. Using a 90 percent
confidence level, what is its margin of error?
A) Approximately 1.5 visits
B) About 9.9 visits
C) Approximately 8.3 visits
D) About 1.3 visits
The undergraduate students at your university are classified as freshmen, sophomores,
juniors, or seniors. A recent study of undergraduates asked the students to indicate the
number of credits they were registered for this term. The responses were 3, 6, 9, 12, 15,
and 18. The number of cells in a joint frequency distribution for the two variables, class
standing, and credit hours is:
A) 4.
B) 10.
C) 24.
D) None of the above.
For the following hypothesis test:
With n = 80, σ = 9, and = 47.1, state the decision rule in terms of the critical value of
the test statistic.
A) Reject the null hypothesis if the calculated value of the test statistic, z, is greater
than the critical value of the test statistic, 1.645. Otherwise, do not reject.
B) Reject the null hypothesis if the calculated value of the test statistic, z, is greater than
the critical value of the test statistic, 2.05. Otherwise, do not reject.
C) Accept the null hypothesis if the calculated value of the test statistic, z, is greater
than the critical value of the test statistic, 1.645. Otherwise, do not accept.
D) Accept the null hypothesis if the calculated value of the test statistic, z, is greater
than the critical value of the test statistic, 2.05. Otherwise, do not accept.

A random sample of 121 automobiles traveling on an interstate showed an average
speed of 65 mph. From past information, it is known that the standard deviation of the
population is 22 mph. The 95 percent confidence interval for μ is determined as (61.08,
68.92). If we are to reduce the sample size to 100 (other factors remain unchanged), the
95 percent confidence interval for μ would:
A) become wider.
B) become narrower.
C) be the same.
D) be impossible to determine.