The purpose of sampling is to ________.
A) enumerate all the values in the population
B) measure all items of interest for a particular interest or investigation
C) obtain sufficient information to draw a valid inference about a population
D) calculate all variables and observations within a population
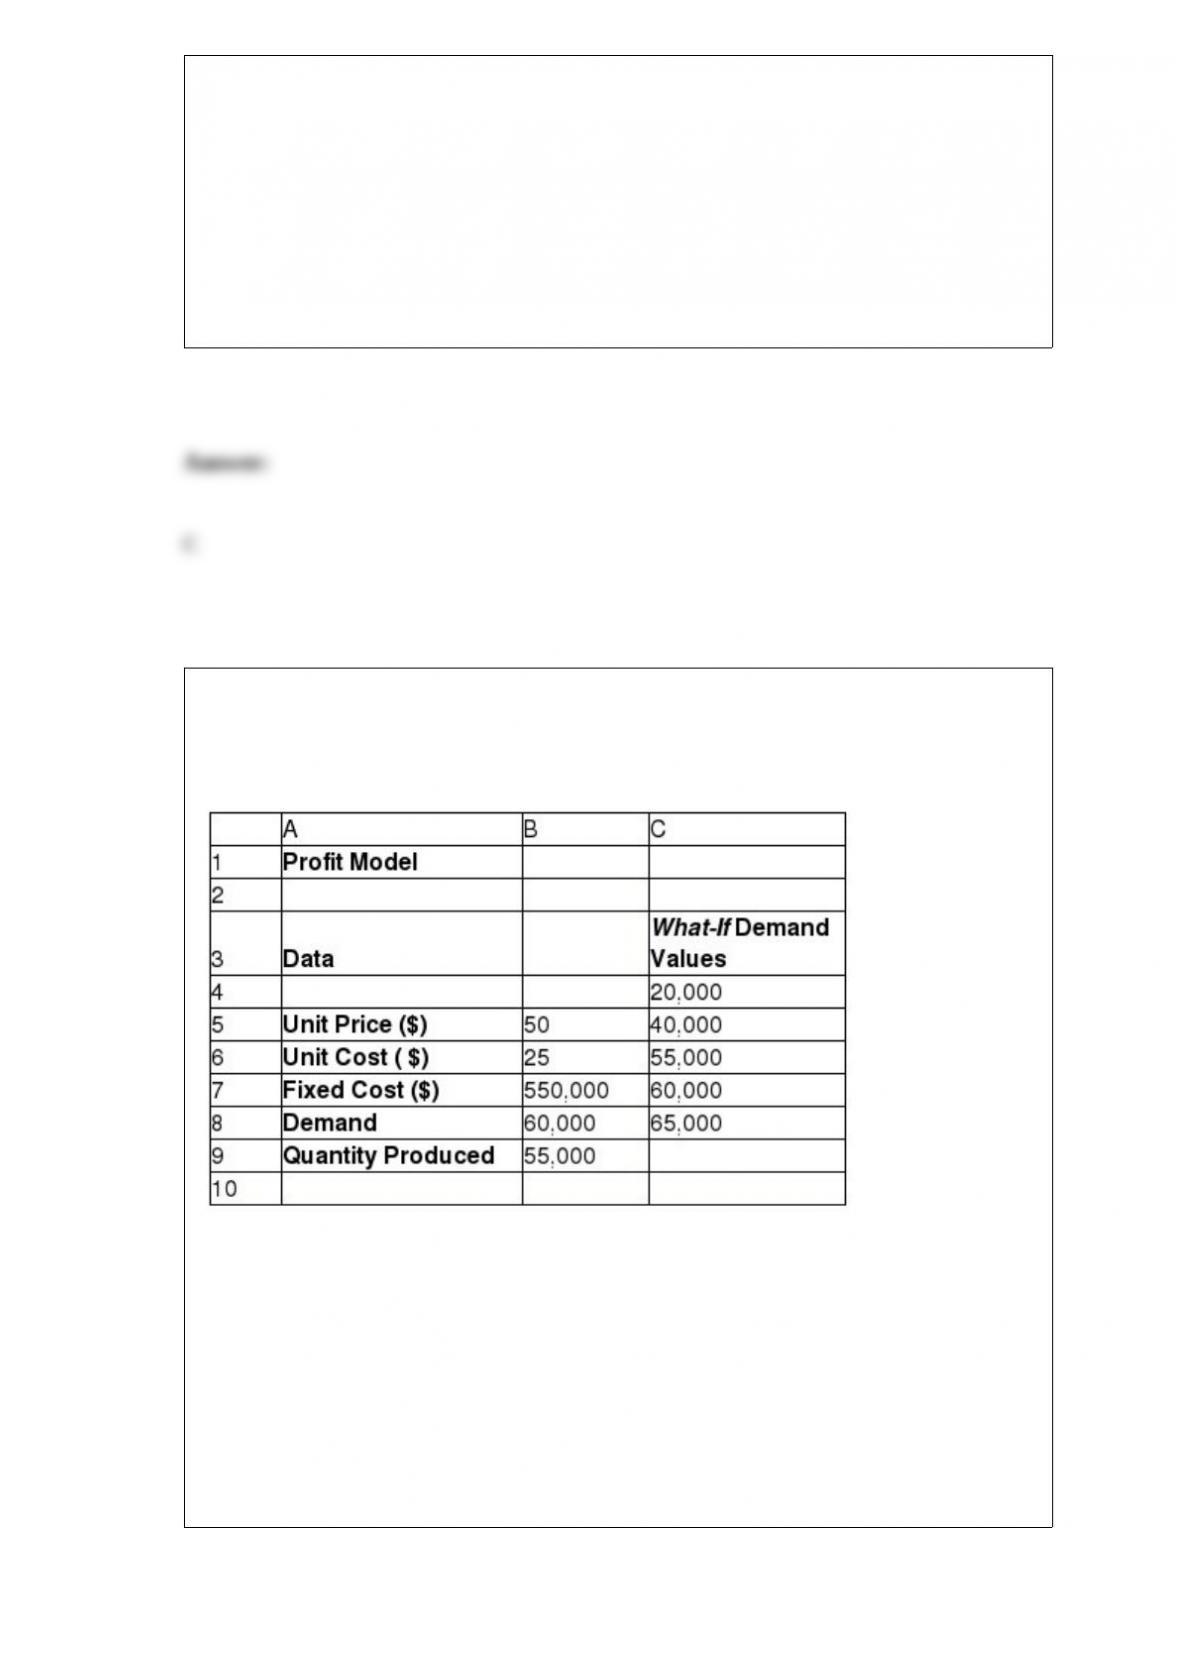
In the spreadsheet below, there is data on the price, cost, demand, and quantity
produced for an item. There are also different “what if” values that can help a manager
to calculate costs and revenue with variability in demand.
Calculate the variable cost when the demand is 60,000 units.
A) $1,430,000
B) $1,375,000
C) $2,750,000
D) $1,320,000

Using Chebyshev’s theorem for standard deviation, calculate the percentage of data that
lie within five standard deviations of the mean.
A) 89%
B) 75%
C) 96%
D) 50%
The Ransin Sports Company has noted that the size of individual customer orders is
normally distributed with a mean of $112 and a standard deviation of $9. If a soccer
team of 11 players were to make the next batch of orders, what would be the standard
error of the mean?
A) 1.64
B) 2.71
C) 3.67
D) 0.82
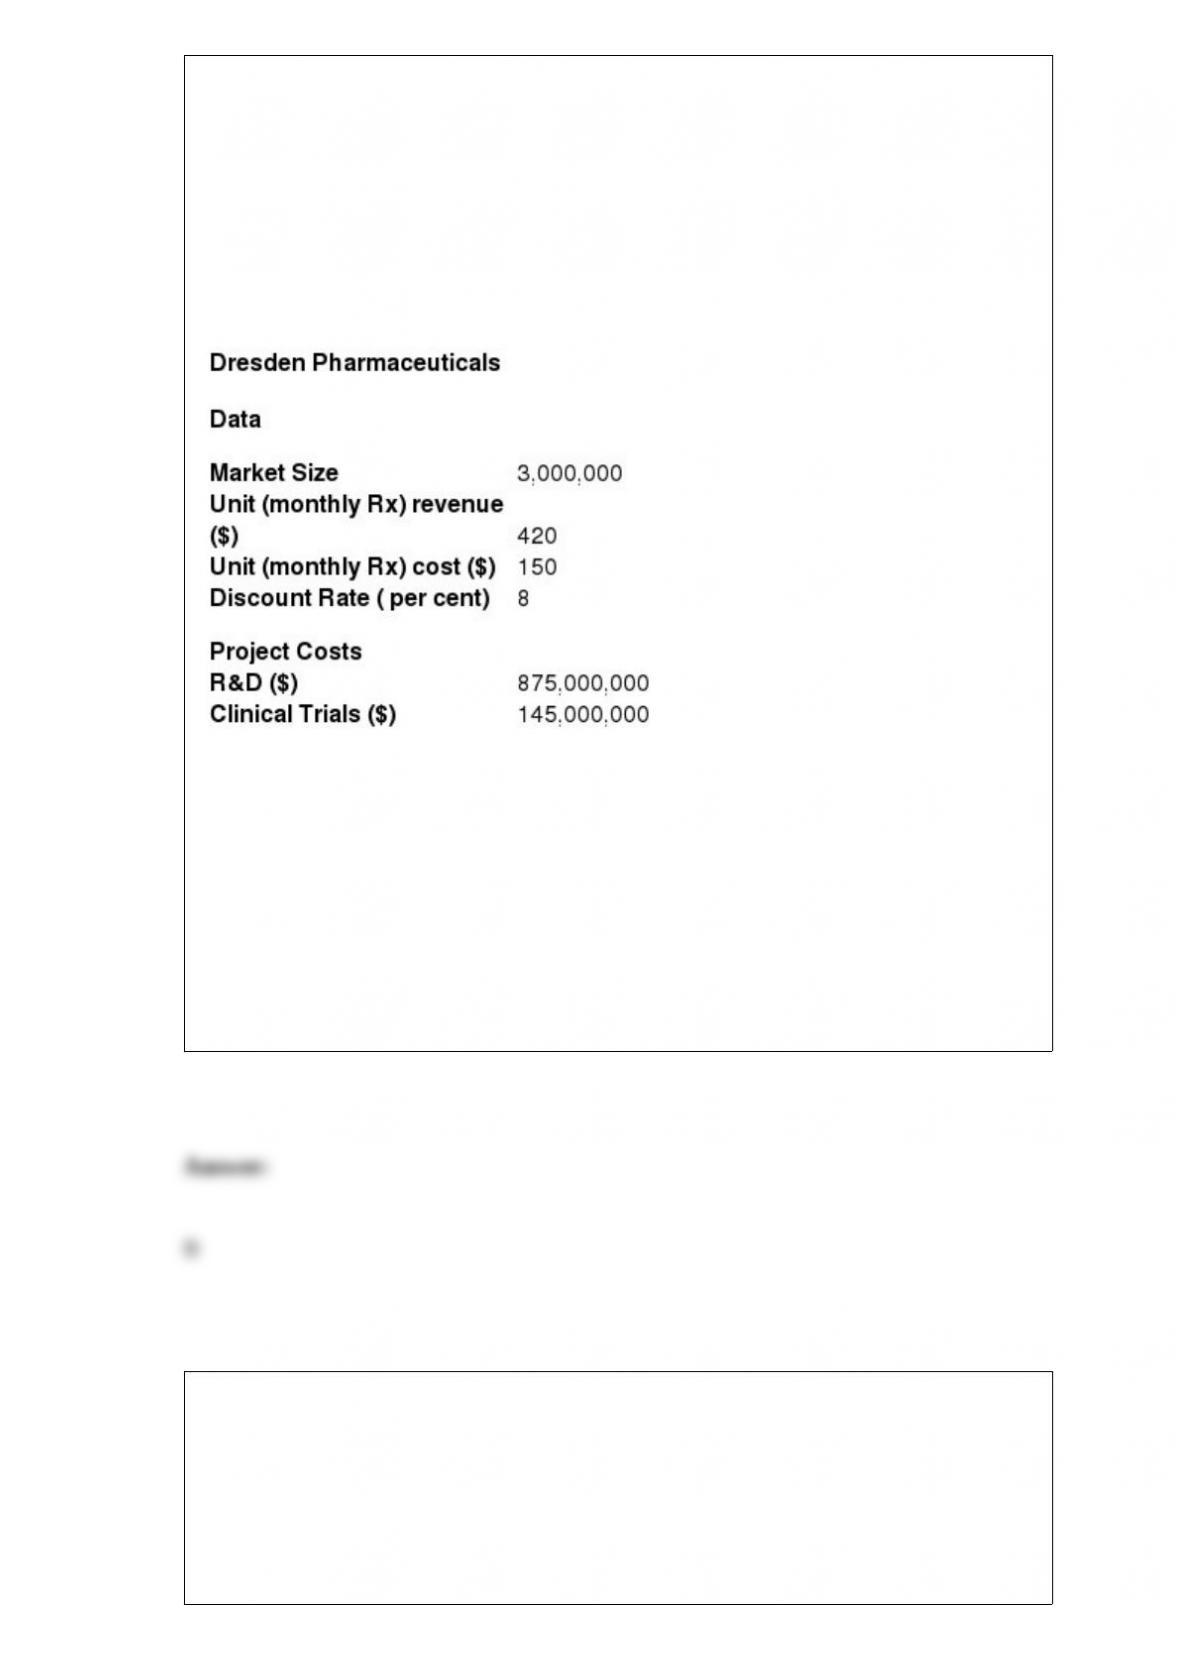
Dresden Pharmaceuticals has decided to go ahead and start clinical trials on a potential
new drug. The total R&D costs are estimated to reach around $875,000,000 with
clinical trials mounting to $145,000,000. The current market size is estimated to be
around 3,000,000 and is expected to grow at 4 percent every year. The market share
Dresden hopes to capture in the first year is 7 percent, and is projected to grow by 25
percent each year for the next 4 years. A monthly prescription is anticipated to generate
revenue of $420 while incurring variable costs of $150. A discount rate of 8 percent is
assumed.
Calculate cumulative net profit at the fourth year.
A) $1,073,538,462
B) $3,189,634,800
C) $1,312,041,240
D) $1,494,838,800
When will a company use a predictive decision model?
A) when it wishes to determine the best product pricing to maximize revenue
B) when it wishes to know how best to use advertising strategies to influence sales
C) when it wishes to know sales patterns to plan inventory levels
D) when it wishes to ensure that a specified level of customer service is achieved
What is the mean absolute deviation obtained from the simulation results?
A) 1.25
B) 0.65
C) 0.24
D) 0.99
Which of the following is true about variance?
A) It measures the uncertainty of a random variable.
B) Higher variance implies low uncertainty.
C) It is the square root of a random variable’s standard deviation.
D) It is the weighted average of all possible outcomes.

For the given data, what is the sales forecast for the year 1992 (in thousands)?
A) 1256.87
B) 1317.91
C) 1285.74
D) 1350.08
Stone Age Surfboards is a small manufacturer of two types of popular low-tide
surfboards, the Graystone and the Lava models. The manufacturing process consists of
two departments: fabrication and finishing. The fabrication department has 8 skilled
workers, each of whom works 9.25 hours per day. The finishing department has 5
workers, each of whom works a 6 -hour shift per day. Each pair of Graystone
surfboards requires 2.5 labor hours in the fabrication department and 2 labor hours in
finishing. The Lava model requires 4.2 labor-hours in fabrication and 3.6 labor-hours in
finishing. The company operates 6 days a week. It makes a per unit profit of $40 on the
Graystone model and $60 on the Lava model. The company anticipates selling at least
twice as many Lava models as Graystone models.
Use the spreadsheet below for Stone Age Surfboards to answer the following
question(s) using integer constraints on variables in the optimization models using the
standard Solver.
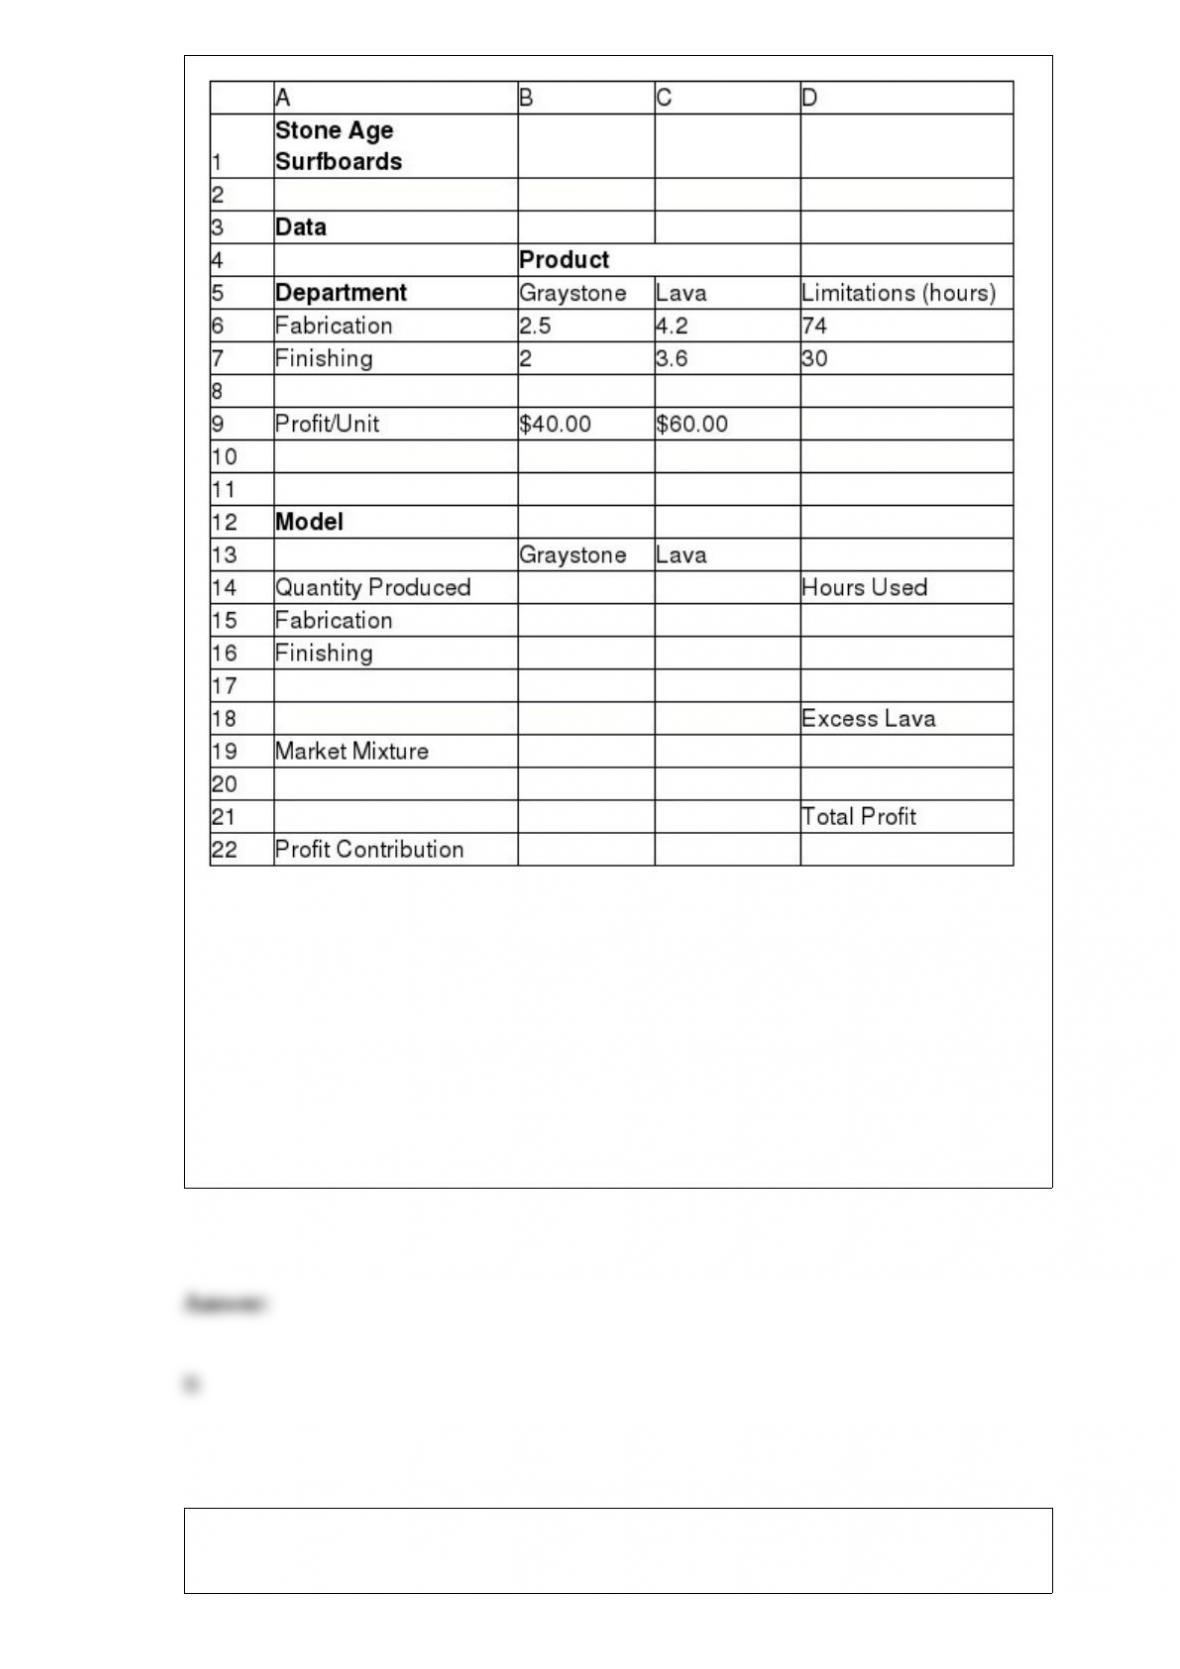
What is the total number of hours used for fabrication?
A) 39.6
B) 34.4
C) 29.2
D) 24.8
Which of the following is a difference between the t-distribution and the standard
normal distribution?

A) The t-distribution cannot be calculated without a known standard deviation, while
the standard normal distributions can be.
B) The standard normal distribution’s confidence levels are wider than those of the
t-distribution.
C) The t-distribution has a larger variance than the standard normal distribution.
D) The standard normal distribution is dependent on parameters like degrees of
freedom, while t-distribution is not.
Which of the following functions is a logical function that returns TRUE if any
condition is true and FALSE if not?
A) TO(value if true, value if false)
B) AND(condition 1, condition 2’¦)
C) OR(condition 1, condition 2’¦)
D) IF(condition, value if true, value if false)
The Atlas Movies Theater is planning to reprice their ticket rates to maximize revenues.
They have three classes of tickets: Classic, Silver, and Gold. The table below provides
information on the average ticket sales, revenue and price elasticity on demand. They
have a total seating capacity of 300. The table also provides the price range within
which they plan to reduce their ticket rates.
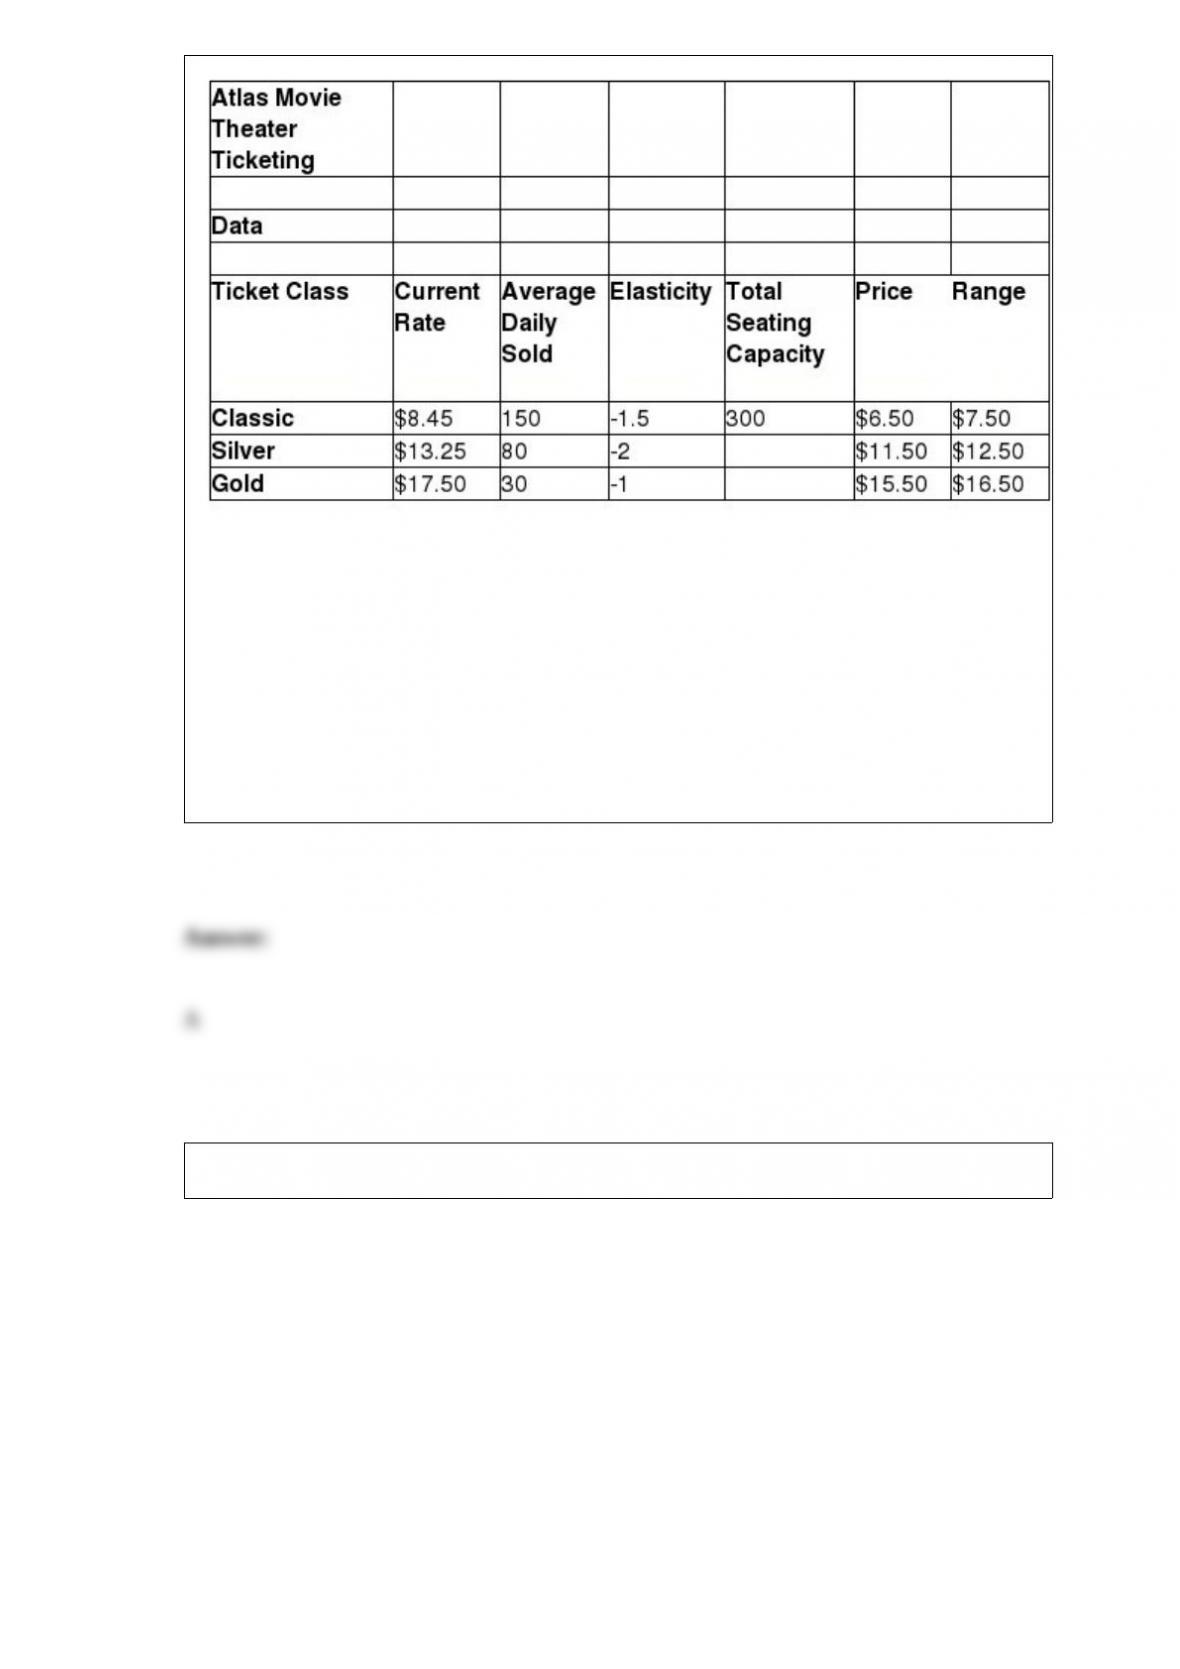
According to the nonlinear model, what is the new price for Gold tickets?
A) $16.50
B) $15.50
C) $16
D) $16.11
Below is a spreadsheet for Trance Electronics.
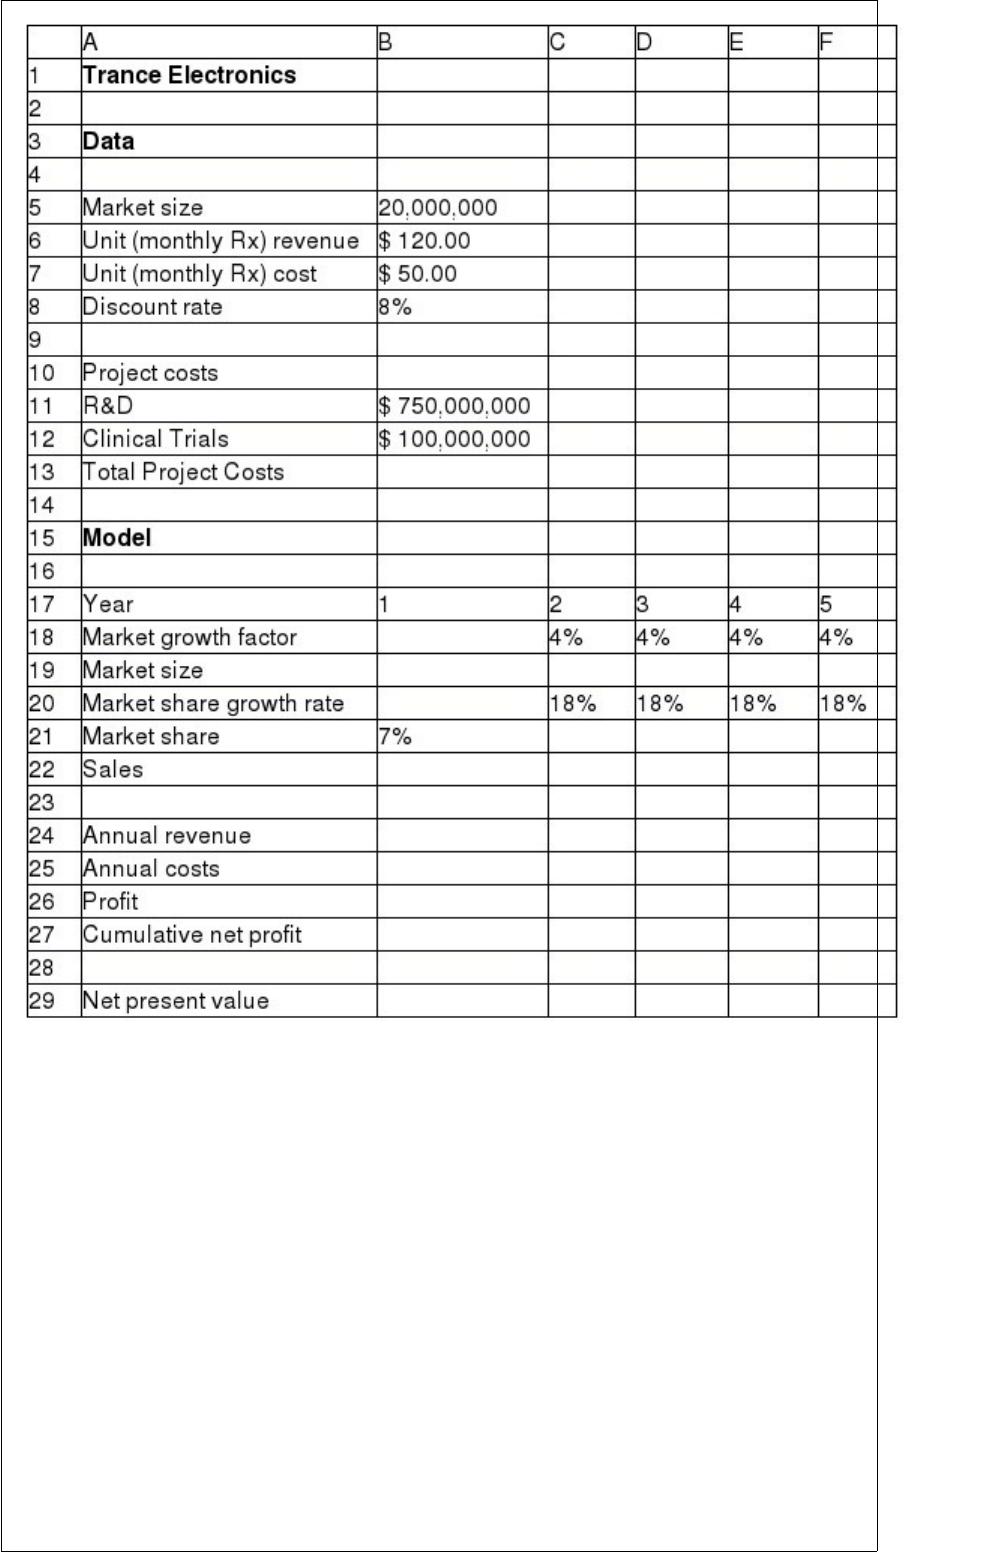
Suppose that the project manager of Trance Electronics has identified the following
uncertain variables in the model and the distributions and parameters that describe
them, as follows: Market size: normal with mean of 20,000,000 units and standard
deviation of 4,000,000 units. R&D costs: uniform between $600,000,000 and
$800,000,000.
Clinical trial costs: lognormal with mean of $150,000,000 and standard deviation
$30,000,000. Annual market growth factor: triangular with minimum = 2%,
maximum = 6%, and most likely = 3%.
Annual market share growth rate: triangular with minimum = 15%, maximum =
25%, and most likely = 20%.
The number of trials per simulation is equal to 10,000 at a Sim. Random Seed of 2. Run
the simulation and answer the following questions using the Risk Solver Platform.
What is the standard deviation obtained from the simulation results of the net present
value? [Hint: Choose the approximate value.]

A) $204,868,924
B) $162,135,408
C) $182,992,245
D) $138,134,040
In an Economic Order-Quantity (EOQ) model, ________ is the estimate on how long it
takes an order to be received after it is placed.
A) lead time
B) safety stock
C) time limit
D) cycle time
What are three types of Risk Solver Platform charts used to obtain multiple simulation
results?
Why is regression analysis necessary in business? What categories of regression models
are used?
Jonathan Reese is considering three stocks in which to invest with a fixed budget. The
table below provides information on Jonathan’s expected returns for each stock. The
table also provides information, collected from market researchers, on the
variance-covariance matrix of the individual stocks. He expects a total return of at least
10%.
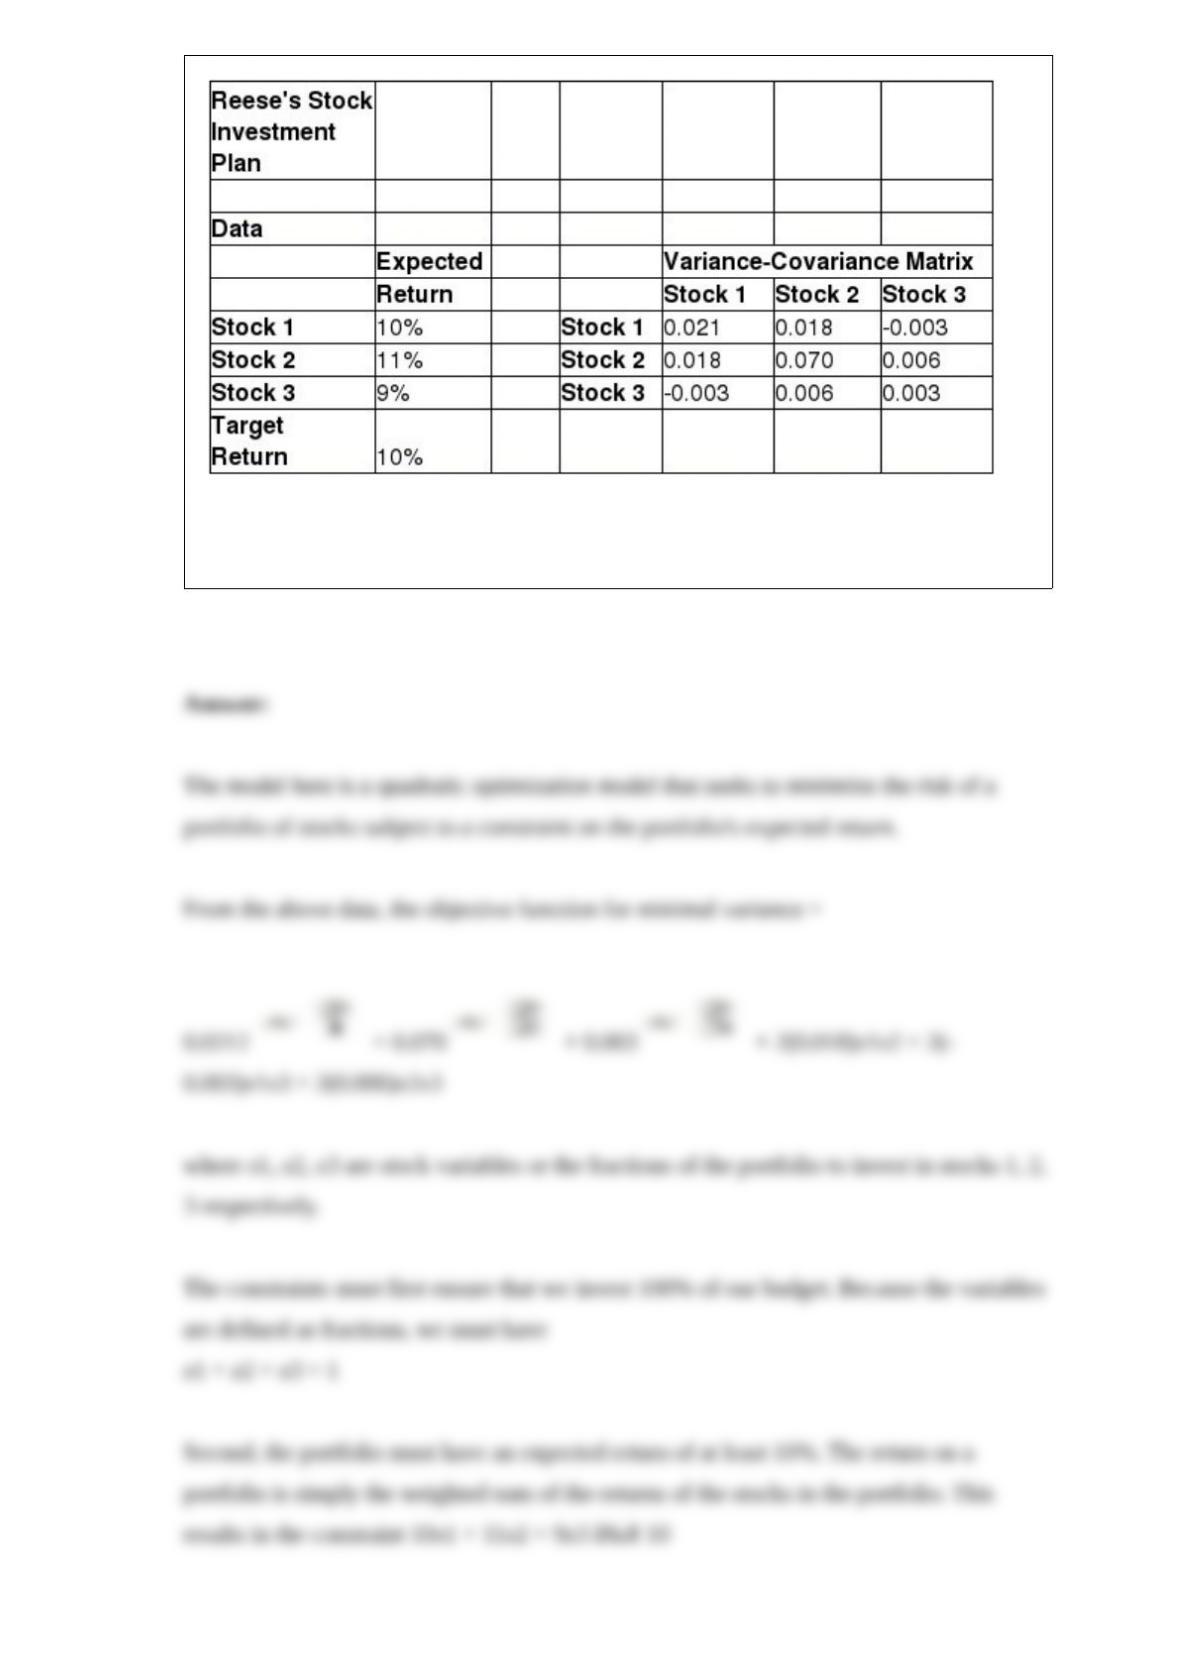
Using the table above, provide the objective function for minimal variance, and the
constraints for creating an optimization model.
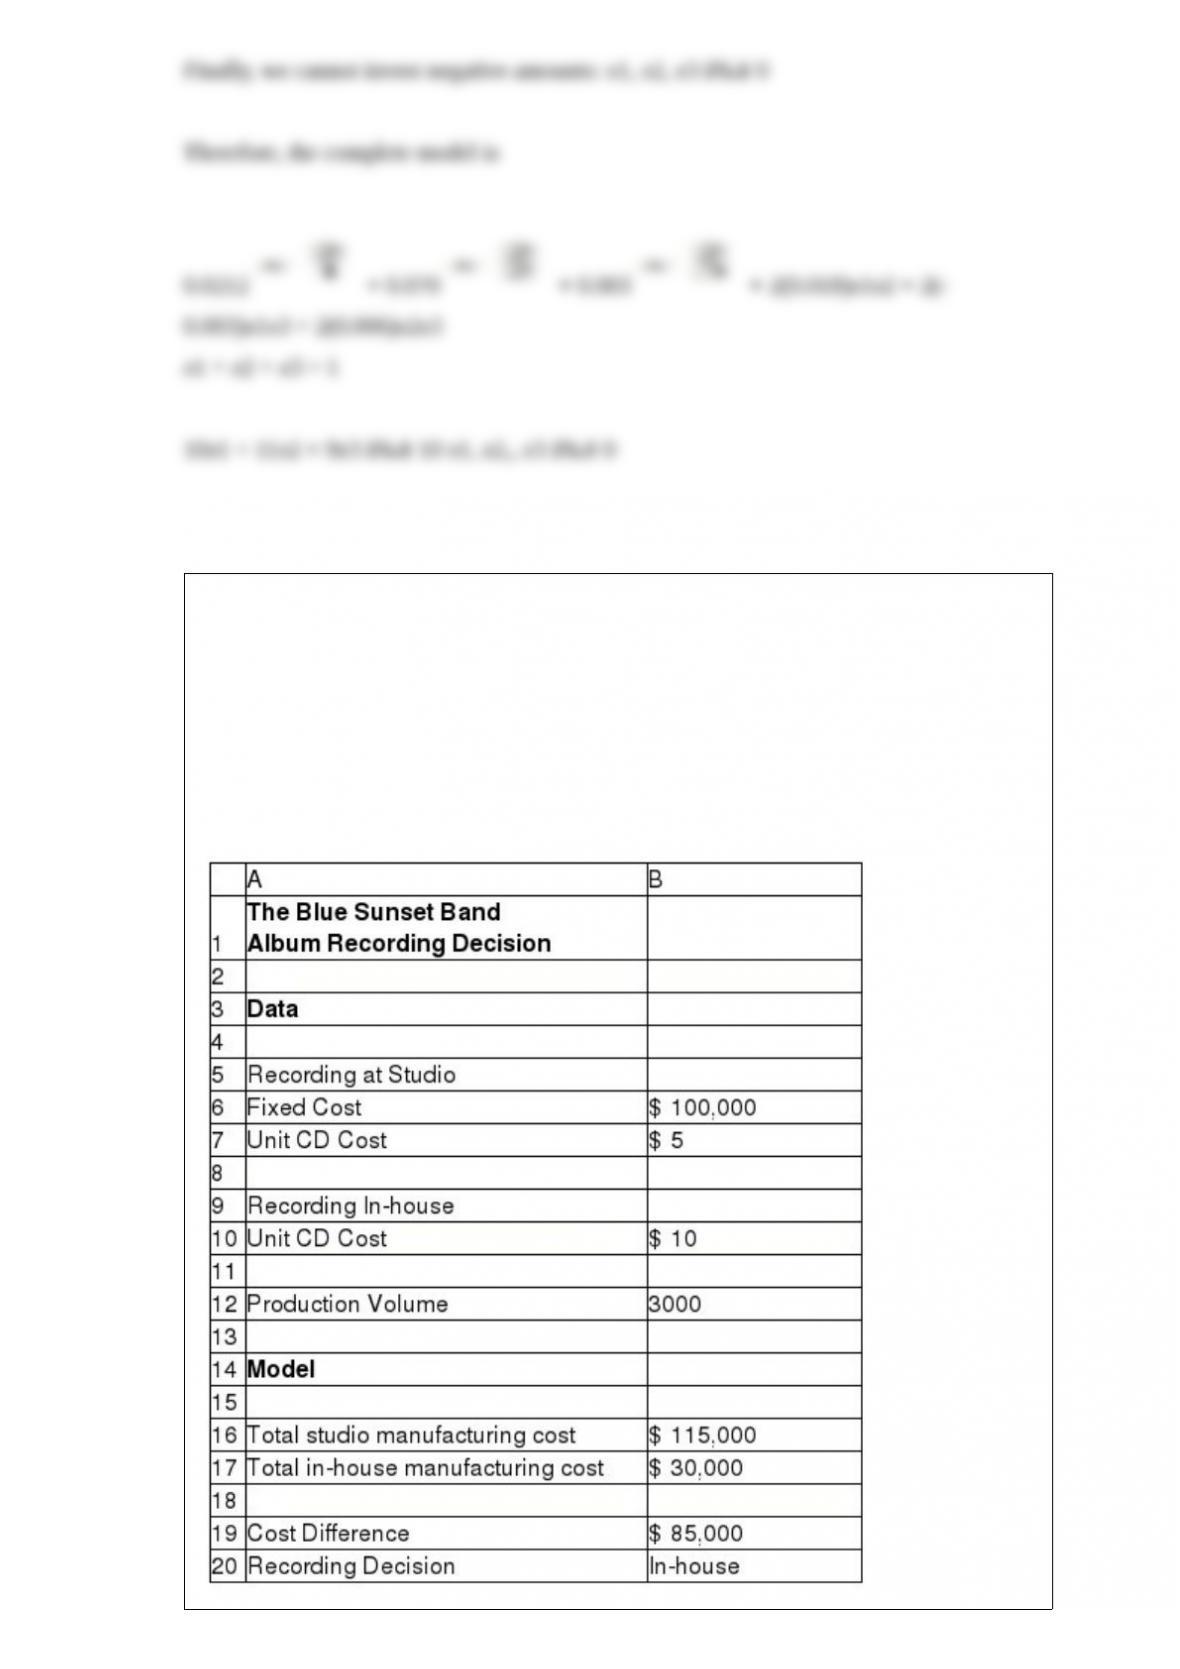
Blue Sunset Band is planning to record a new album. A major decision to be made is if
the band can record the album on their own, or if they should hire a studio to record it
with. The fixed cost for recording at the studio is $ 100,000, plus the manufacturing
cost per CD, which is at $5. If they record the album in- house, the cost per CD is $10.
They plan to produce 3000 copies of the album regardless of the place of recording. If
the band wished to break even with the cost, how can they achieve this by using the
Goal Seek feature in Excel?
Explain the different Lookup functions in Excel.
How do test statistics for two-sample tests vary depending on whether the population
standard deviations are known, and if not, whether they are assumed to be equal?
What are the assumptions made when developing an economic order quantity (EOQ)
model?
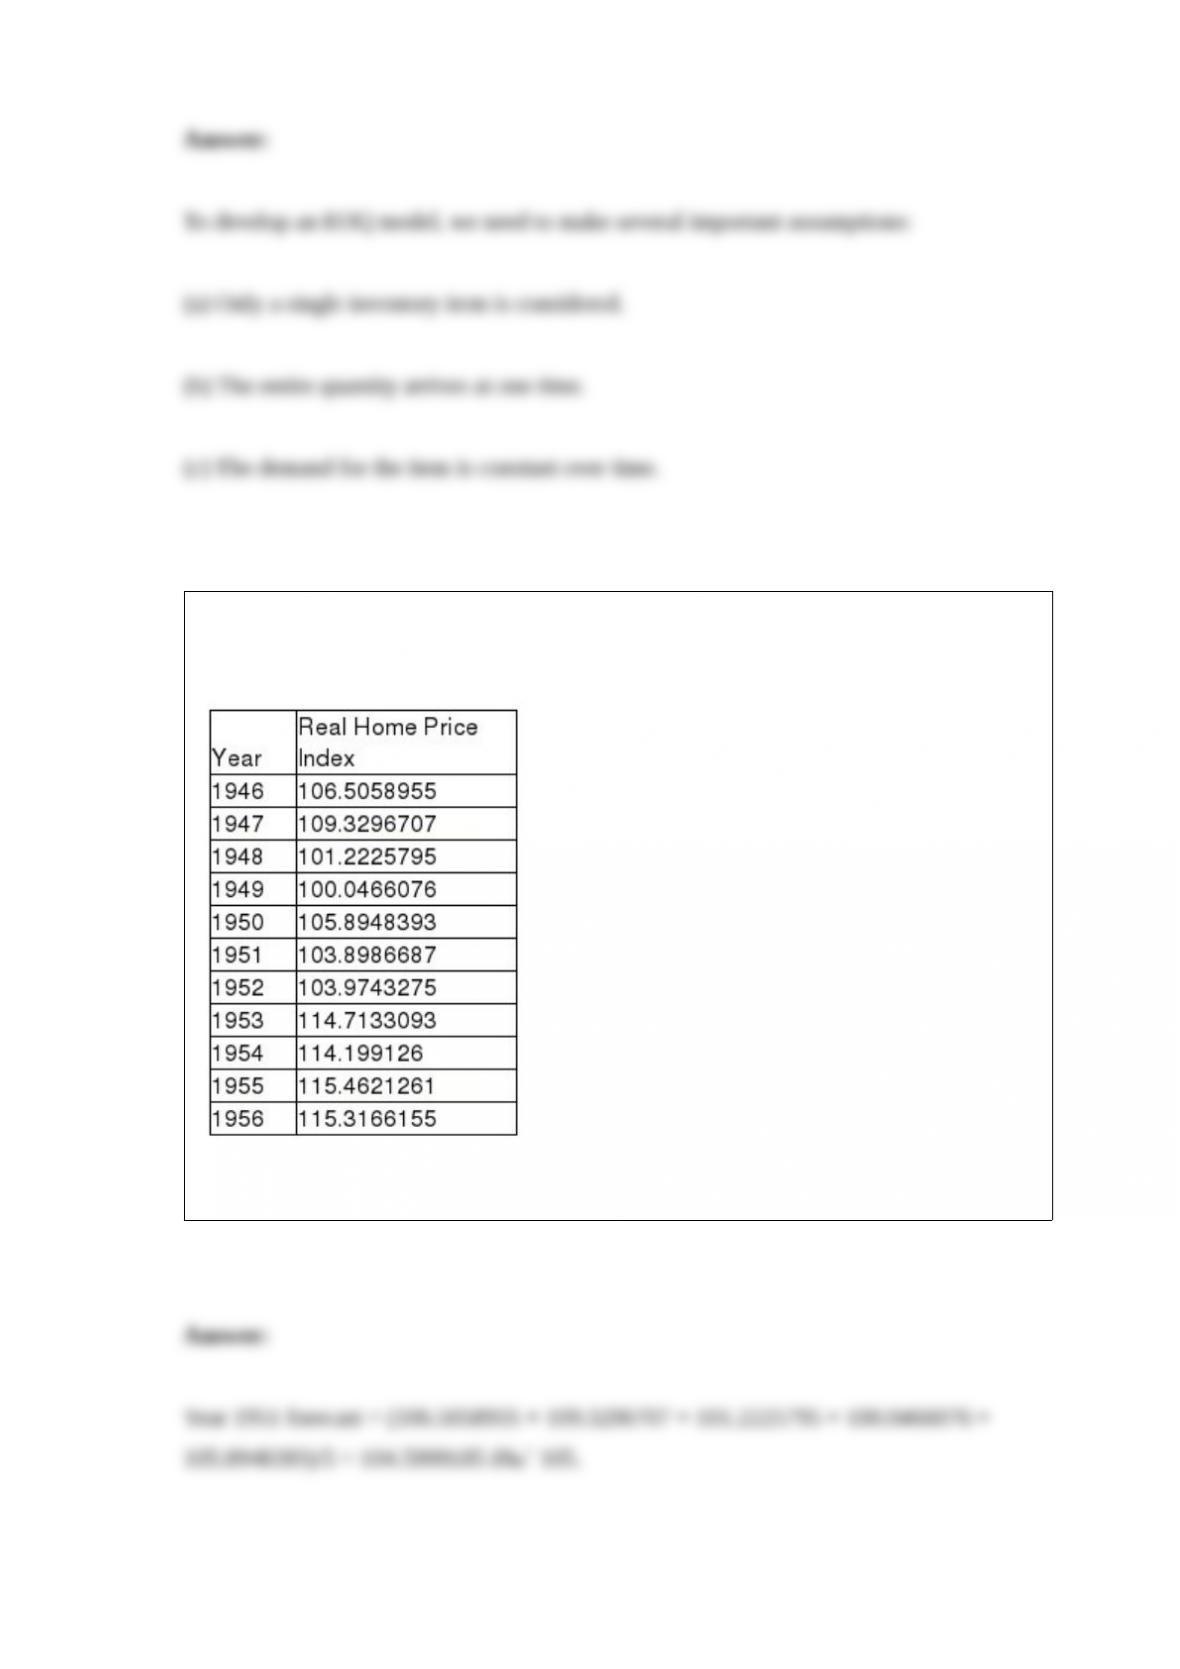
The table below is the data set of the Shiller Real Home Price Index for the years
1946-1956.
Setting k = 5, calculate the simple moving average forecast for the year 1951.
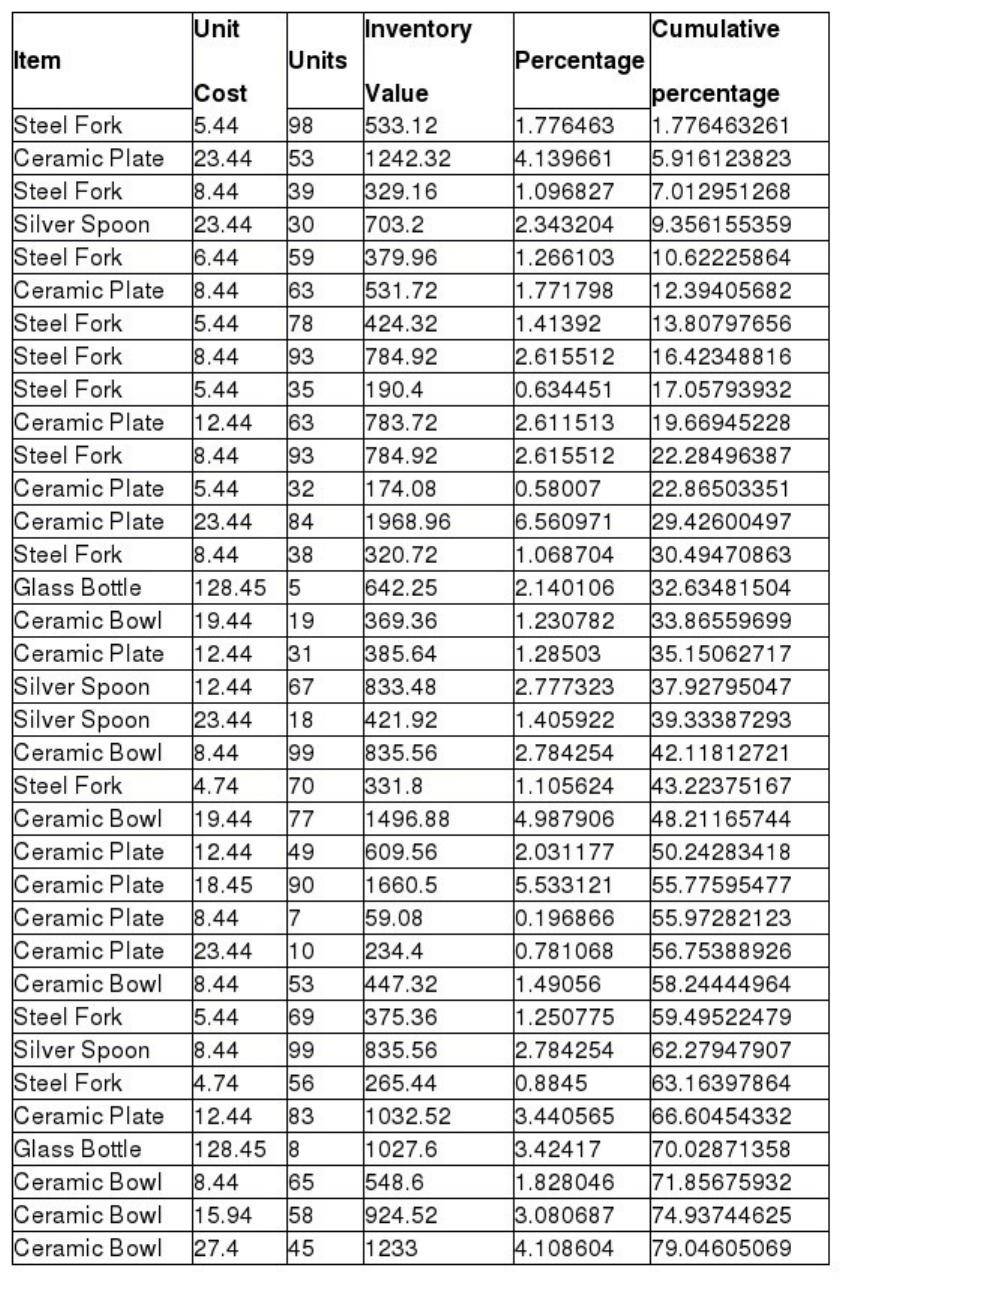
Describe how to sort the data by inventory value to compute cumulative percentage of
total inventory value to help the restaurateur conduct a Pareto analysis. (Assume that no
damages were caused to the inventory purchased over the three months)
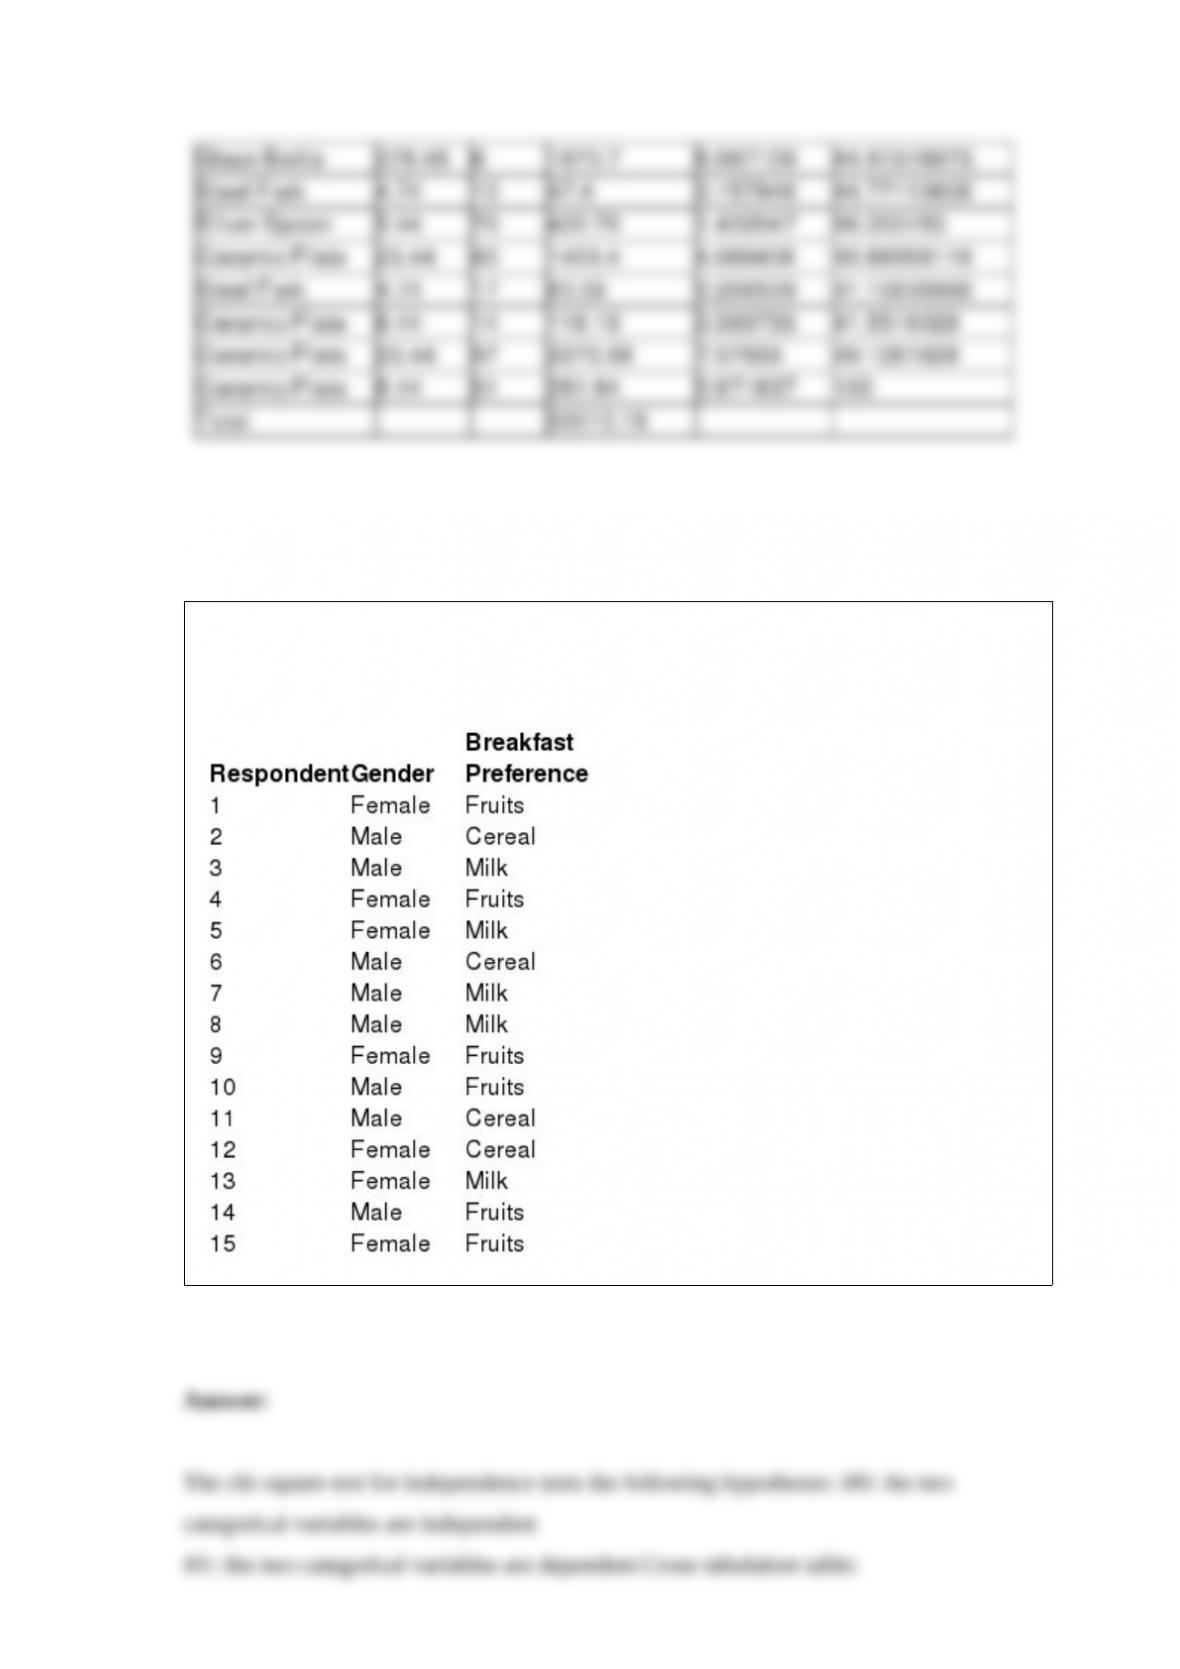
Using the following data, test for the independence of the variables. (Note: Assume a
significance level of 0.05 wherever necessary.)