Bar charts can typically be formed with the bars vertical or horizontal without adversely
affecting the interpretation.
The Cromwell Construction Company has the opportunity to enter into a contract to
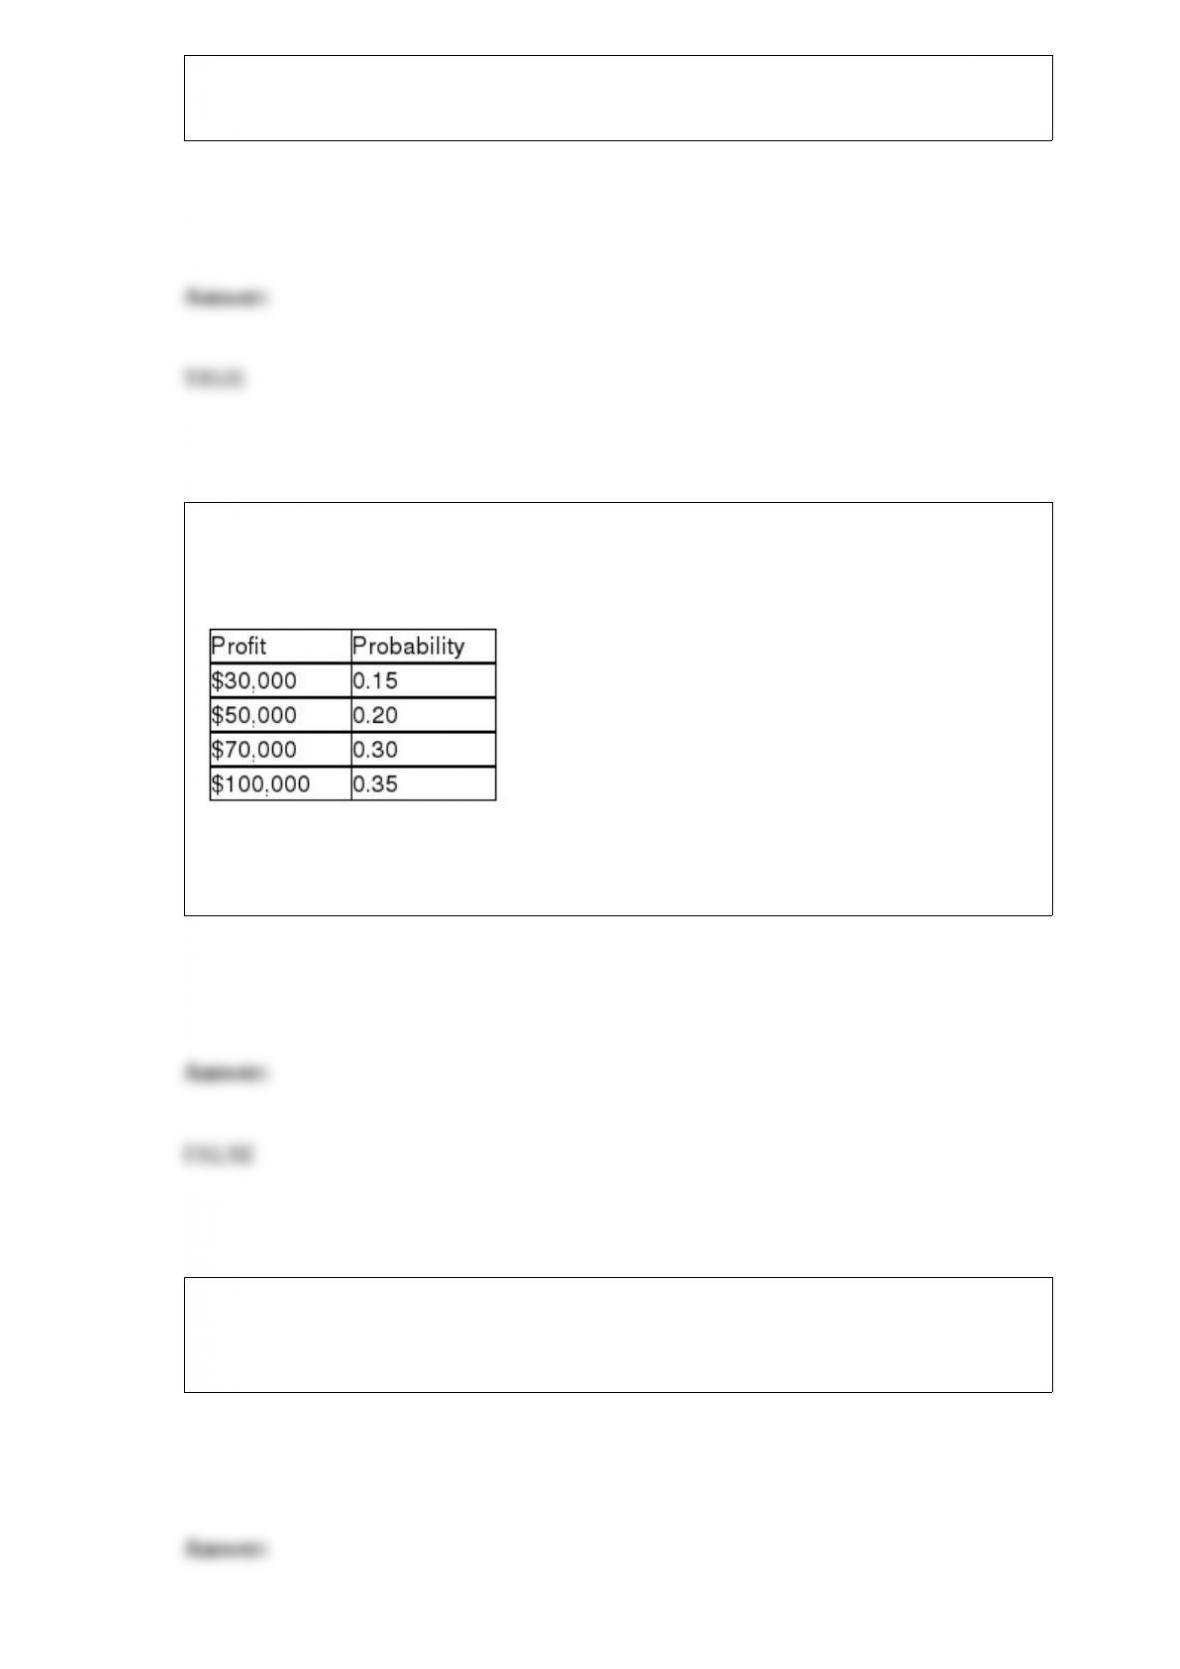
build a mountain road. The following table shows the probability distribution for the
profit that could occur if it takes the contract:
Based on this information, the expected profit for the company if it takes the contract is
$60,000.
A report in a consumer magazine indicated that with 90 percent confidence, the mean
number of hours that a particular brand light bulb lasts is between 900 and 1,100 hours.
Based on this, the sample mean that produced this estimate is 1,000 hours.
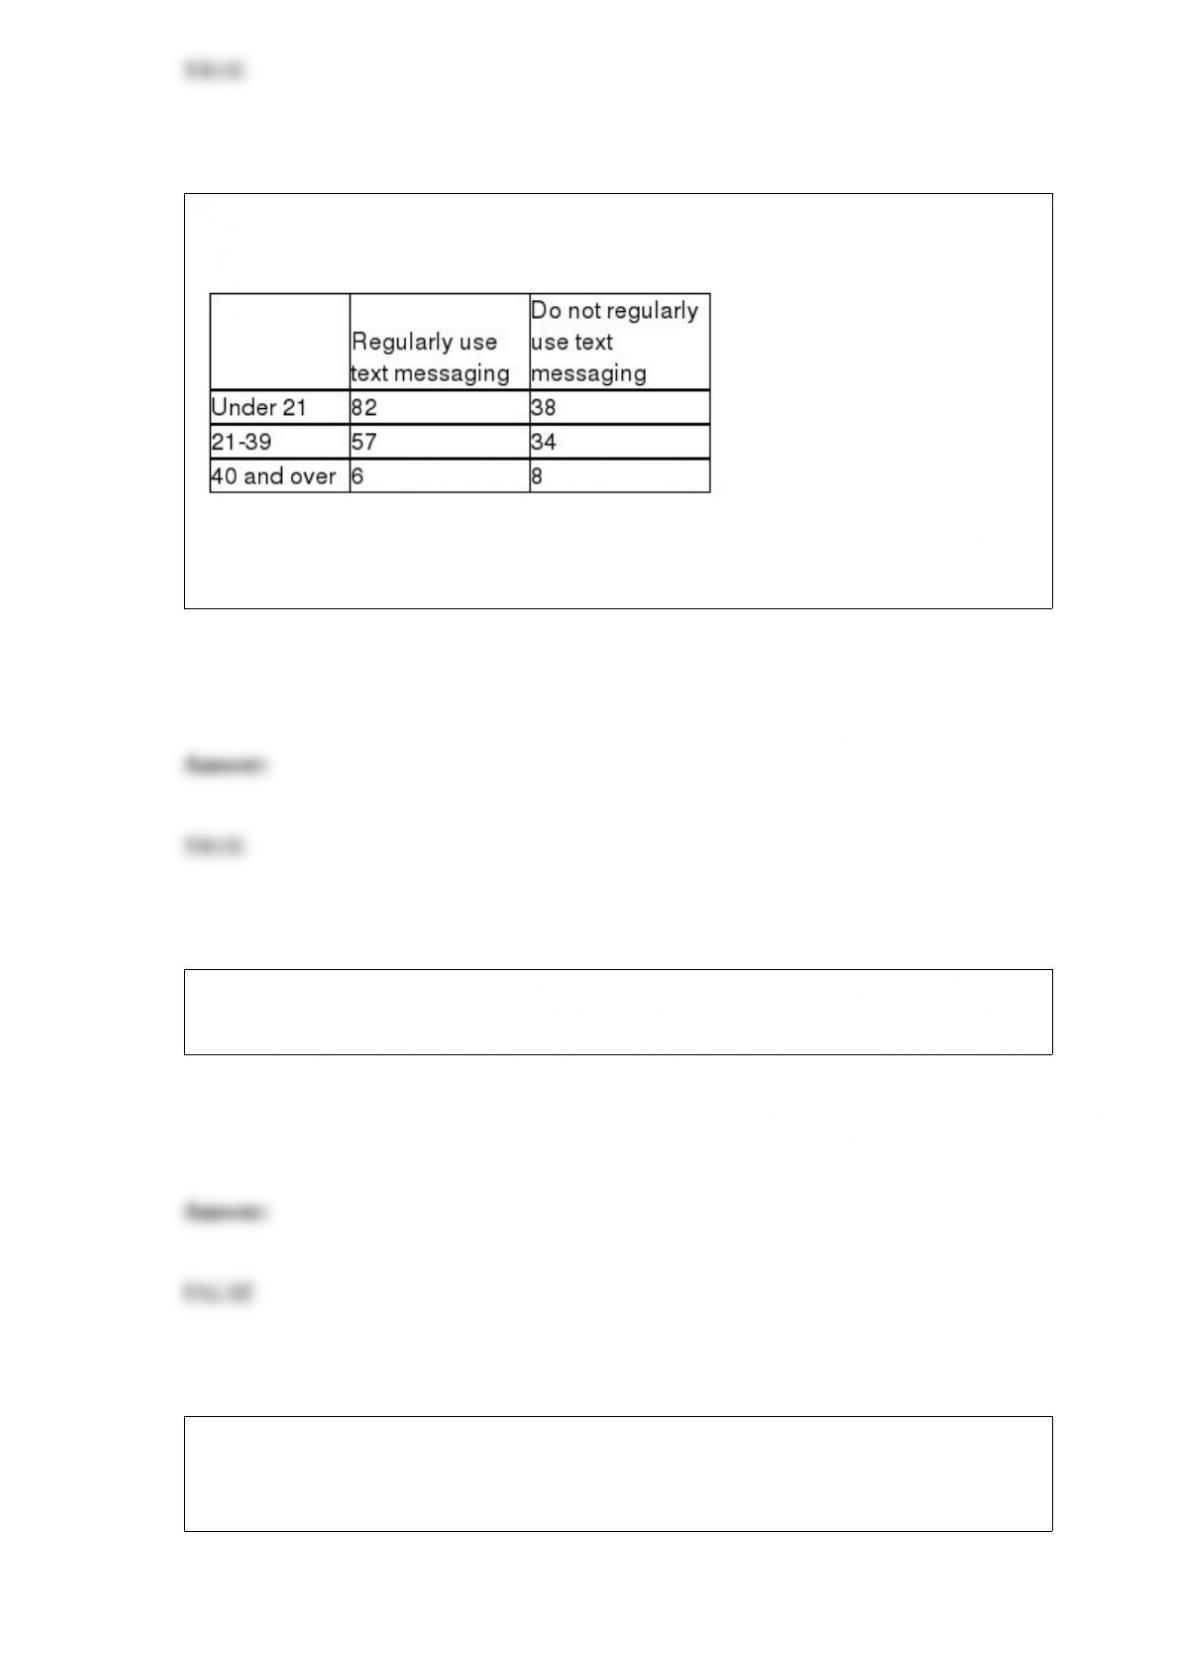
A cell phone company wants to determine if the use of text messaging is independent of
age. The following data has been collected from a random sample of customers.
Using this data, if we wish to test whether the preferred news source is independent of
age using a 0.05 level of significance, the critical value is 5.9915.
If a single die is rolled (a cube where the sides are numbered 1 through 6), the
probability of rolling at least a 3 is 0.33.
Managers for a company that produces a weight loss product claim that the median
weight lost over six weeks for people who use this product will be at least 20 pounds.
The following data were collected from a sample of nine people who used the product.
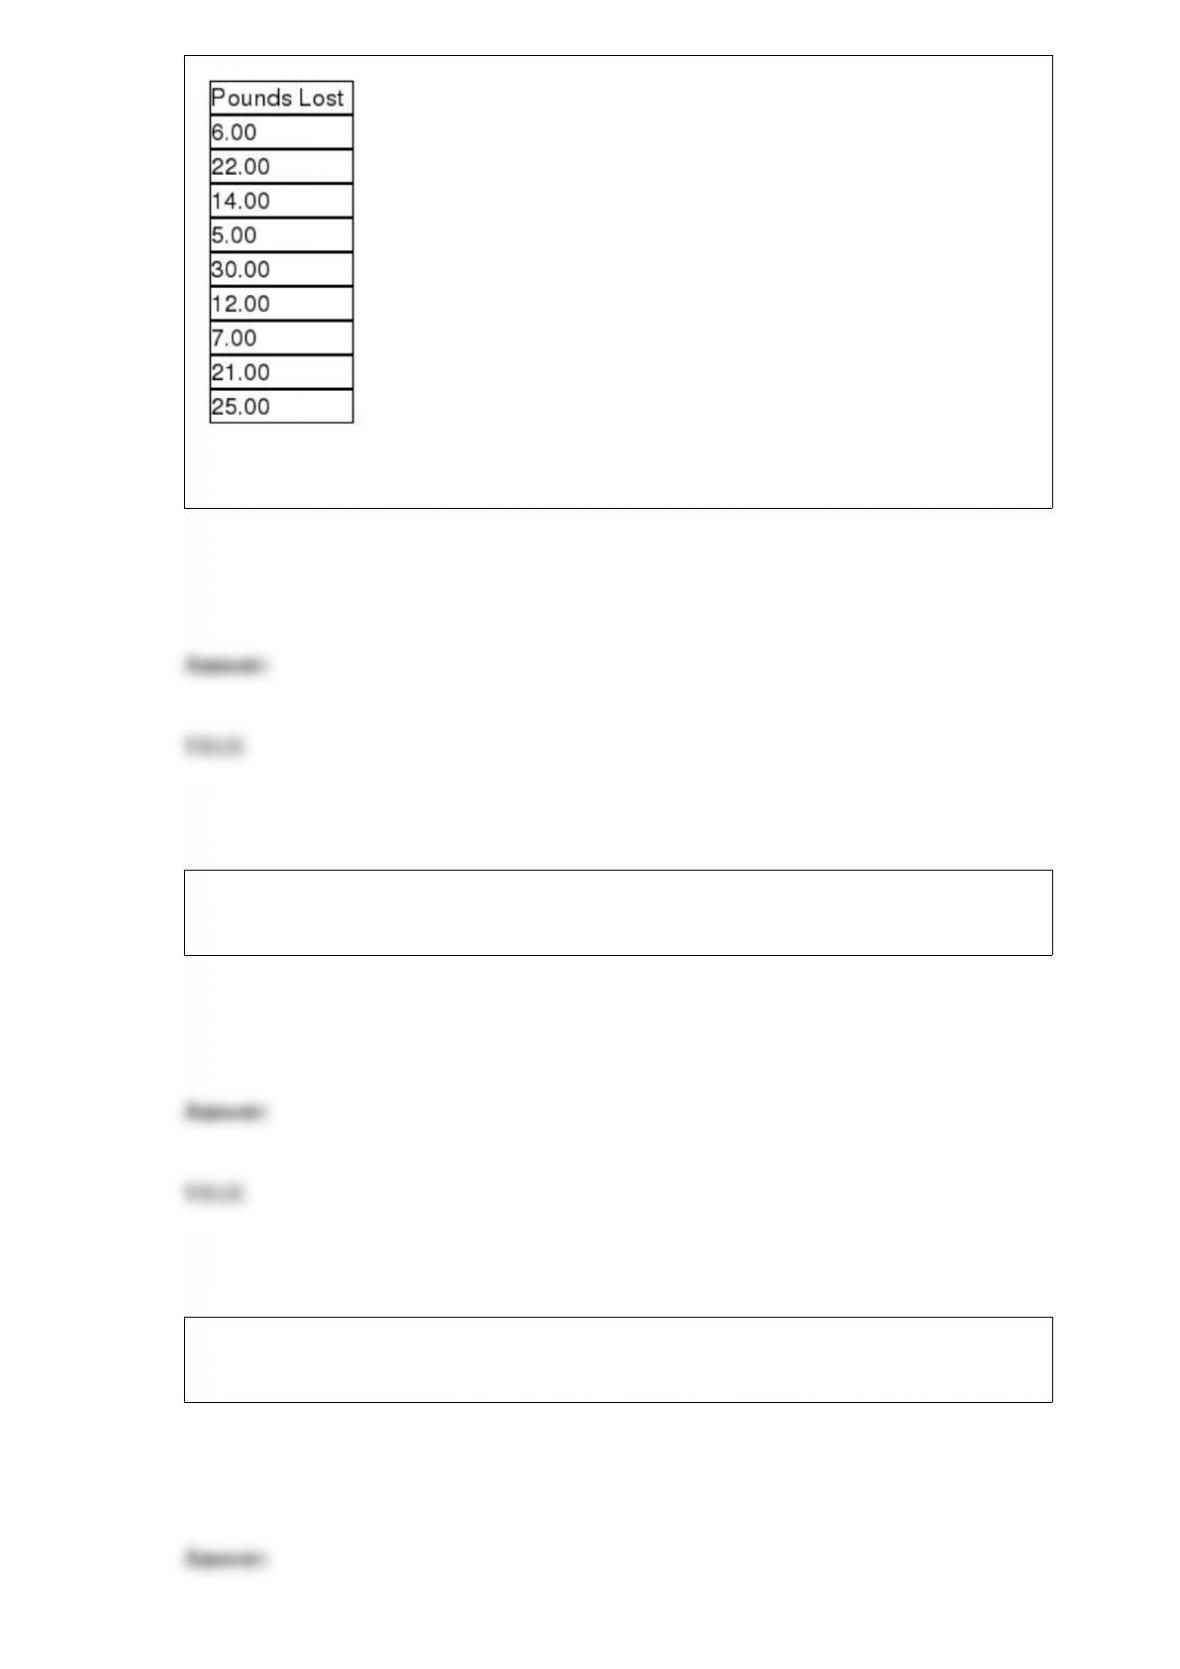
Based on these data, the test statistic is W = 12.
When comparing experiments, surveys, and direct observation as methods of data
collection, the method that would typically be the least expensive is surveys.
When the United States conducts a census that counts all people in the country, this is
an example of using a sample.
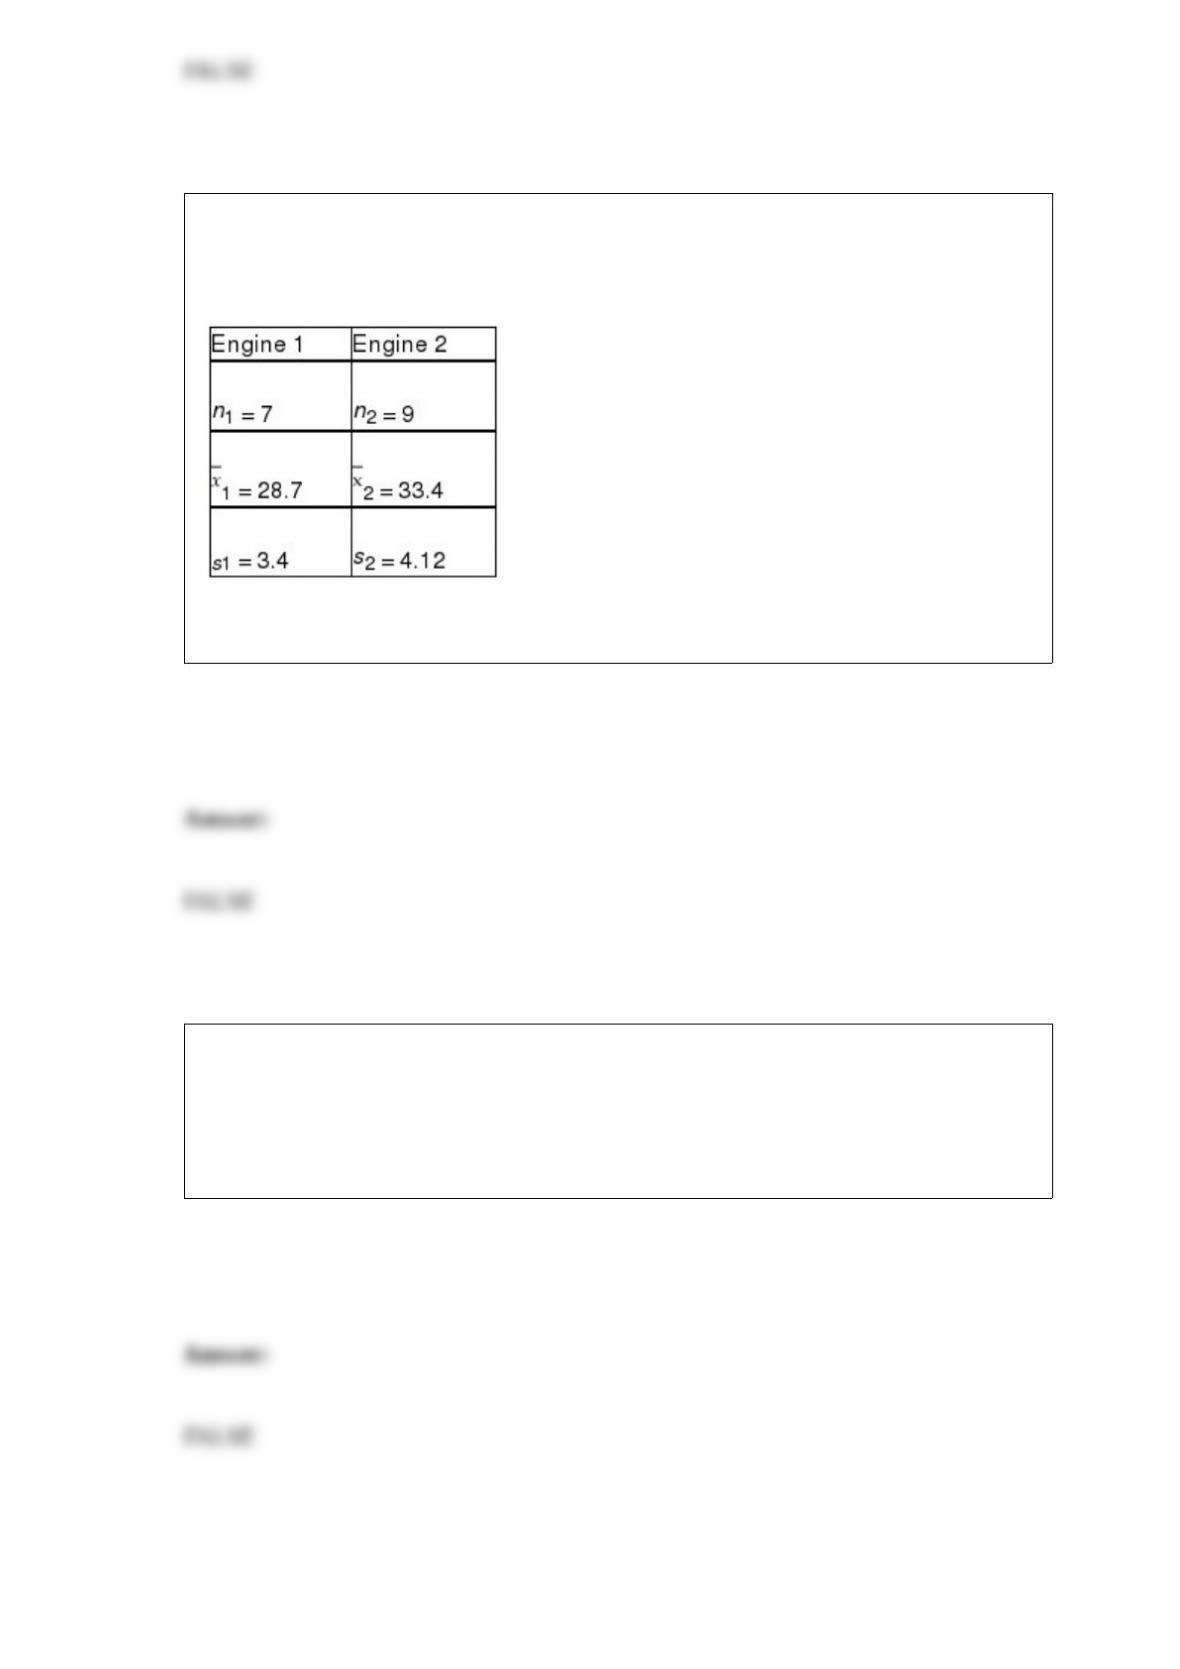
One of the major automobile makers has developed two new engines. At question is
whether the two engines have the same variability with respect to miles per gallon. To
test this, the following information is available:
Based on this situation and the information provided, the test statistic is 1.2118.
The director of the city Park and Recreation Department claims that the mean distance
people travel to the city’s greenbelt is more than 5.0 miles. Assuming that the
population standard deviation is known to be 1.2 miles and the significance level to be
used to test the hypothesis is 0.05 when a sample size of n = 64 people are surveyed, the
critical value is approximately 4.75 miles.
Recently the State Fish and Game planted several thousand tagged fish in a local river.
The mean length of these fish, which constitute a population, is 12.6 inches. Yesterday,
fishermen caught 100 of these tagged fish. You could expect that the mean length for
these fish would be 12.6 inches as well since they come from the population.
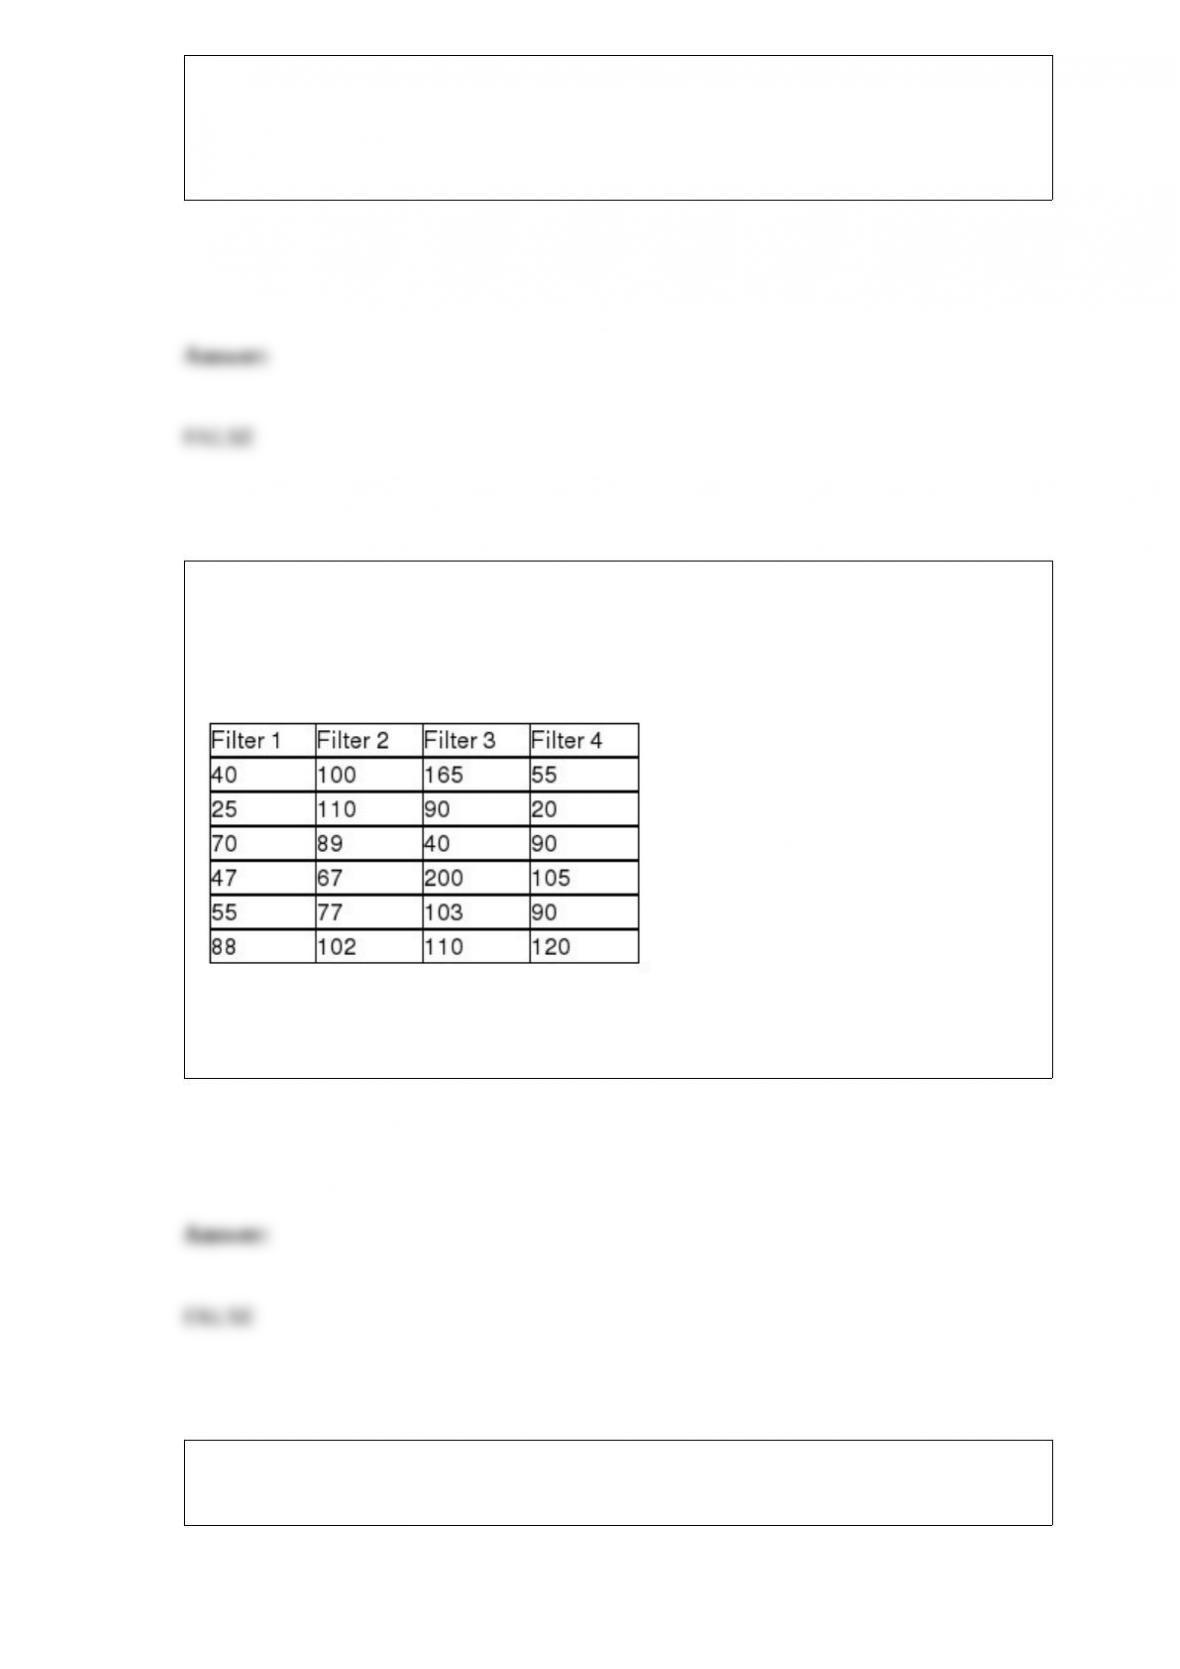
The makers of furnace filters recently conducted a test to determine whether the median
number of particulates that would pass through their four leading filters was the same. A
random sample of 6 of each type of filter was used with the following data being
recorded:
The Kruskal-Wallis test can be used in this case since it requires that the sample sizes
be equal.
A variable that has all the properties of an interval variable, but also has a true zero, is a
ratio level variable.
A cellular phone service provider believes that there is negative correlation between the
minutes used by its customers and the age of the customer. To test this, the following
would be the appropriate null and alternative hypotheses:
H0 : ρ = 0.0
Ha : ρ ≠ 0.0
In a hypothesis test involving two population variances, if the null hypothesis states that
the two variances are strictly equal, then the test statistic is a chi-square statistic.
In estimating the difference between two population means based on small, independent
samples from the two populations, two important assumptions are that the populations
each be normally distributed and the populations have equal variances.
When developing a scatter diagram, it is appropriate to connect the points on the graph
with straight lines or the lines can be omitted.
If you have an ordinal variable, it is possible to precisely measure the magnitude of the
difference between the possible values of the variable.
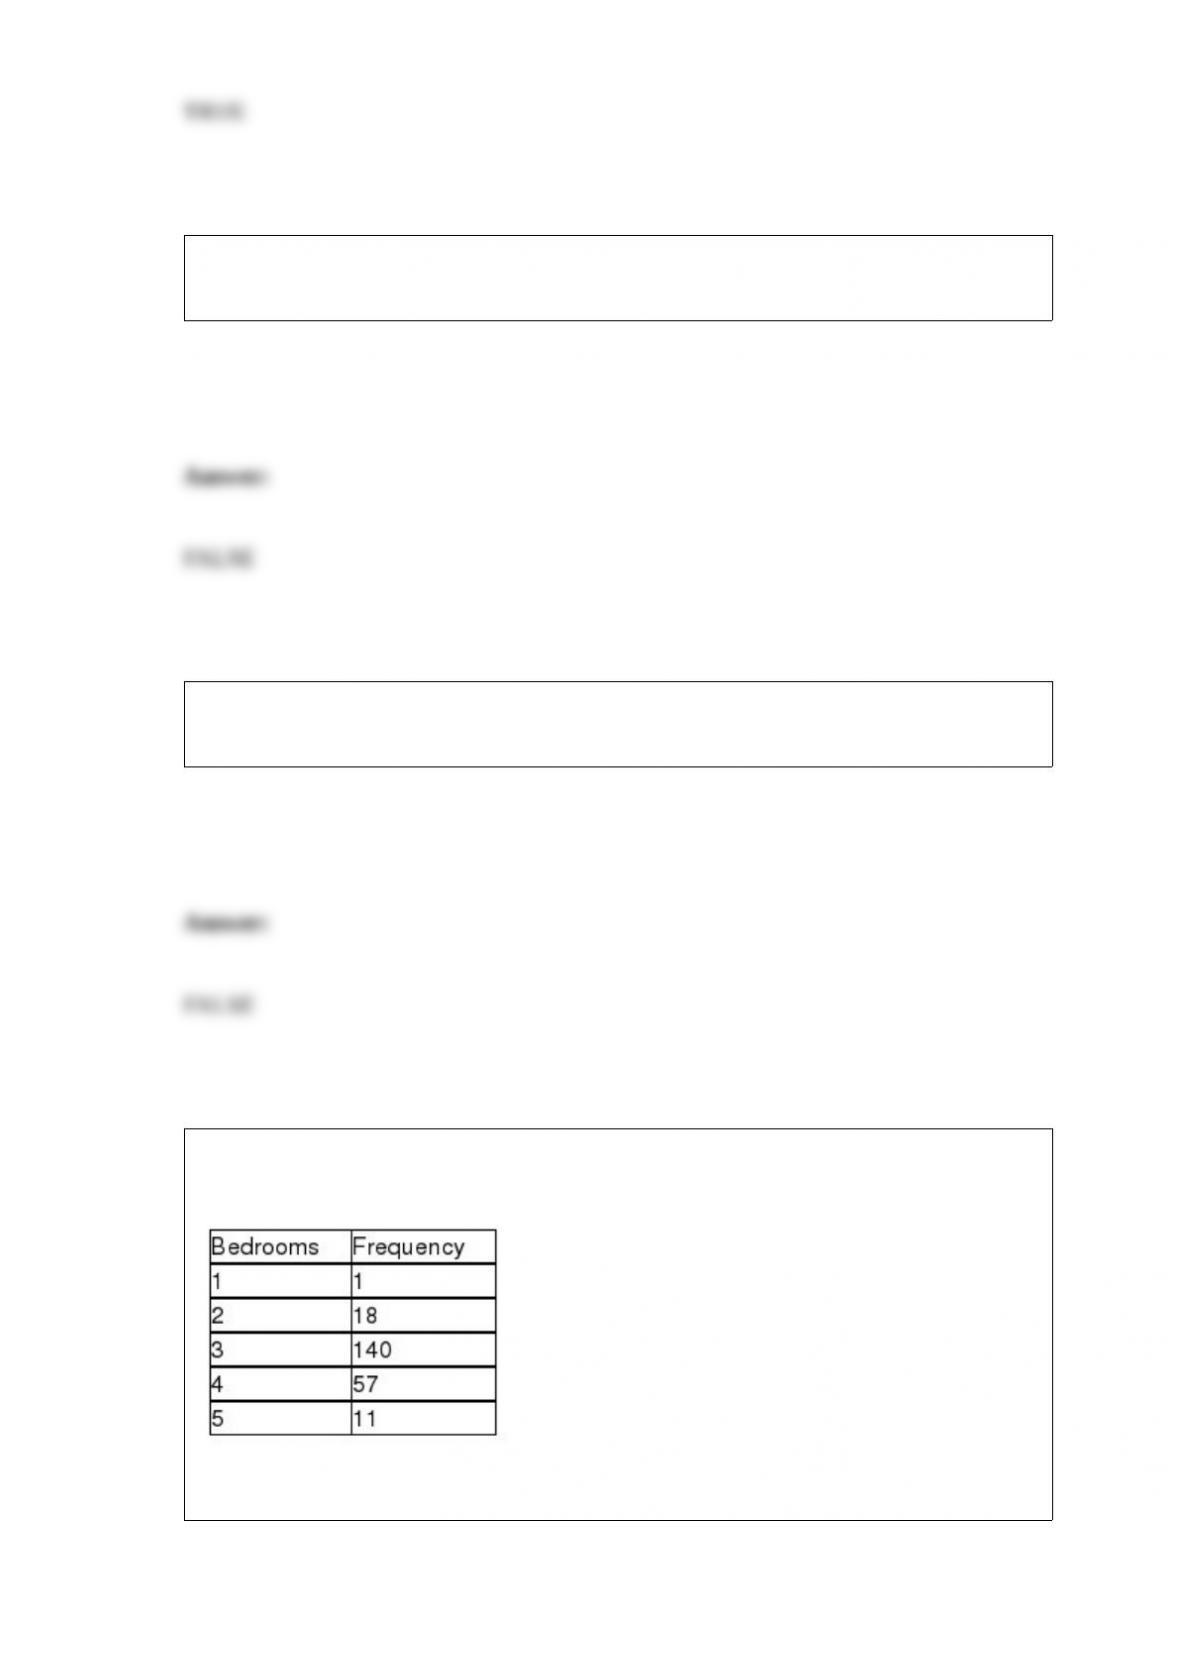
Suppose a study of houses that have sold recently in your community showed the
following frequency distribution for the number of bedrooms:
Based on this information, the median number of bedrooms in houses sold is 3.20.
In a two-factor ANOVA study, if the two factors do not interact, then neither factor A
nor factor B can be considered statistically significant.
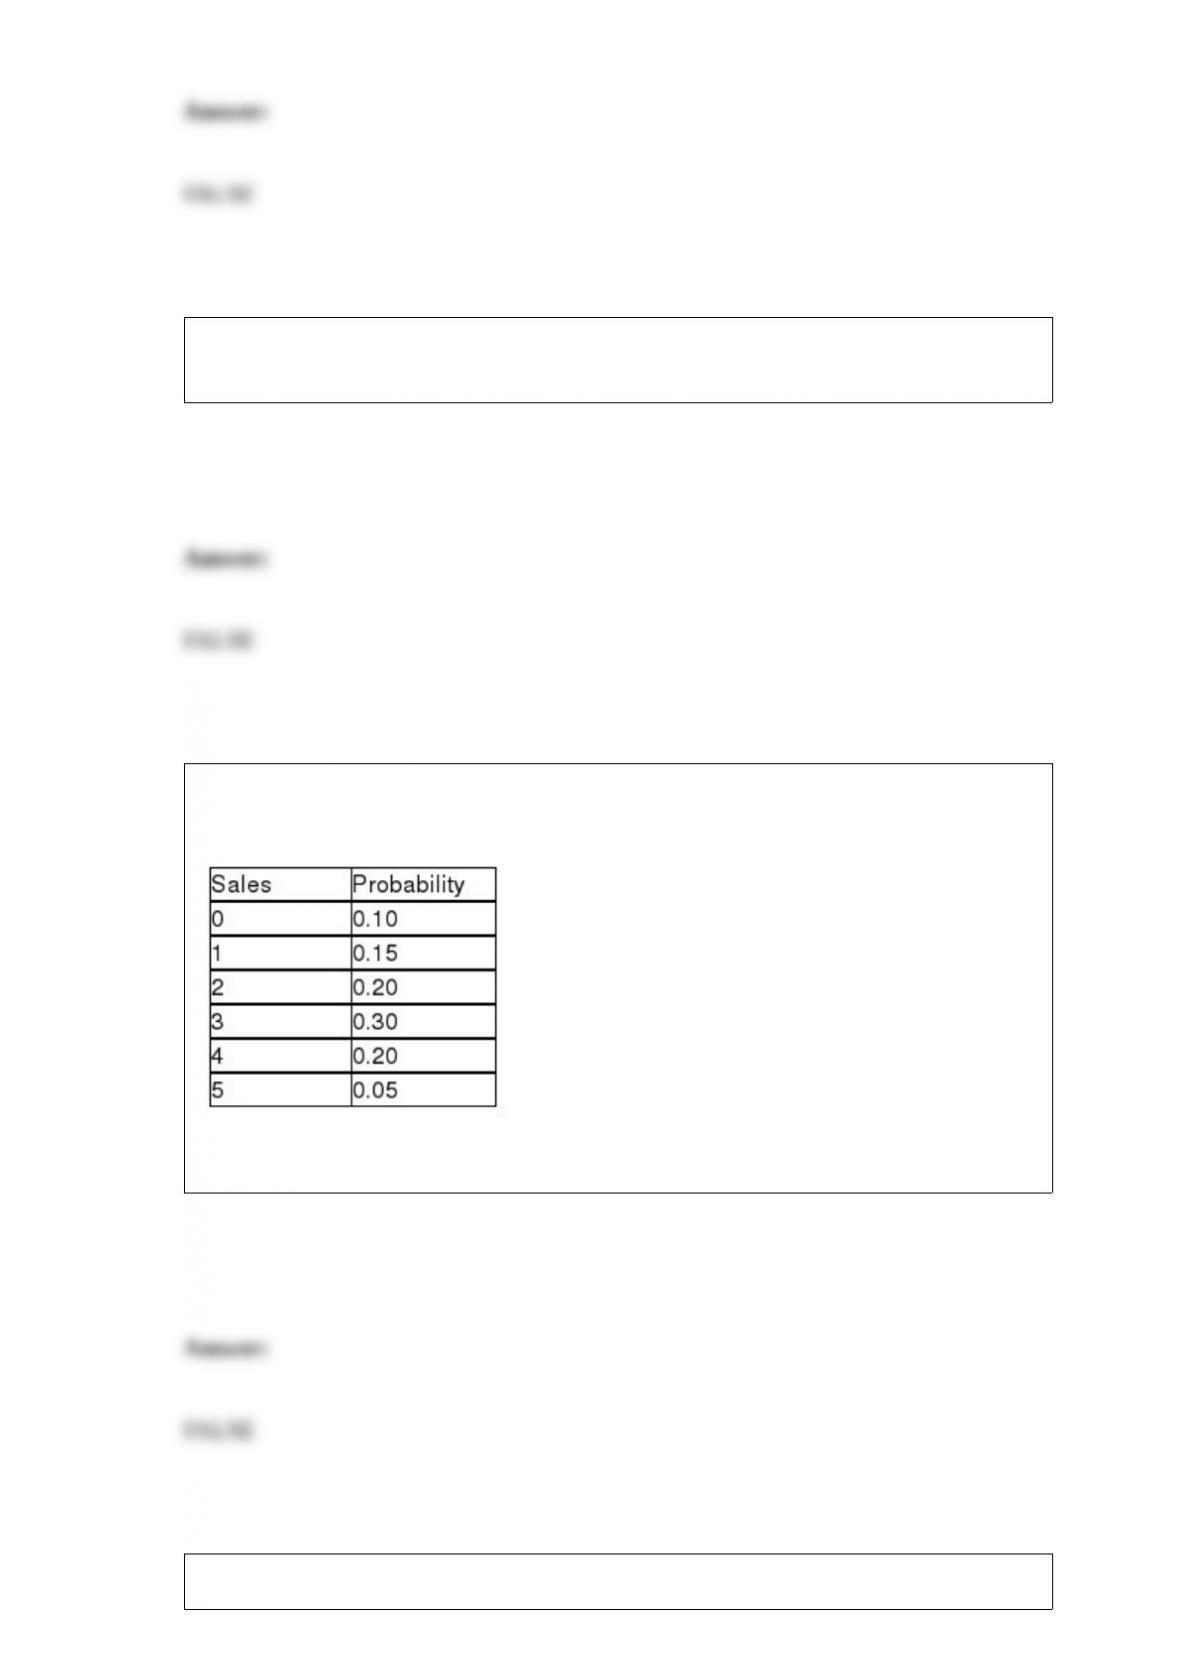
The following probability distribution was subjectively assessed for the number of sales
a salesperson would make if he or she made five sales calls in one day.
Given this distribution, the probability that the number of sales is more than 2 is 0.80.
A study has recently been conducted by a major computer magazine publisher in which
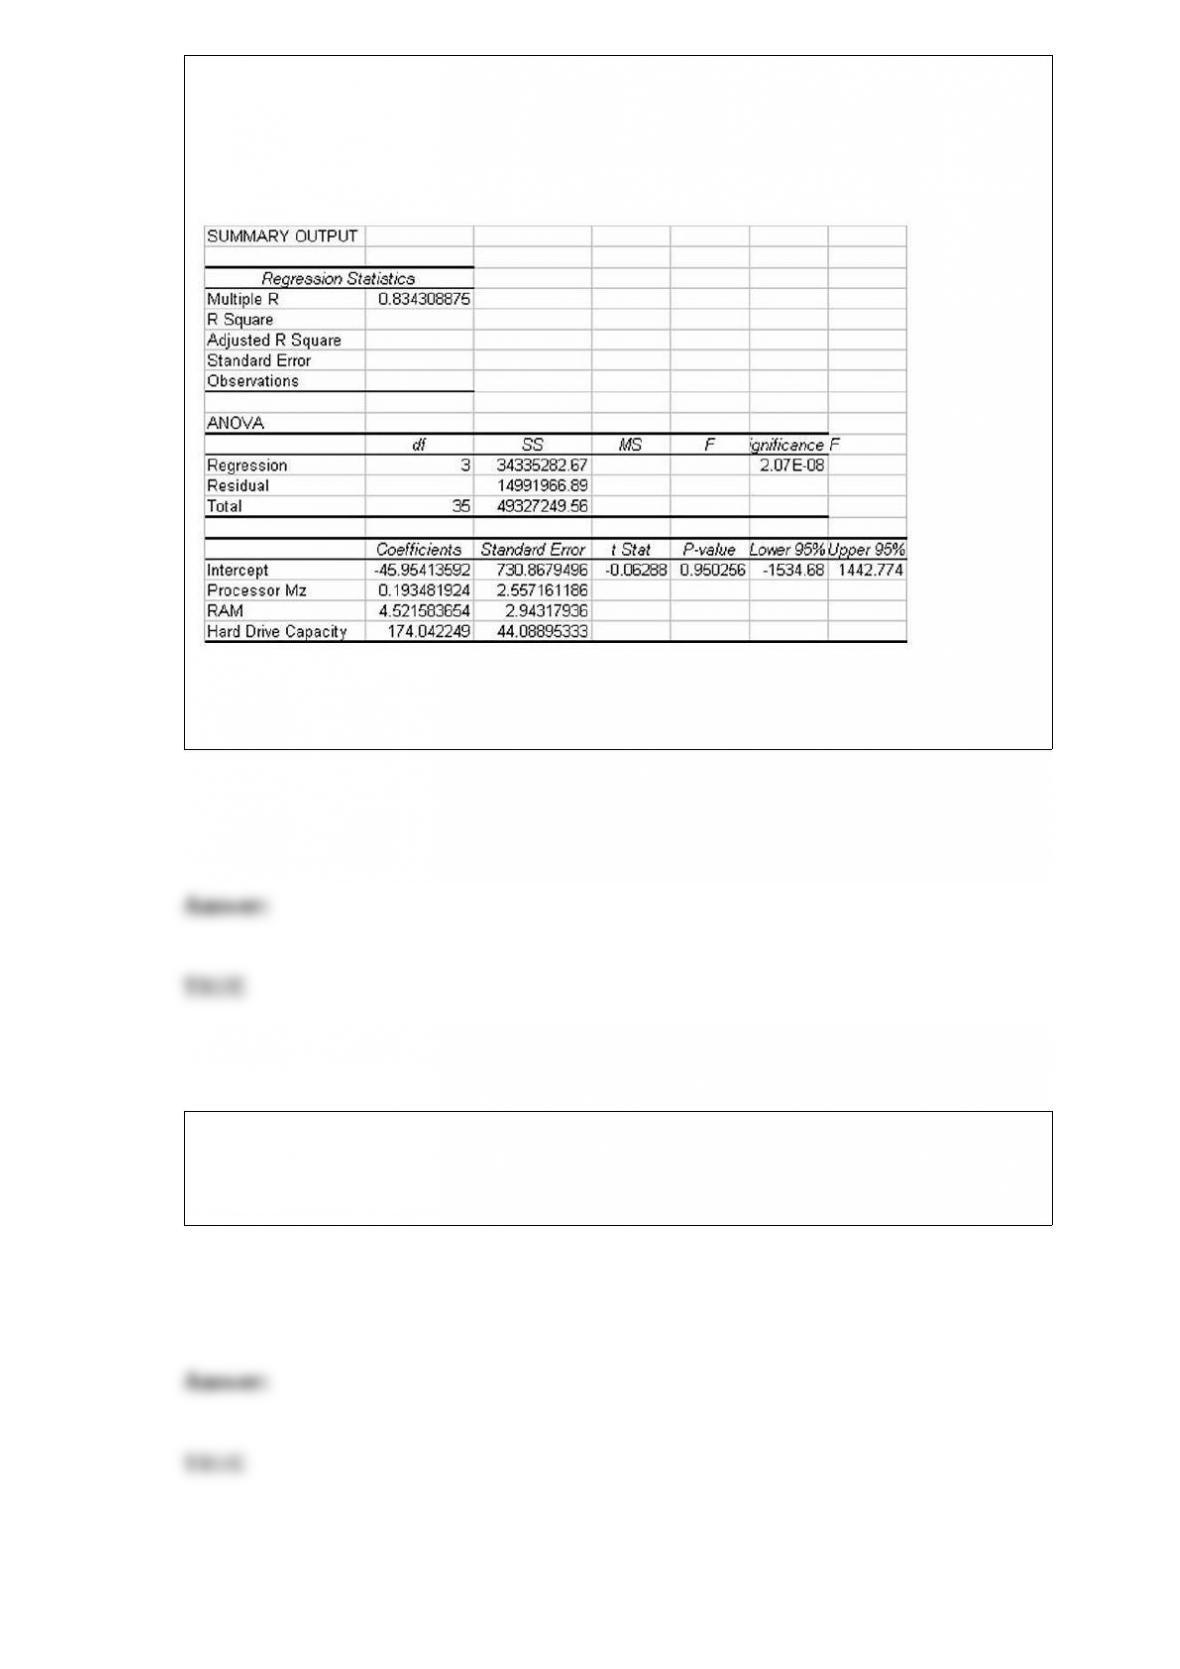
the objective was to develop a multiple regression model to explain the variation in
price of personal computers. Three independent variables were used. The following
computer printout shows the final output. However, several values are omitted from the
printout.
Given this information, the regression model explains just under 70 percent of the
variation in the price of personal computers.
In estimating a population proportion, the factors that are needed to determine the
required sample size are the confidence level, the margin of error and some idea of what
the population proportion is.
A direct marketing company believes that the probability of making a sale when a call
is made to an individual’s home is .02. The probability of making 2 or 3 sales in a
sample of 20 calls is .0593.
The distribution of dollars paid for car insurance by car owners in a major east coast
city is bell-shaped with a mean equal to $750 every six months and a standard deviation
equal to $100. Based on this information we should use Tchebysheff’s theorem to
determine the conservative percentage of car owners that will pay between $550 and
$950 for car insurance.
The sample mean is an estimate of μ and may be either higher or lower than μ
depending on the sample.
In a study of 30 customers’ utility bills in which the monthly bill was the dependent
variable and the number of square feet in the house is the independent variable, the
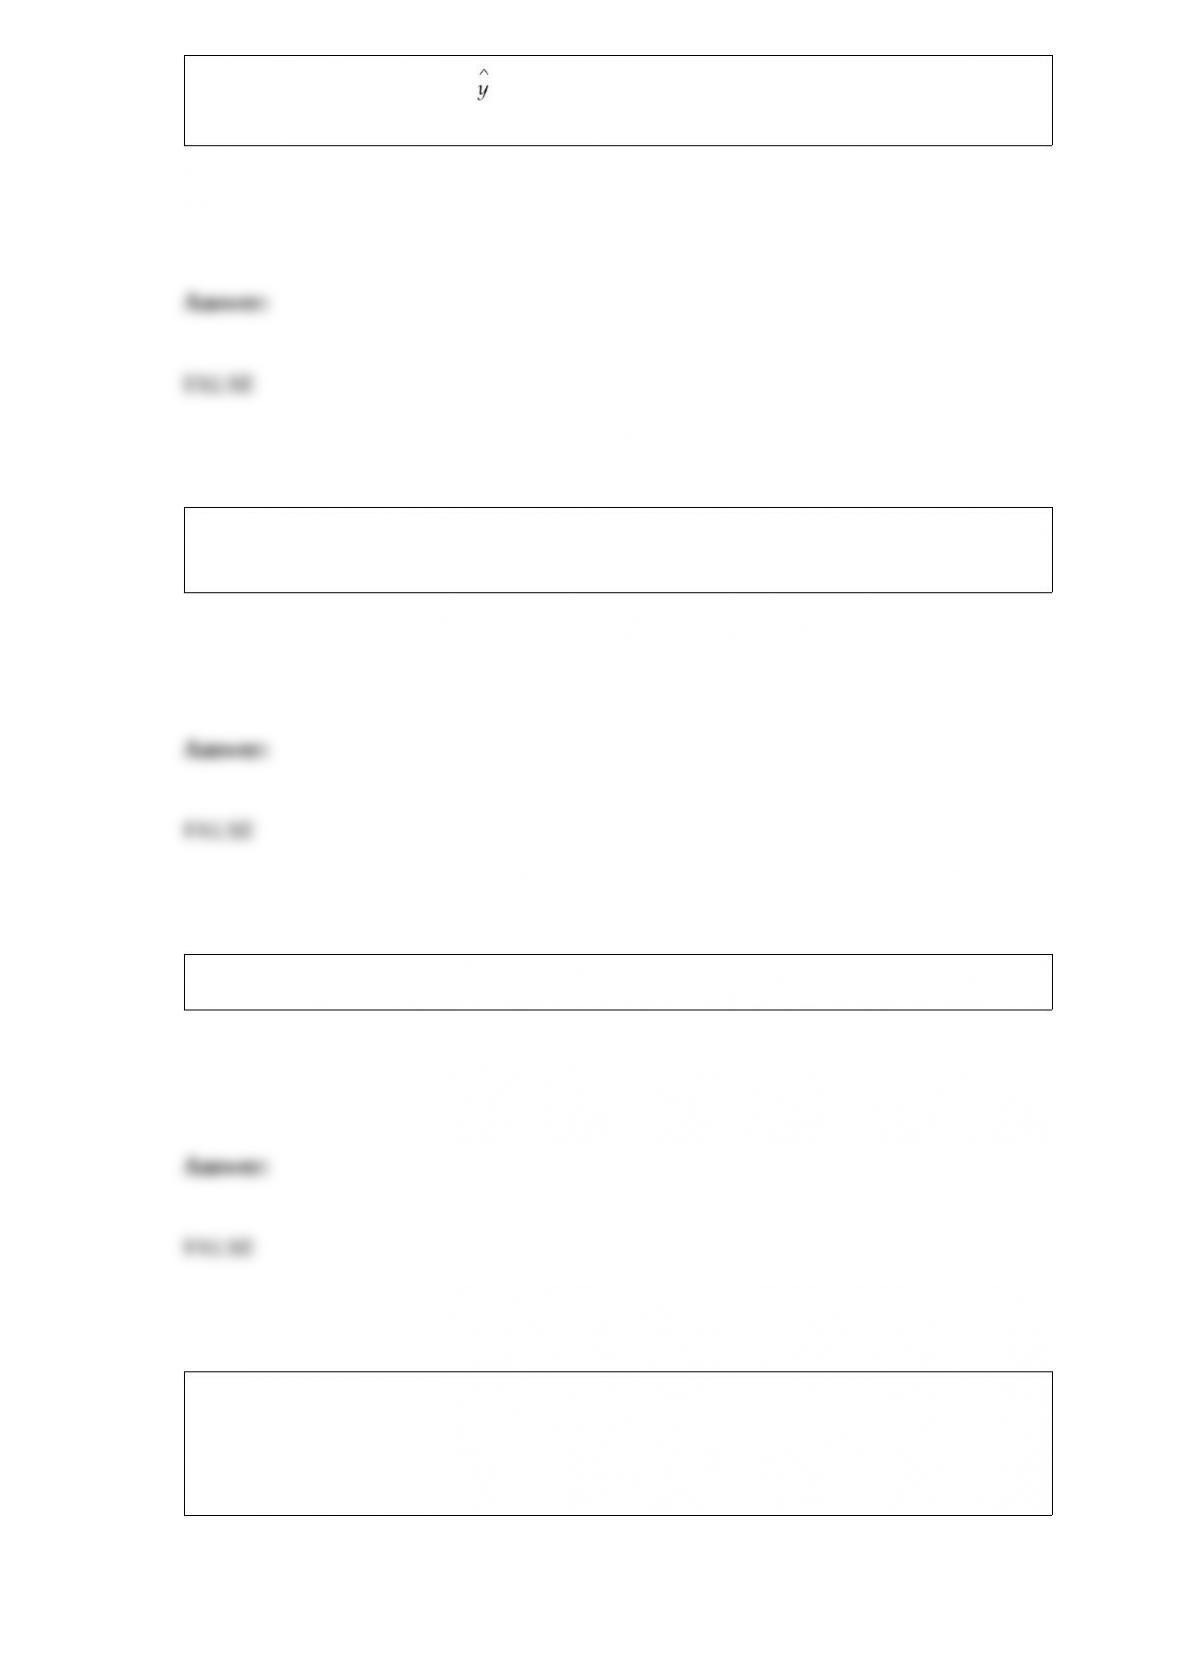
resulting regression model is = 23.40 + 0.4x. Based on this model, the expected utility
bill for a customer with a home with 2,300 square feet is approximately $92.00.
A one-tailed hypothesis for a population mean with a significance level equal to .05 will
have a critical value equal to z = .45.
Sampling error can be eliminated if the sample size is large enough.
Sawyer & Company is a law firm in Dallas, Texas. Recently, the administrative
manager prepared a report for the managing partners that showed the number of court
cases handled by the firm monthly over the past three years. One of the objectives of
graphing these data might have been to identify a trend in the number of court cases.

The fact that teachers’ salaries in Wisconsin are correlated with egg prices in Texas
means that the two variables are spuriously correlated since a change in one variable
could not cause the change in the other.
The one-way ANOVA test involves assuming that the population variances are equal.
When a construction company bids on a contract, the events will be win or lose. The
closer the probability is to 0.50, the greater the uncertainty about whether the company
will win or lose the bid.
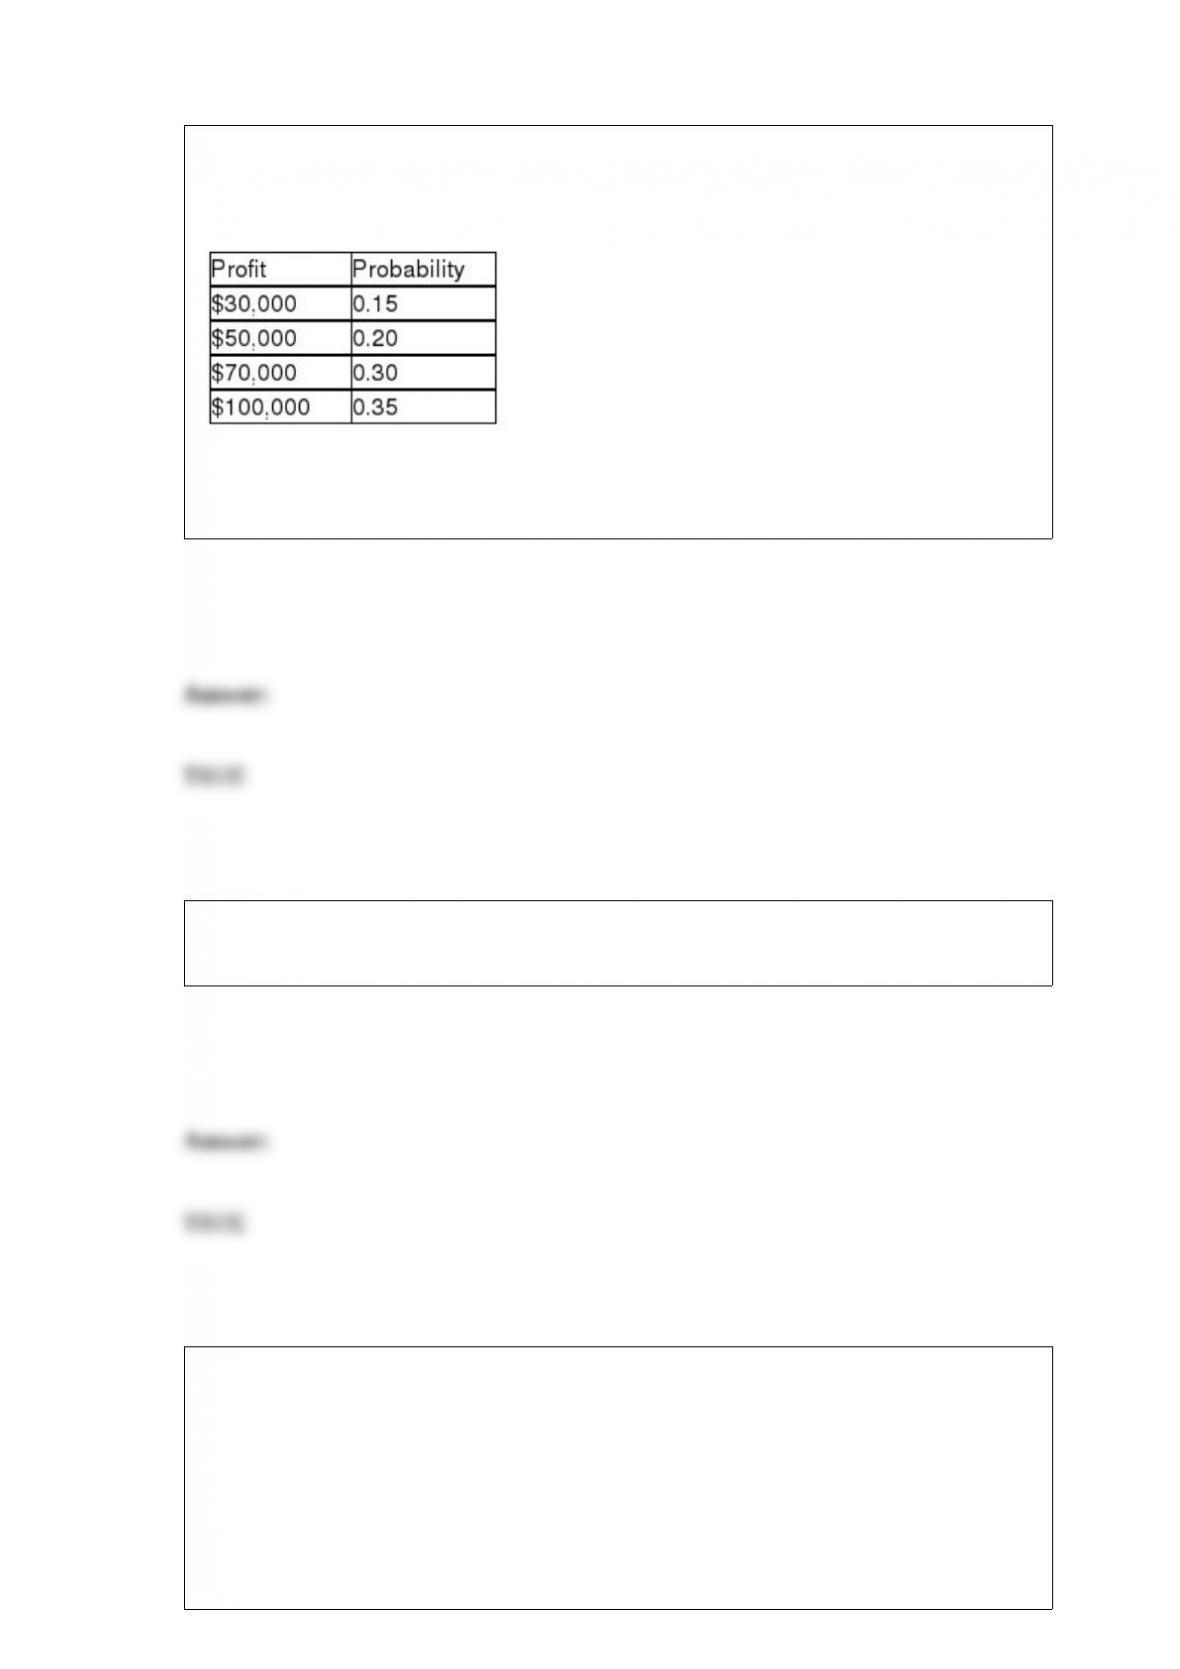
The Cromwell Construction Company has the opportunity to enter into a contract to
build a mountain road. The following table shows the probability distribution for the
profit that could occur if it takes the contract:
Based on this information, the expected profit for the company if it takes the contract is
$70,500.
One of the assumptions of the Mann-Whitney U test is that the population distributions
are the same for shape and spread.
The Maple Grove Hotel manager has collected data on the number of rooms occupied
each evening for the past 700 nights. The fewest rooms occupied during that period was
11 and the most was the capacity, 430. Based on this information, which of the
following would be reasonable class limits for the first class if the manager wishes to
use 8 classes to develop a frequency distribution?
A) 0 to 40

B) 10 to < 65
C) 11 to 19
D) 0 to 52.38
John Thurgood founded a company that translates Chinese books into English. His
company is currently testing a computer-based translation service. Since Chinese
symbols are difficult to translate, John assumes the computer program will make some
errors, but then so do human translators. The computer error rate is supposed to be an
average of 3 per 400 words of translation. Suppose John randomly selects a 1,200-word
passage. Assuming that the Poisson distribution applies, if the computer error rate is
actually 3 errors per 400 words, find the probability that fewer than 9 errors will be
found.
A) 0.000123
B) 0.0141
C) 0.0415
D) 0.4557
Which of the following is not a type of commonly used process control chart?
A) x-bar chart
B) R-chart
C) p-chart
D) n-chart
A company has 400 employees. The manager of human resources has recorded the
annual salary and wages for each employee. These value range from $17,500 to
$67,800. Provide an example of a stem and a leaf that could be developed to describe
the distribution of the salary and wage data.
Given a population where the proportion of items with a desired attribute is p = 0.25, if
a sample of 400 is taken, what is the probability the proportion of successes in the
sample will be greater than 0.22?
A) 0.9162
B) 0.8812
C) 0.7141
D) 0.8412
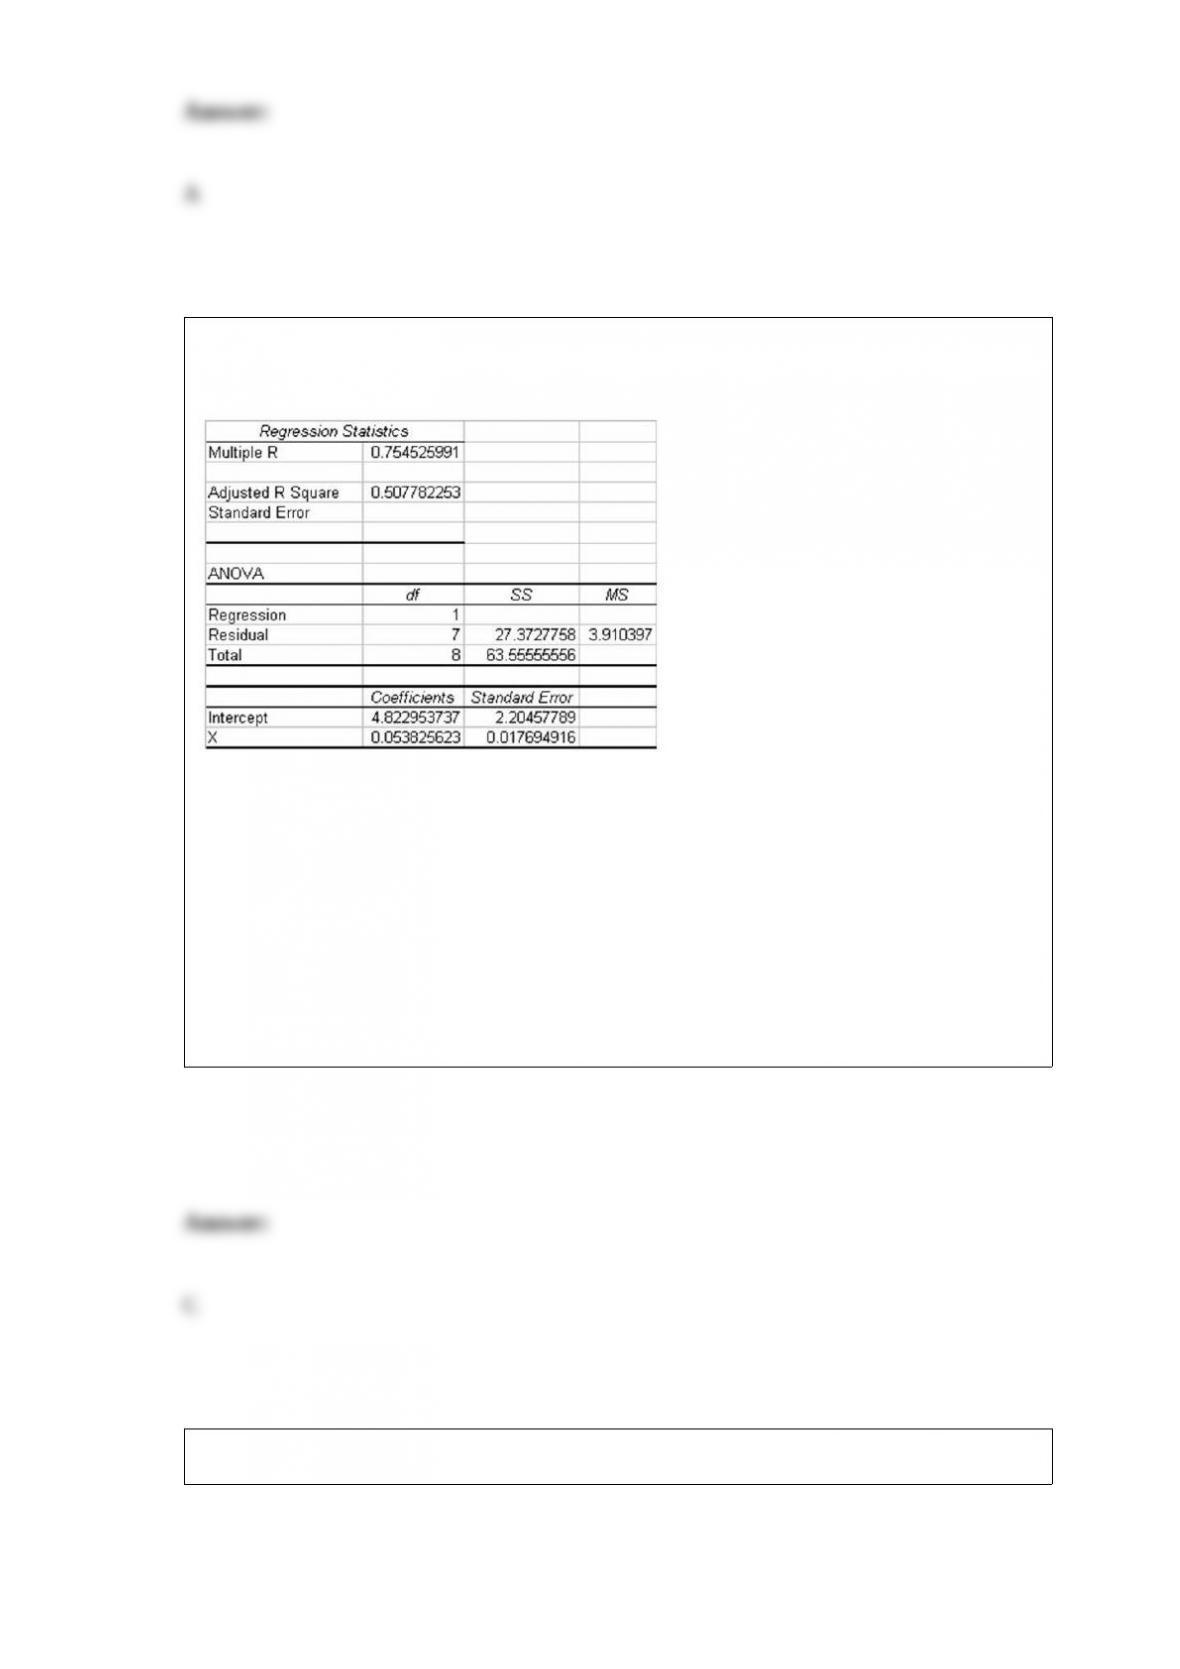
The following regression output is available. Notice that some of the values are
missing.
Given this information, what was the sample size used in the study?
A) 8
B) 18
C) 9
D) 16
Consider the following:
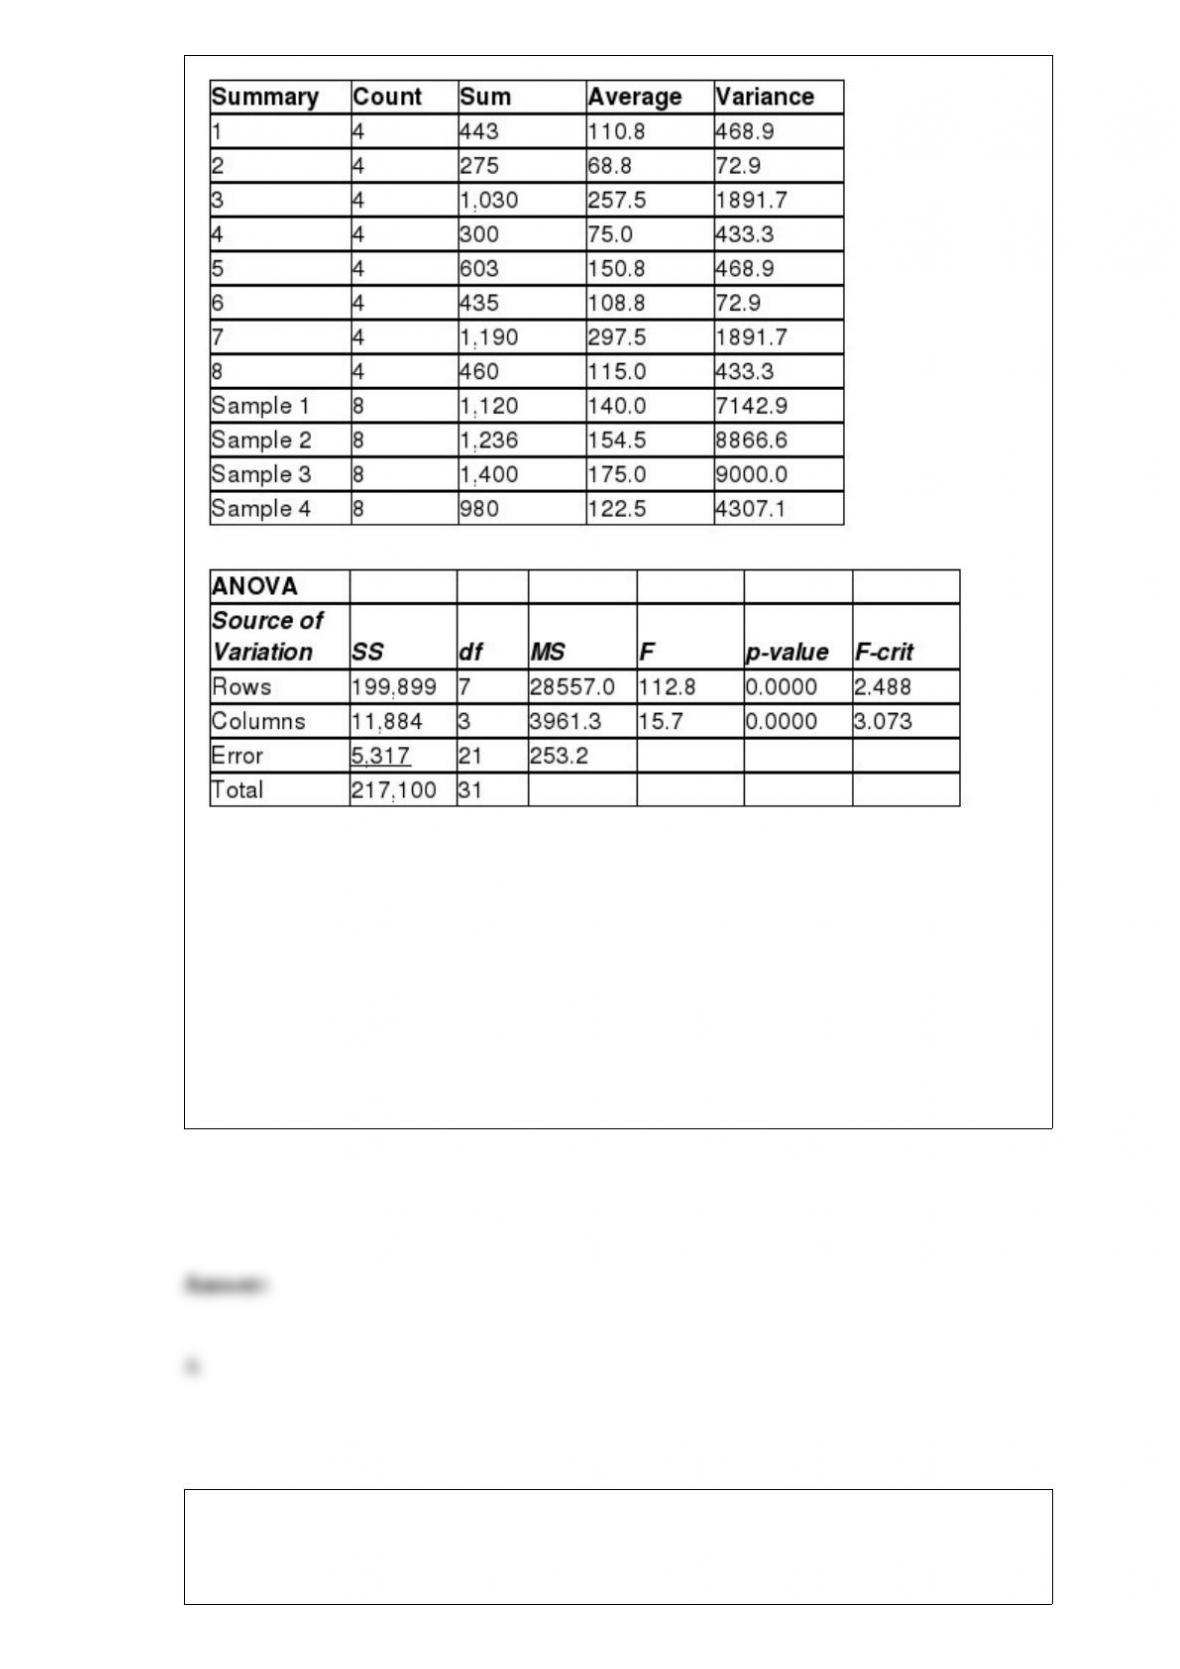
How many populations are involved in this test?
A) 4
B) 2
C) 5
D) 3
If a systematic random sample is to be selected of size 100 from a population with
5,000 items, the first item selected from the ordered population will be:

A) randomly selected between 1 and 100.
B) randomly selected between 1 and 50.
C) any randomly selected value between 1 and 5,000.
D) item 50.
When a customer enters a store there are three outcomes that can occur: buy nothing,
buy a small amount, or buy a large amount. In this situation, if a customer buys a large
amount, he or she cannot also buy a small amount or buy nothing. Thus the events are:
A) independent.
B) mutually exclusive.
C) all inclusive.
D) dependent events.
In an article entitled “Fuel Economy Calculations to Be Altered,” James R. Healey
indicated that the government planned to change how it calculates fuel economy for
new cars and trucks. This is the first modification since 1985. It is expected to lower
average mileage for city driving in conventional cars from 10% to 20%. AAA has
forecast that the 2008 Ford F-150 would achieve 15.7 mile per gallon (mpg). The 2008
Ford F-150 was tested by AAA members driving the vehicle themselves and was found
to have an average of 14.3 mpg. Assume that the mean obtained by AAA members is

the true mean for the population of 2008 Ford F-150 trucks and that the population
standard deviation is 5 mpg. The current method of calculating the mpg forecasts that
the 2008 F-150 will average 16.8 mpg. Determine the probability that these same 100
AAA members would average more than 16.8 mpg while testing the 2008 F-150.
A) 0
B) 0.0155
C) 0.0412
D) None of the above
The file Danish Coffee contains a random sample of 144 Danish coffee drinkers and
measures the annual coffee consumption in kilograms for each sampled coffee drinker.
A marketing research firm wants to use this information to develop an advertising
campaign to increase Danish coffee consumption.
Based on the sample’s results, what is the best point estimate of average annual coffee
consumption for Danish coffee drinkers?
A) 6.5368
B) 7.4151
C) 6.1411
D) 7.4127
One characteristic of a bar chart is:
A) the bars can be displayed either vertically or horizontally.
B) there can be no gaps between the bars.
C) it is used to display the distribution of a continuous variable.
D) it shows cumulative frequency.
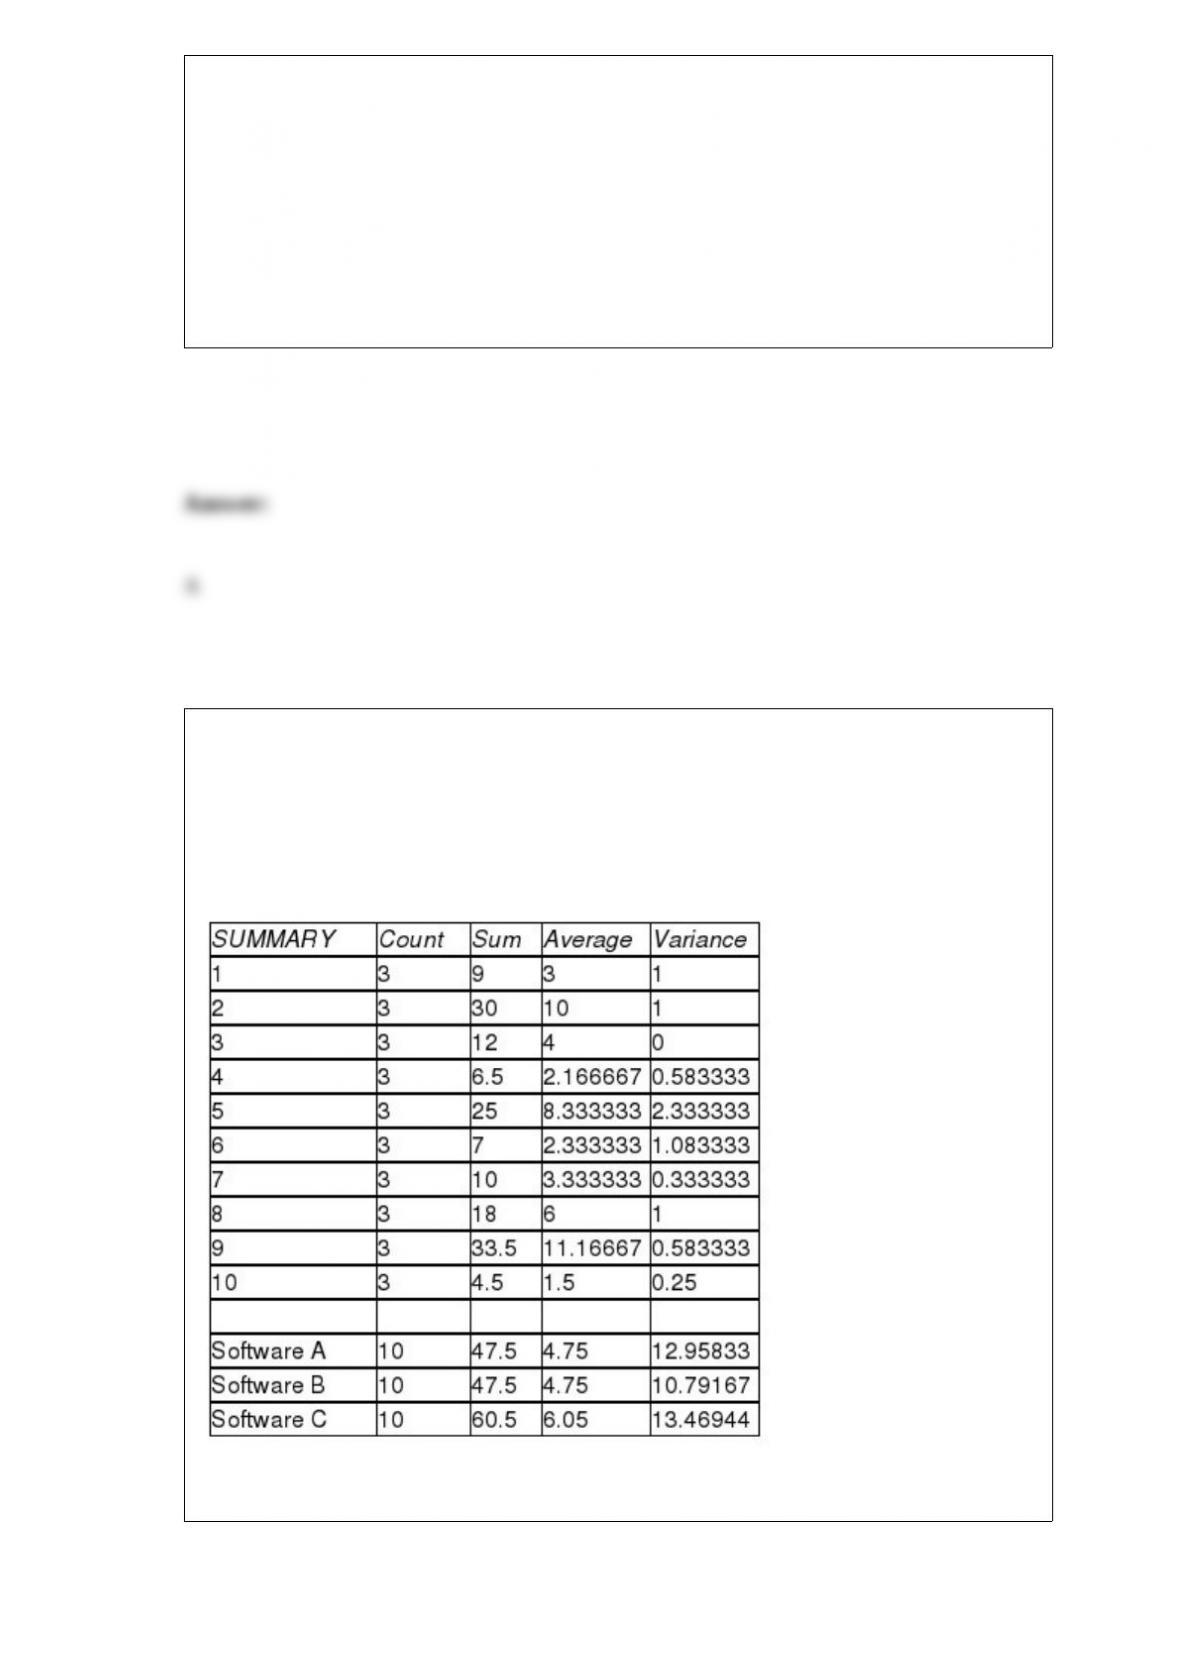
A test is conducted to compare three different income tax software packages to
determine whether there is any difference in the average time it takes to prepare income
tax returns using the three different software packages. Ten different persons’ income
tax returns are done by each of the three software packages and the time is recorded for
each. The computer results are shown below.
ANOVA
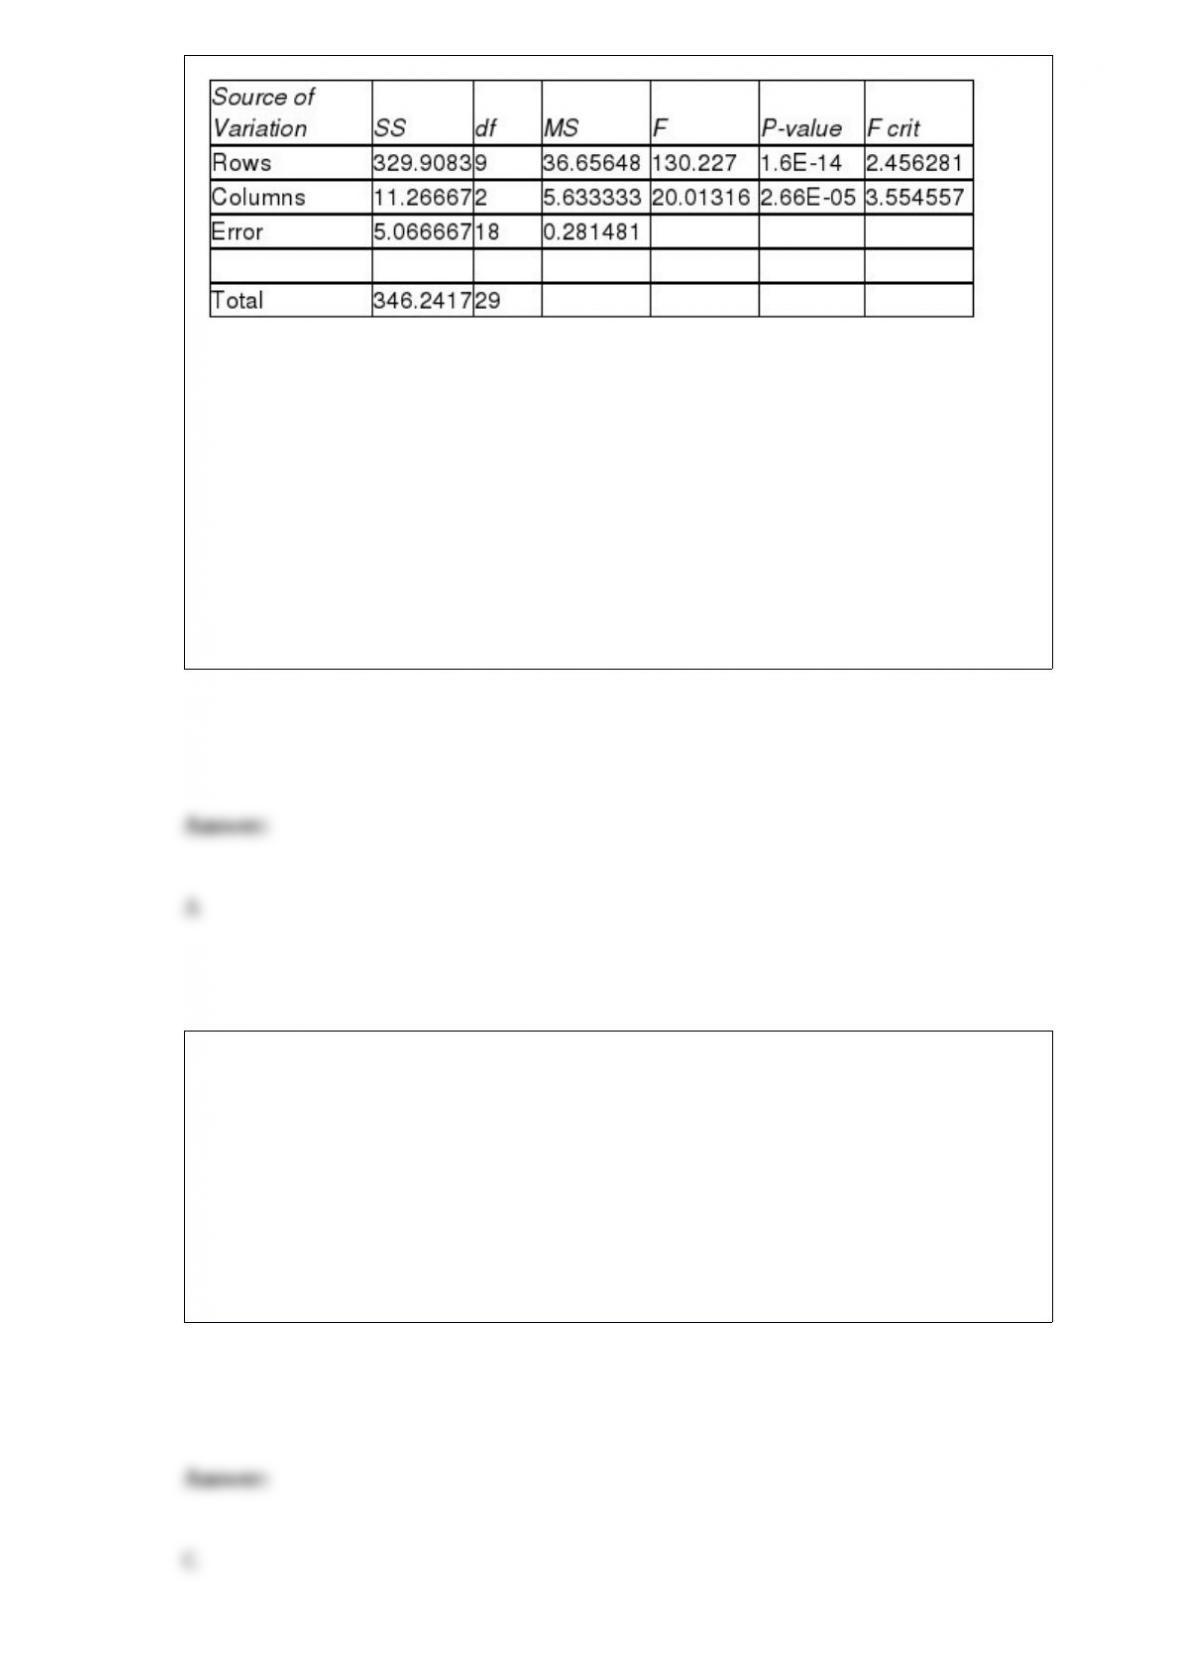
Assuming that the hypothesis tests are conducted using a significance level equal to
0.05, the Fisher’s LSD value for multiple comparisons is:
A) approximately 0.4985.
B) about 0.91.
C) approximately 1.91.
D) about 0.5387.
The high temperature is recorded each day for a period of 1 year. This is an example of:
A) nominal data.
B) ordinal data.
C) time-series data.
D) cross-sectional data.
In testing for differences between the means of two paired populations, an appropriate
null hypothesis would be:
A) H0 : μD = 2
B) H0 : μD = 0
C) H0 : μD < 0
D) H0 : μD > 0
A population has a proportion equal to 0.30. Calculate the following probabilities with
n = 100. Find P( ≥ 0.27).
A) 0.7422
B) 0.8141
C) 0.6125
D) 0.6841
There have been complaints recently from homeowners in the north end claiming that
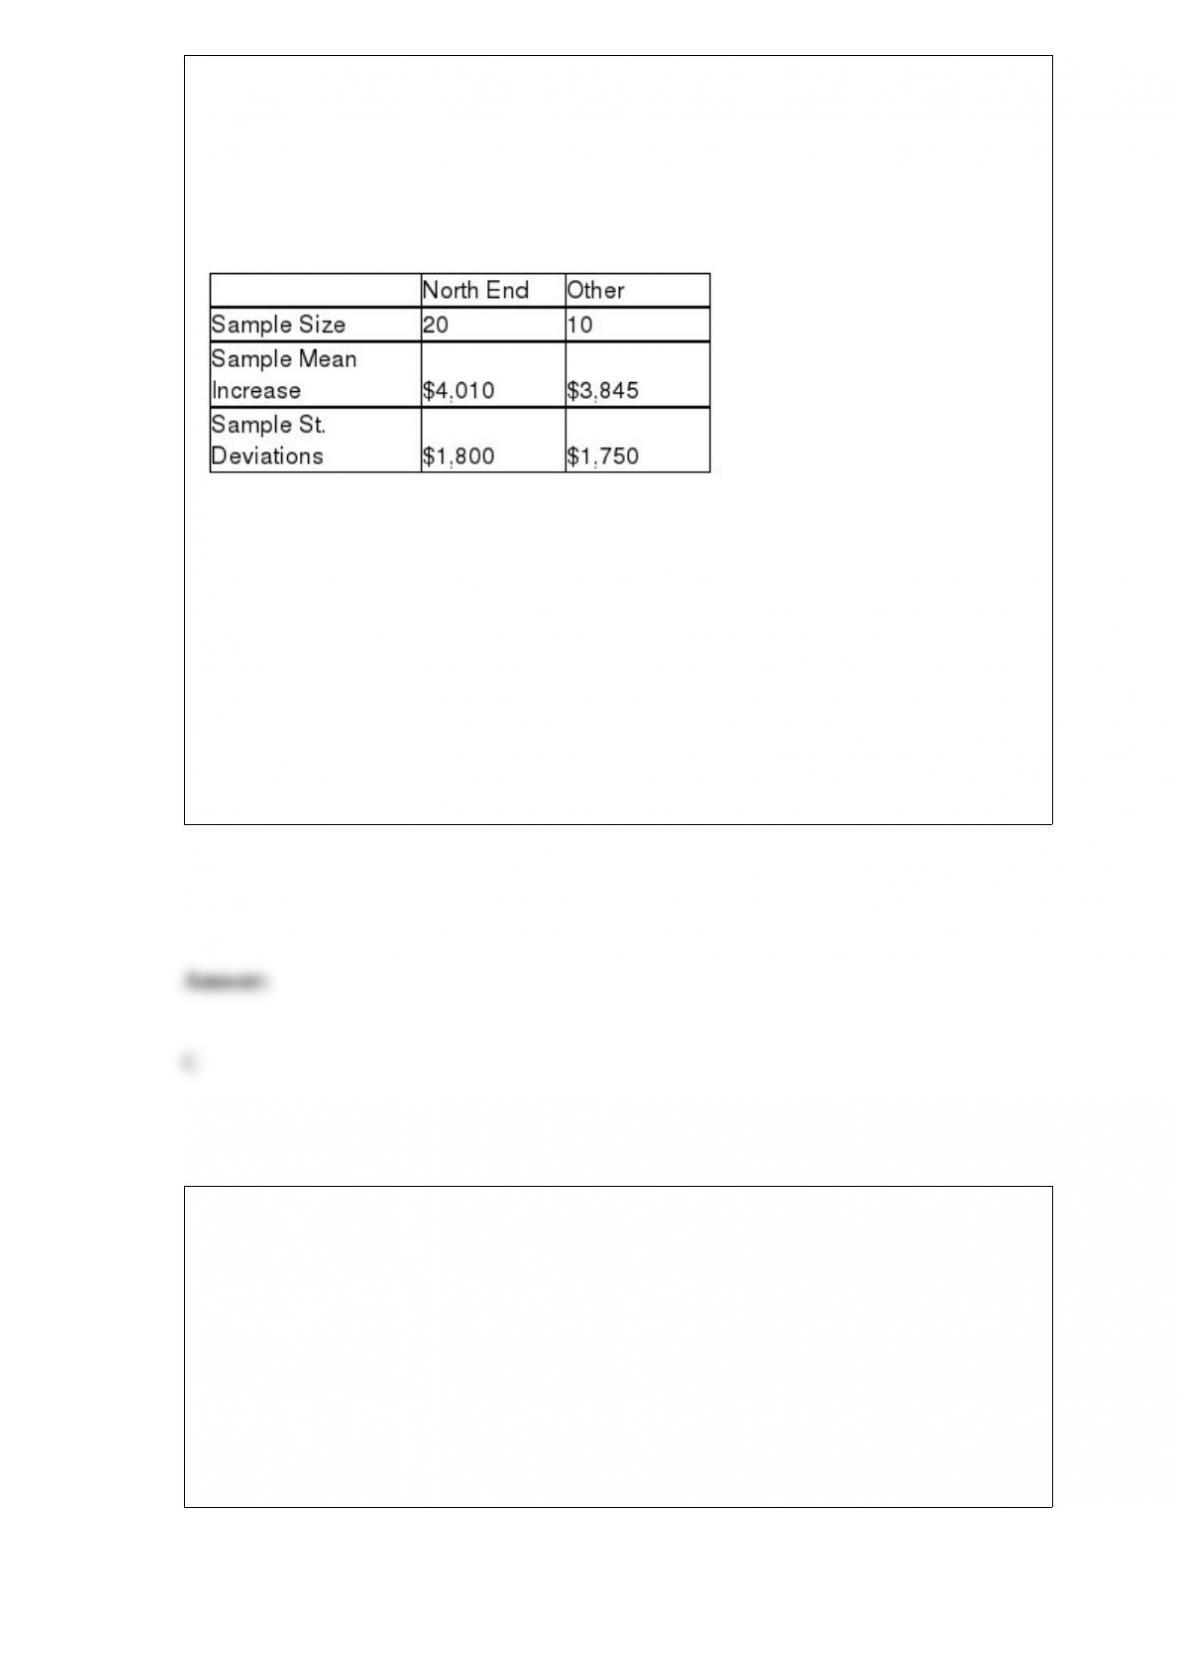
their homes have been assessed at values that are too high compare with other parts of
town. They say that the mean increase from last year to this year has been higher in
their part of town than elsewhere. To test this, the assessor’s office staff plans to select a
random sample of north end properties (group 1) and a random sample of properties
from other areas within the city (group 2) and perform a hypothesis test. The following
sample information is available:
Assuming that the null hypothesis will be tested using an alpha level equal to 0.05, what
is the value of the test statistic?
A) z = 1.578
B) t = 1.7011
C) t = 0.2388
D) t = 0.3944
In a randomized complete block design analysis of variance, how many factors are
there to be analyzed?
A) Depends on the sample size in each treatment
B) One factor, but multiple levels
C) Two factors
D) Can’t be determined without additional information
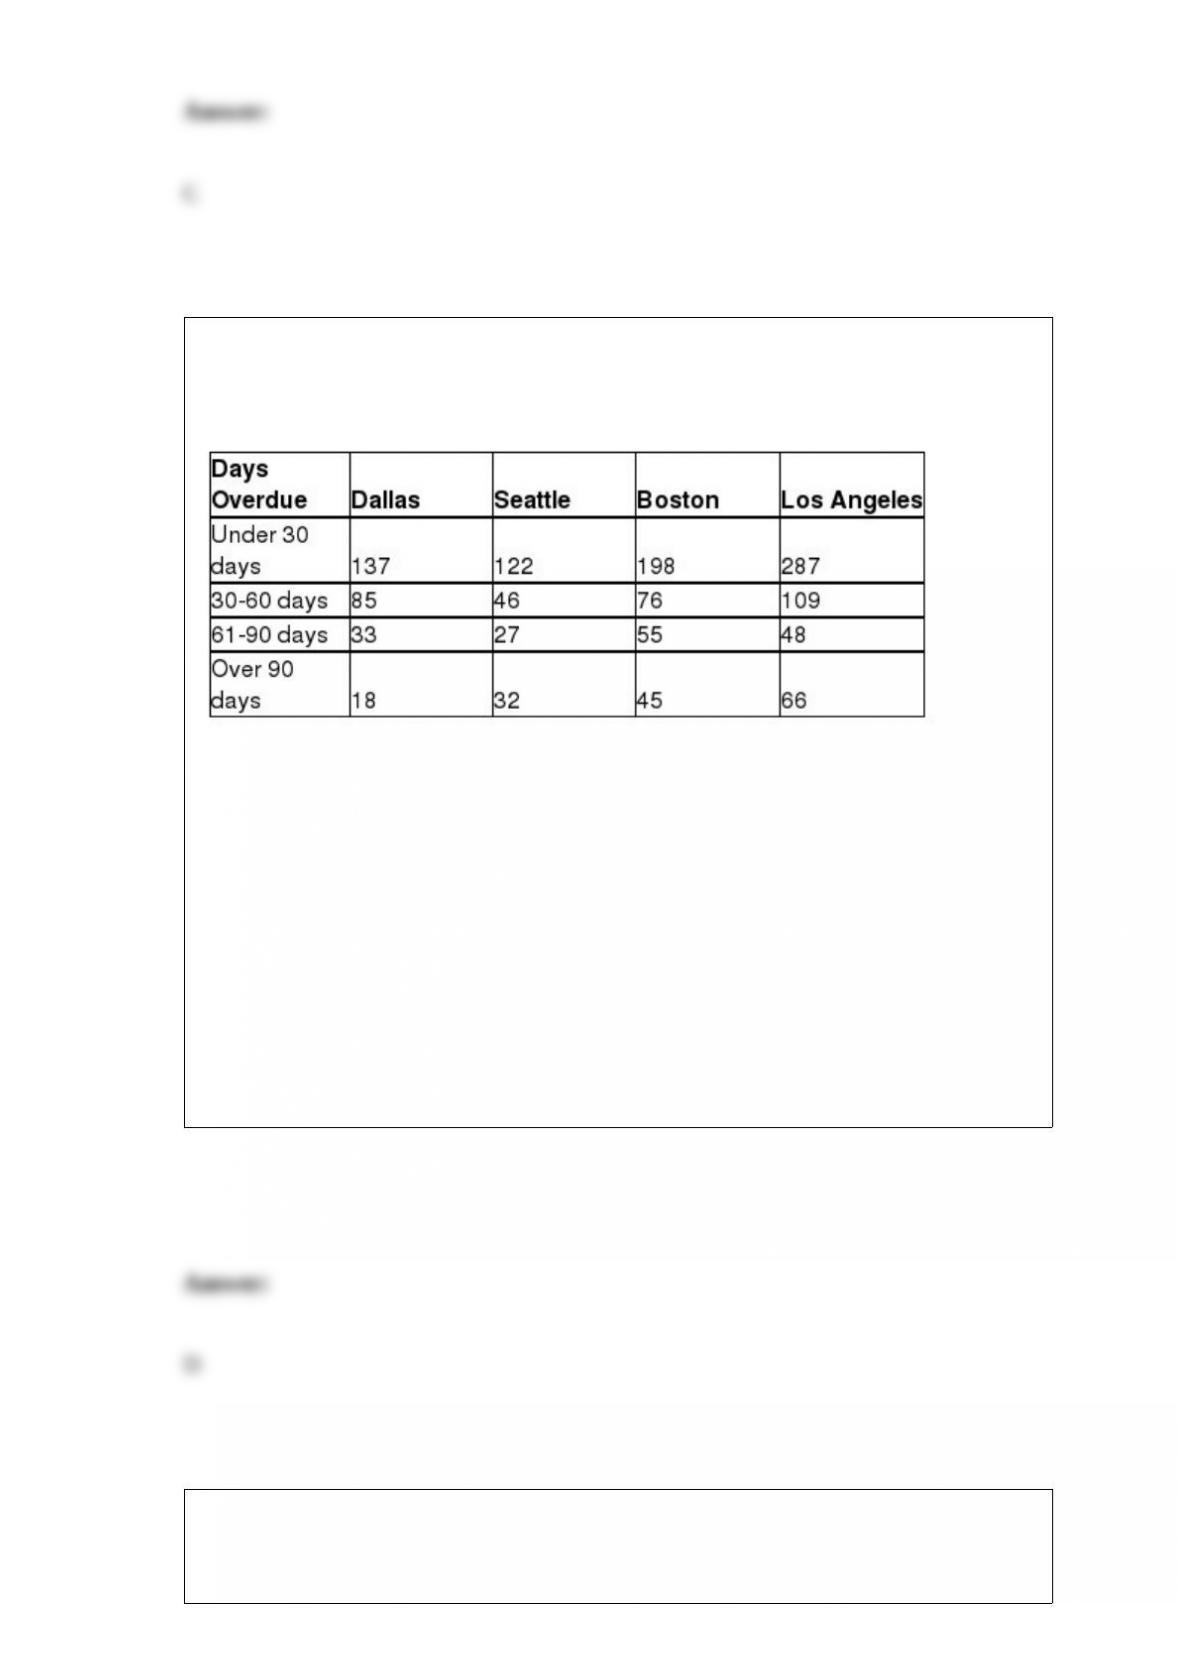
Micron Technology has sales offices located in four cities: Dallas, Seattle, Boston, and
Los Angeles. An analysis of the company’s accounts receivables reveals the number of
overdue invoices by days, as shown here.
Assume the invoices are stored and managed from a central database.
If a randomly selected invoice is from the Los Angeles office, what is the probability
that it is 60 or fewer days overdue?
A) 0.2702
B) 0.0231
C) 0.3461
D) 0.7765
A food warehouse manager plans to conduct a check on damaged packages. The
warehouse covers a large area and products are spread out over the entire building.
Assuming that no products are more likely to have damaged packages than any other,
what statistical sampling method would be used to reduce the time and effort required
to do the study?
A) Convenience sampling
B) Stratified random sampling
C) Cluster random sampling
D) Systematic random sampling
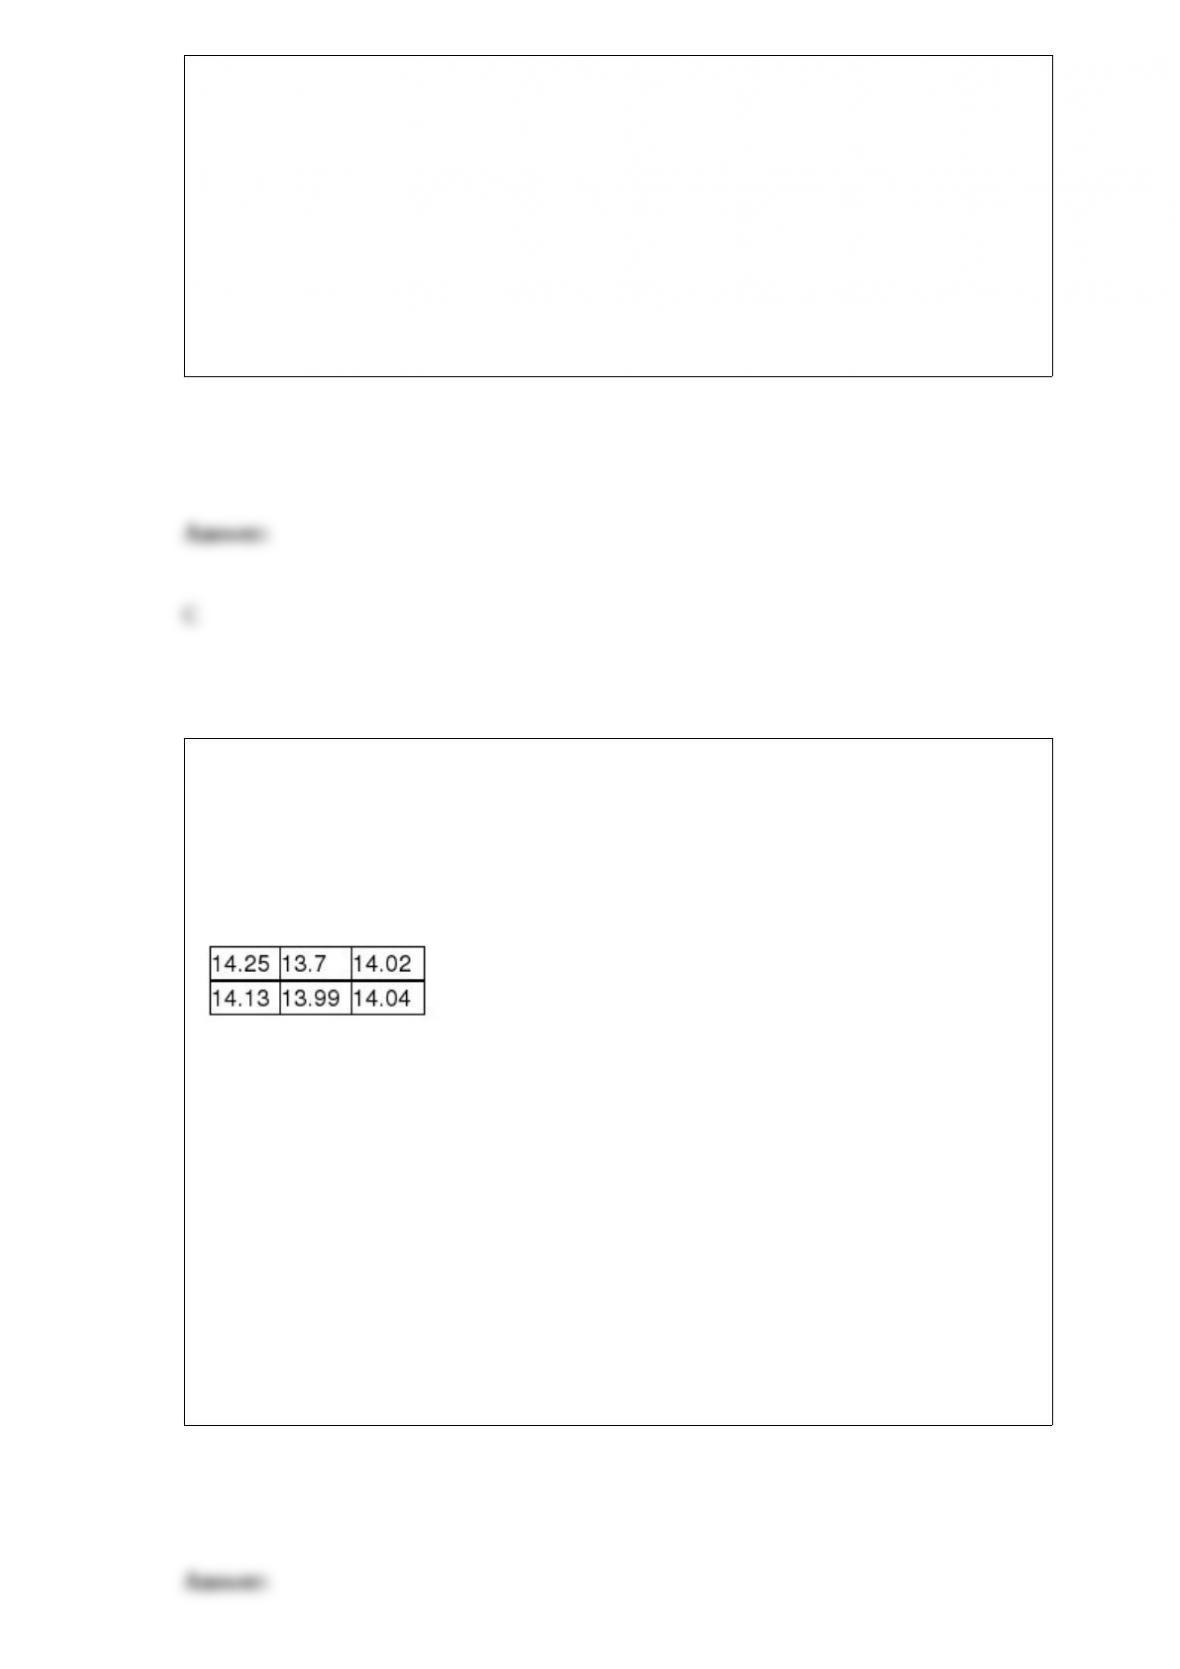
The R.D. Wilson Company makes a soft drink dispensing machine that allows
customers to get soft drinks from the machine in a cup with ice. When the machine is
running properly, the average number of fluid ounces in the cup should be 14.
Periodically the machines need to be tested to make sure that they have not gone out of
adjustment. To do this, six cups are filled by the machine and a technician carefully
measures the volume in each cup. In one such test, the following data were observed:
Based on these sample data, which of the following is true if the significance level is .
05?
A) No conclusion can be reached about the status of the machine based on a sample
size of only six cups.
B) The null hypothesis cannot be rejected since the test statistic is approximately t =
0.20, which is not in the rejection region.
C) The null hypothesis can be rejected since the sample mean is greater than 14.
D) The null can be rejected because the majority of the sample values exceed 14.
The time between calls to an emergency 911-call center is exponentially distributed
with a mean time between calls of 645 seconds. Based on this information, what is the
probability that the time between the next two calls is between 200 and 400 seconds?
A) Approximately 0.47
B) About 0.199
C) About 0.747
D) About 0.801
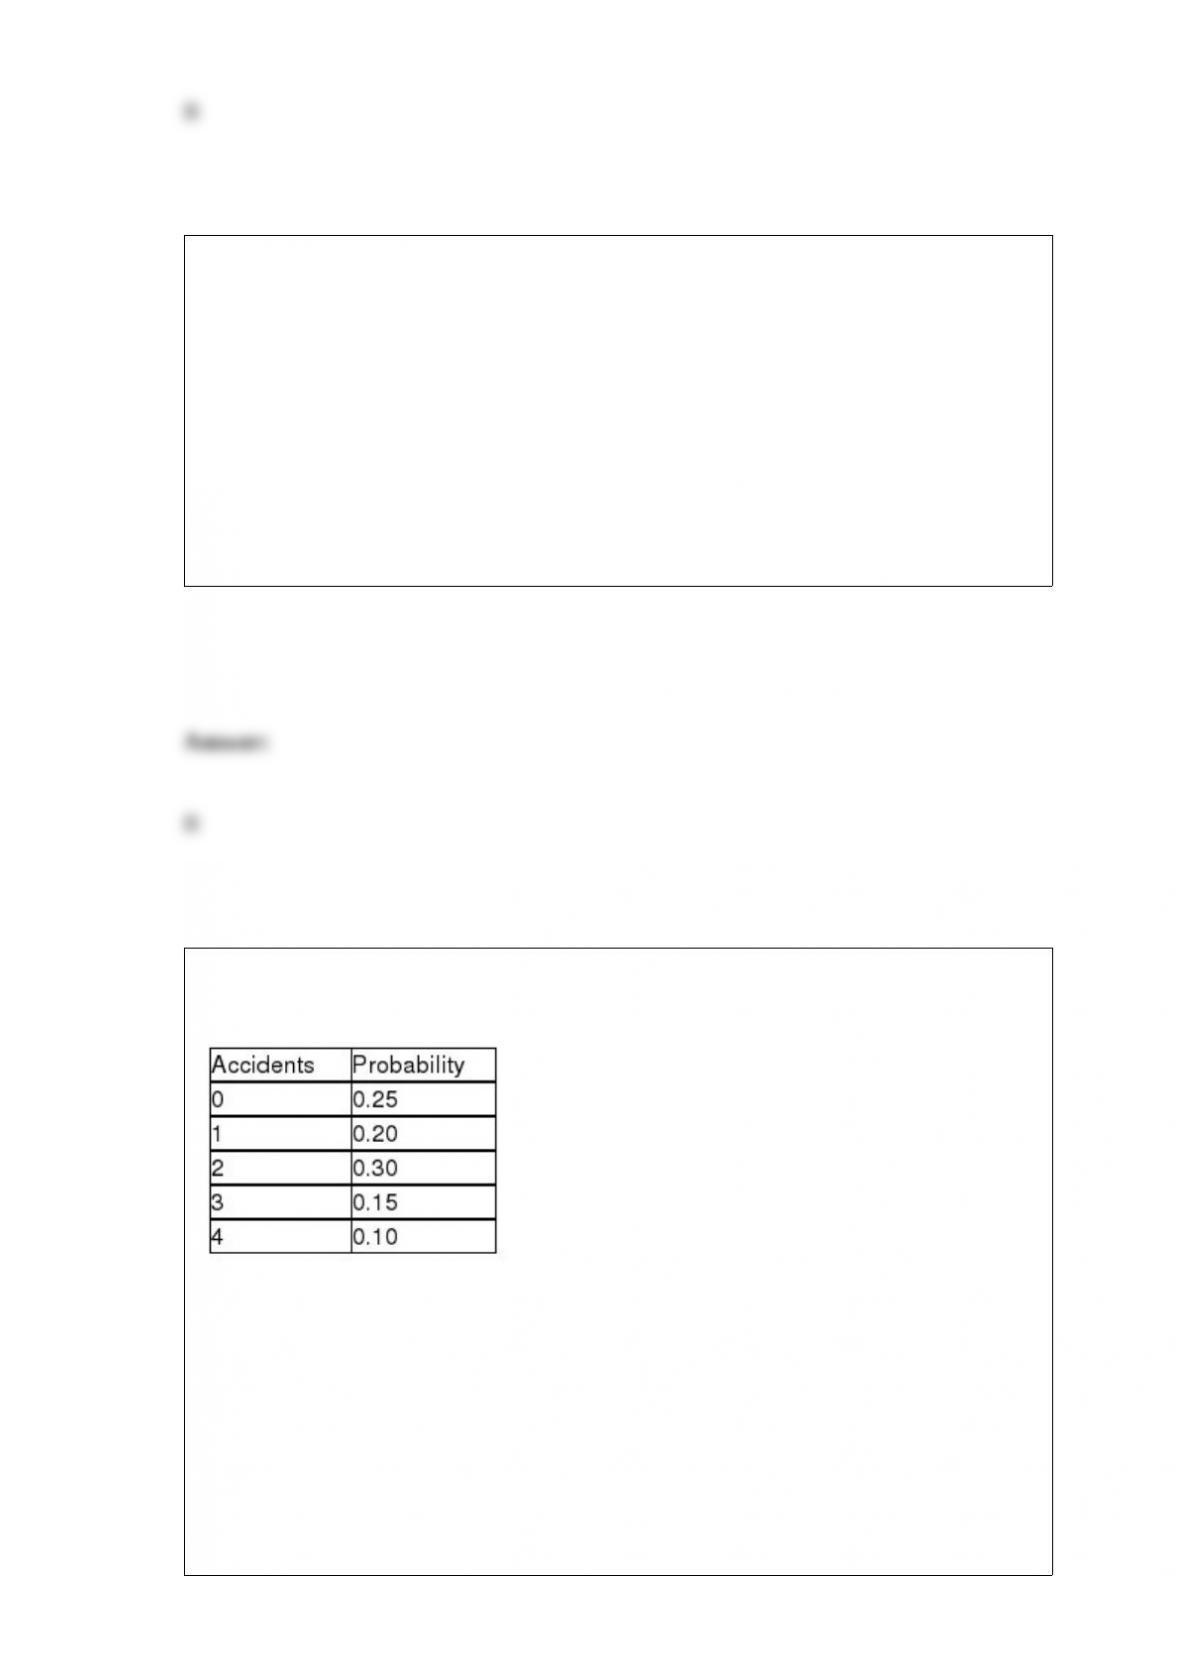
The following probability distribution has been assessed for the number of accidents
that occur in a Midwestern city each day:
Based on this distribution, the expected number of accidents in a given day is:
A) 0.30
B) 1.65
C) 2.00
D) 2.50
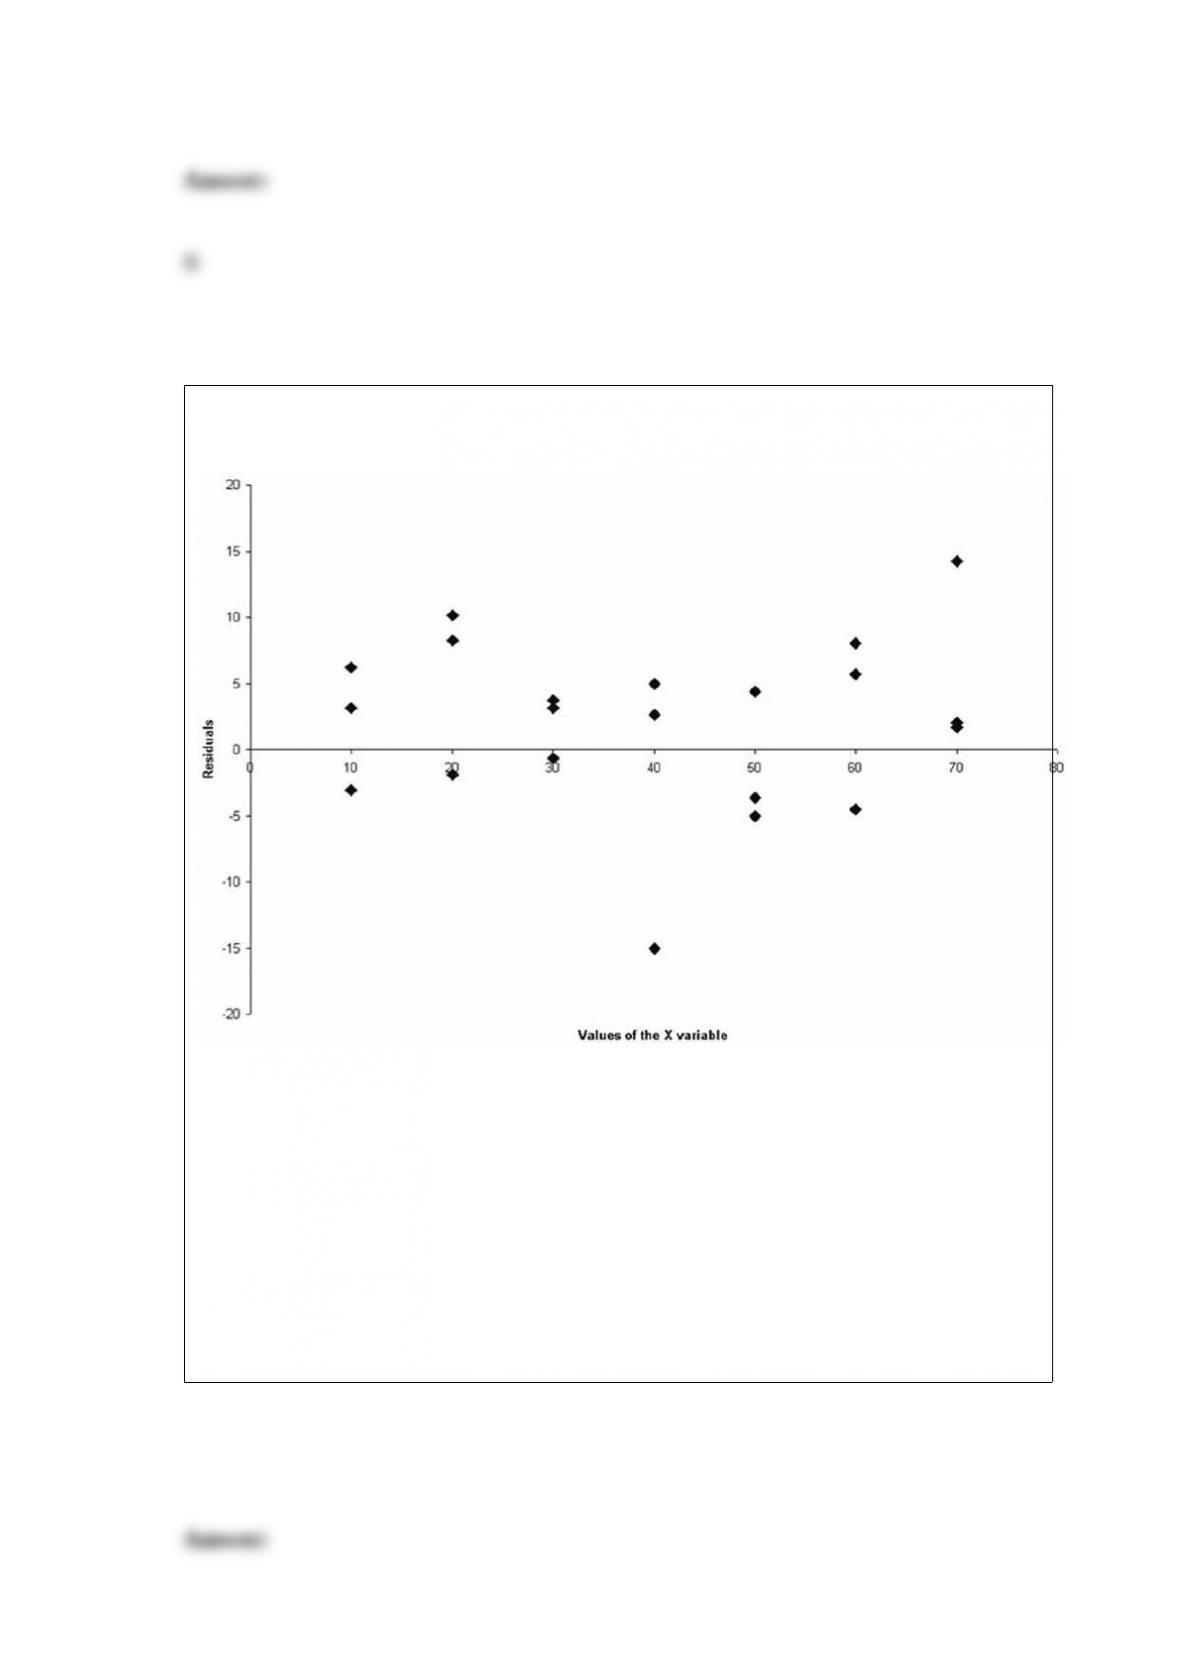
Consider the following residual plot.
Given this plot, what conclusion should be reached?
A) There appears to be no basis for concluding that the relationship between the x and y
variable is not linear.
B) The assumption of constant variance seems to be supported by this plot.
C) Both A and B are true.
D) Neither A nor B are true.
If cars arrive to a service center randomly and independently at a rate of 5 per hour on
average, what is the probability of 0 cars arriving in a given hour?
A) 0.1755
B) 0.0067
C) 0.0000
D) 0.0500
A lube and oil change business believes that the number of cars that arrive for service is
the same each day of the week. If the business is open six days a week (Monday –
Saturday) and a random sample of n = 200 customers is selected, the sum of the
expected frequencies over the six days cannot be determined without seeing the actual
sample data.
In developing and conducting a survey, what is the purpose of the pre-test phase?
A) To make sure that the cost of developing the survey instrument is not too great
B) To generate initial data for analysis

C) To catch any problems with the questionnaire before it is fully administered
D) To make sure that the respondents like the issues being addressed by the survey
Madam Helga claims to be psychic. A national TV talk personality plans to test her in a
live TV broadcast. The process will entail asking Madam Helga a series of 20
independent questions with yes/no answers. The questions would be of the nature that
she could not have any way of knowing the answer from prior knowledge. She will be
considered psychic if she correctly answers more than a specified number (called the
cut-off) of the questions. The cut-off must be set so that the chance of guessing that
number or more is no greater than 5 percent. The cut-off value should be:
A) 12
B) 14
C) 10
D) Can’t be determined without more information.
A walk-in medical clinic believes that arrivals are uniformly distributed over weekdays
(Monday through Friday). It has collected the following data based on a random sample
of 100 days.
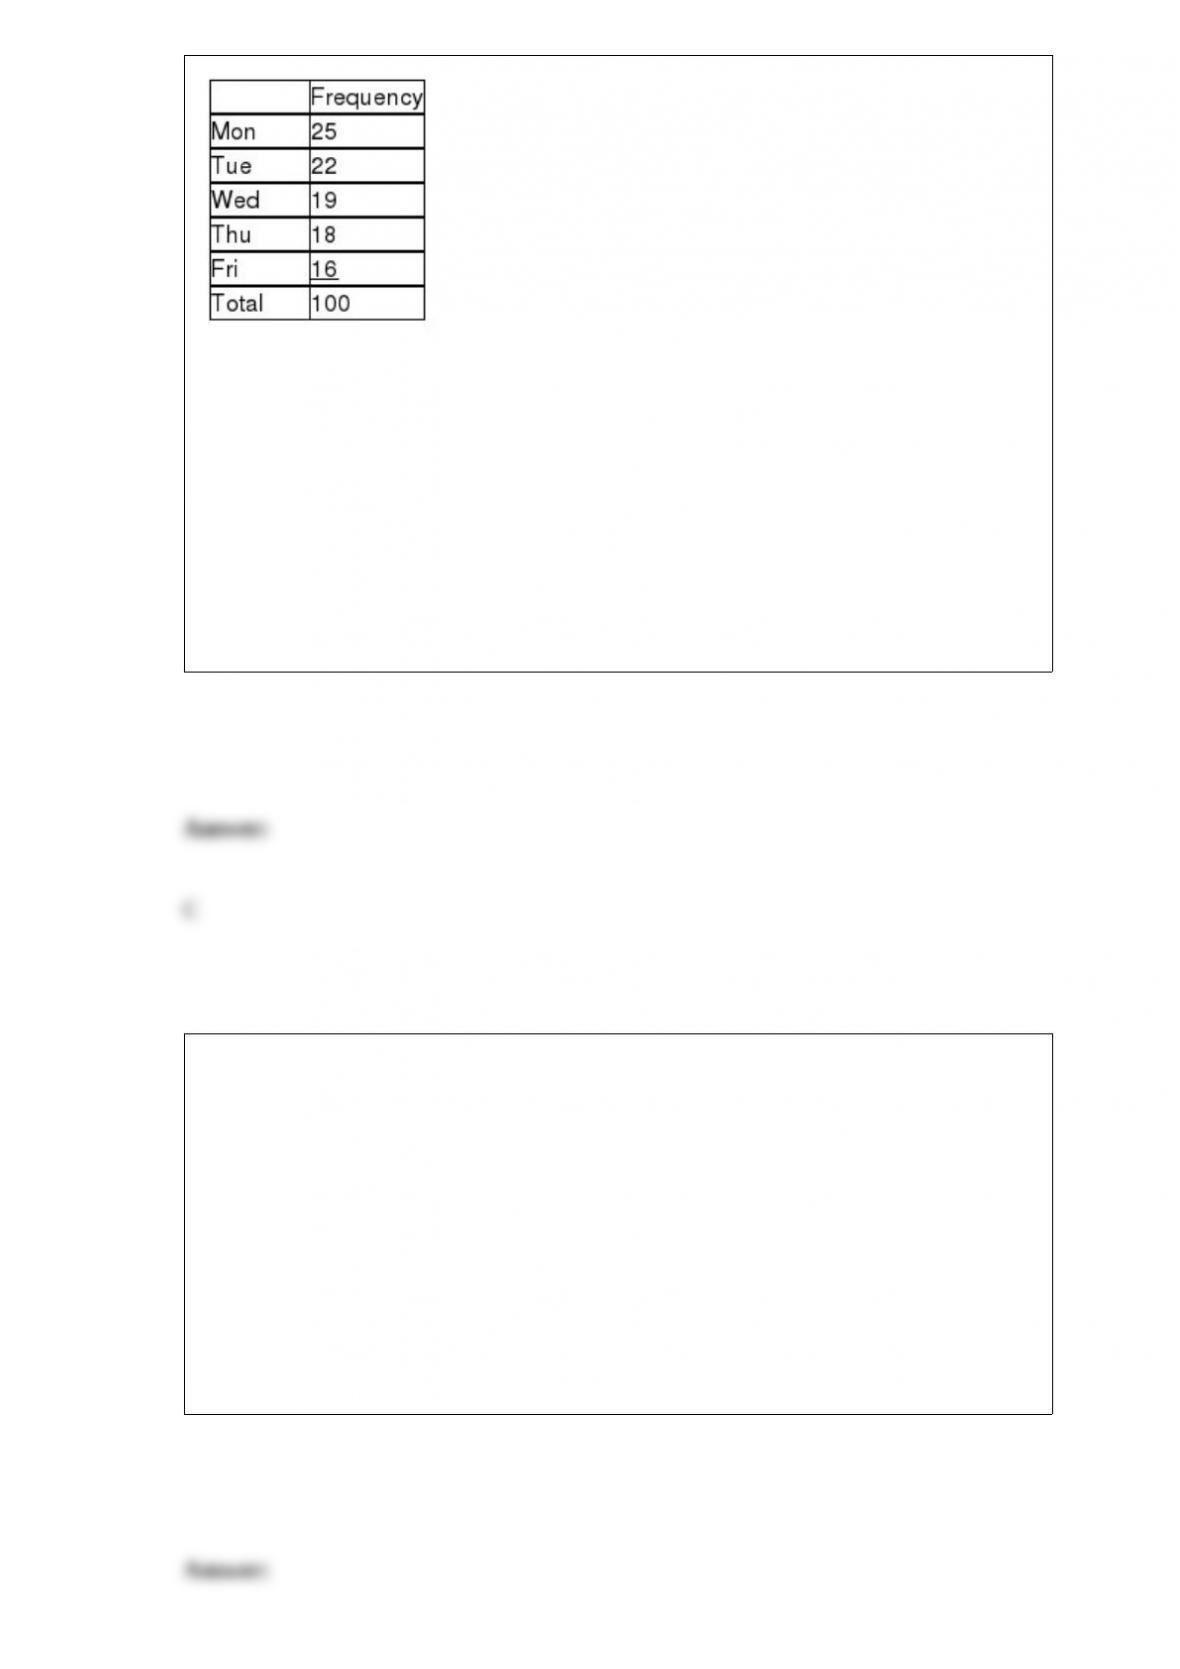
Assuming that a goodness-of-fit test is to be conducted using a 0.10 level of
significance, the critical value is:
A) 9.4877
B) 11.0705
C) 7.7794
D) 9.2363
The college basketball team at West Texas State University has 10 players; 5 are
seniors, 2 are juniors, and 3 are sophomores. Two players are randomly selected to
serve as captains for the next game. What is the probability that both players selected
are seniors?
A) 0.22
B) 0.33
C) 0.50
D) 0.66
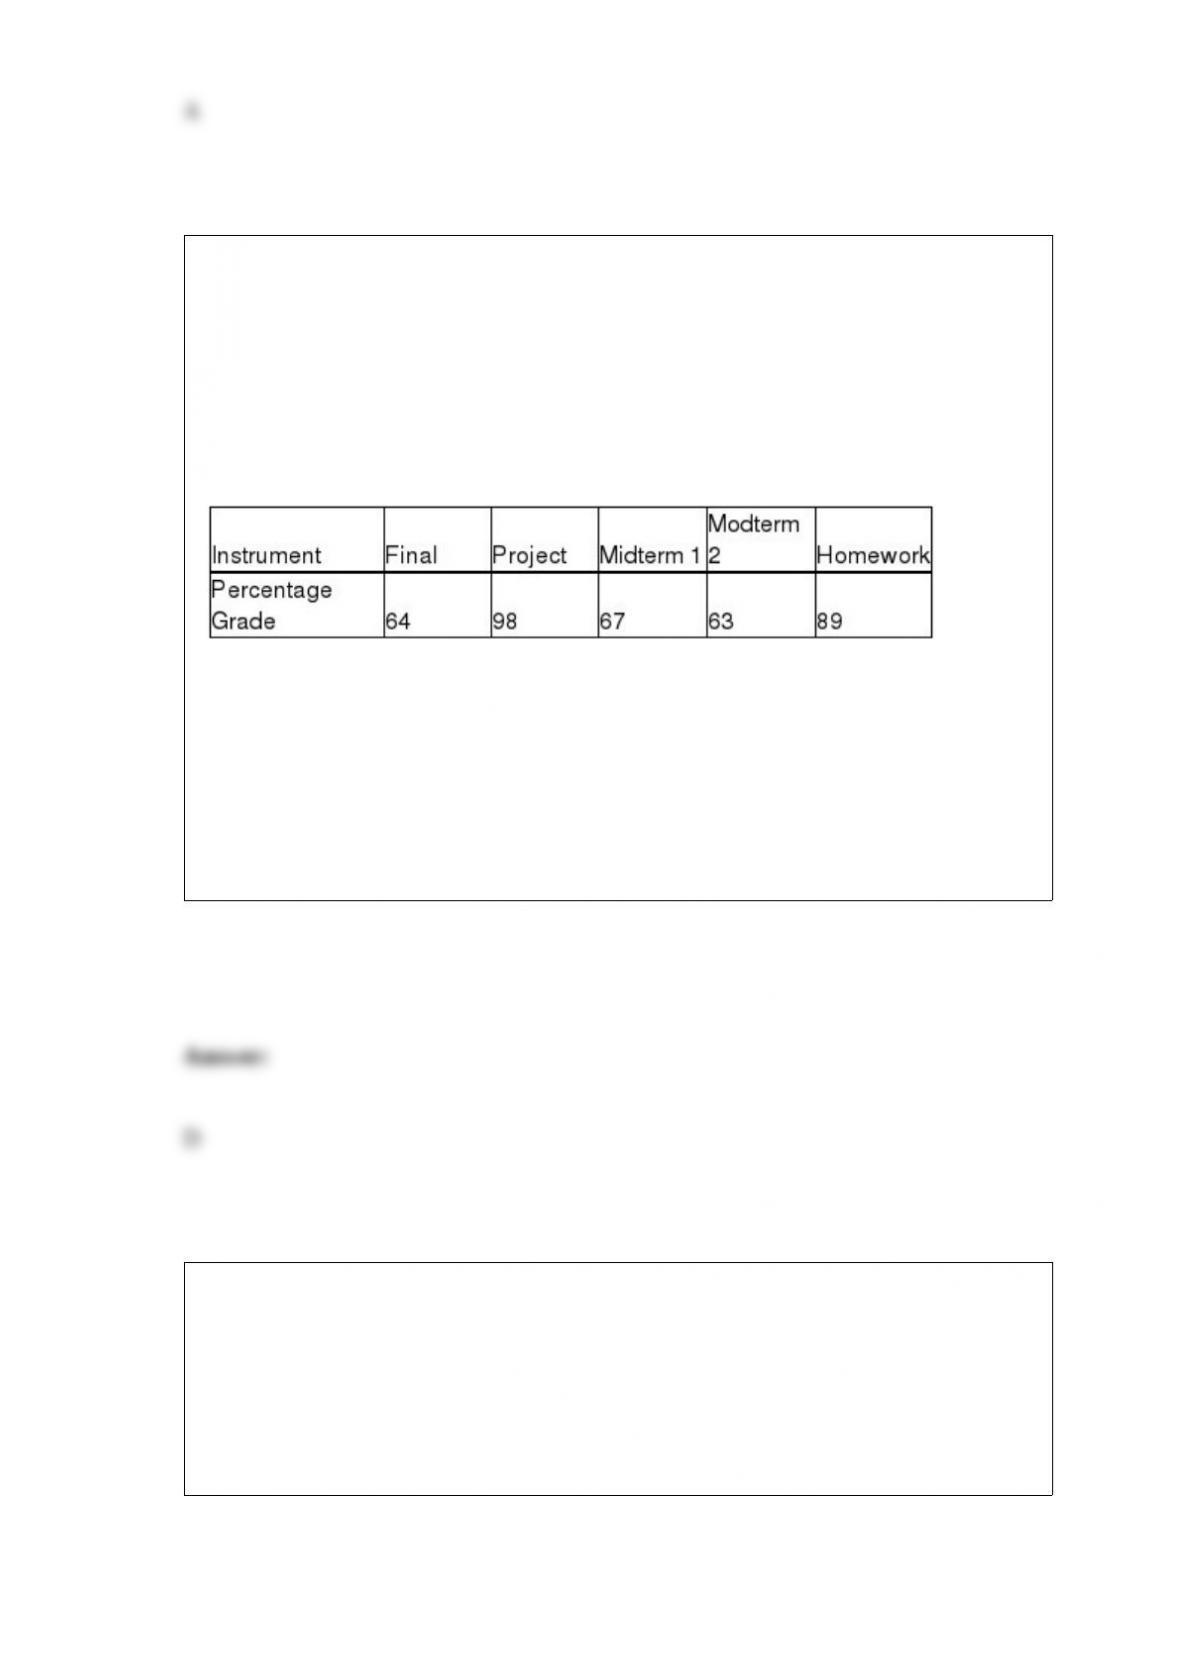
A professor wishes to develop a numerical method for giving grades. He intends to base
the grade on homework, two midterms, a project, and a final examination. He wishes
the final exam to have the largest influence on the grade. He wants the project to have
10%, each midterm to have 20%, and the homework to have 10% of the influence of
the semester grade.
For a student with the following grades during the quarter, calculate a weighted average
for the course:
A) 68.50
B) 73.30
C) 68.30
D) 70.30
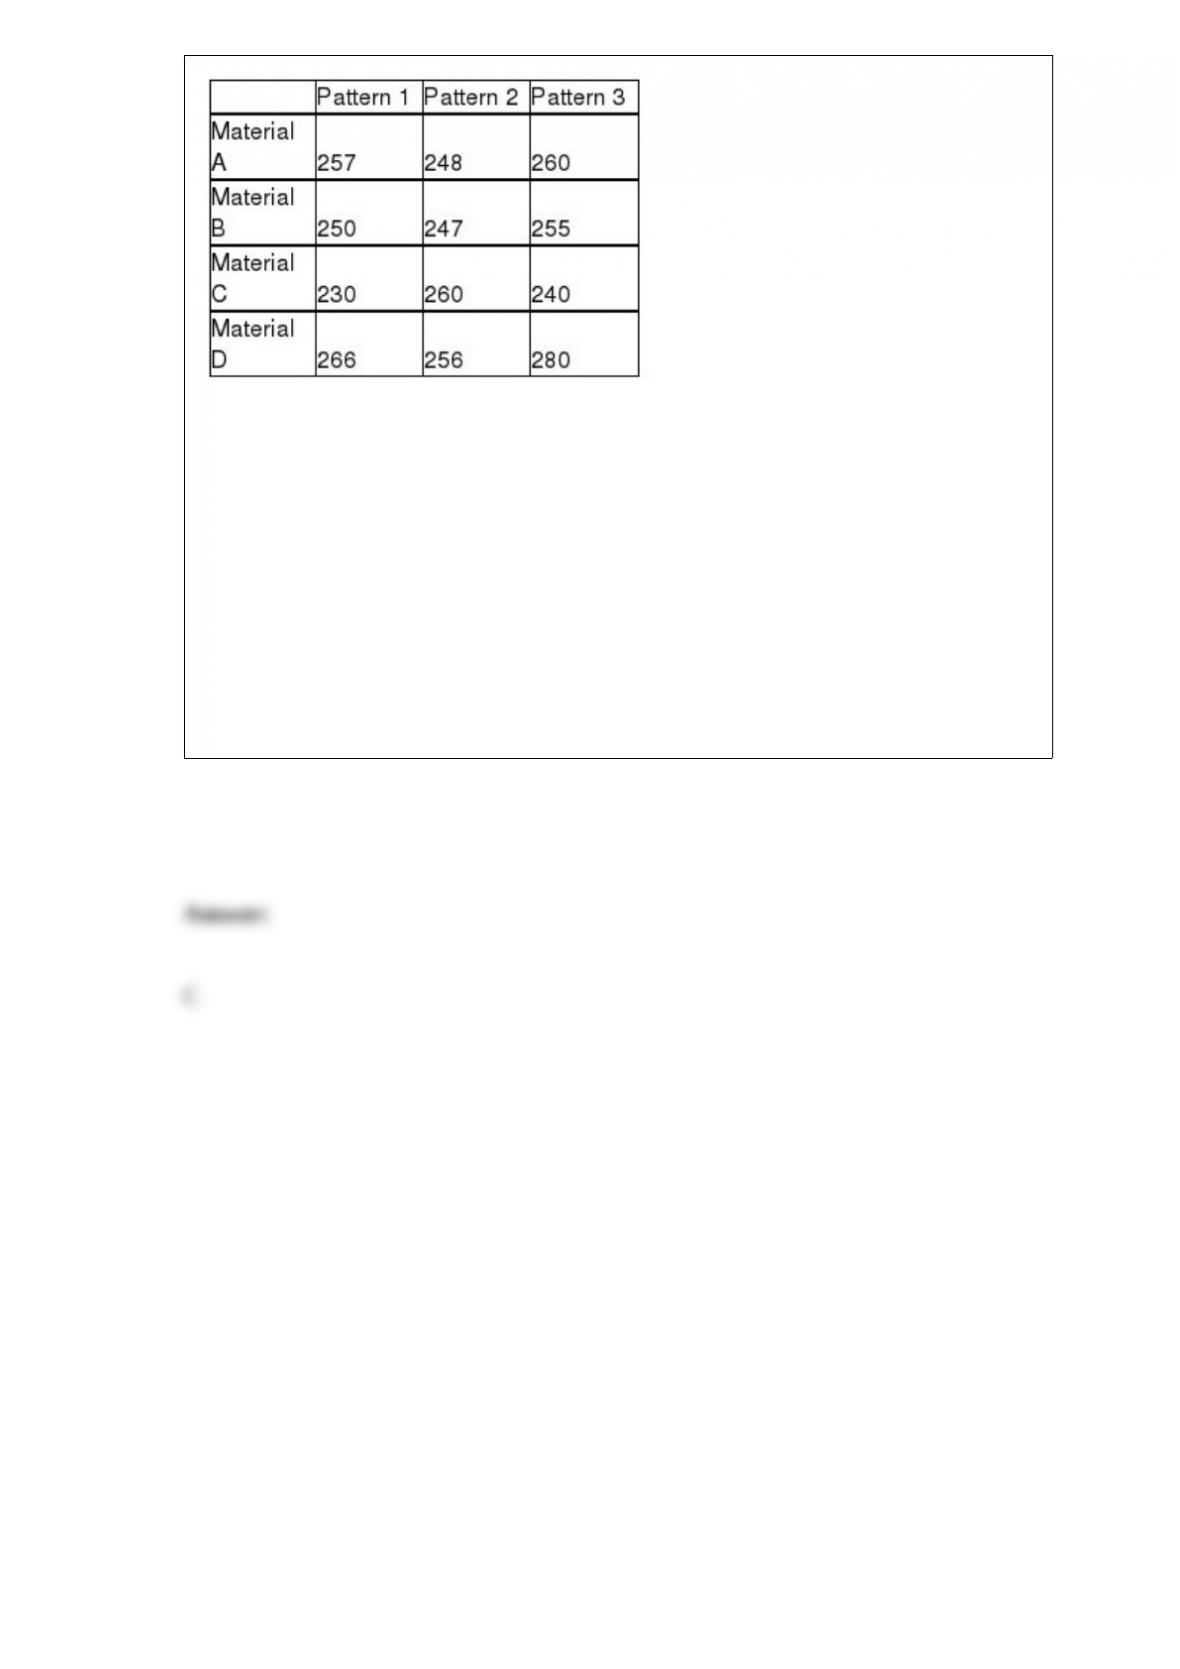
A golf ball manufacturer has three dimple patterns it is interested in analyzing to see
whether one results in longer driving distances. However, it also wishes to control for
the cover material the ball is made from since it believes that the material might affect
driving distance. Four materials can be used. The following data represent the results of
tests in which each combination of dimple pattern and cover material were used and the
length of the ball hit by a robot has been recorded. The test will be conducted using an
alpha = 0.05 level.
Given these data, which of the following statements is true?
A) There is no basis for concluding that mean driving distance is different for the
different dimple patterns.
B) There is no basis for concluding that mean driving distance is different for the
different cover materials.
C) Both A and B are true.
D) Neither A nor B is true.