
Two real estate companies, Century 21 and RE/MAX, compete with one another in a
local market. The manager of the Century 21 office would like to advertise that homes
listed with RE/MAX average more than 10 days on the market when compared to
homes listed with his company. The following data shows the sample size and average
number of days on the market for the two companies along with the population standard
deviations.
If Population 1 is defined as RE/MAX and Population 2 is defined as Century 21, and
using α = 0.10, the critical value for this hypothesis test would be ________.
A) 1.28
B) 1.645
C) 1.96
D) 2.33
The National Basketball Association (NBA) would like to develop a multiple regression
model that would predict the number of wins for a team during the season. The
following independent variables were considered for the model: field goal percentage
(X1), free throw percentage (X2), turnovers per game (X3), rebounds per game (X4),
and steals per game (X5). The following regression model was chosen using a data set
of team statistics:
The first team from the data set had the following values:
Wins = 56
Field goal percentage = 48.6%

Free throw percentage = 77.0%
Turnovers per game = 14.6
Rebounds per game = 38.8
Steals per game = 8.2
The residual for this team is ________.
A) 9.6
B) -5.2
C) 7.0
D) -3.1
Which of the following statements is true regarding the normal probability distribution?
A) The mean and median are roughly equal to one another.
B) The mean is always greater than the median.
C) The mean is always less than the median.
D) The mean is always greater than the mode.
Suppose the nightly rate for a three-star hotel in Paris is thought to be bell-shaped and
symmetrical with a mean of 160 euros and a standard deviation of 8 euros. The
percentage of hotels with rates between 144 and 176 euros is
A) approximately 68.
B) at least 89.
C) approximately 95.
D) at least 75.
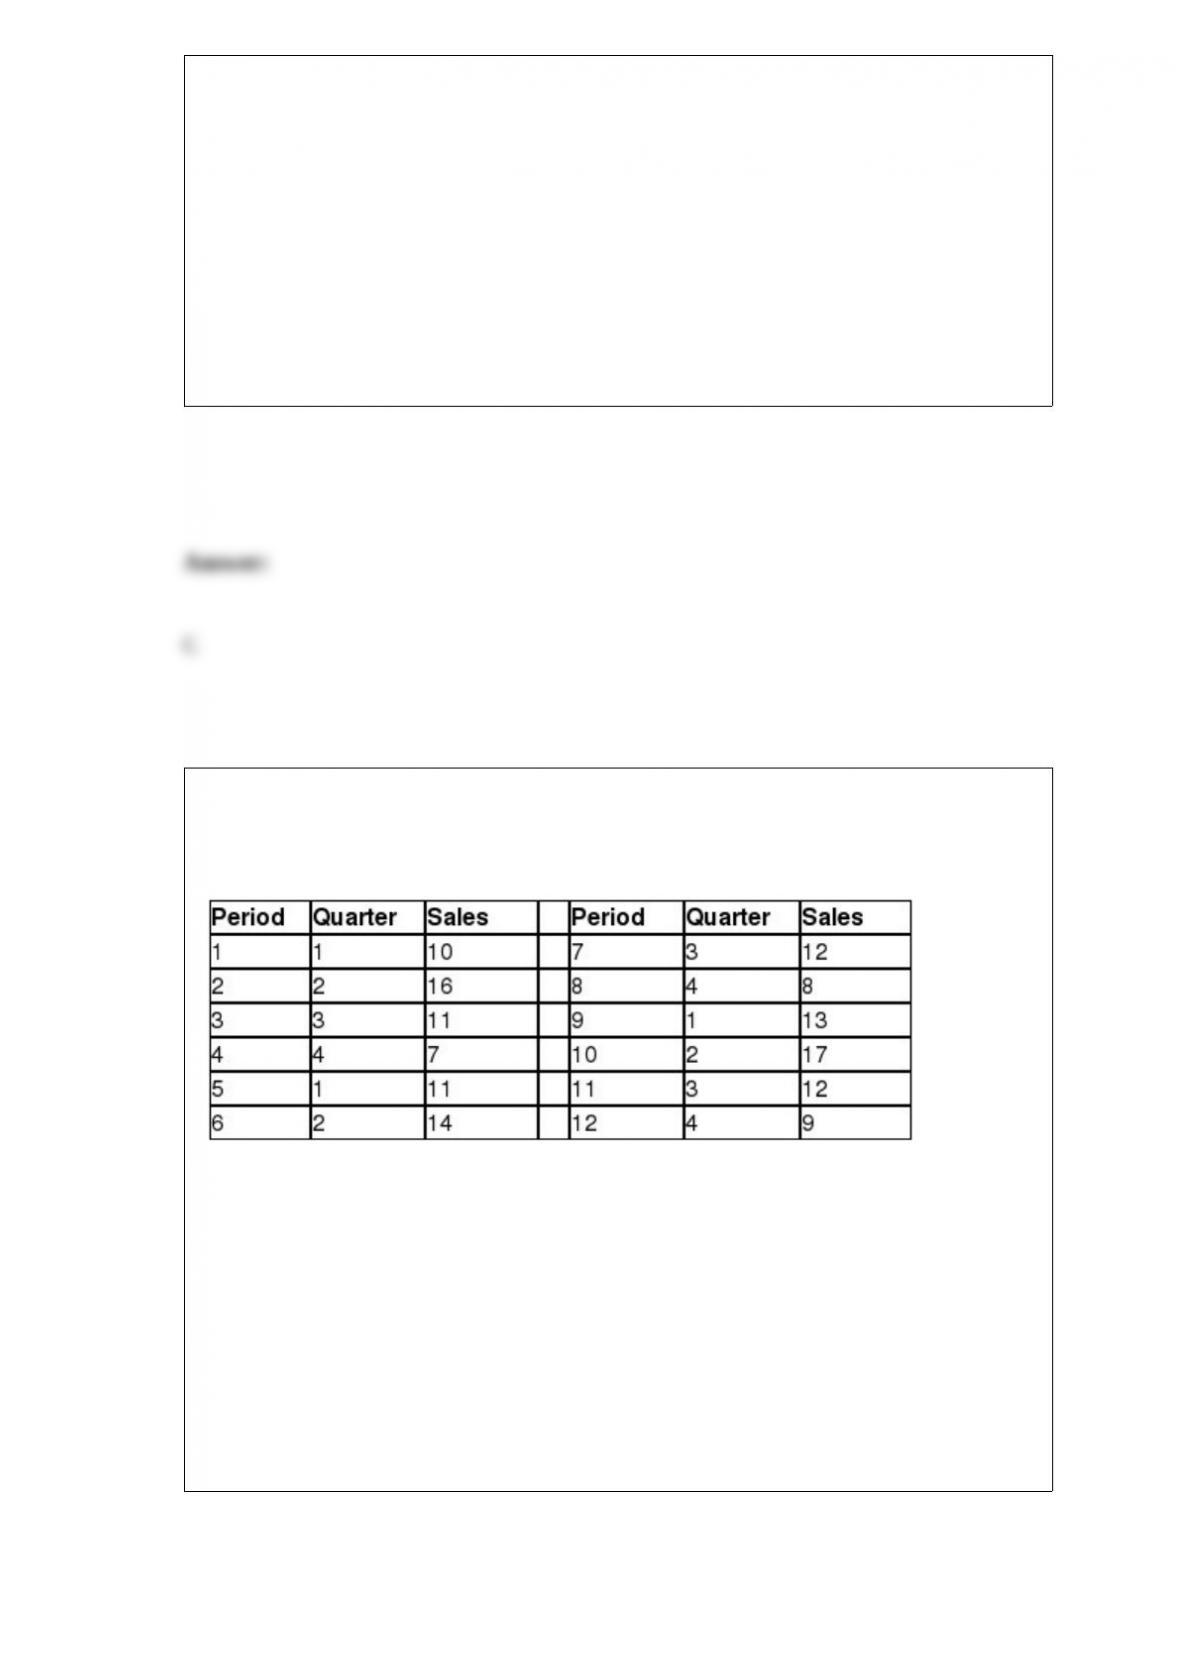
Chris is employed by Silver Lake Resort in Orlando, Florida, and sells timeshares. The
following table shows the number of timeshare sales for Chris for each quarter over the
past three years.
The trend component for the forecast of sales for Period 13 using multiplicative
decomposition is ________.
A) 11.4
B) 11.9
C) 13.3
D) 14.8
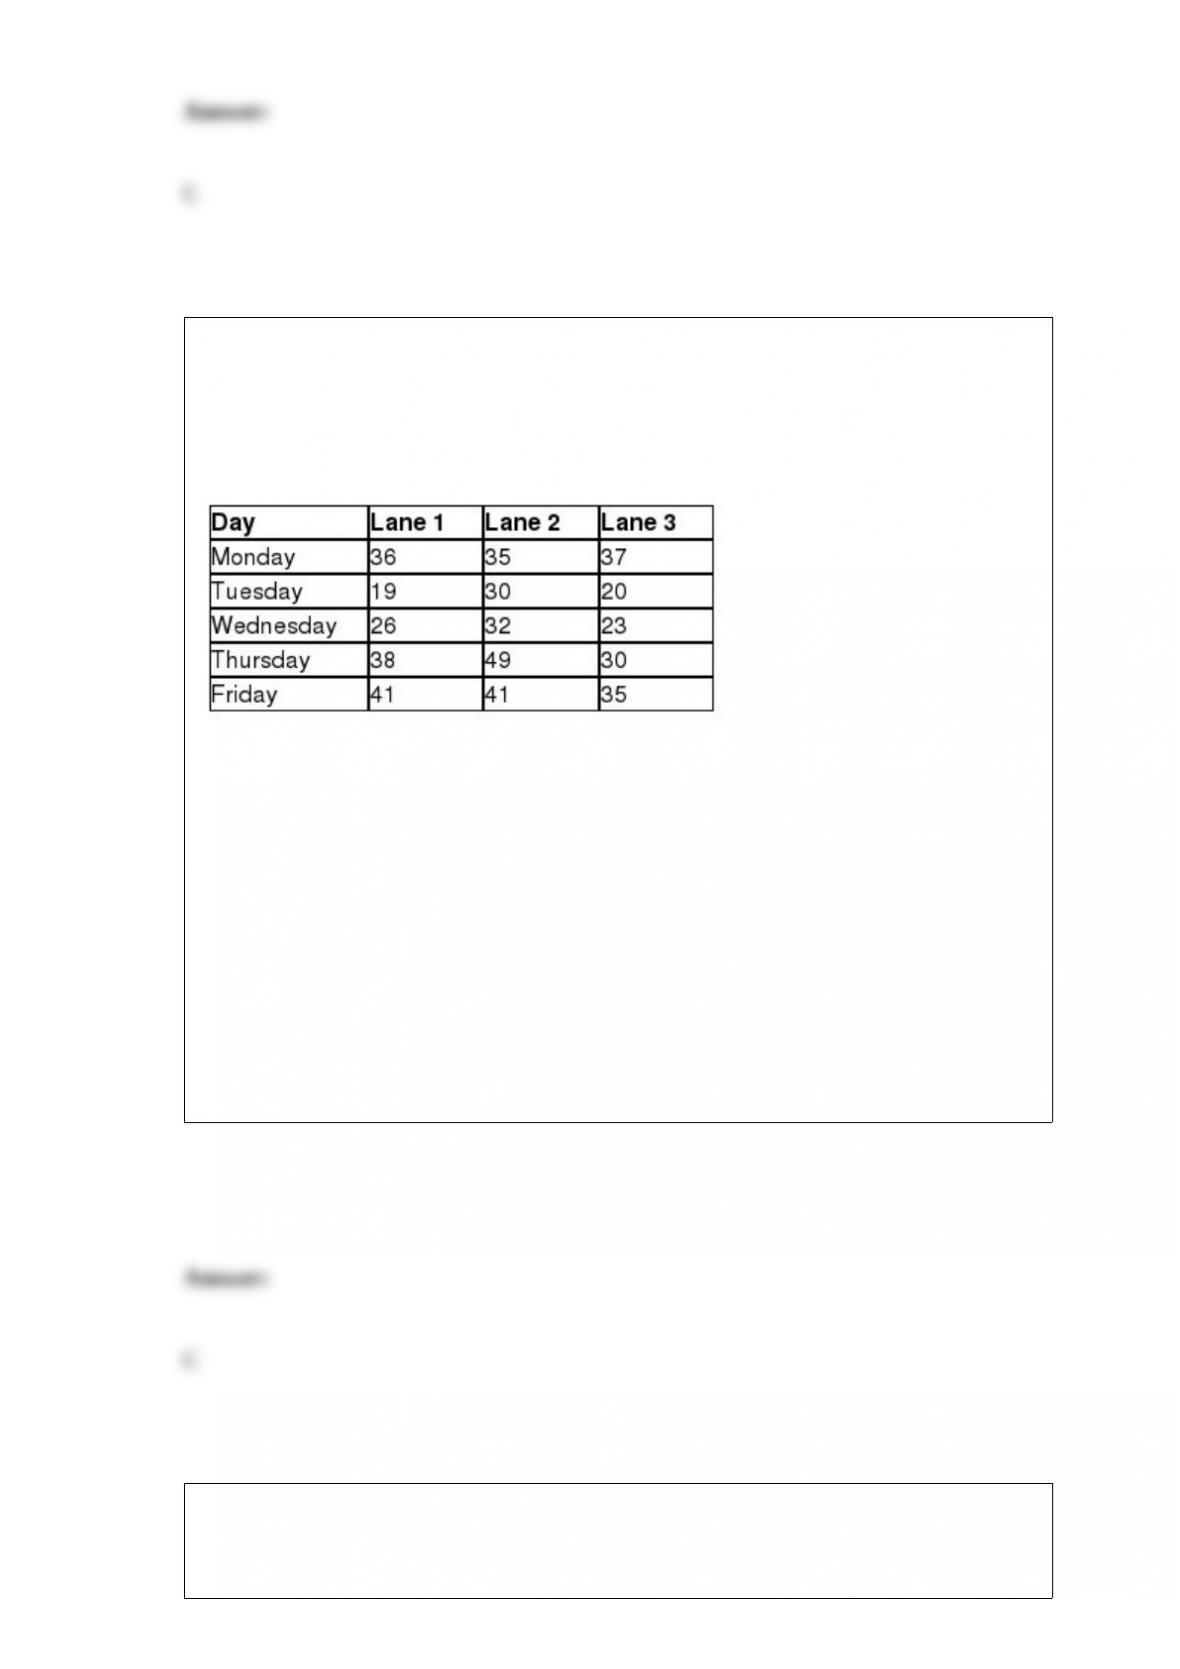
In Delaware, cars are inspected each year using state-operated inspection centers. The
Wilmington center has three drive-through lanes where cars are inspected in a sequence
of steps. The following data show the number of minutes that a random sample of
drivers spent waiting and having their cars inspected in the three lanes each day of the
week.
The state of Delaware would like to perform a randomized block ANOVA to test for a
difference in the average times the drivers spend in the three lanes using the weekday as
a blocking factor with α = 0.05. The blocking factor critical value for this hypothesis
test would be ________.
A) 2.887
B) 3.015
C) 3.838
D) 4.459
The National Center for Education would like to estimate the average student debt for
the state of Ohio with a 90% confidence interval and a margin of error within plus or
minus $1,800. Assuming the standard deviation for student debt in this state is $7,500,

the required sample size is ________.
A) 36
B) 47
C) 65
D) 80
Use the following information to answer the question(s) below.
Ford would like to develop a regression model that would predict the number of cars
sold per month by a dealership employee based on the employee’s number of years of
sales experience (Exp), the employee’s weekly base salary before commissions (Salary),
and the education level of the employee. There are three levels of education in the sales
forcehigh school degree, associate’s degree, and bachelor’s degree. The following
dummy variables have been defined.
The following Excel output shows the partially completed regression output from a
random sample of employees from the previous month.
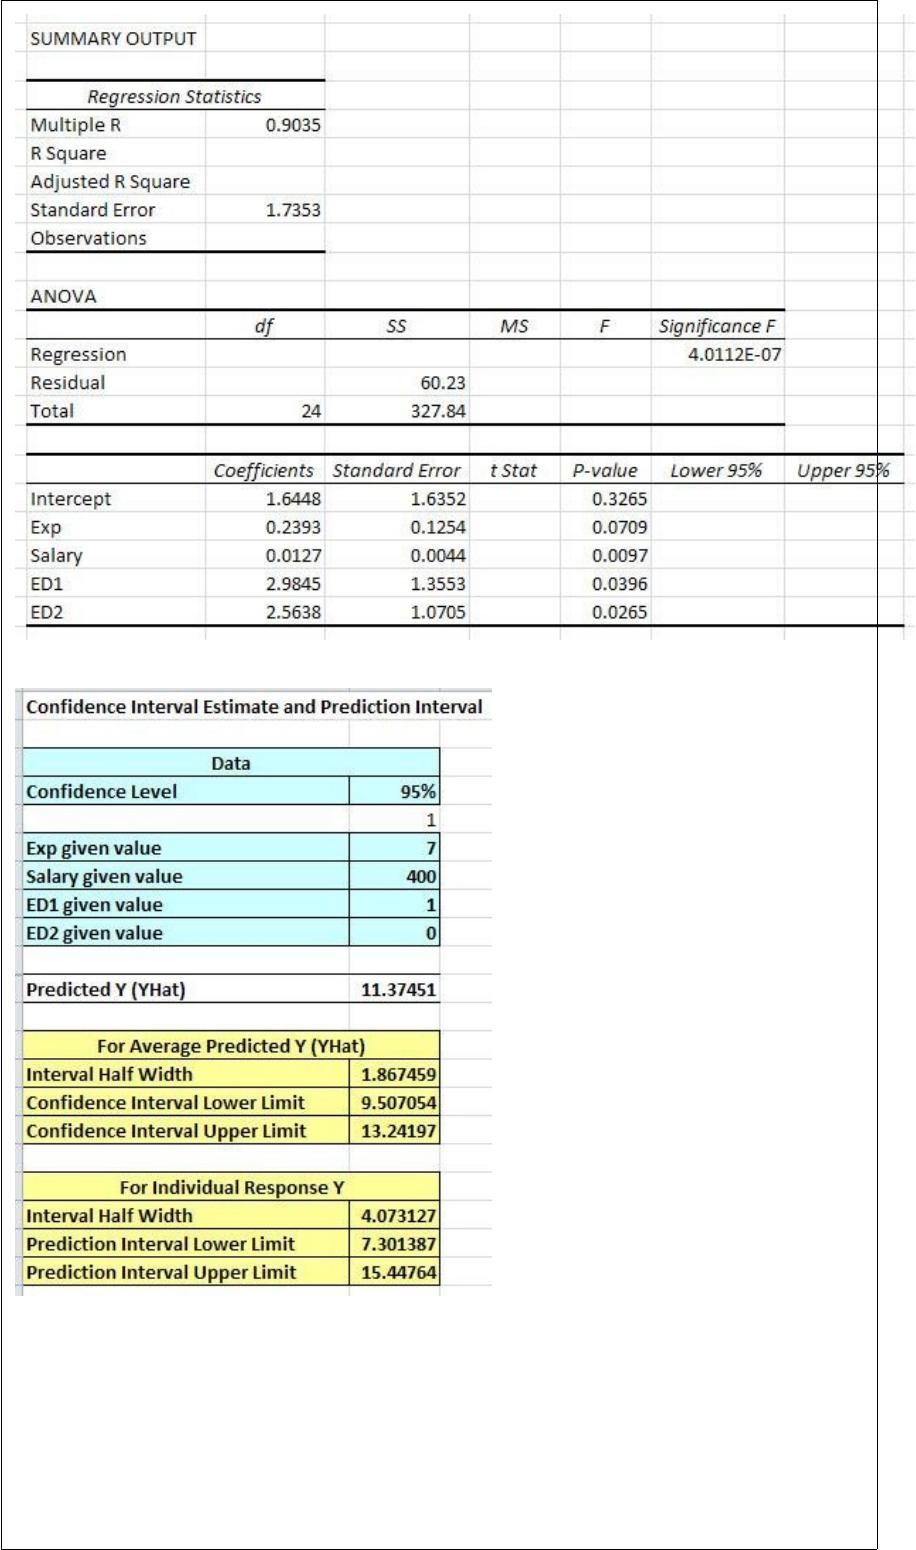
Every additional year of sales experience will
___________________________________.
A) increase the average number of cars sold per month by 1.6448
B) increase the average number of cars sold per month by 0.1254

C) increase the average number of cars sold per month by 0.3265
D) increase the average number of cars sold per month by 0.2393
A professor would like to test the hypothesis that the average number of minutes that a
student needs to complete a statistics exam has a standard deviation that is less than 5.0
minutes. A random sample of 15 students was selected and the sample standard
deviation for the time needed to complete the exam was found to be 4.0 minutes. Using
α = 0.05, the critical value for this hypothesis test would be ________.
A) 6.571
B) 7.261
C) 23.685
D) 24.996
Pareto charts also plot the cumulative relative frequency as a line on the chart. This line
is known as a(n) _________.
A) scatter plot
B) ogive
C) histogram

D) frequency distribution
According to the National Center for Health Statistics, 17% of adults between the ages
of 45 and 64 had taken statin drugs in the prior 30 days to reduce cholesterol levels. A
random sample of 120 adults from this age group was selected. What is the probability
that between 24 and 27 from this sample had taken statin drugs during the last 30 days?
A) 0.1373
B) 0.1892
C) 0.3026
D) 0.4478
Use the information below to answer the following question(s).
The following decision tree is partially completed for a company that is deciding to
build a large or small facility for a new product that will face demand that is strong or
weak. The company has an option to perform a market survey that will cost $4,000 that
will predict a strong or weak market. The payoffs for each combination of facility size
and demand are also shown.
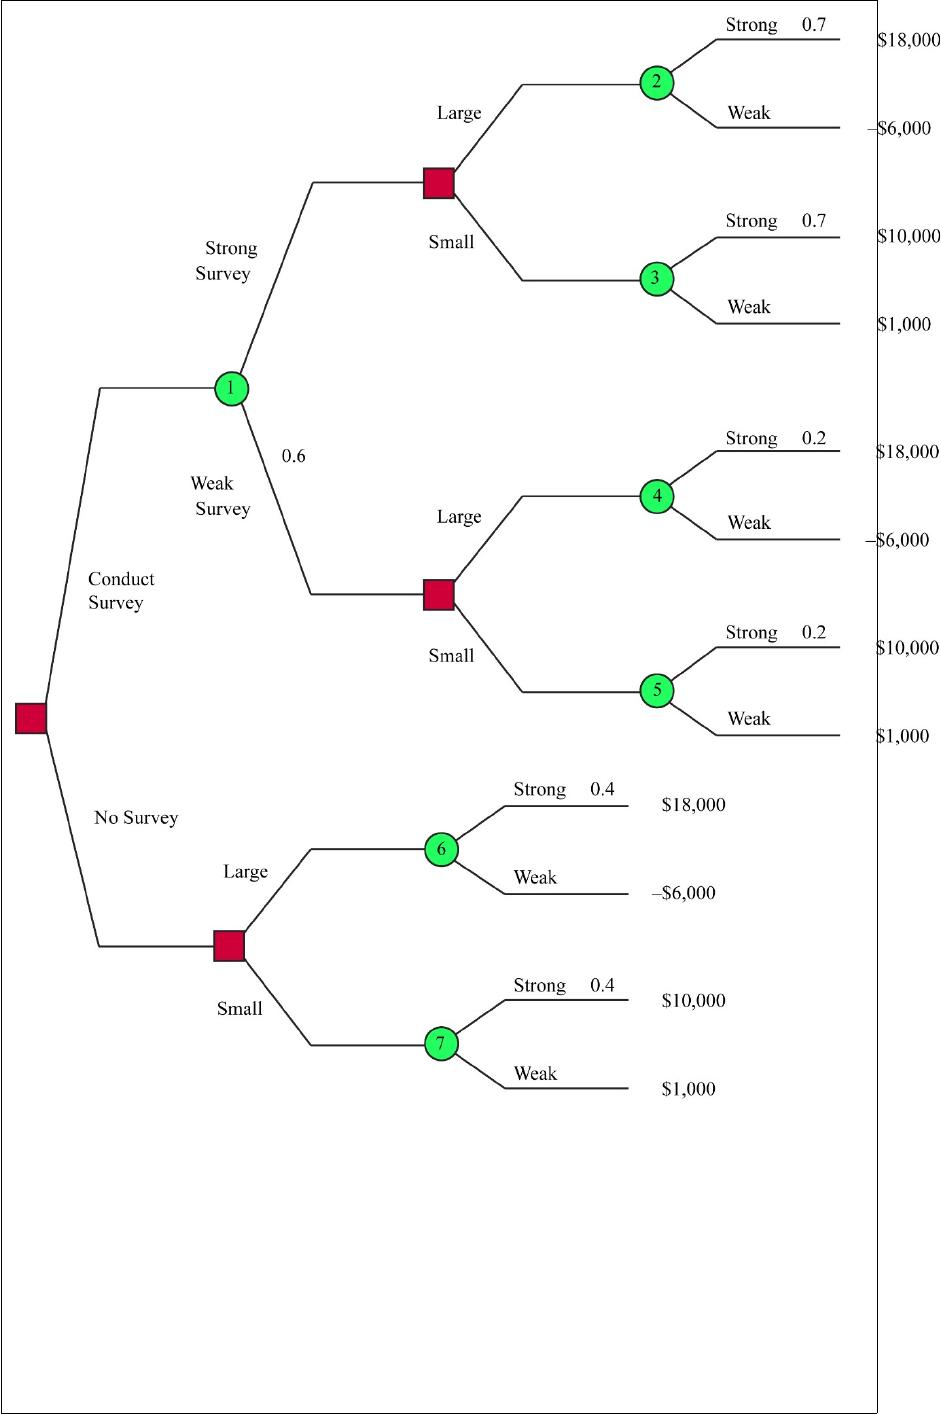
The expected value with sample information, in thousands of dollars is _________.
A) $6,000
B) $6,700
C) $7,100
D) $7,400

Entertainment Software Association would like to test if the median age of “gamers”
(those that routinely play video games) is more than 30 years old. The following table
summarizes the ages of a random sample of gamers.
The value of S for this hypothesis test is ________.
A) 12
B) 30
C) 42
D) 46
A manufacturer of smartphone batteries will randomly select 20 batteries from the
process each day and count the number of defects. Historically, 4% of the batteries
produced by this company have been defective. The following data represent the
frequency of defective batteries from a random sample of 200 days.

The manufacturer would like to test if the probability distribution for defective batteries
follows the binomial distribution with p = 0.04 and n = 20 using α = 0.05. The
conclusion for this hypothesis test would be that because the test statistic is
A) more than the critical value, we cannot reject the null hypothesis and cannot
conclude that the probability distribution follows the binomial distribution with p = 0.04
and n = 20.
B) less than the critical value, we reject the null hypothesis and cannot conclude that the
probability distribution follows the binomial distribution with p = 0.04 and n = 20.
C) more than the critical value, we reject the null hypothesis and cannot conclude that
the probability distribution follows the binomial distribution with p = 0.04 and n = 20.
D) less than the critical value, we cannot reject the null hypothesis and cannot conclude
that the probability distribution does not follow the binomial distribution with p = 0.04
and n = 20.
Recent survey data indicated that 14.2% of adults between the ages of 25 and 34 live
with their parents. A random sample of 125 young adults in this age group was selected.
What is the probability that between 13 and 17 of these young adults lived with their
parents?
A) 0.1808
B) 0.2620
C) 0.3505
D) 0.3135

________ can be described as a ‘self-correcting” forecasting technique.
A) Simple moving average
B) Weighted moving average
C) Exponential smoothing
D) Multiplicative decomposition
The following data represent the number of refrigerators sold for each of the past five
months for Templeton Appliances.
Using a two-period simple moving average, the sales forecast for Month 6 is ________.
A) 32.5
B) 40.0
C) 45.0
D) 50.0

Apple would like to estimate the web browsing battery life of the iPad. The following
data represents the battery life, in hours, experienced by six users.
10 13 12 16 10 8
Using this sample, the 95% confidence interval that estimates the average web
browsing battery life for the iPad is ________.
A) (10.35, 12.65)
B) (8.54, 14.46)
C) (7.47, 15.53)
D) (6.32, 16.68)
Smith Motors currently has 50 cars in their inventory. The following table shows the
number of cars in each class of combined city and highway miles per gallon.
What is the approximate average miles per gallon for cars from this population?
A) 16.5
B) 17.0
C) 18.7
D) 19.3
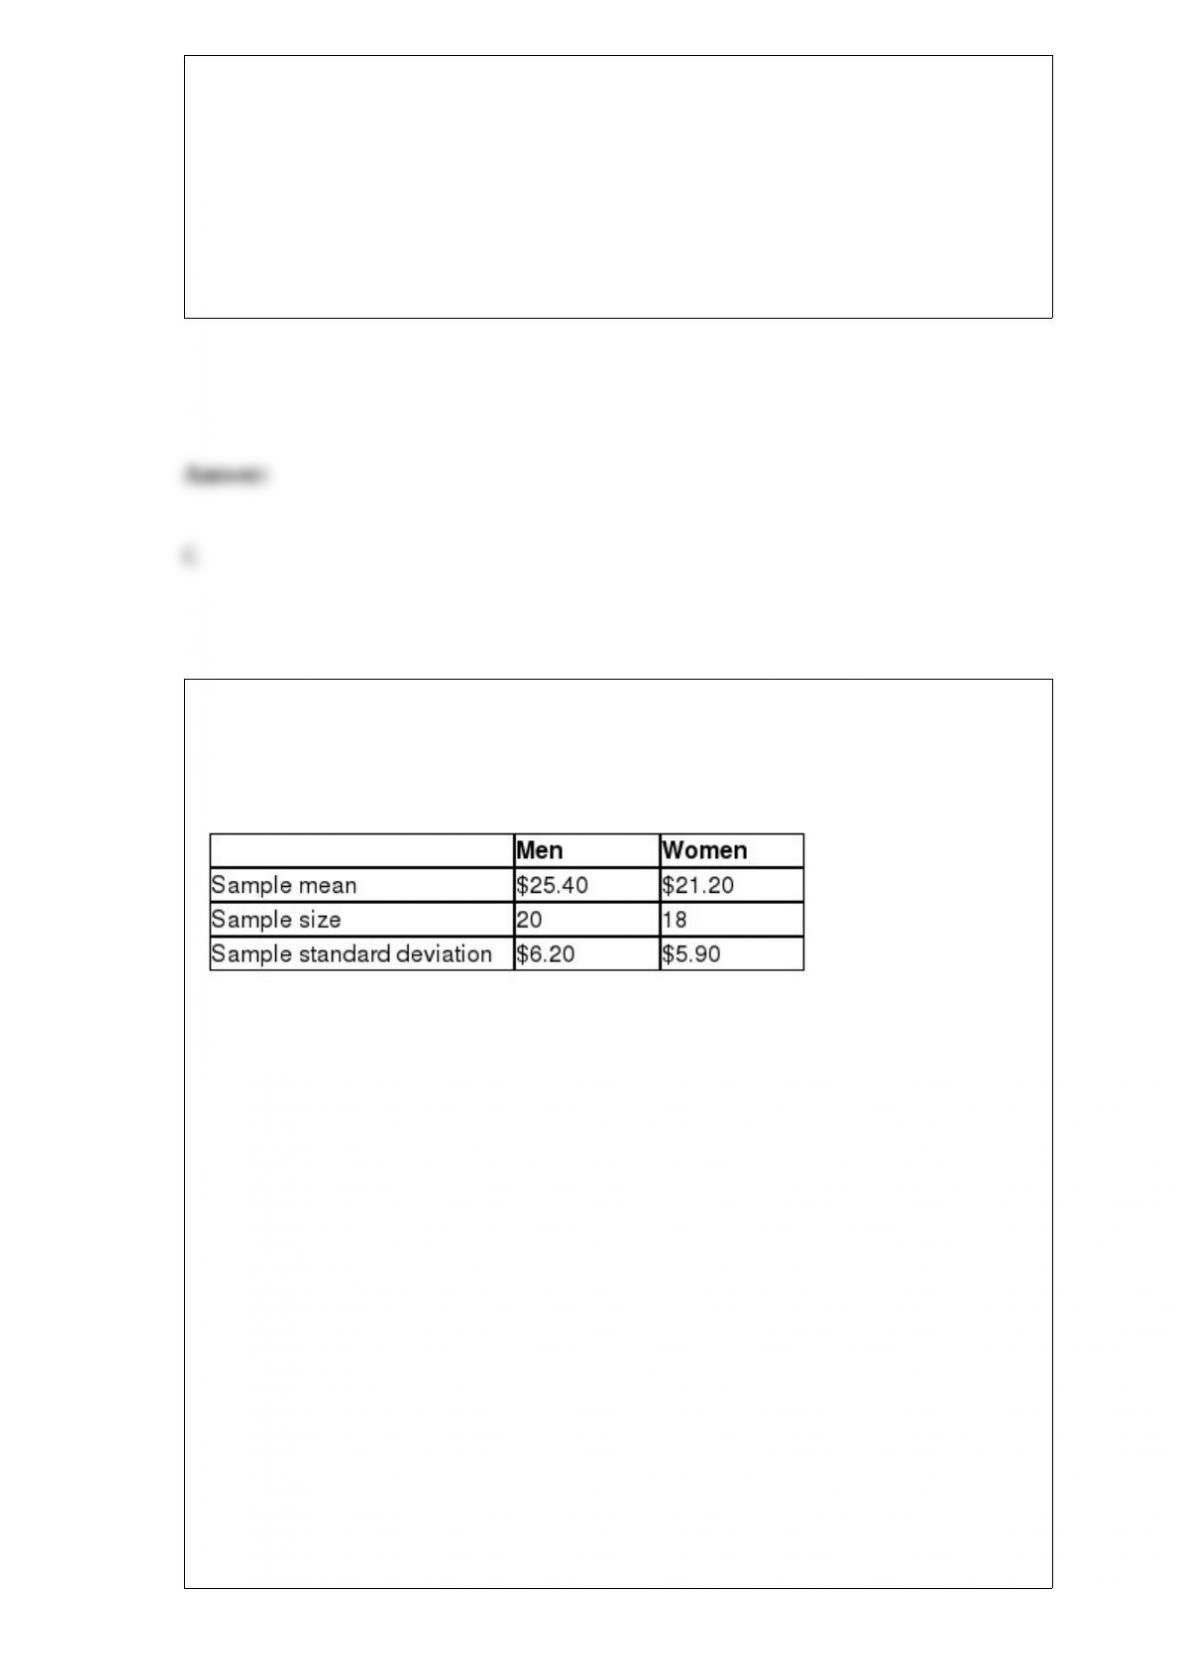
The Canadian government would like to test the hypothesis that the average hourly
wage for men is more than $2.00 higher than the average hourly wage for women. The
following data summarizes the sample statistics for hourly wages for men and women.
Assume that the population variances are equal.
If Population 1 is defined as men and Population 2 is defined as women, and using α =
0.025, the conclusion for this hypothesis test would be that because the test statistic is
______________________________________________________________________
______.
A) less than the critical value, the Canadian government cannot conclude that the
average hourly wage for men is more than $2.00 higher than the average hourly wage
for women
B) less than the critical value, the Canadian government can conclude that the average
hourly wage for men is more than $2.00 higher than the average hourly wage for
women
C) more than the critical value, the Canadian government cannot conclude that the
average hourly wage for men is more than $2.00 higher than the average hourly wage
for women
D) more than the critical value, the Canadian government can conclude that the average
hourly wage for men is more than $2.00 higher than the average hourly wage for
women
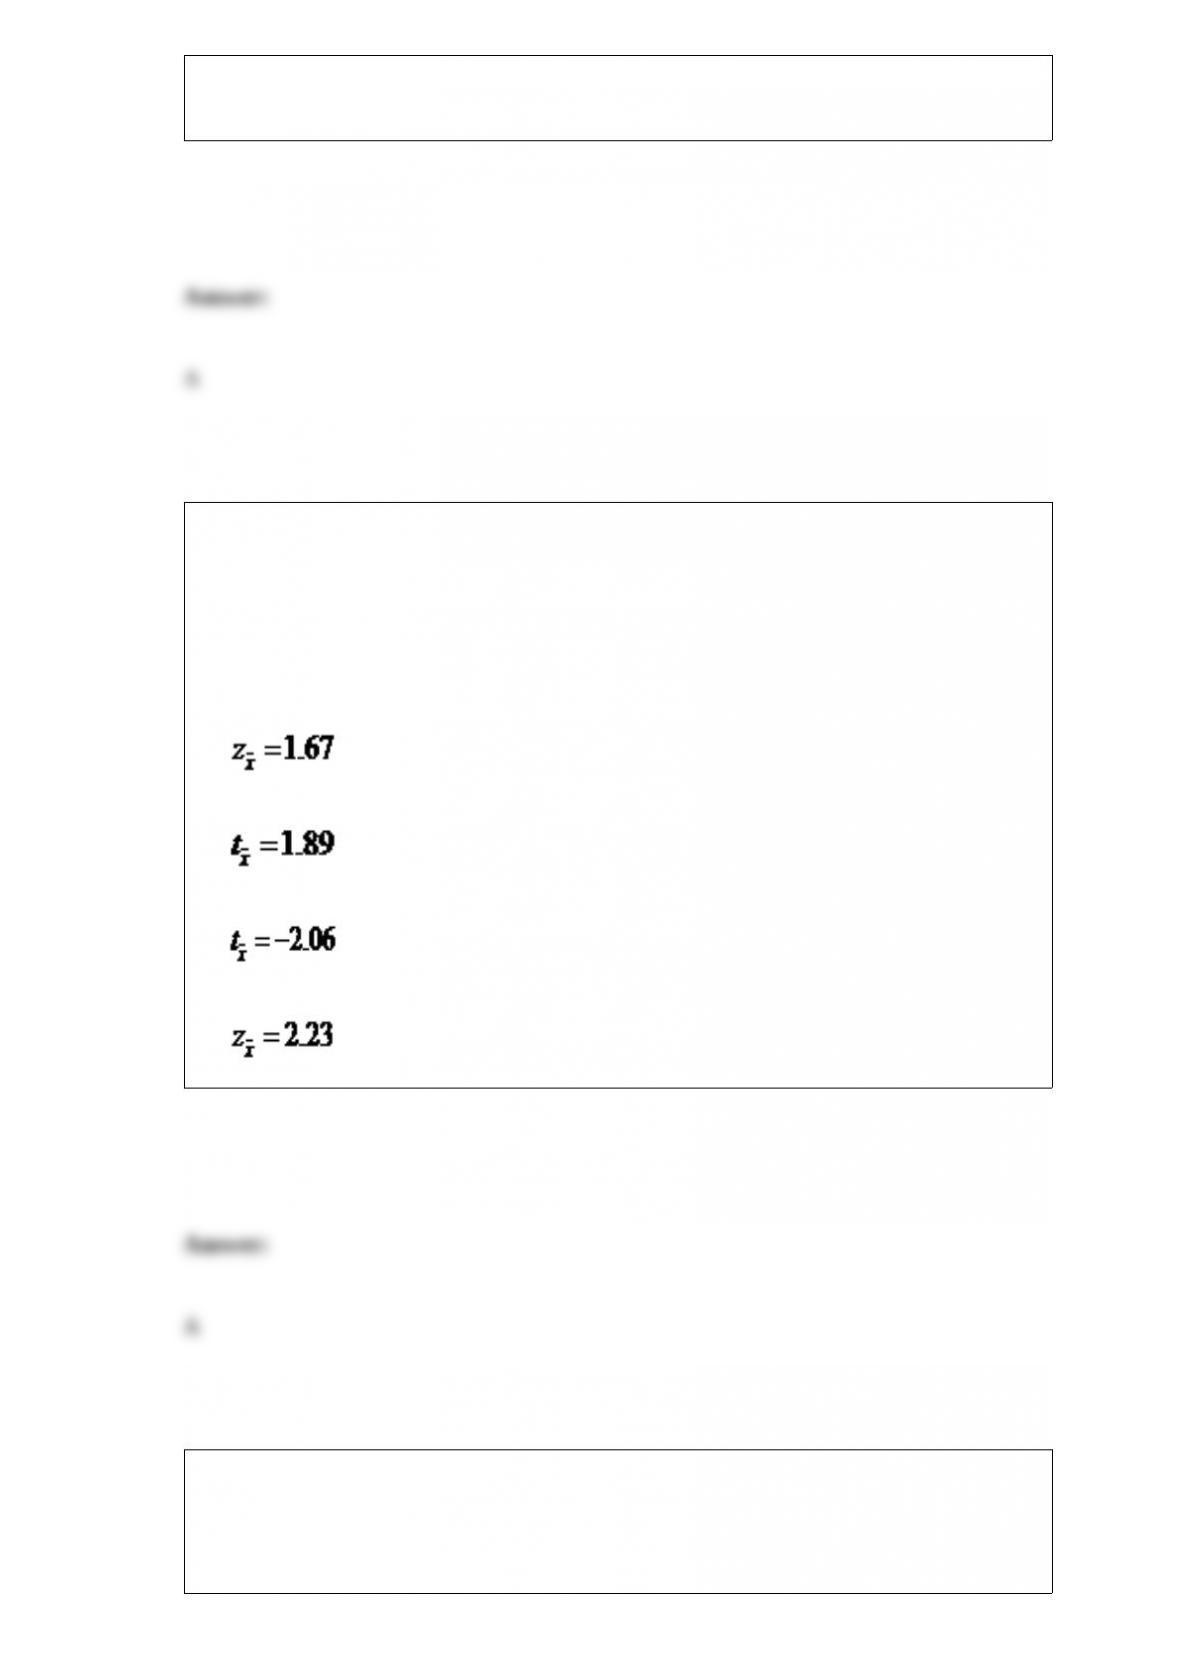
The Department of Education would like to test the hypothesis that the average debt
load of graduating students with a Bachelor’s degree is equal to $17,000. A random
sample of 34 students had an average debt load of $18,200. It is believed that the
population standard deviation for student debt load is $4,200. The Department of
Education would like to set α = 0.05. The test statistic for this hypothesis test would be
________.
A)
B)
C)
D)
Wells Fargo Bank would like to determine if a difference exists in the average credit
score between residents of the states of Texas, Alaska, and Iowa and also investigate if
age plays a role in credit score. The credit scores from a random sample of residents
from each state was recorded and residents were categorized as being under 40 years
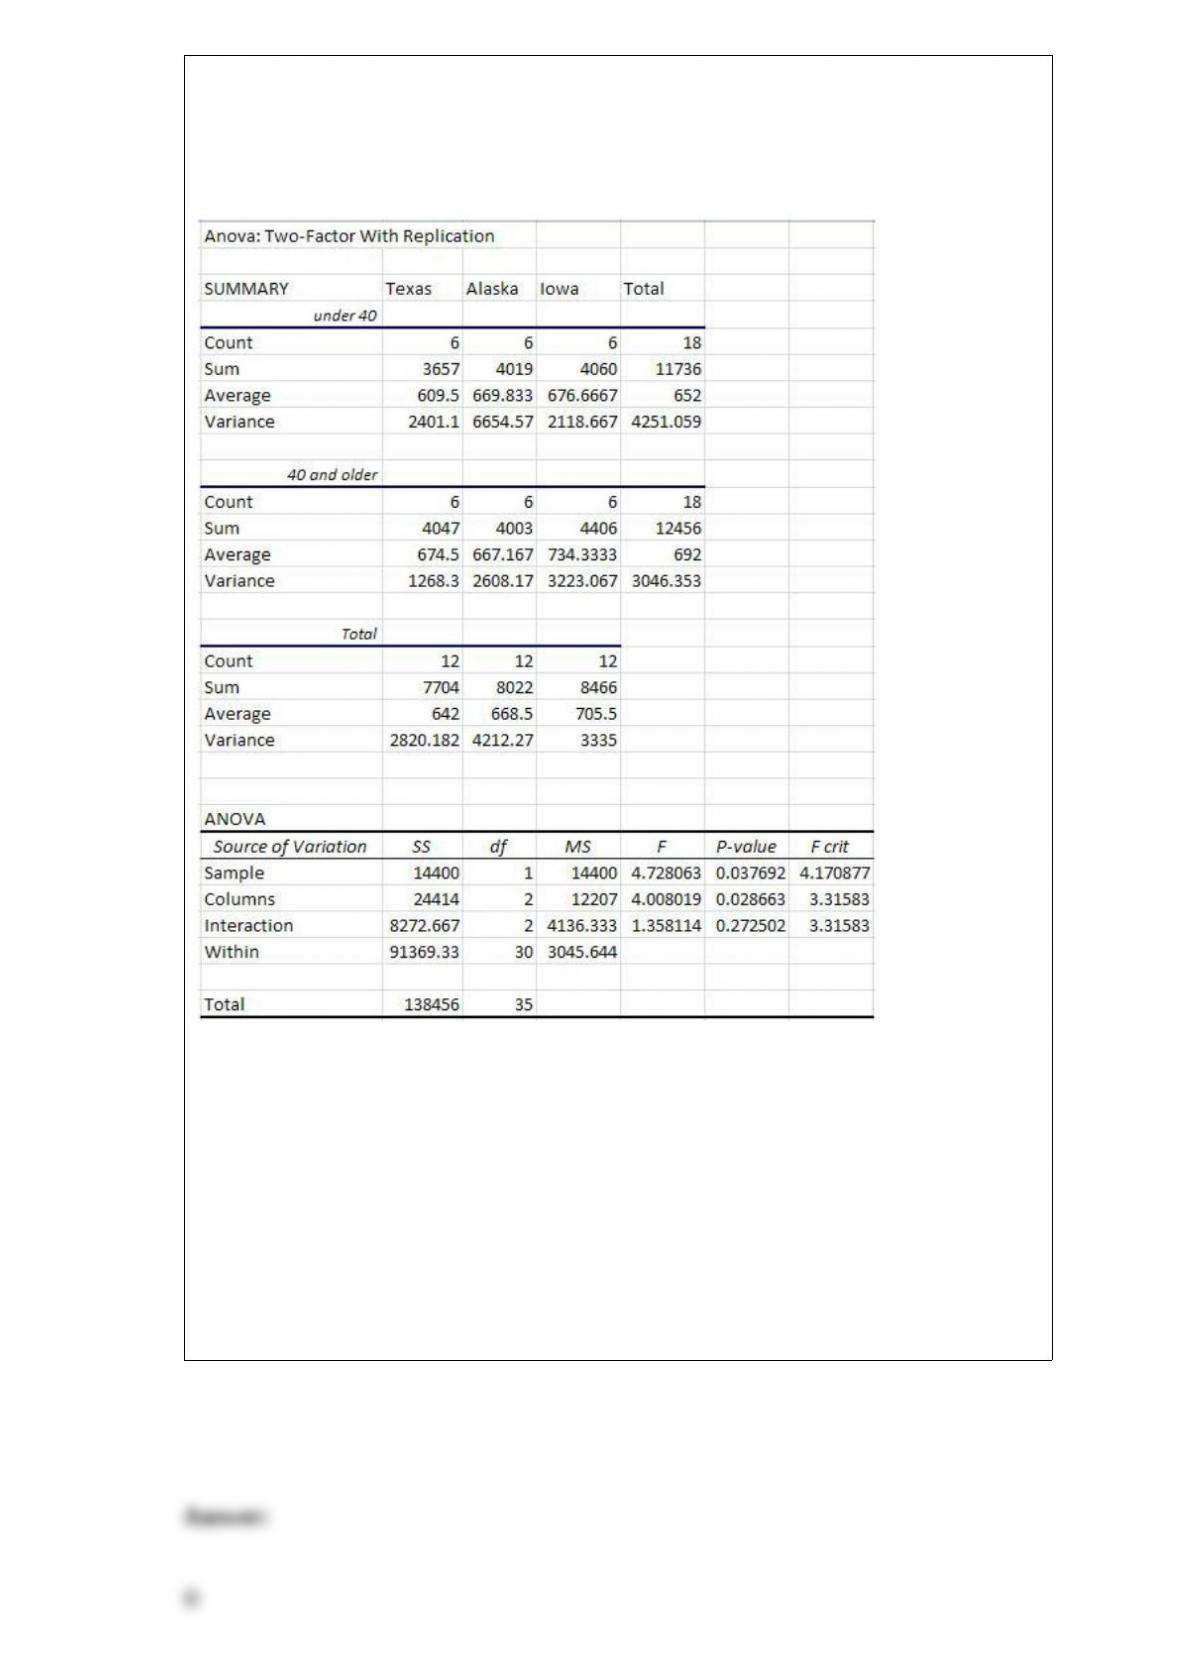
old or 40 years and older. A two-way ANOVA was conducted using α = 0.05 with
Factor A assigned the state residence and Factor B assigned the age group. The results
are shown below.
The conclusion for the Tukey-Kramer multiple comparisons test using α = 0.05 is that
________.
A) Texas and Alaska is the only pair of average credit scores that are different
B) Texas and Iowa is the only pair of average credit scores that are different
C) Alaska and Iowa is the only pair of average credit scores that are different
D) There are no pairs of states that have average credit scores that are different

A recent study reported that 28% of shoppers only review one page when searching
online for product information. A random sample of 100 shoppers was randomly
selected. What is the probability that between 20 and 30 of these shoppers only review
one page when searching online?
A) 0.3266
B) 0.4692
C) 0.5418
D) 0.6361
The Canadian government would like to test the hypothesis that the average hourly
wage for men is more than $2.00 higher than the average hourly wage for women. The
following data summarizes the sample statistics for hourly wages for men and women.
Assume that the population variances are equal.
If Population 1 is defined as men and Population 2 is defined as women, the p-value for
this hypothesis test would be between ________.
A) 0.01 and 0.025
B) 0.025 and 0.05
C) 0.05 and 0.10
D) 0.10 and 0.20
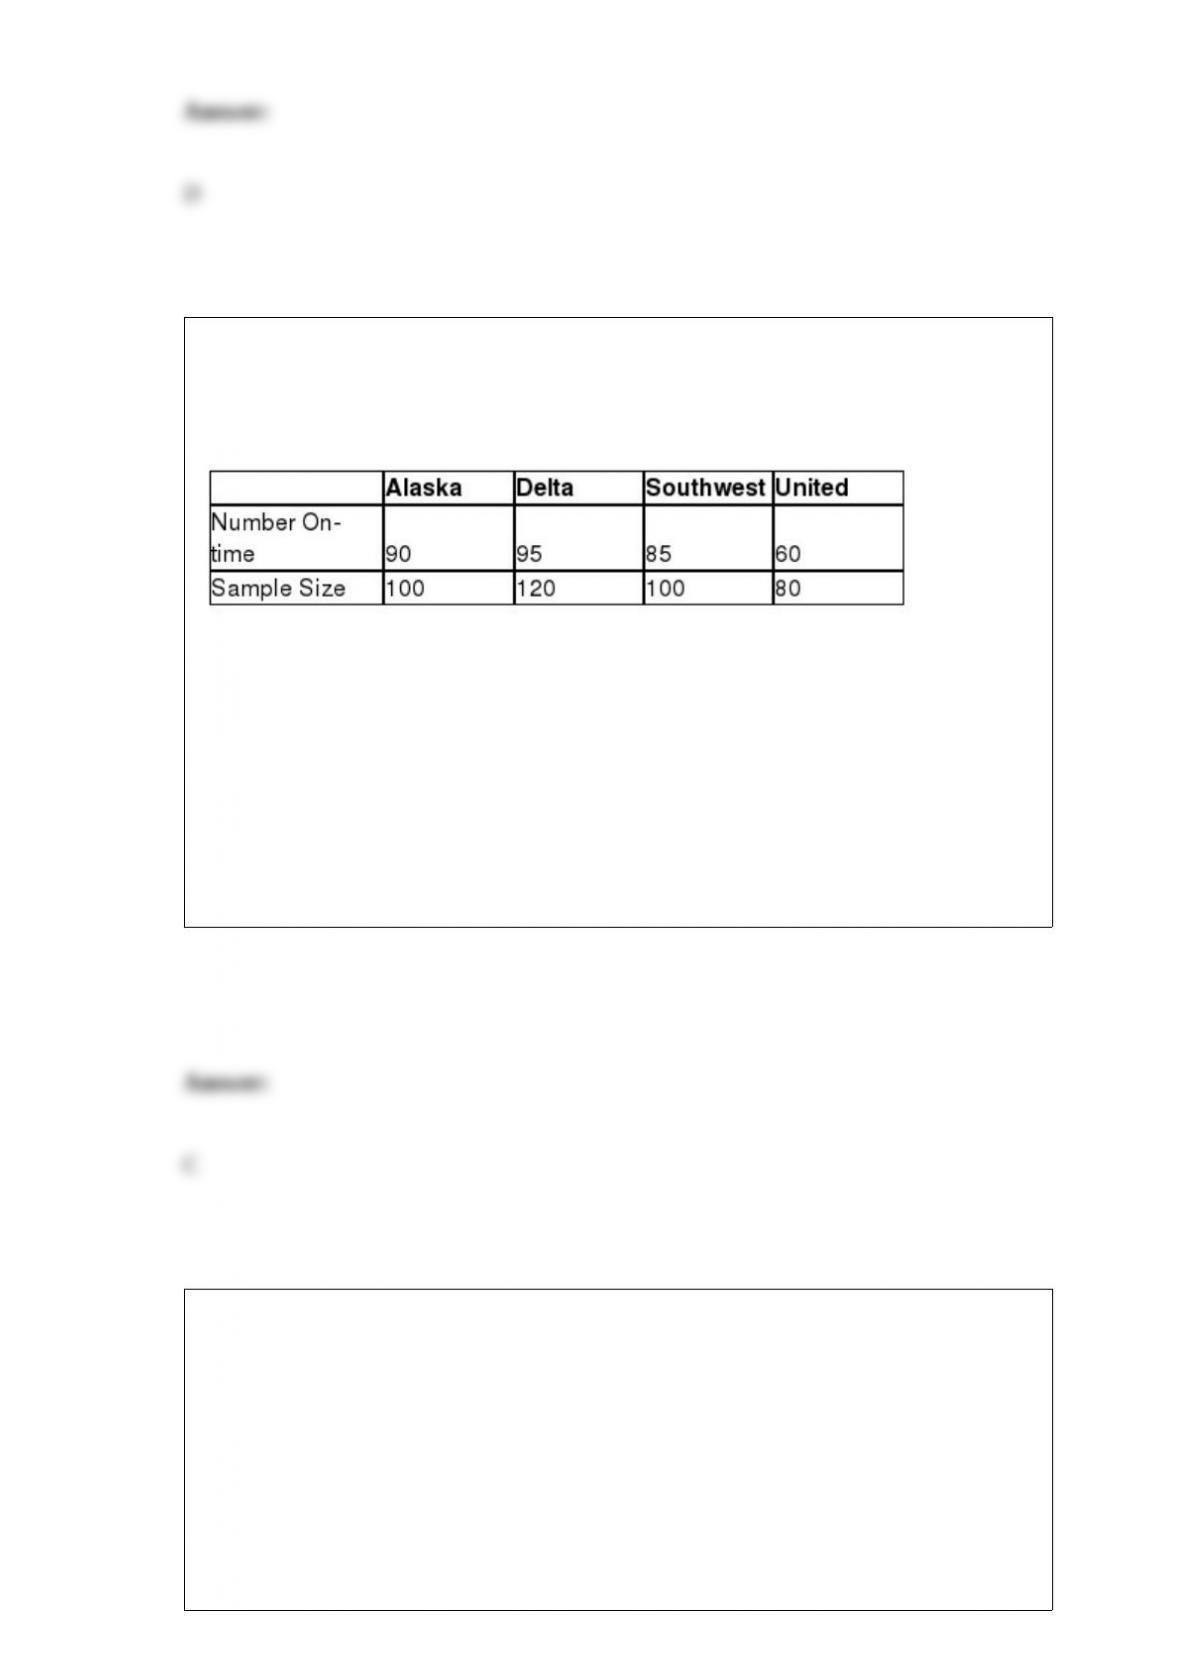
The Department of Transportation would like to investigate if a difference exists in the
proportion of flights that arrive on-time between Alaska Airlines, Delta Airlines,
Southwest Airlines, and United Airlines. The following data represent the number of
on-time flights from random samples taken from each airline.
The degrees of freedom for the chi-square critical value is ________.
A) 1
B) 2
C) 3
D) 4
According to climate data recorded since 1884, the average annual snowfall in
Philadelphia is 22.3 inches. This value is an example of _______________.
A) biased data
B) qualitative data
C) descriptive statistics
D) inferential statistics
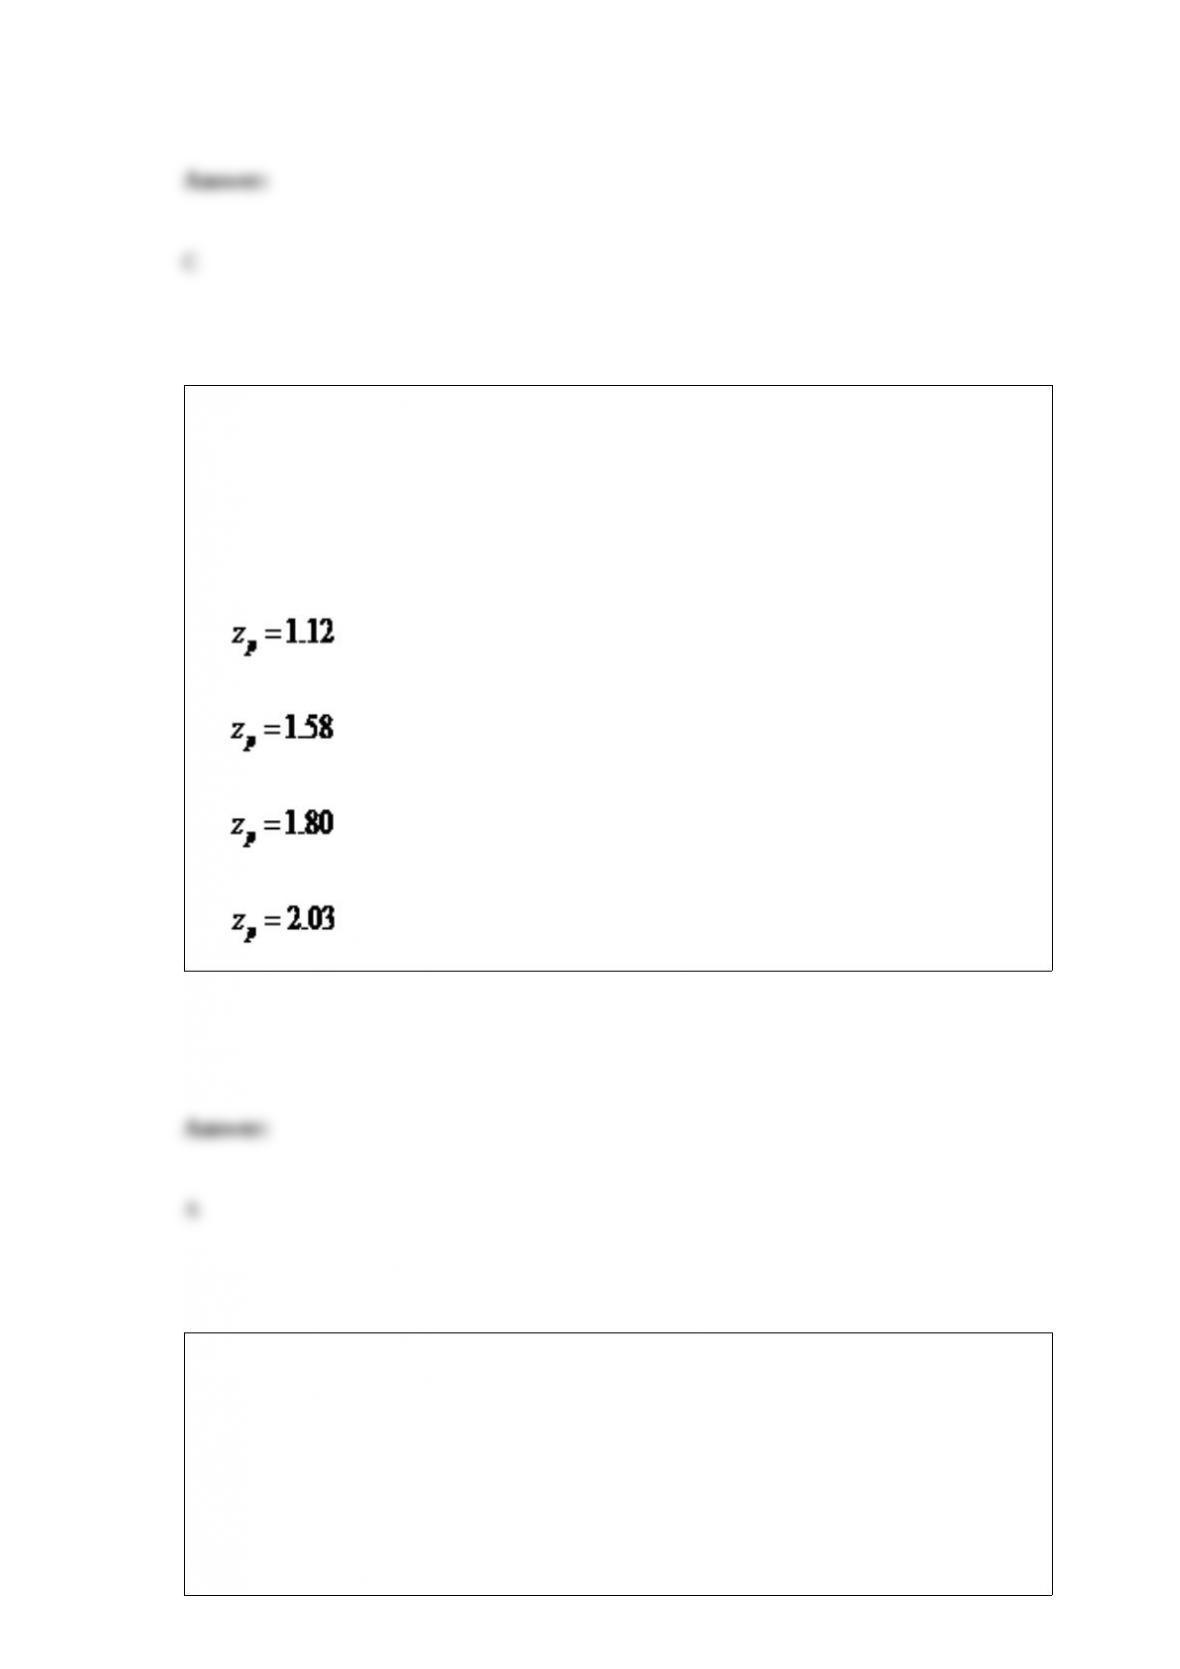
Many hotel chains that offer free Wi-Fi service to their customers have experienced
increasing demand for Internet bandwidth and increasing costs. Marriott International
would like to test the hypothesis that the proportion of customers that are carrying two
Wi-Fi devices exceeds 0.60. A random sample of 120 Marriott customers found that 78
have two Wi-Fi devices. Marriott International would like to set α = 0.01. The test
statistic for this hypothesis test would be _______.
A) .
B) .
C) .
D) .
The shape of the exponential distribution is ______________.
A) symmetrical
B) left-skewed
C) right-skewed

D) flat
According to the MIT Airline Data Project, American Airlines controlled 15.5% of the
domestic market during a recent year. A random sample of 125 domestic passengers
that year was selected. Using the normal approximation to the binomial distribution,
what is the probability that 20, 21, 22, 23, 24, or 25 passengers from this sample were
on American Airline flights?
A) 0.2534
B) 0.4225
C) 0.5319
D) 0.6810
Suppose Pepsi wants to perform a blind taste test to determine if people prefer Pepsi
Max or Pepsi One. The following table shows the preferences of a random sample of
adults.
Using α = 0.10, which one of the following statements is true?

A) Because the p-value is greater than α, we reject the null hypothesis and cannot
conclude that adults have a preference for Pepsi Max or Pepsi One.
B) Because the p-value is greater than α, we fail to reject the null hypothesis and cannot
conclude that adults have a preference for Pepsi Max or Pepsi One.
C) Because the p-value is less than α, we fail to reject the null hypothesis and conclude
that adults have a preference for Pepsi Max or Pepsi One.
D) Because the p-value is less than α, we reject the null hypothesis and conclude that
adults have a preference for Pepsi Max or Pepsi One.