The average salary for a sales representative in a medical billing company is $46,600
with a standard deviation of $6,400. The coefficient of variation for salaries at this
company is ______.
A) 9.0%
B) 11.7%
C) 13.7%
D) 16.4%
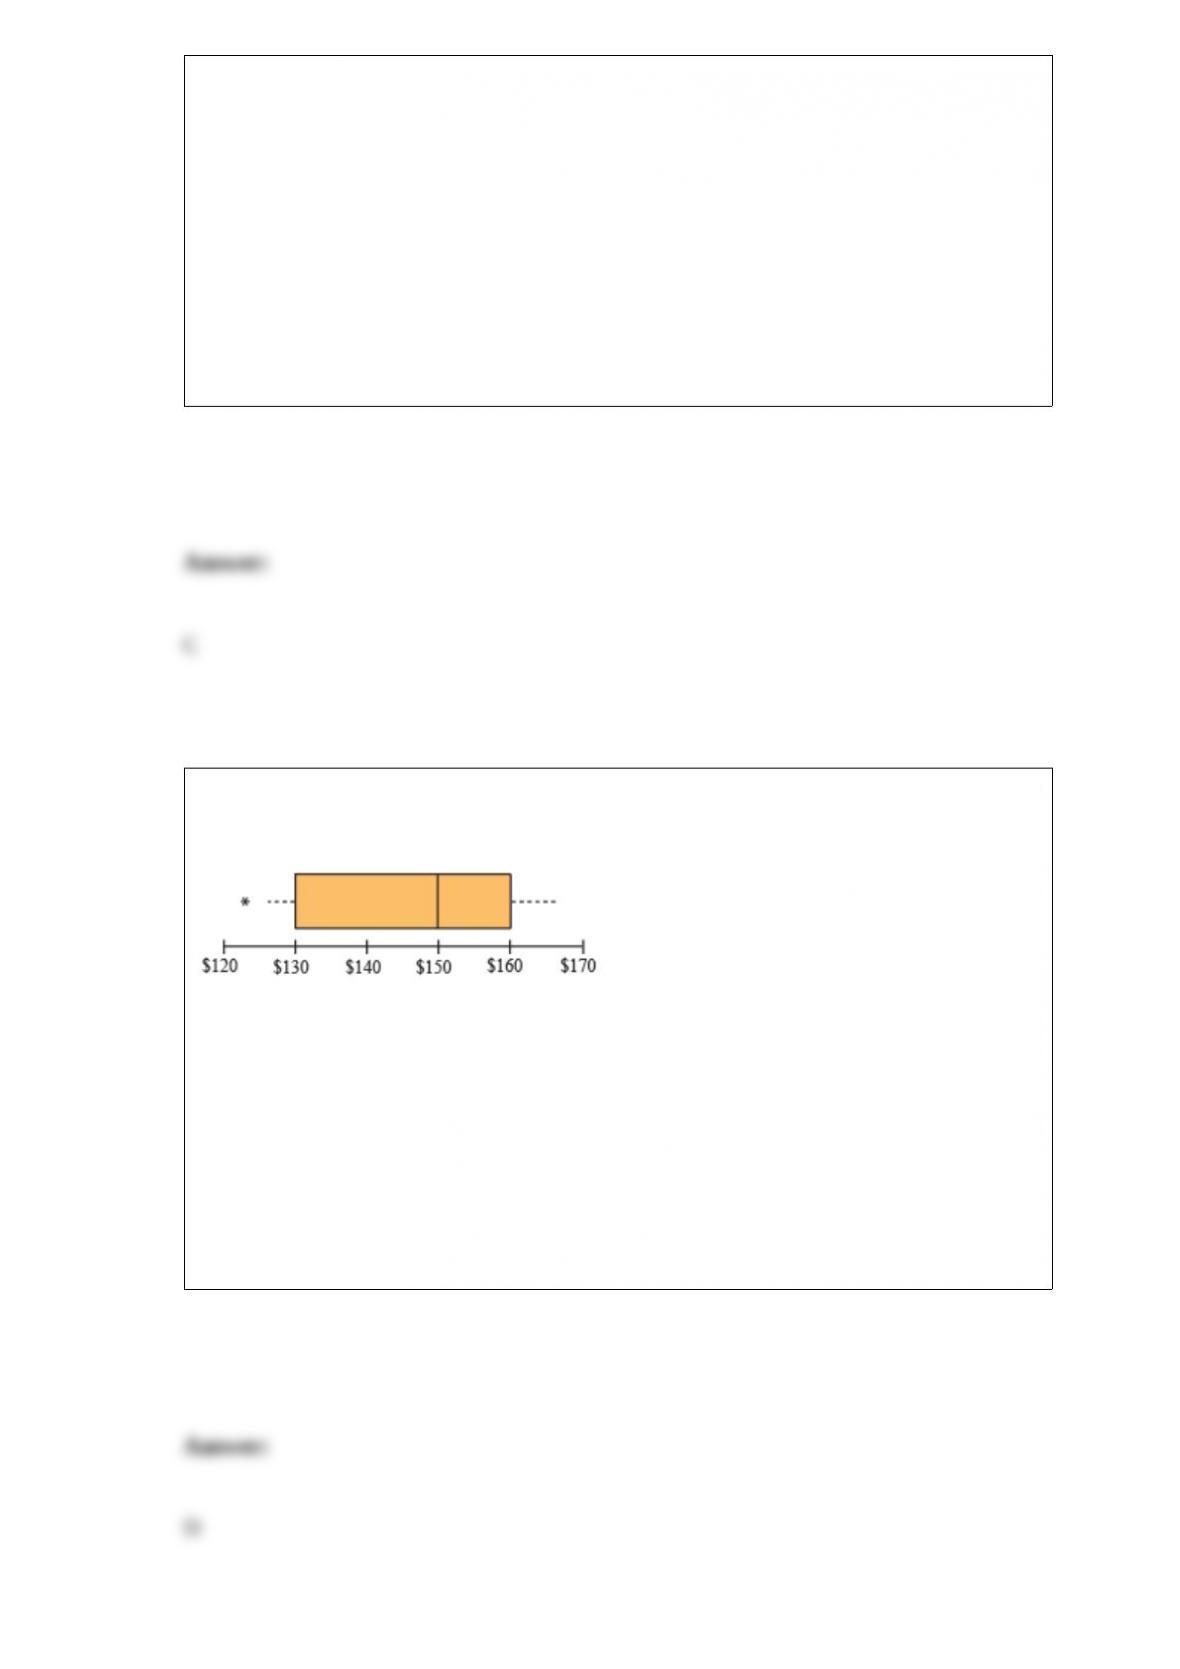
The following box-and-whisker plot shows the distribution for three-star hotel rates per
night in New York City.
Based on this plot, which one of the following statements is not correct?
A) The median room rate is $150 per night.
B) There is one outlier in this data set.
C) The 25th percentile in this data set is $130 per night.
D) The second quartile in the data set is $160 per night.

As the value of alpha increases for the same data using exponential smoothing, the
MAD tends to increase on a straight line across various values of alpha.
A recent survey conducted by the Country Financial Security Index asked adults 18 and
older if they felt that next year will be financially better for them. Thirty percent of the
respondents answered “Yes”. To verify these findings, a random sample of 250 adults
was asked the same question. A total of 55 adults from this sample responded “Yes”.
Which of the following statements is correct?
A) The interval that contains 95% of the sample proportions is 0.205 and 0.395.
Because the sample proportion is between these two values, we have support for the
results of the Country Financial Security Index survey.
B) The interval that contains 95% of the sample proportions is 0.205 and 0.395.
Because the sample proportion is not between these two values, we do not have support
for the results of the Country Financial Security Index survey.
C) The interval that contains 95% of the sample proportions is 0.243 and 0.357.
Because the sample proportion is between these two values, we have support for the
results of the Country Financial Security Index survey.
D) The interval that contains 95% of the sample proportions is 0.243 and 0.357.
Because the sample proportion is not between these two values, we do not have support
for the results of the Country Financial Security Index survey.
Costco sells paperback books in their retail stores and wanted to examine the
relationship between price and demand. The price of a particular novel was adjusted

each week and the weekly sales were recorded in the table below.
Which one of the following statements describes the results of the hypothesis test that
the population correlation coefficient is less than zero using α = 0.05?
A) Because the test statistic is less than the critical value, we fail to reject the null
hypothesis and conclude that the population correlation coefficient is less than zero.
B) Because the test statistic is less than the critical value, we can reject the null
hypothesis and conclude that the population correlation coefficient is less than zero.
C) Because the test statistic is greater than the critical value, we can reject the null
hypothesis and conclude that the population correlation coefficient is less than zero.
D) Because the test statistic is greater than the critical value, we fail to reject the null
hypothesis and conclude that the population correlation coefficient is not less than zero.
Entertainment Software Association would like to test if the average age of “gamers”
(those that routinely play video games) is more than 30 years old. A random sample of
33 gamers was selected and their ages were recorded. Assume that the standard
deviation for the population of the age of gamers is 4.7 years and the true population
mean for the age of gamers is 31.2 years. Using α = 0.02, beta equals ________.
A) 0.0434
B) 0.1247
C) 0.2918
D) 0.7224
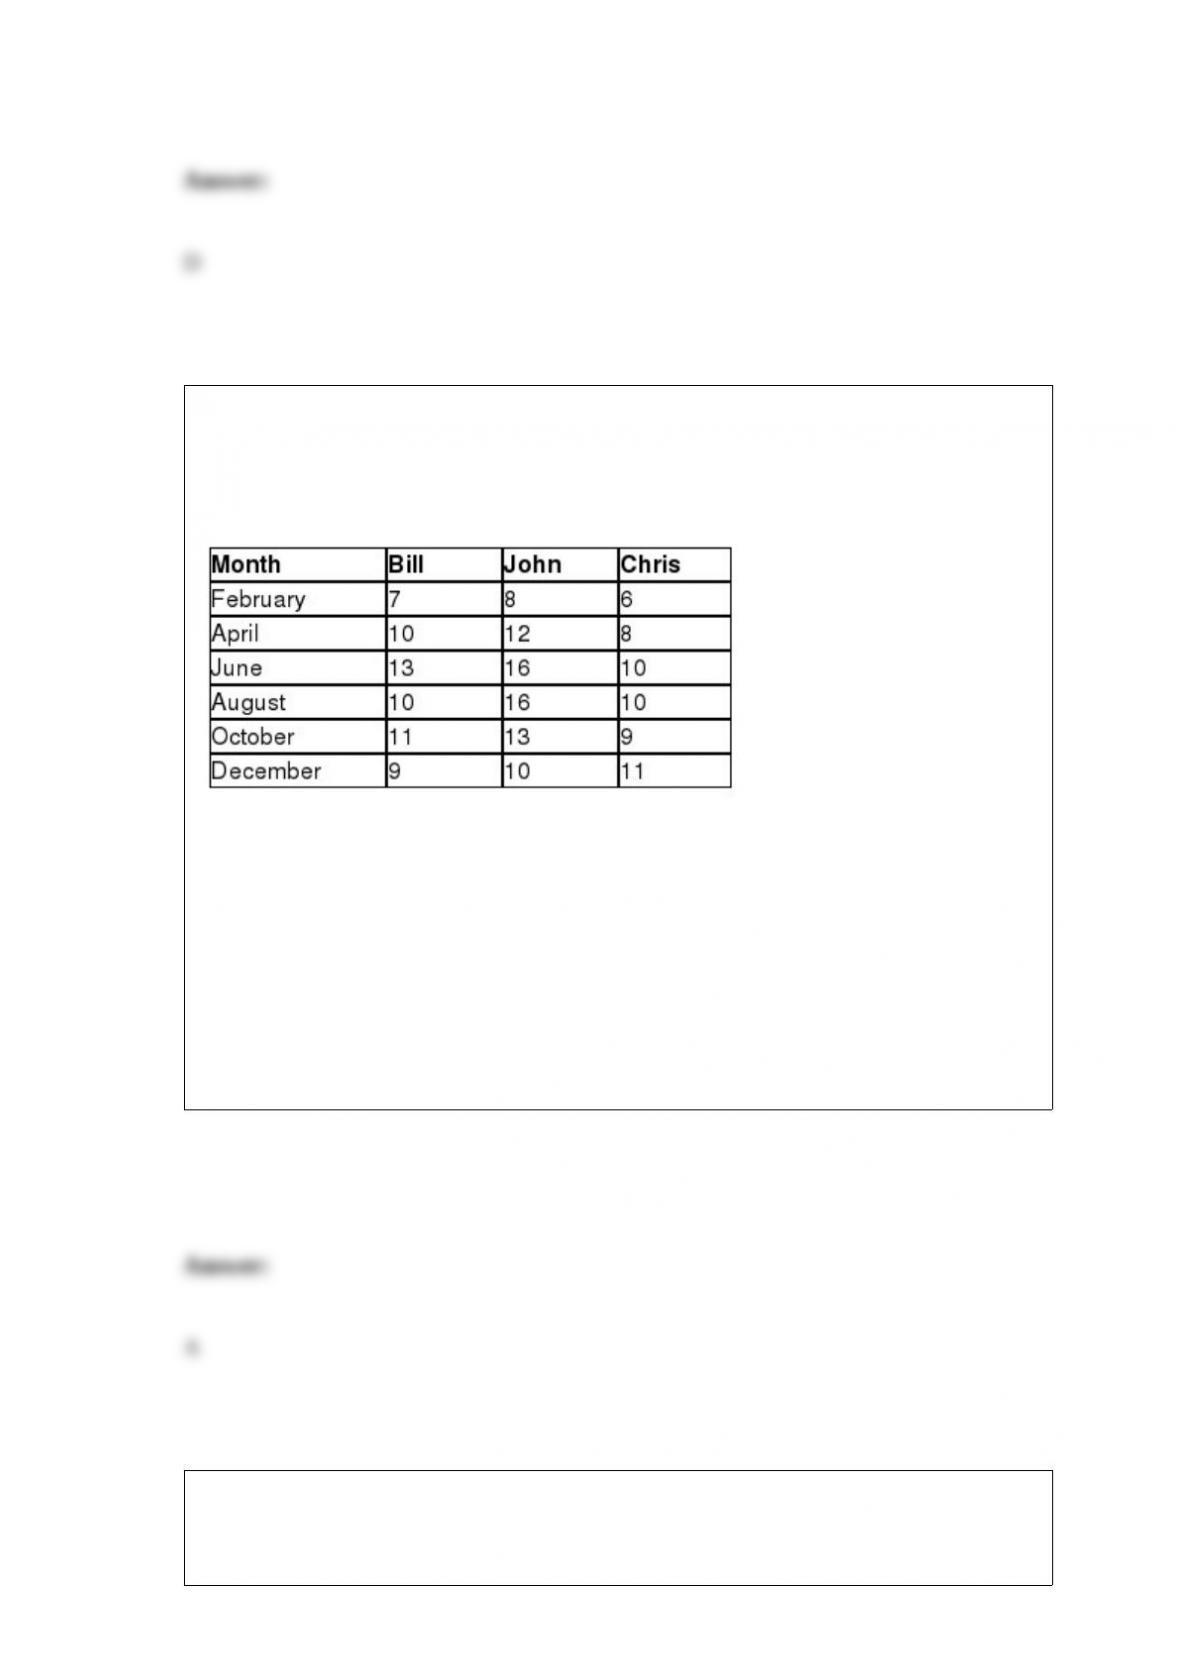
Sheridan Motors is a car dealership that would like to investigate if there is a difference
in the average number of car sales per month between three sales employees using a
randomized block ANOVA. The following data represent the number of car sales last
year for these employees for six different months.
The sum of squares between for these observations is ________.
A) 39.0
B) 45.8
C) 62.1
D) 69.5
The Wall Street Journal reported that the average amount of time that a French person
spends eating lunch at a restaurant is 22 minutes. Perform a hypothesis test to determine
if a difference exists between the average time an American spends eating lunch when

compared to a person from France. The following data represents the time, in minutes,
that random French and American diners spent at lunch. Assume that the population
variances are equal.
The standard deviation of the French sample is ________.
A) 2.35
B) 2.76
C) 4.07
D) 5.00
Medicare would like to test the hypothesis that the standard deviation for the monthly
rate for one-bedroom assisted-living facility is more than $400. A random sample of 17
assisted living facilities had a standard deviation of $530. Using α = 0.01, the critical
value for this hypothesis test would be ________.
A) 5.812
B) 6.908
C) 32.000
D) 34.267
________ group several values in a single column within the same category in a
vertical direction.
A) Stacked bar charts
B) Clustered bar charts
C) Pie charts
D) Scatter plots
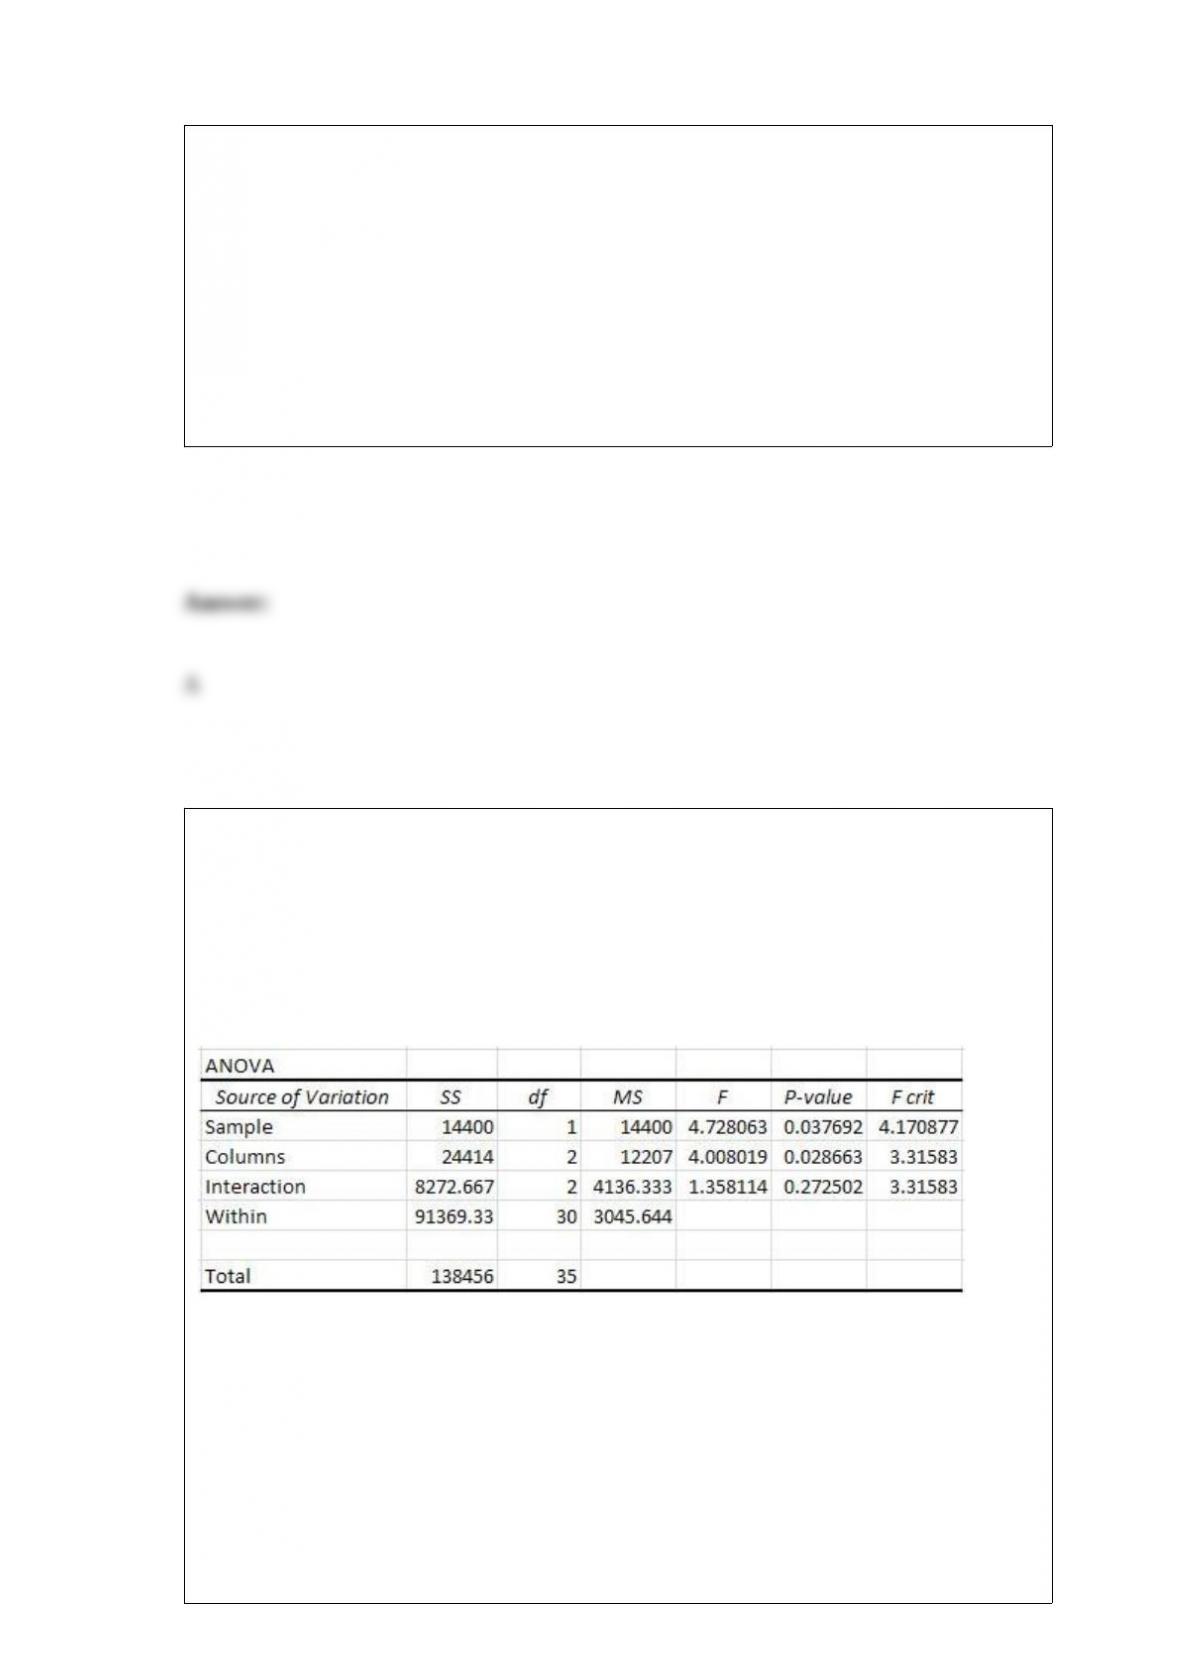
Wells Fargo Bank would like to determine if a difference exists in the average credit
score between residents of the states of Texas, Alaska, and Iowa and also investigate if
age plays a role in credit score. The credit scores from a random sample of residents
from each state was recorded and residents were categorized as being under 40 years
old or 40 years and older. A two-way ANOVA was conducted using α = 0.05 with
Factor A assigned the state residence and Factor B assigned the age group. The results
are shown below.
A conclusion for this ANOVA procedure would be that because the interaction test
statistic is
______________________________________________________________________
______.
A) more than the critical value, we cannot reject the null hypothesis and conclude that
Factors A and B interact
B) more than the critical value, we can reject the null hypothesis and conclude that
Factors A and B interact
C) less than the critical value, we cannot reject the null hypothesis and can conclude
that Factors A and B do not interact
D) less than the critical value, we can reject the null hypothesis and can conclude that
Factors A and B do not interact
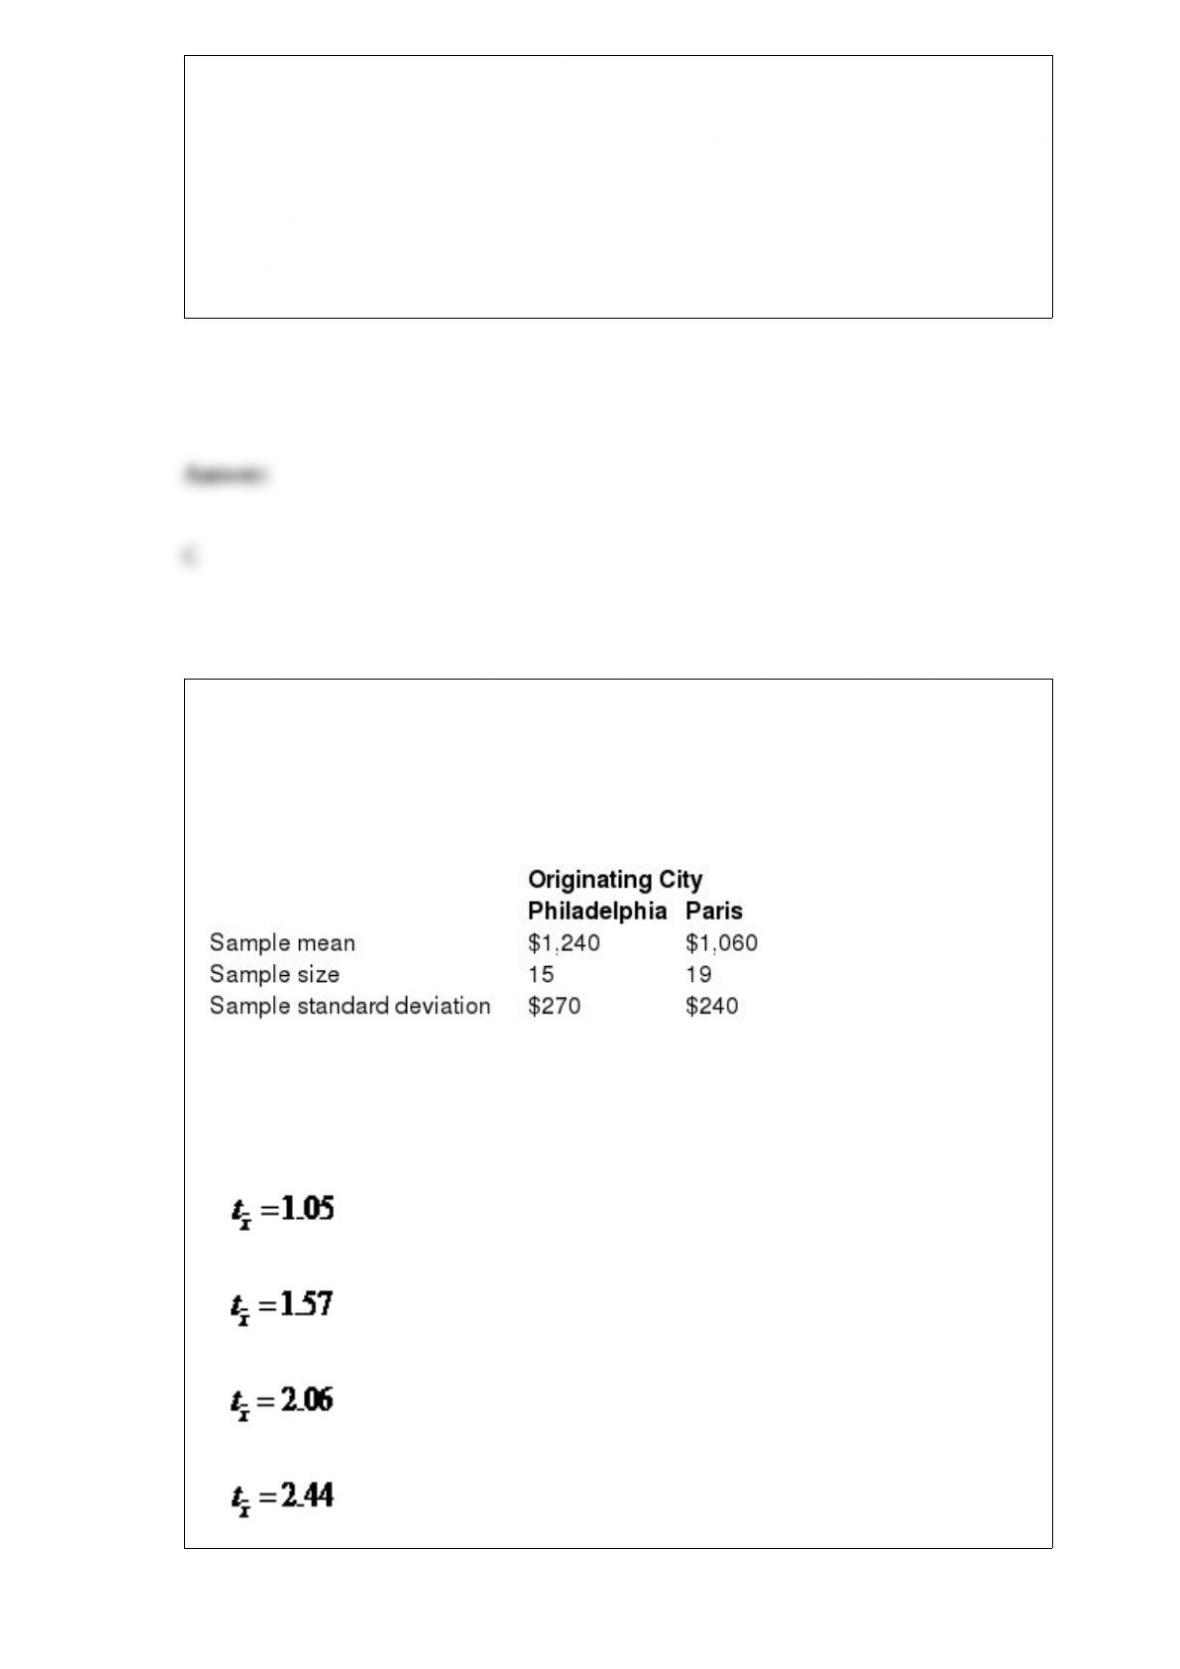
Expedia would like to test the hypothesis that the average roundtrip airfare between
Philadelphia and Paris is higher for a flight originating in Philadelphia when compared
to a flight originating in Paris. The following data summarizes the sample statistics for
roundtrip flights originating in both cities. Assume that the population variances are
equal.
If Population 1 is defined as flights originating in Philadelphia and Population 2 is
defined as flights originating in Paris, the test statistic for this hypothesis test would be
________.
A)
B)
C)
D)

The primary purpose of cluster sampling is to make the sampling process
_______________.
A) more convenient
B) more economical
C) less biased
D) more accurate
The probability of a Type I error is denoted as _______.
A) alpha
B) beta
C) sigma
D) rho
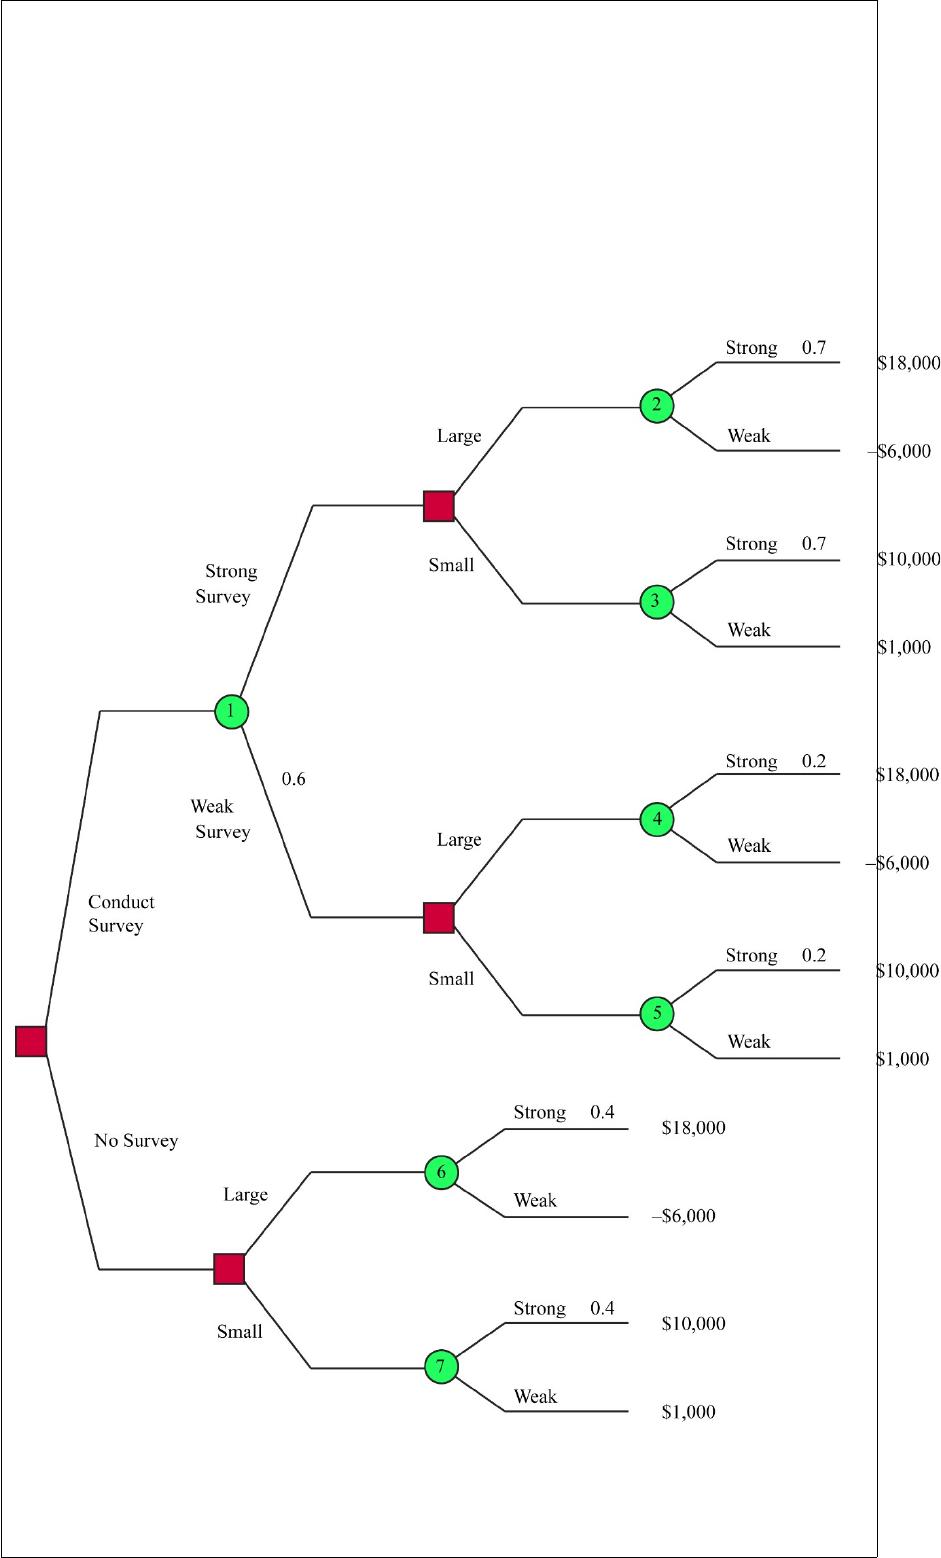
Use the information below to answer the following question(s).
The following decision tree is partially completed for a company that is deciding to
build a large or small facility for a new product that will face demand that is strong or
weak. The company has an option to perform a market survey that will cost $4,000 that
will predict a strong or weak market. The payoffs for each combination of facility size
and demand are also shown.
The probability that the survey result will predict a strong market is ________.
A) 0.30

B) 0.40
C) 0.50
D) 0.60
The following data represent the number of refrigerators sold for each of the past five
months for Templeton Appliances.
Using an exponential smoothing with trend adjustment technique with alpha equal to
0.6 and beta equal to 0.2, the forecasting error for Month 4 is ________.
A) 2.4
B) -5.5
C) -7.9
D) 9.9
The ________ measures a distribution’s standard deviation in terms of its percentage to
the mean.
A) median
B) coefficient of variation
C) variance
D) z-score
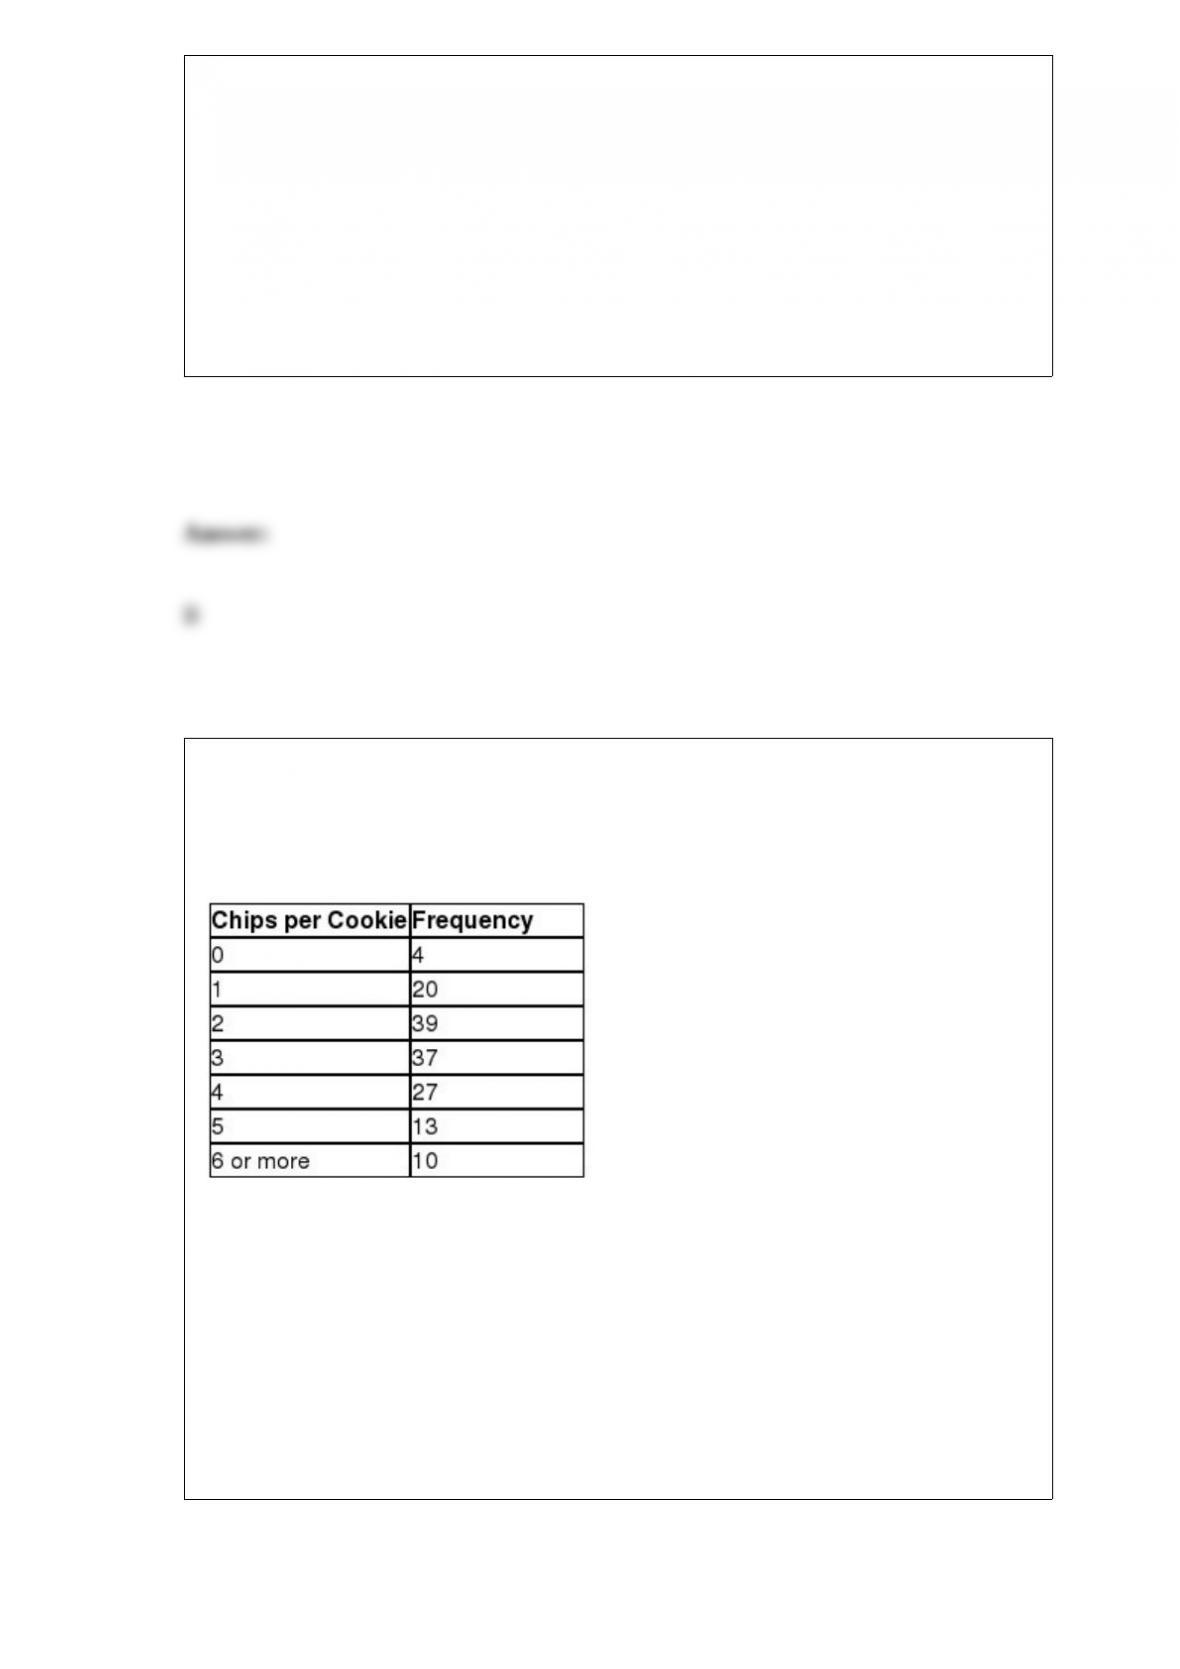
A chocolate chip cookie producer claims that its cookies average 3 chocolate chips and
that the distribution follows the Poisson. A consumer group wanted to test this claim
and randomly sampled 150 cookies. The resulting frequency distribution is shown
below.
The test statistic for this sample is ________.
A) 2.224
B) 4.046
C) 12.660
D) 15.759

Consider the following population which represents the years of teaching experience of
the 24 full-time business faculty at Wesley College.
Using the first row of data as a sample, the sampling error is ________.
A) -1.20
B) 0.80
C) -0.50
D) 1.40
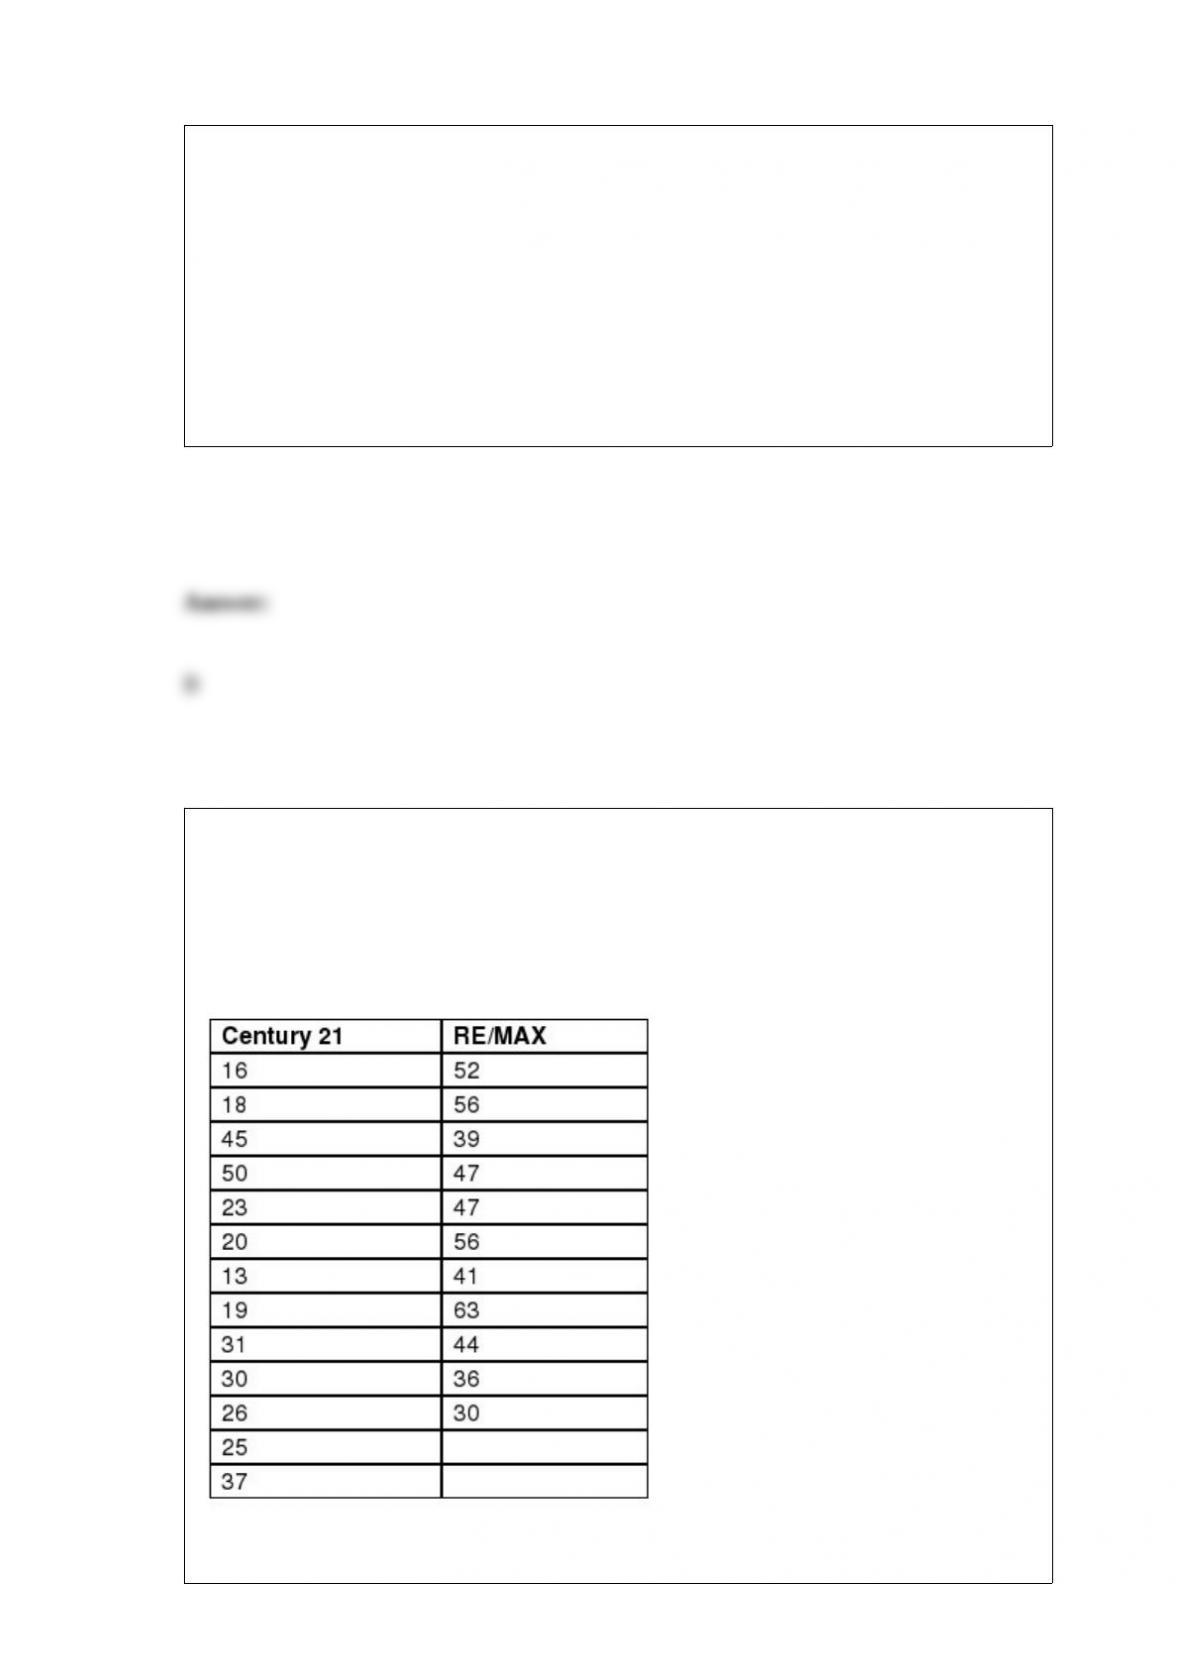
Two real estate companies, Century 21 and RE/MAX, compete with one another in a
local market. The manager of the Century 21 office would like to advertise that homes
listed with RE/MAX average more than 10 days on the market when compared to
homes listed with his company. The following data shows the sample size and average
number of days on the market for the two companies along with the population standard
deviations.
If Population 1 is defined as RE/MAX and Population 2 is defined as Century 21, the
standard error of the difference between two means for this hypothesis test would be
________.
A) 4.17
B) 8.32
C) 10.69
D) 13.55
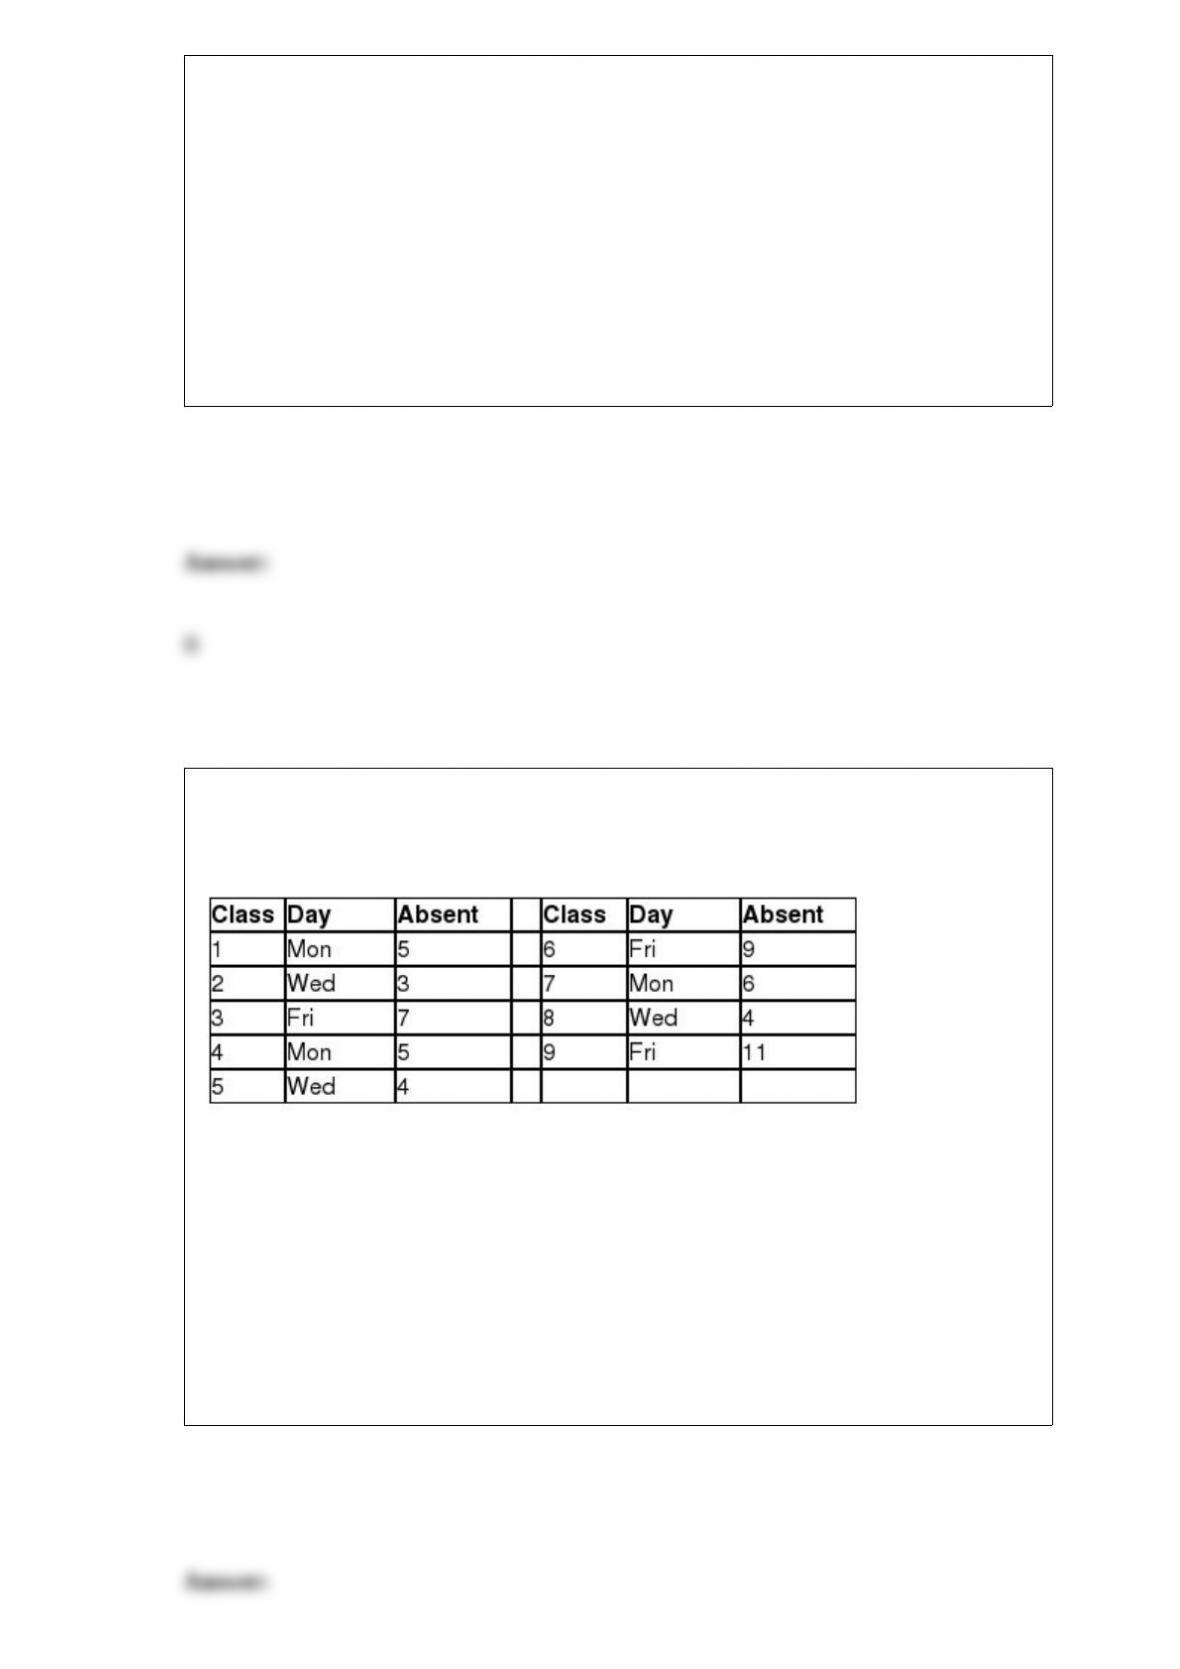
A large statistics class meets on Monday, Wednesday, and Friday each week during the
semester. The following data shows the number of absent students for the last nine
classes.
The slope for the deseasonalized trend projection is ________.
A) 0.3117
B) 0.8554
C) 1.1660
D) 1.5396
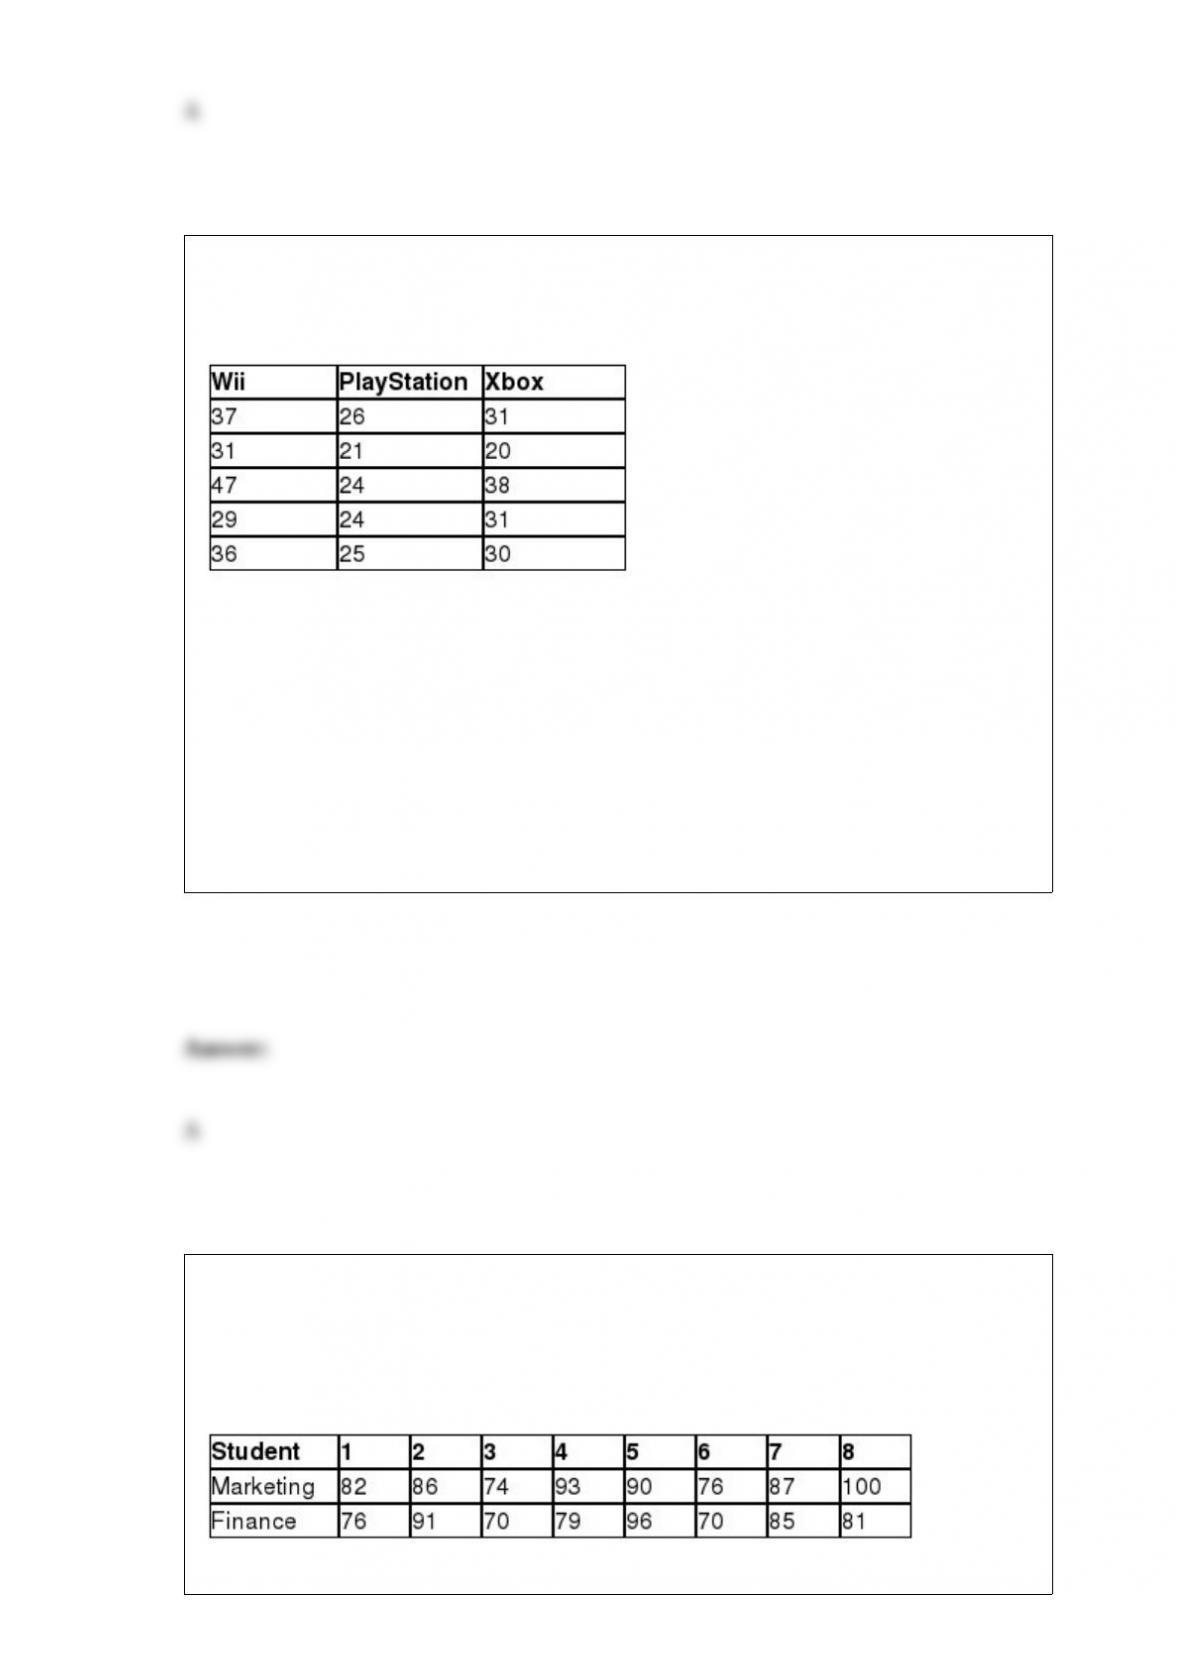
Nintendo Sony would like to test the hypothesis that a difference exists in the average
age of users of a Wii, a PlayStation, or an Xbox console game. The following data
represent the age of a random sample of Wii, PlayStation, and Xbox users.
The mean squares within for these observations is ________.
A) 31.3
B) 107.0
C) 181.4
D) 232.6
The Dean of the Business School at State University would like to test the hypothesis
that no difference exists between the average final exam grades for the Introduction to
Marketing course and the Introduction to Finance course. A random sample of eight
students who took both courses was selected and their final exam grades for each
course are shown below.

If Population 1 is defined as the Marketing exam scores and Population 2 is defined as
the Finance exam scores, and using α = 0.05, the conclusion for this hypothesis test
would be that because the test statistic is
_______________________________________________________.
A) less than the critical value, we can conclude that no difference exists between the
average final exam grades for the Introduction to Marketing course and the Introduction
to Finance course
B) less than the critical value, we cannot conclude that a difference exists between the
average final exam grades for the Introduction to Marketing course and the Introduction
to Finance course
C) more than the critical value, we cannot conclude that a difference exists between the
average final exam grades for the Introduction to Marketing course and the Introduction
to Finance course
D) more than the critical value, we can conclude that a difference exists between the
average final exam grades for the Introduction to Marketing course and the Introduction
to Finance course
State University offers several sections of a Business Statistics course in an in-class and
online format. Both formats are administered the same final exam each year. You have
been assigned to test the hypothesis that the average final exam score of in-class
students is different from the average final exam score of online students. The following
data summarizes the sample statistics for the final exam scores for students from each
format. Assume that the population variances are unequal.
If Population 1 is defined as in-class format and Population 2 is defined as online
format, and using α = 0.05, the critical value for this hypothesis test would be
________.
A) 2.086
B) 2.052
C) 2.015
D) 2.000
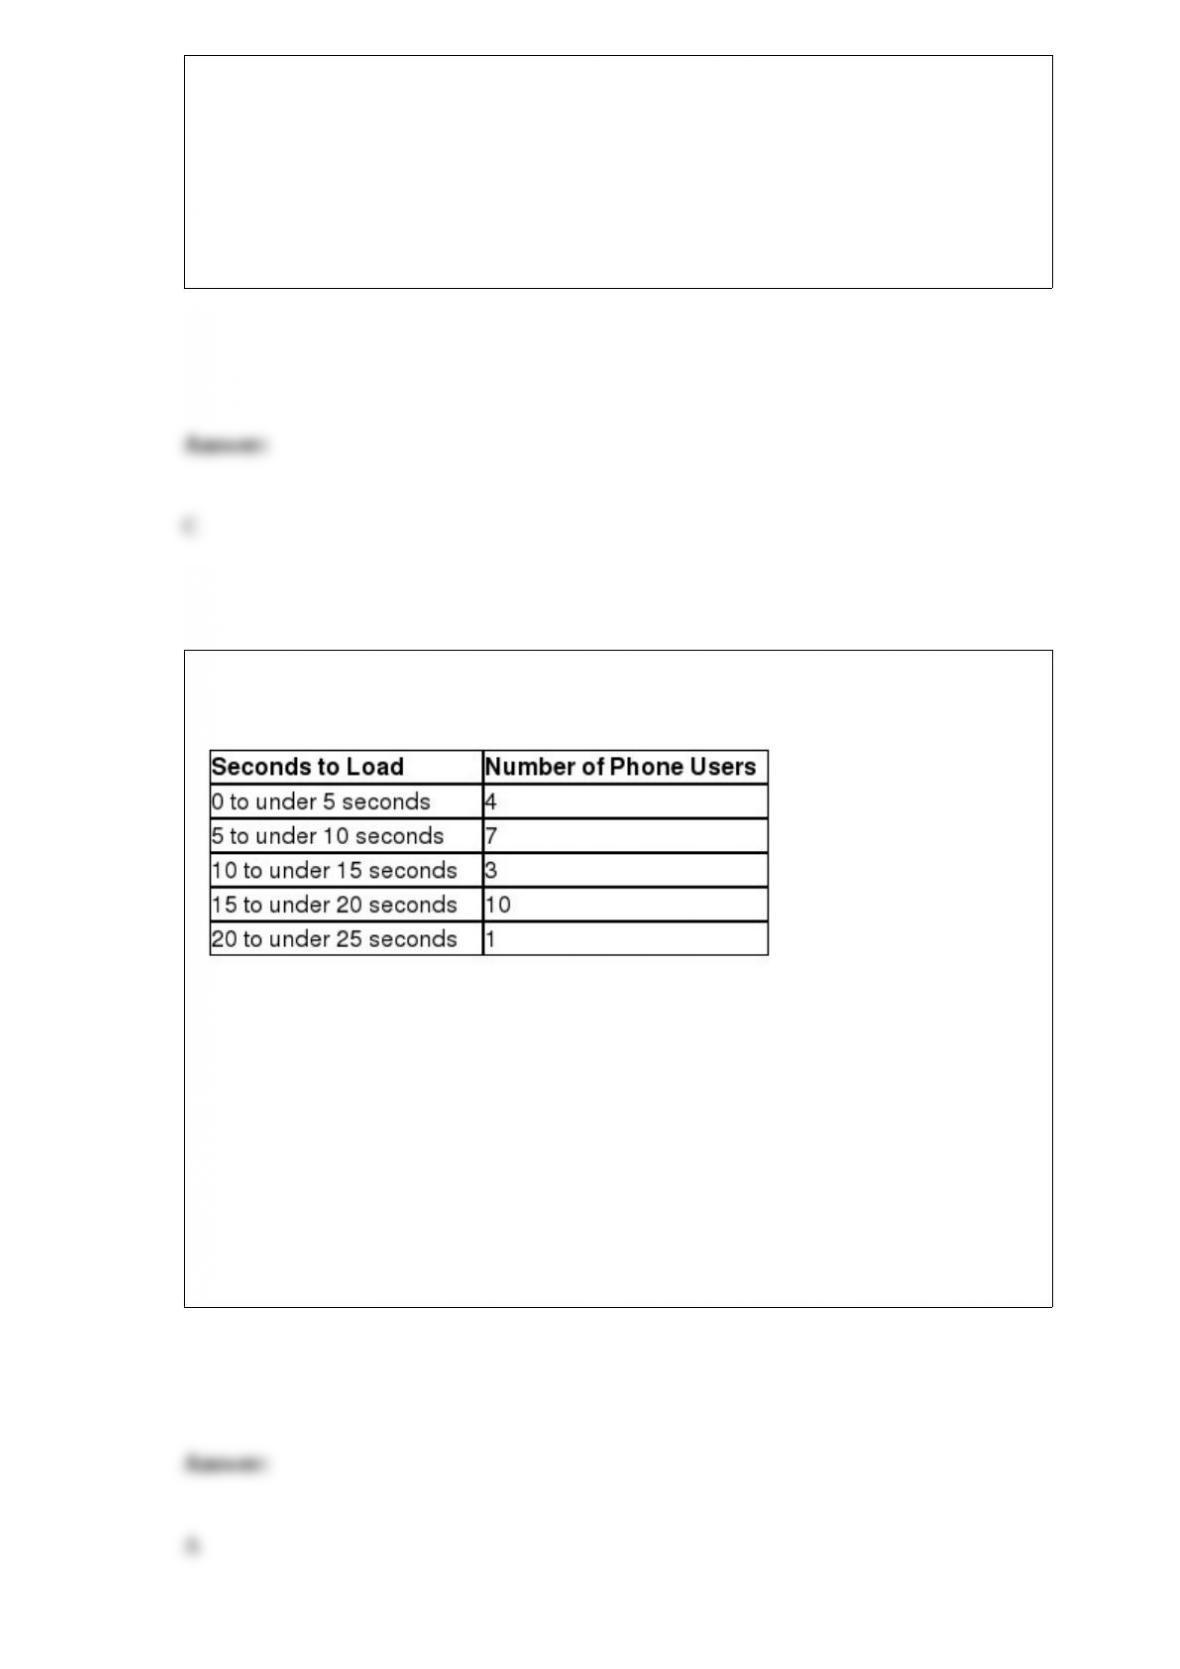
The following table represents the number of seconds that a particular web page took to
load on an iPhone for 25 users along with the frequency in each class.
What is the approximate average number of seconds that this web page took to load on
the iPhone?
A) 11.9
B) 12.5
C) 13.7
D) 15.0
The ________ identifies the number of standard deviations a particular value is from
the mean of its distribution.
A) coefficient of variation
B) z-score
C) median
D) empirical rule
The Chamber of Commerce for a small city would like to test the hypothesis that the
median number of days that a residential home is listed on the real estate market for
Century 21 is different than the median number of days for a house listed by RE/MAX.
The following data shows the number of days a random sample of homes listed by each
realtor.
Using α = 0.10, which one of the following statements is true?

A) Because the absolute value of the test statistic is greater than the absolute value of
the critical value, we cannot conclude that there is a difference in the median number of
days homes are on the market between these two realtors.
B) Because the absolute value of the test statistic is greater than the absolute value of
the critical value, we conclude that there is a difference in the median number of days
homes are on the market between these two realtors.
C) Because the absolute value of the test statistic is less than the absolute value of the
critical value, we cannot conclude that there is a difference in the median number of
days homes are on the market between these two realtors.
D) Because the absolute value of the test statistic is less than the absolute value of the
critical value, we conclude that there is a difference in the median number of days
homes are on the market between these two realtors.
The ________ is the most common and most important measure of variability in the
field of statistics.
A) range
B) variance
C) median
D) standard deviation
Use the information below to answer the following question(s).
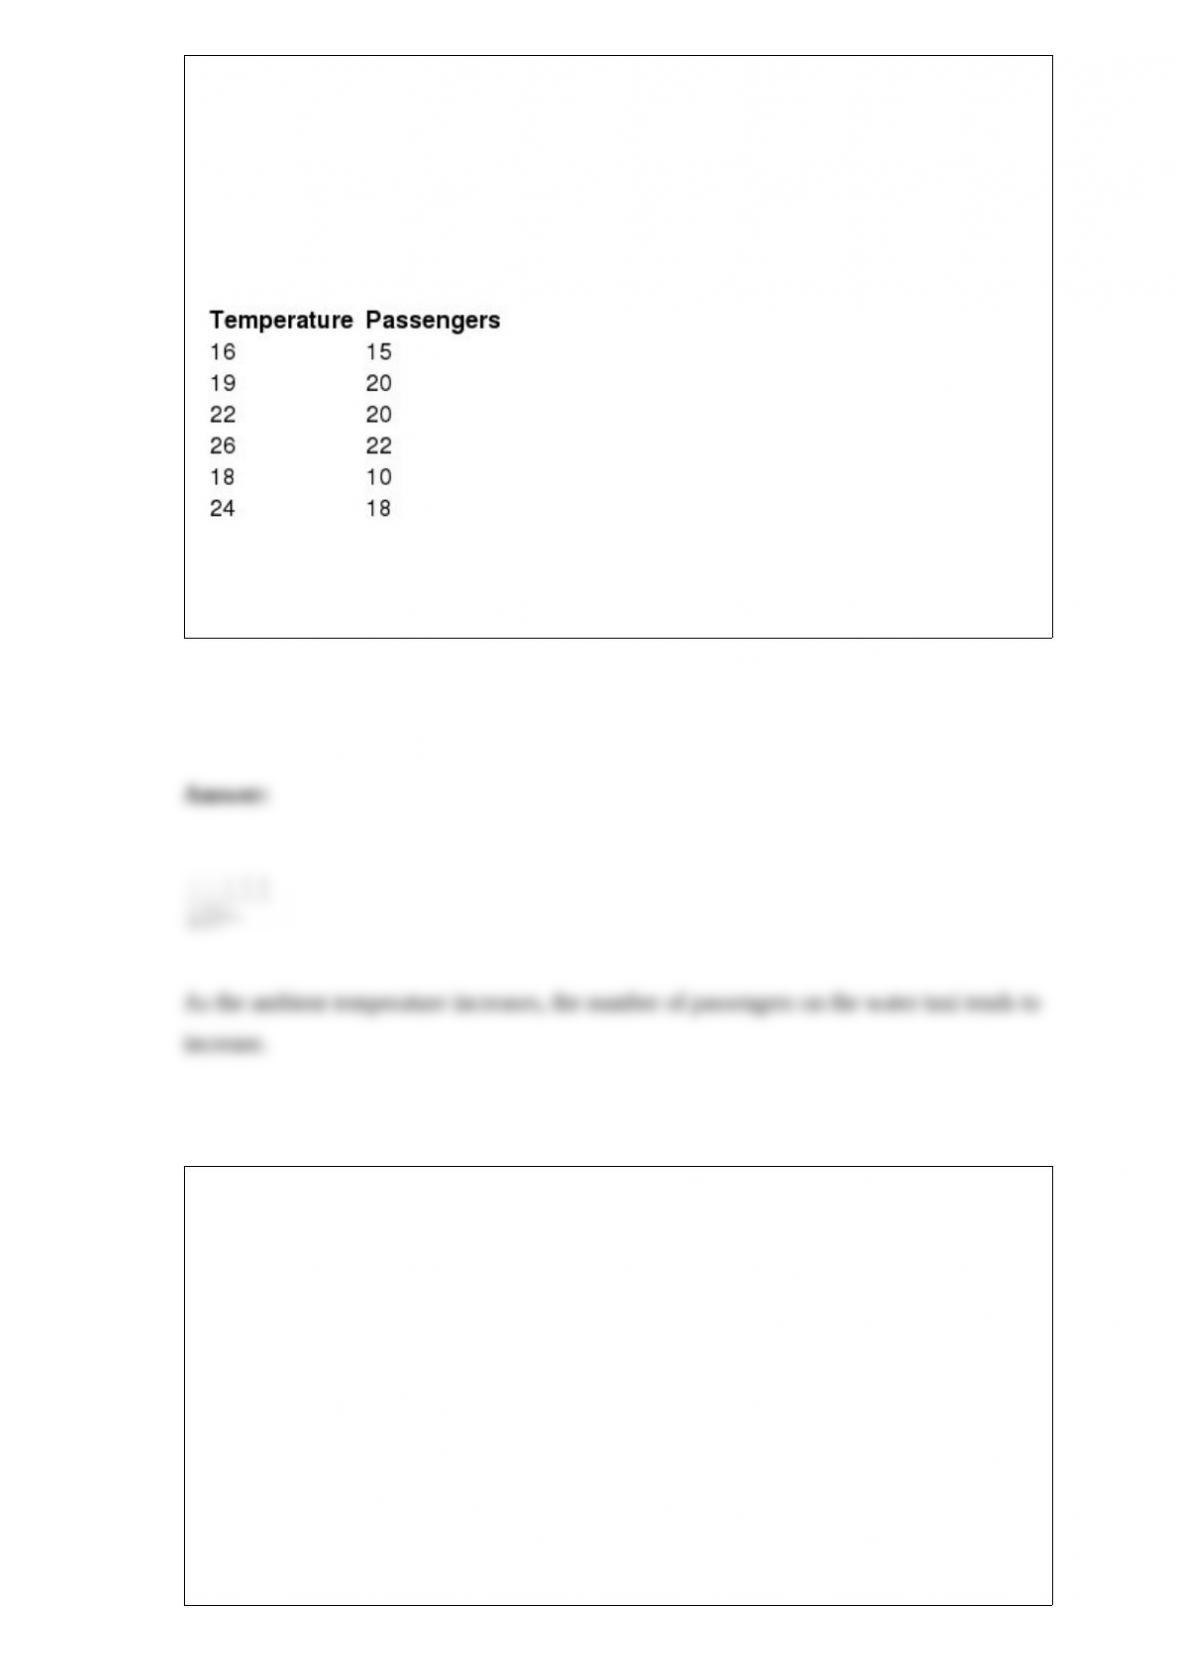
The Marseille Water Taxi ferries tourists from the harbor at Marseille, France, to the
Frioul Islands in the Mediterranean Sea. The table below shows the number of
passengers on the noontime ferry over seven randomly selected days along with the
current ambient temperature in degrees Celsius.
Use the Marseille Water Taxi data to determine the correlation coefficient for this data
and interpret its meaning.
AT&T would like to test the hypothesis that the proportion of 18- to 34-year-old
Americans that own a cell phone is less than the proportion of 35- to 49-year-old
Americans. A random sample of 200 18- to 34-year-old Americans found that 126
owned a smartphone. A random sample of 175 35- to 49-year-old Americans found that
119 owned a smartphone. If Population 1 is defined as 18- to 34-year-old Americans
and Population 2 is defined as 35- to 49-year-old Americans, and using α = 0.01, the
critical value for this hypothesis test would be ________.
A) 2.575
B) 2.33
C) 1.96

D) 1.645