Data gathered from a structured interview is generally easier to analyze than data
collected from an unstructured interview.
In estimating a population mean, a large sample size is generally preferable to a small
sample size because the margin of error is generally smaller.
The critical value for a Kruskal Wallis test is an F value from the F-distribution.
A tire store manager has collected data showing the number of tires of each brand sold
during the past month. A bar chart might be effective in graphically illustrating which
brands tend to sell best at this store.

A recent study involving a sample of 3,000 vehicles in California showed the following
statistics related to the number of miles driven per day: Q1 = 12, Q2 = 45, and Q3 = 56.
Based on these data, if a box and whisker plot is developed, the upper limit value is 122
miles.
Assume that n = 18 people are asked a yes/no survey question, and 6 people say “yes”
while 12 people say “no.” Based on this information the sample proportion can be
assumed normally distributed.
When the best subsets approach is used in a regression application, one method for
determining which of the many possible models to select for potential use is called the
Cp statistic.
A major automobile maker has two models of sedans. The first model has been shown
to get an average of 27 mpg on the highway with a standard deviation equal to 5 mpg.
The second model gets 33 mpg on average with a standard deviation of 8 mpg. Based
on this information the first car model is relatively more variable than the second car
model.
Data are considered to be right-skewed when the mean lies to the right of the median.
If the Viking Sales Company plans to display the sales for each of its six major products
for the year 2001, an effective chart to do this would be a histogram.
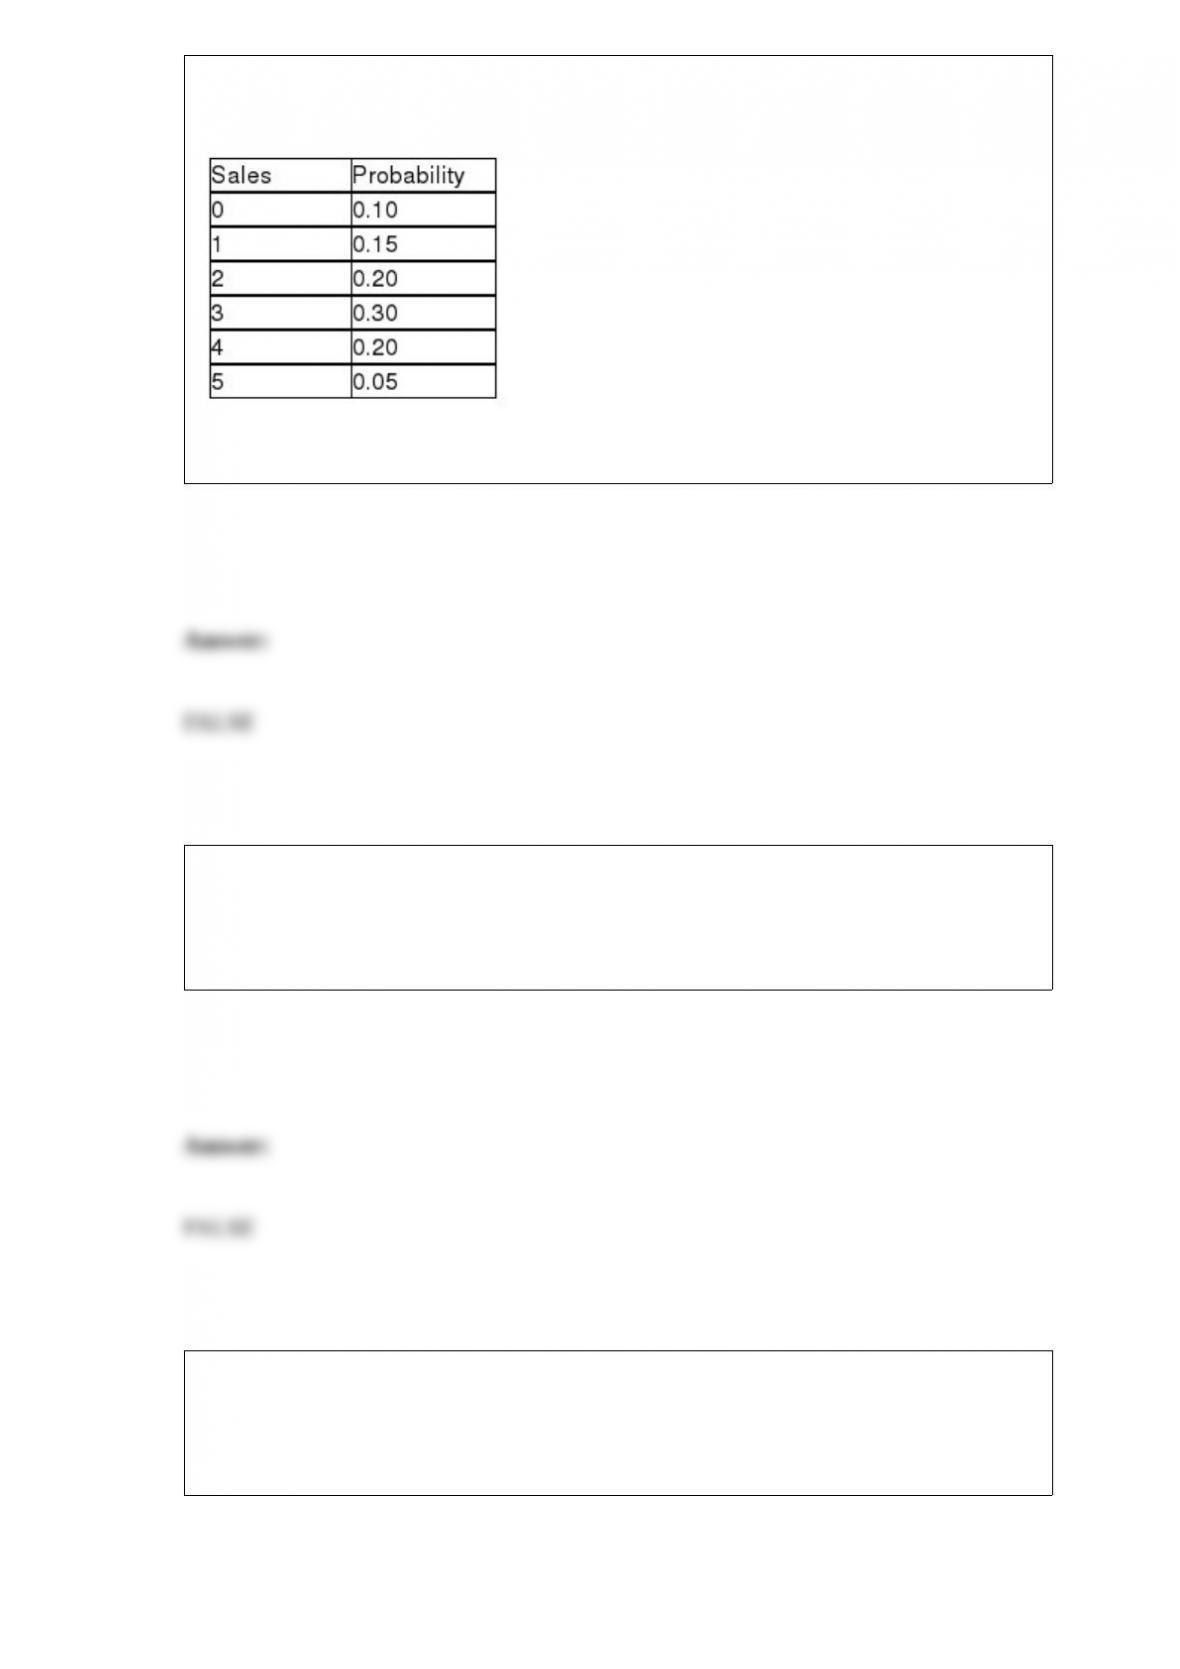
The following probability distribution was subjectively assessed for the number of sales
a salesperson would make if he or she made five sales calls in one day.
Given this distribution, the probability that the number of sales is less than 2 is 0.15.
The distribution of bankcard balances for customers is highly right-skewed with a mean
of $1,100 and a standard deviation equal to $250. Based on this information,
approximately 68 percent of the customers will have bank balances between $850 and
$1,350.
The city council consists of 3 Democrats, 5 Republicans and 3 independents.
Subcommittees are supposed to be randomly assigned from the council. Suppose the
5-member planning and zoning subcommittee is composed of 3 Democrats and 2
Republicans. The probability of this happening by chance alone is approximately .4545.

The procedure of the Wilcoxon signed rank test is the same for either small or large
sample sizes.
Service time for customers at a drive-through coffee shop has been shown to be
uniformly distributed between 2 and 10 minutes. Customers will complain when service
time exceeds 7.5 minutes. Based on this information, the probability of getting a
complaint based on service time is 0.3125.
The test statistic that is used when testing a null hypothesis for a population variance is
the standard normal z-value.
The actual mean fill volume for all bottles of a soft drink product that were filled on a
Tuesday is 11.998 ounces. A sample of 64 bottles was randomly selected and the sample
mean fill volume was 12.004 ounces. Based upon this information, the sampling error is
.006 ounce.
In a second-order polynomial regression model, the regression coefficient, B2, will be
positive if the parabola opens downward and negative when the parabola opens upward.
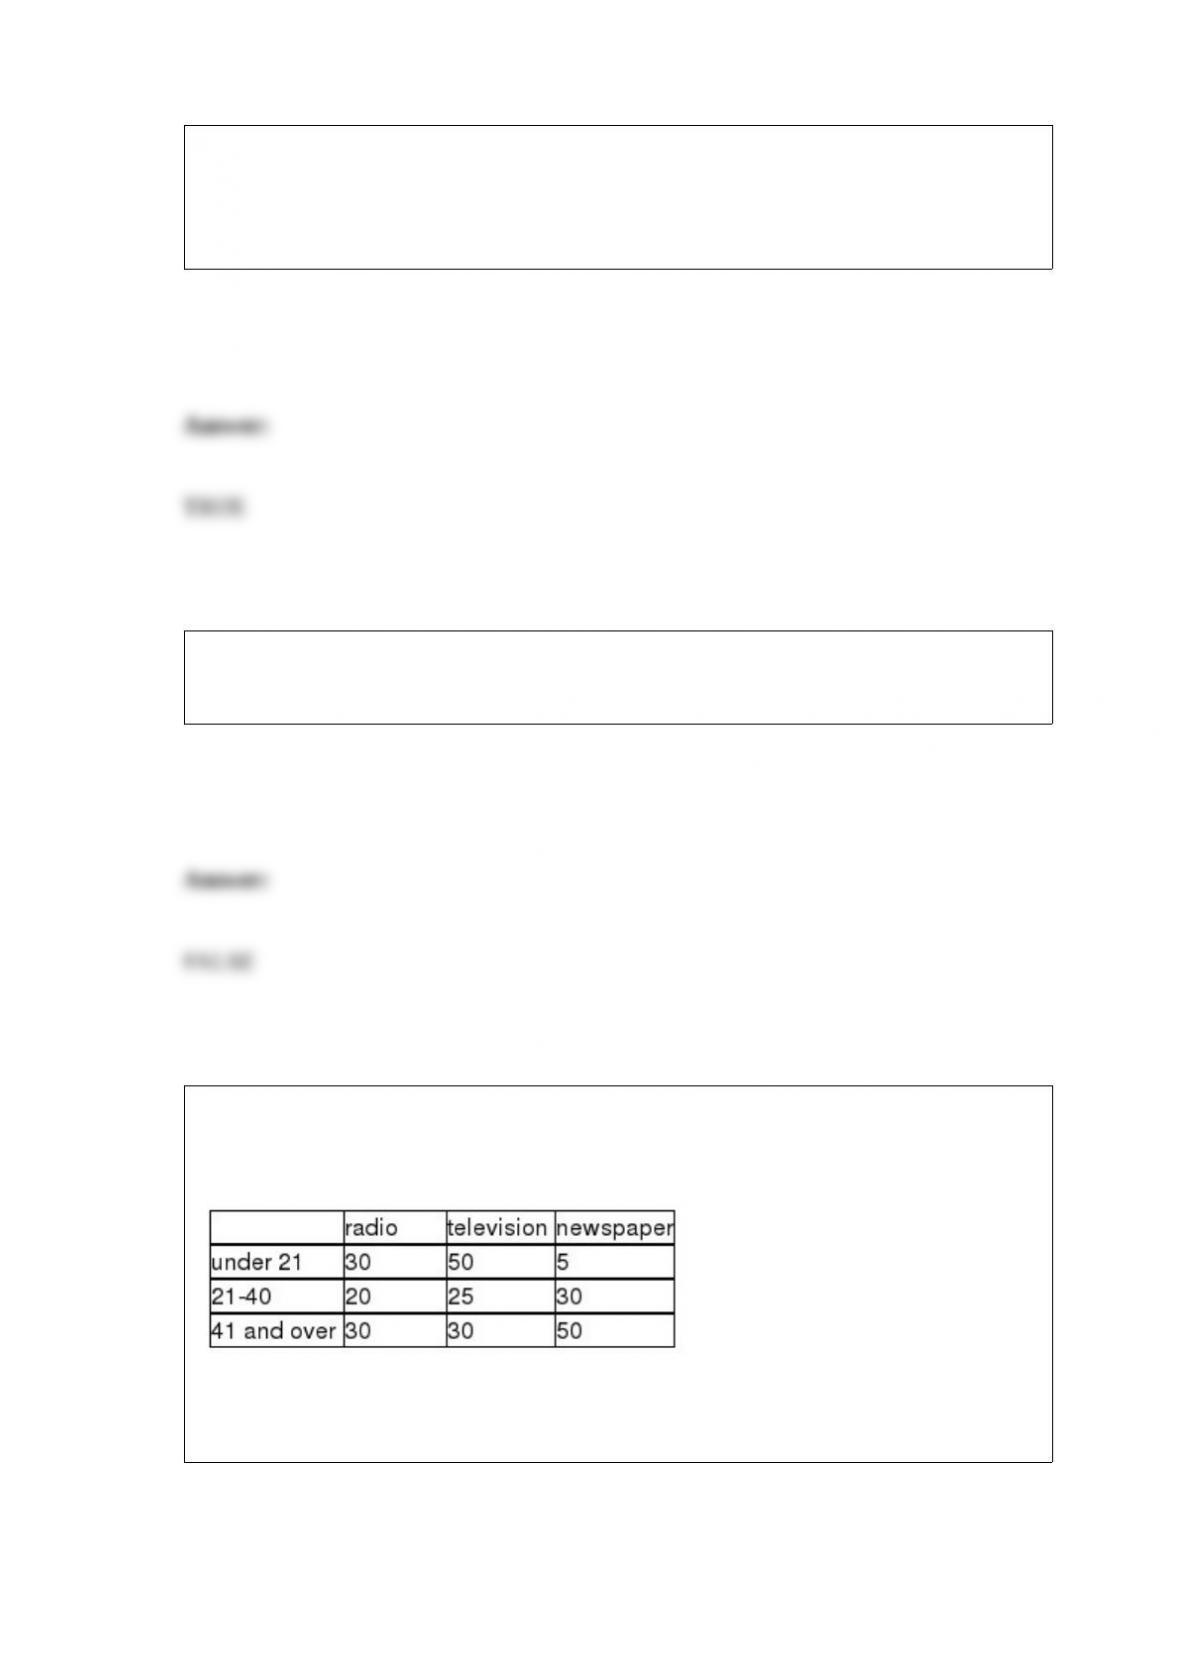
A study was recently conducted in which people were asked to indicate which news
medium was their preferred choice for national news. The following data were
observed:
Given this data, if we wish to test whether the preferred news source is independent of
age, for an alpha = .05 level, the critical value from the chi-square table is 9.4877.
The interquartile range is the difference between the mean and the median.
Multicollinearity occurs when one or more independent variables is highly correlated
with the dependent variable.
When estimating sample size, a 90 percent confidence level will result in a smaller
sample size than a 95 percent confidence level.
If it is known that a simple linear regression model explains 56 percent of the variation
in the dependent variable and that the slope on the regression equation is negative, then
we also know that the correlation between x and y is approximately -0.75.
To test whether Model A and Model B cars have the same MPG, the first step is to
select two independent random samples of drivers and assign one of them to drive
Model A and the other Model B.
Questions on a written survey dealing with the characteristics of the respondent (age,
income, etc.) are referred to as categorical questions.
The distribution for the number of emergency calls to a city’s 911 emergency number in
a one-hour time period is likely to be described by a binomial distribution.

If a decision maker believes that the population is normally distributed and the data are
known to be ratio level, then the either the t-test or the Wilcoxon signed rank test can be
used to test null hypotheses about a single population mean.
In developing a simple linear regression model it is assumed that the distribution of
error terms will be normally distributed for all levels of x.
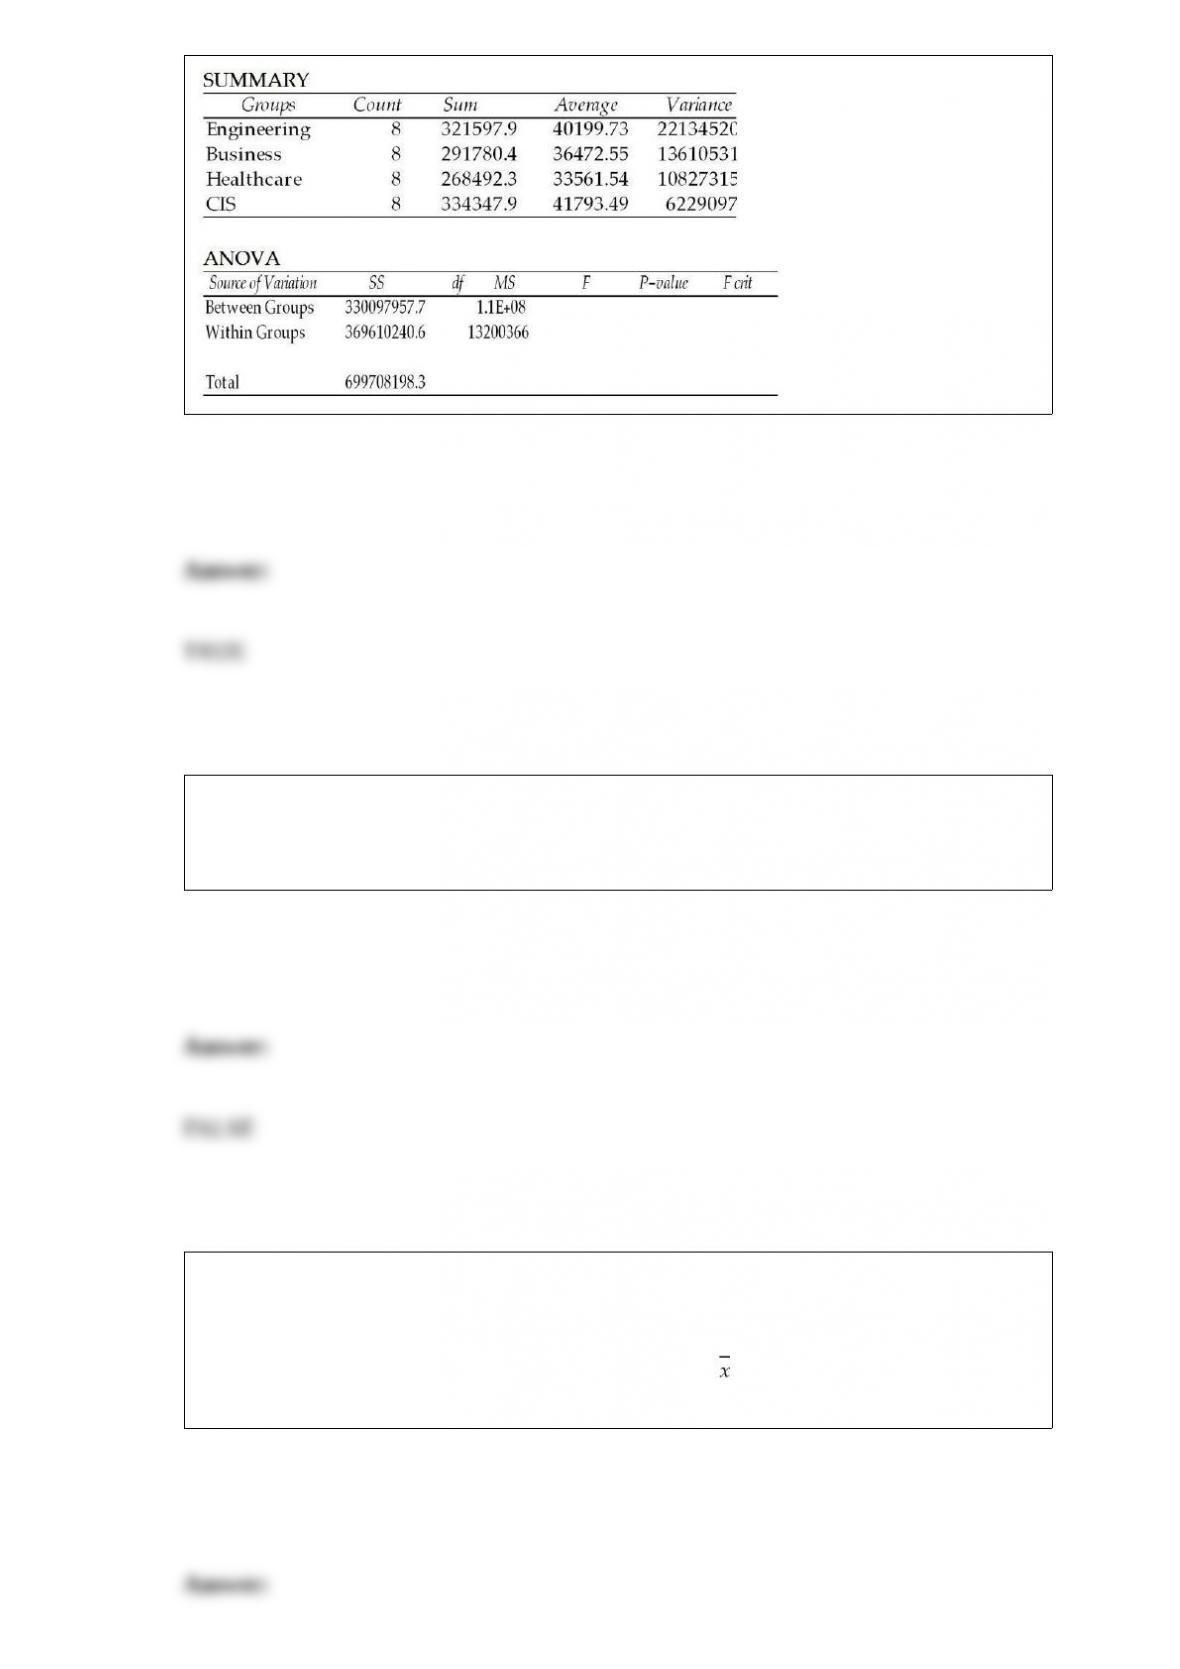
A study was recently conducted to see whether the mean starting salaries for graduates
of engineering, business, healthcare, and computer information systems majors differ. A
random sample of 8 graduates was selected from each major. The following shows the
results of the ANOVA computations. However, the degrees of freedom column has been
omitted. The correct number of degrees of freedom for the within variation is 28.
ANOVA: Single Factor
If the sample size is large, the standard normal distribution can be used in place of the
chi-square in a goodness-of-fit test for testing whether the population is normally
distributed.
The loan manager for State Bank and Trust has claimed that the mean loan balance on
outstanding loans at the bank is over $14,500. To test this at a significance level of 0.05,
a random sample of n = 100 loan accounts is selected. Assuming that the population
standard deviation is known to be $3,000, the value of that corresponds to the critical
value is approximately $14,993.50.

If two events are mutually exclusive, it is possible for them to also be independent of
each other.
In conducting a hypothesis test for a correlation, the correct probability distribution to
use is the F distribution.
Common cause variation is variation in the output of a process that is unexpected and
has an assignable cause.
A grocery store is interested in determining whether its customers are satisfied with the
quality of service provided. To collect the necessary data, interviewers have been hired
to stand near the store’s exits and to survey customers who have the time and interest to
be surveyed. This type of sampling is called:
A) systematic random sampling.
B) ratio sampling.
C) convenience sampling.
D) stratified sampling.
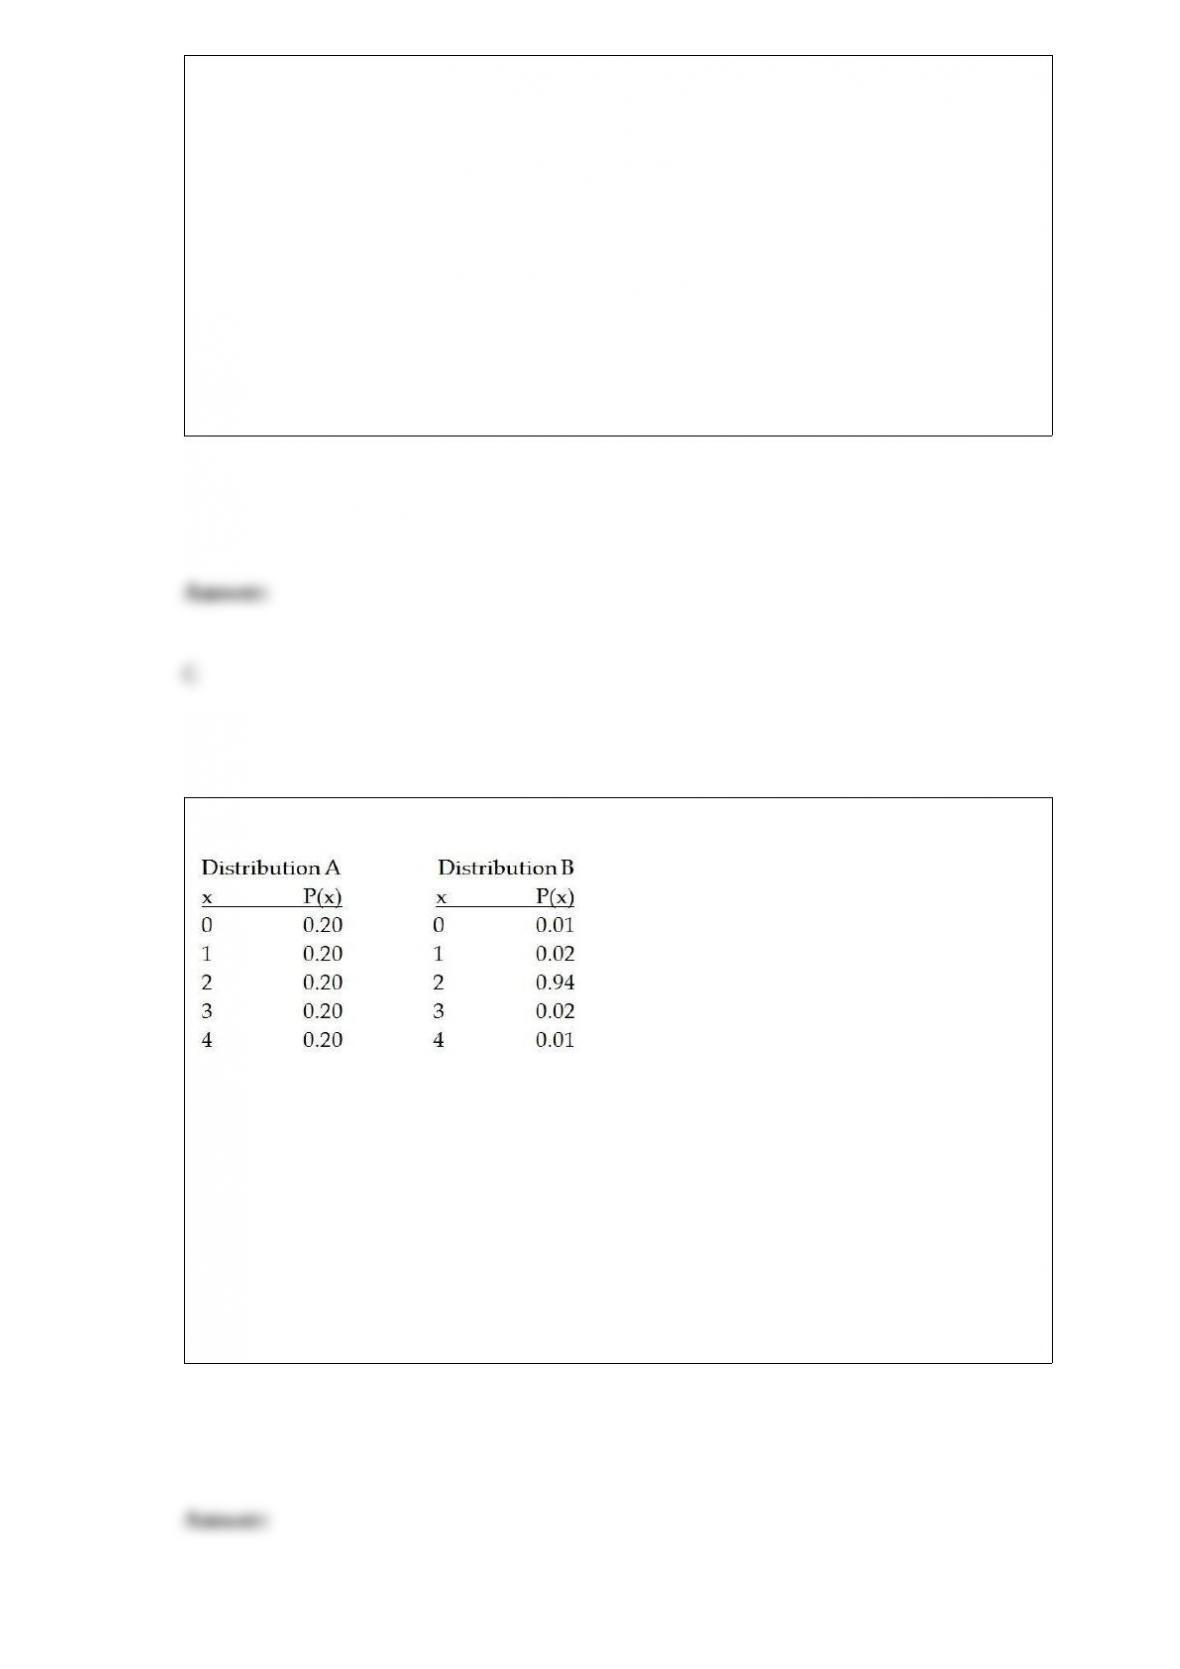
Consider the following two probability distributions:
Which of the following is an accurate statement regarding these two distributions?
A) Distribution A has a higher variance.
B) Distribution B has a higher variance.
C) Both distributions are positively skewed.
D) Both distributions are uniform.

A political poll that is used to indicate the percentage of voters who will vote for a
particular candidate makes use of which of the following?
A) Hypothesis testing
B) Numerical analysis
C) Estimation
D) Both B and C
College-Pro Painting does home interior and exterior painting. The company uses
inexperienced painters that do not always do a high-quality job. It believes that its
painting process can be described by a Poisson distribution with an average of 4.8
defects per 400 square feet of painting.
What is the probability that six randomly sampled sections of size 400 square feet will
each have 7 or fewer blemishes?
A) 0.2818
B) 0.3414
C) 0.4857
D) 0.6509

Suppose the life of a particular brand of calculator battery is approximately normally
distributed with a mean of 75 hours and a standard deviation of 10 hours. What is the
probability that 16 randomly sampled batteries from the population will have a sample
mean life of between 70 and 80 hours?
A) 0.9444
B) 0.5121
C) 0.7124
D) 0.1512
A regression analysis between sales (Y) and advertising (X) (both in dollars) resulted in
the following equation:
= 100 + 2000X
The above equation implies that an
A) increase of $1 in advertising is correlated with an increase of $2,000 in sales.
B) increase of $1 in advertising is correlated with an increase of $2 in sales.
C) increase of $1 in advertising is correlated with an increase of $100 in sales.
D) increase of $1 in advertising is correlated with an increase of $2100 in sales.
A real estate broker claims that the median days that one of his listings stays on the
market is 45 or less days. To test this, he has collected the following random sample of
properties sold showing the days they were on the market prior to selling:
Days
50
30
70
20
30
40
60
80
The broker is unwilling to assume that the population data are normally distributed.
a. What is the correct null and alternative hypothesis to be tested?
b. What statistical test would you recommend be used to test this hypothesis?
c. Conduct the test and indicate what conclusion should be reached if we test at an alpha
= .05 level?


The sales manager at Western Furniture Company tracked data on the number of
customers who came into the store each day and the total dollar volume of sales at the
store during the same day. She is considering putting together a report for top
management and wishes to show the relationship between these two variables. Which
of the following graphs would likely be most useful? She has a sample of 36 days worth
of data.
A) Scatter diagram
B) Bar chart
C) Frequency histogram
D) Pie chart
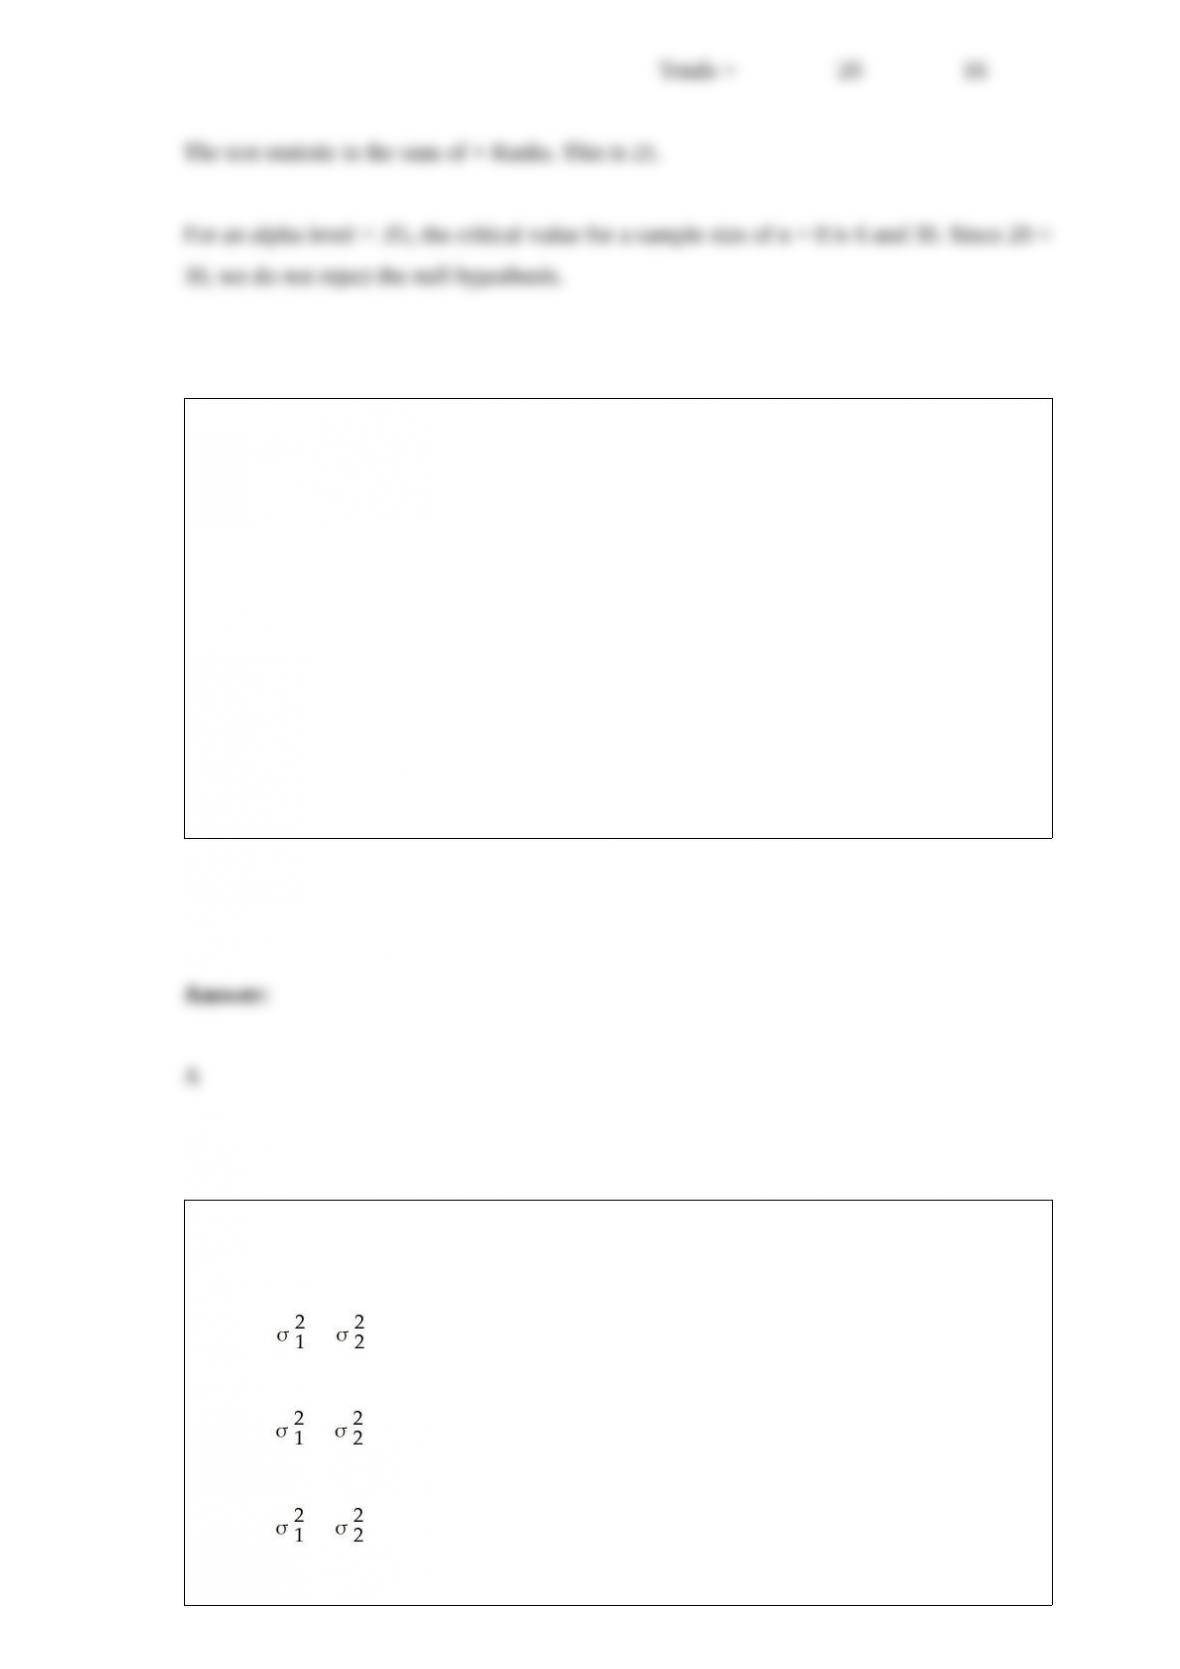
Which of the following is the appropriate null hypothesis when testing whether two
population variances are equal?
A) H0 : =
B) H0 : ≠
C) H0 : >

D) H0 : ≥
A large retail company gives an employment screening test to all prospective
employees. Franklin Gilman recently took the test and it was reported back to him that
his score placed him at the 80th percentile. Therefore:
A) 80 people who took the test scored below Franklin.
B) Franklin scored as high or higher than 80 percent of the people who took the test.
C) Franklin was in the bottom 20 percent of those that have taken the test.
D) Franklin’s score has a z-score of 80.
Waiters at Finegold’s Restaurant and Lounge earn most of their income from tips. Each
waiter is required to “tip-out” a portion of tips to the table bussers and hostesses. The
manager has based the “tip-out” rate on the assumption that the mean tip is at least 15%
of the customer bill. To make sure that this is the correct assumption, he has decided to
conduct a test by randomly sampling 60 bills and recording the actual tips.
Calculate the probability of a Type II error if the true mean is 14%. Assume that the
population standard deviation is known to be 2% and that a significance level equal to
0.01 will be used to conduct the hypothesis test.
A) 0.0041

B) 0.1251
C) 0.0606
D) 0.4123
Which of the following statements is true with respect to the t-distribution?
A) The t-distribution is symmetrical.
B) The exact shape of the t-distribution depends on the number of degrees of freedom.
C) The t-distribution is more spread out than the standard normal distribution.
D) All of the above are true.
A walk-in medical clinic believes that arrivals are uniformly distributed over weekdays
(Monday through Friday). It has collected the following data based on a random sample
of 100 days.
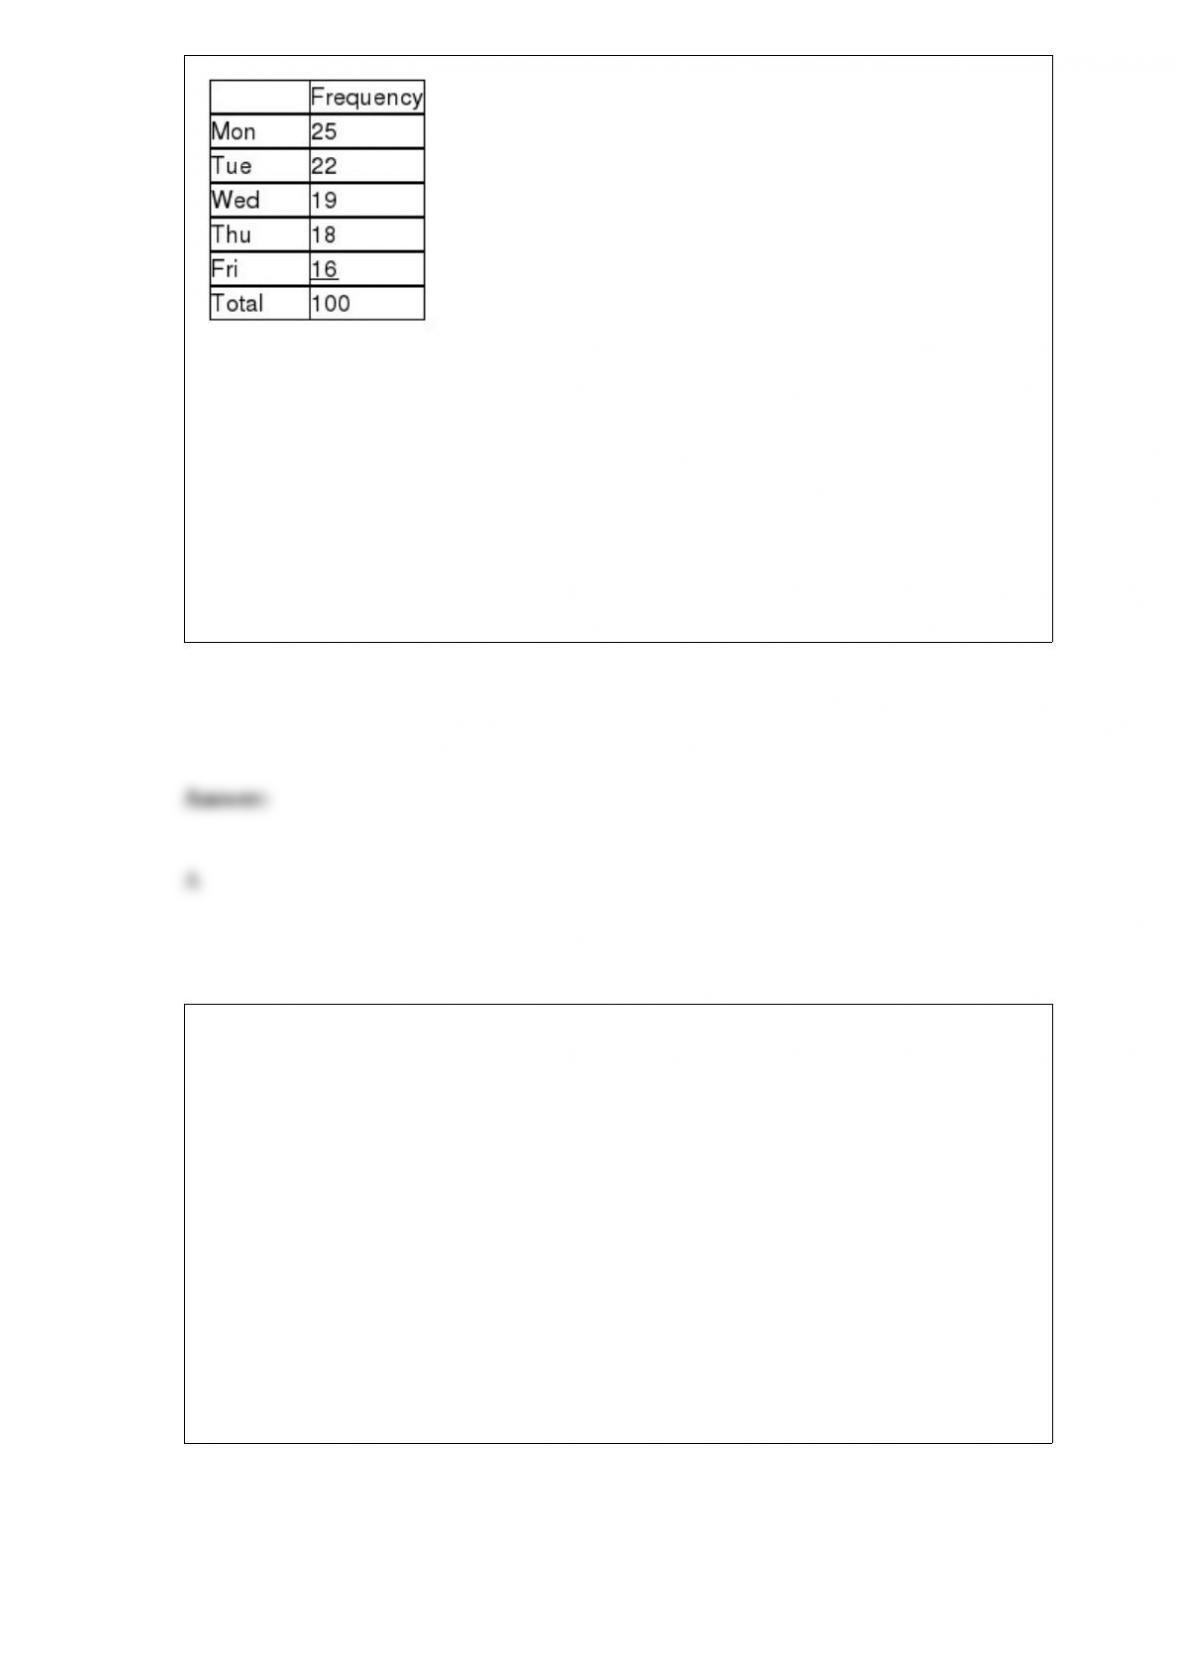
To conduct a goodness-of-fit test, what is the expected value for Friday?
A) 20
B) 25
C) 16
D) 100
The Hilbert Drug Store owner plans to survey a random sample of his customers with
the objective of estimating the mean dollars spent on pharmaceutical products during
the past three months. He has assumed that the population standard deviation is known
to be $15.50. Given this information, what would be the required sample size to
estimate the population mean with 95 percent confidence and a margin of error of
$2.00?
A) 231
B) 163
C) 16
D) 15
A measure computed from the entire population is called:
A) a statistic.
B) a mean.
C) a parameter.
D) a qualitative value.
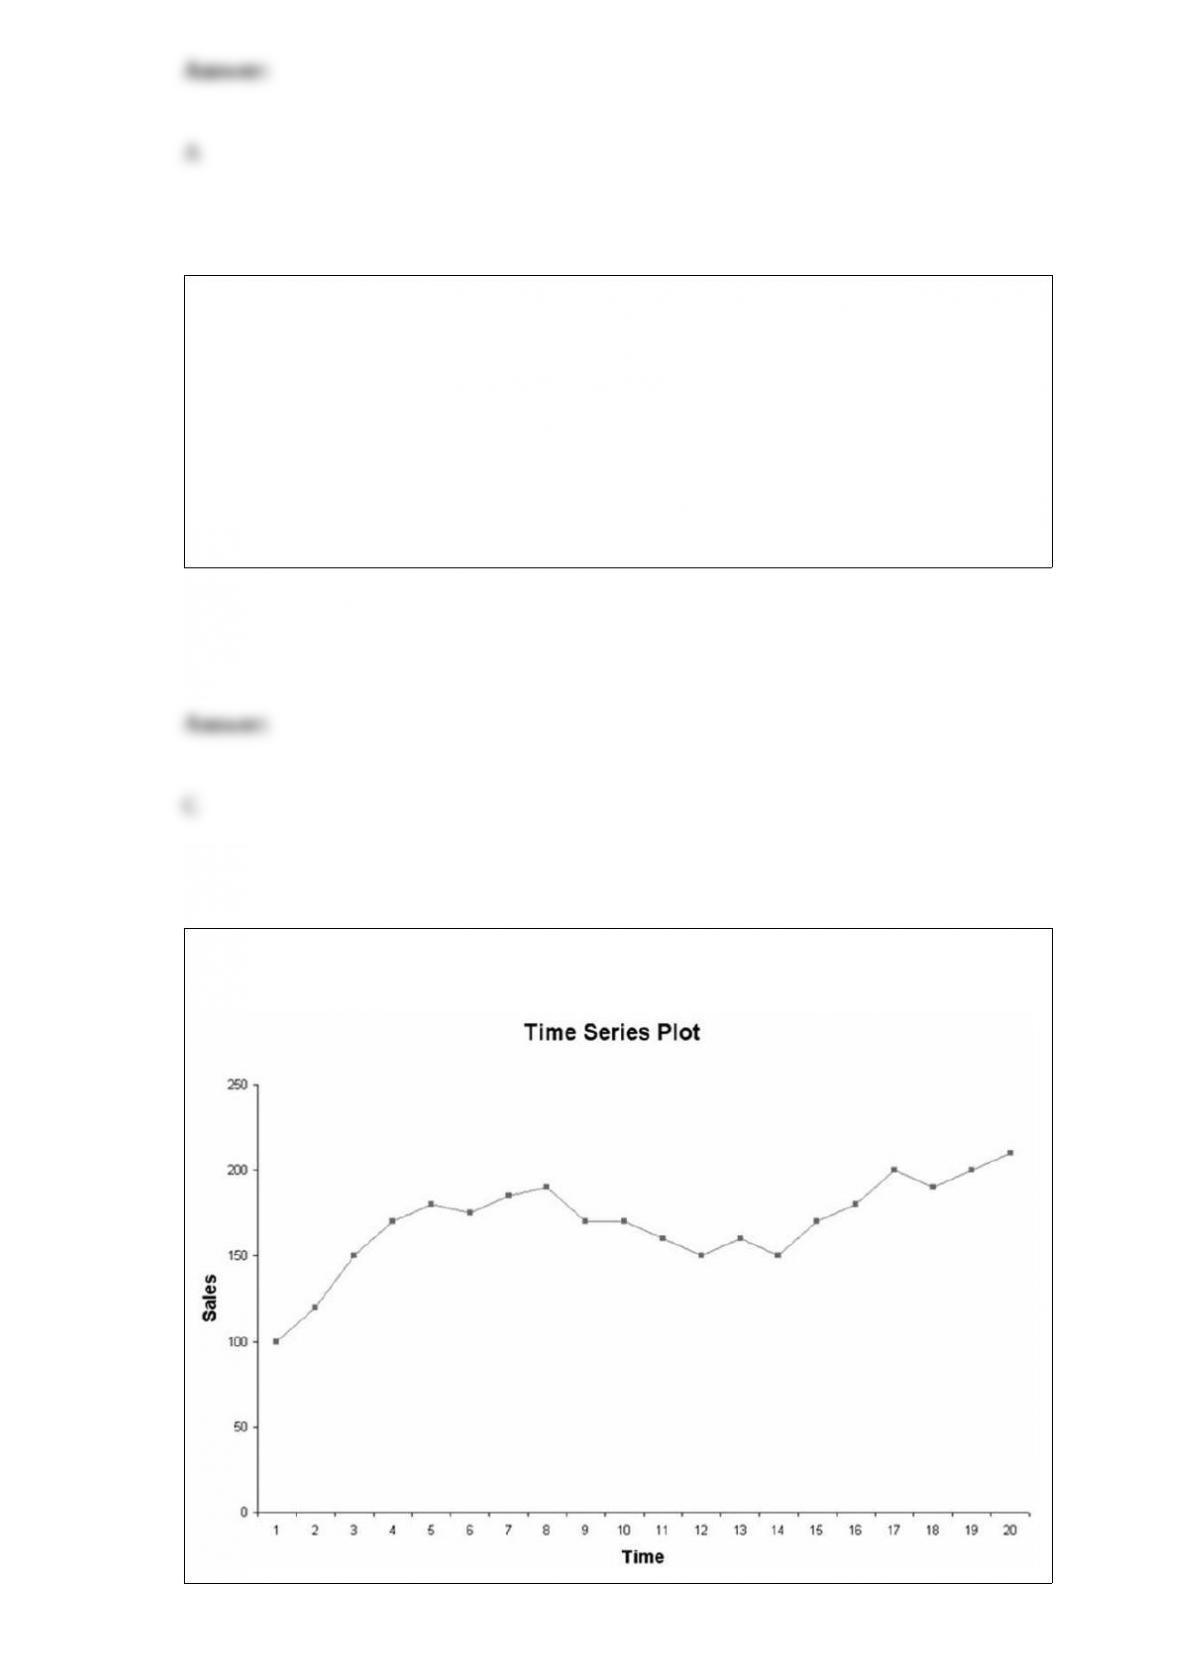
Assume that a time-series plot takes the form of that shown in the following graph:

Given this plot, which of the following models would likely give the best fit?
A) = b0b1 + b1t
B) = b0 + b1t + b1t2 + b1t3
C) = b0 + b1t + b1t2
D) = b0 + b1t + b1t2 + b3t3 + b4t4
A stem and leaf diagram is used to:
A) display the distribution of a quantitative variable.
B) show the joint relationship between two variables.
C) graph a joint frequency distribution.
D) show relative cumulative frequency.
Which of the following is a key difference between a bar chart and a histogram?
A) A bar chart typically has gaps between the bars while a histogram has no gaps.

B) A bar chart is developed to analyze a continuous variable, while a histogram is used
to analyze discrete variables.
C) Both A and B are correct.
D) There is actually no real difference between a bar chart and a histogram.
A professor hands out survey forms during her classes, where the population is all
students attending the college. This is an example of:
A) a convenience sample.
B) a simple random sample.
C) a stratified sample.
D) a cluster sample.
State University recently randomly sampled ten students and analyzed grade point
average (GPA) and number of hours worked off-campus per week. The following data
were observed:
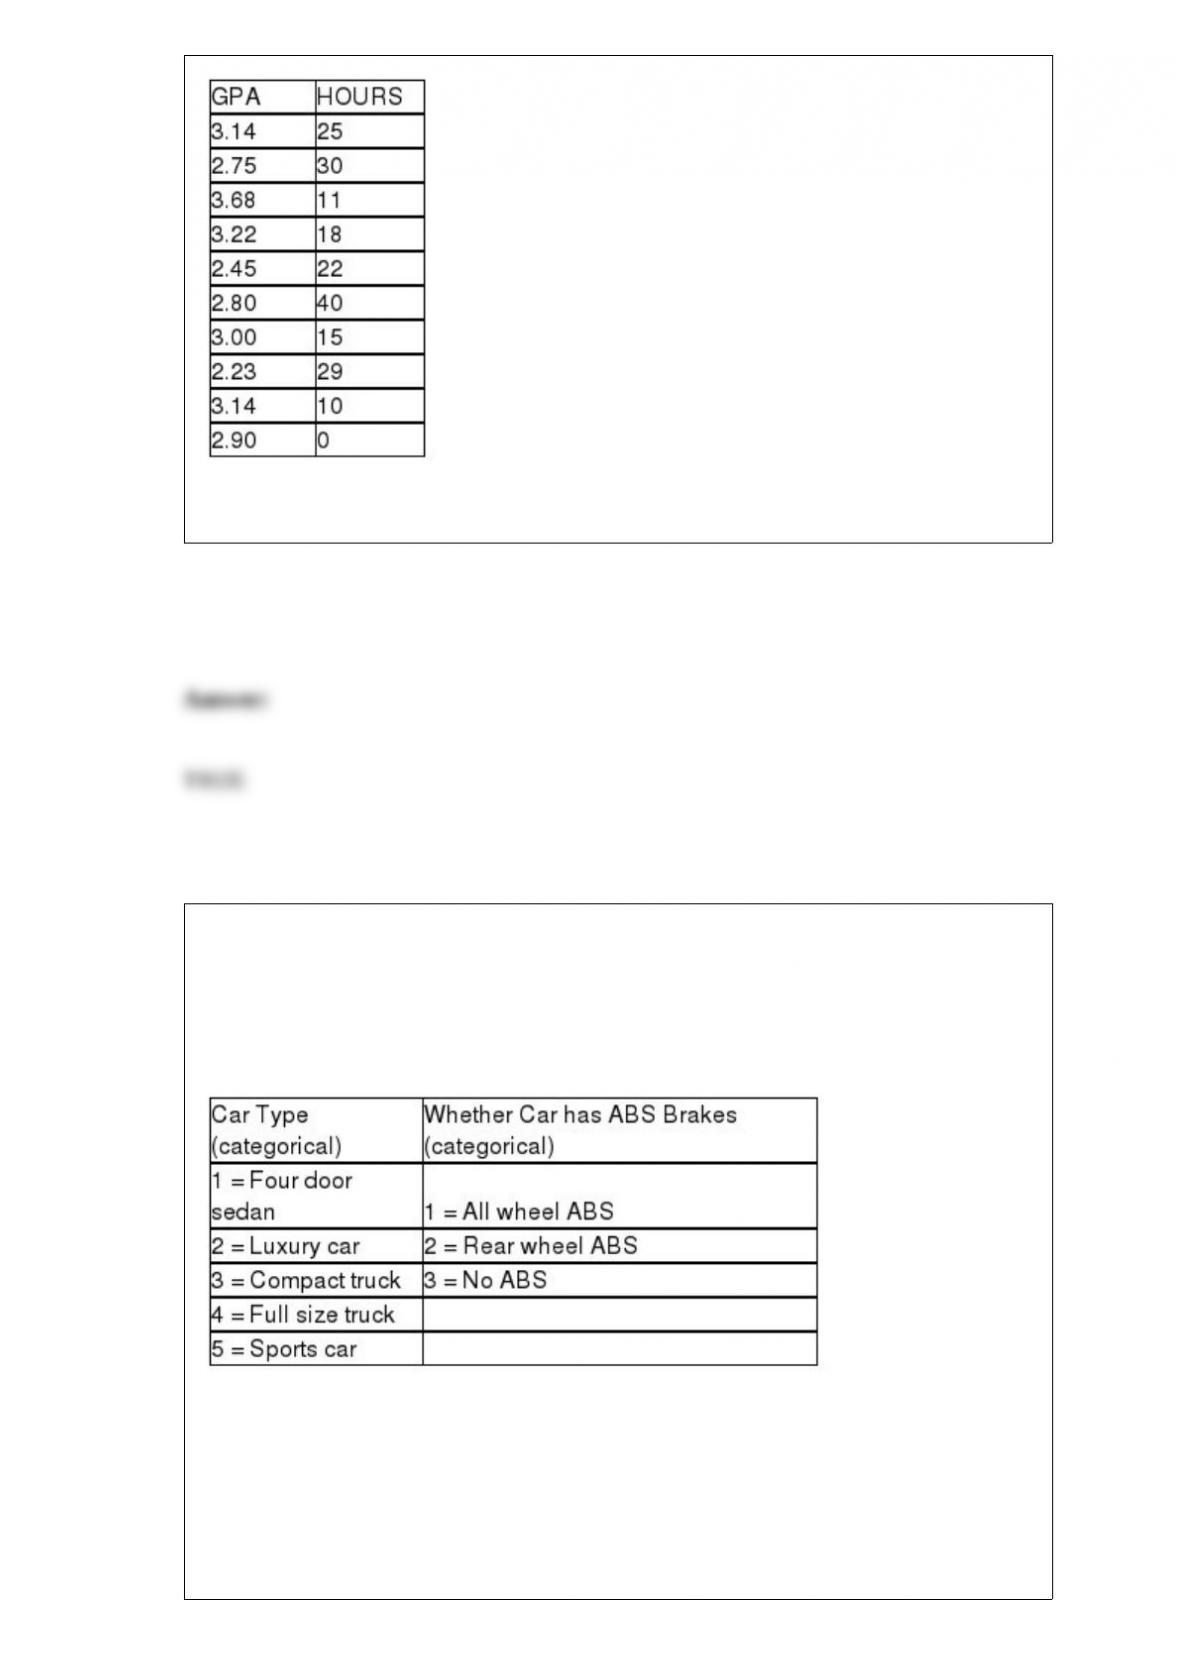
The correlation between these two variables is approximately -.461
The editors of a national automotive magazine recently studied 30 different automobiles
sold in the United States with the intent of seeing whether they could develop a multiple
regression model to explain the variation in highway miles per gallon. A number of
different independent variables were collected. Included in these were two variables
described as follows:
If these two variables are to be included in a regression model, how many additional
variables will be needed?
A) The model explains nearly 63 percent of the variation in the dependent variable.
B) If tested at the 0.05 significance level, the overall model would be considered

statistically significant.
C) The variable X1 has a slope coefficient that is significantly different from zero if
tested at the 0.05 level of significance.
D) All of the above are true.
When an accounting auditor randomly selects 20 accounts from all the accounts to
check for accuracy, she has selected:
A) a personal observation.
B) a sample from the population.
C) a census.
D) a convenience sample.
Which of the following is not an assumption of the multiple regression model?
A) The mean of the residuals is equal to the variance at all combinations of levels of the
independent variables.
B) The regression error terms are normally distributed.
C) The model error terms are independent.
D) The residuals have a constant variance for all combinations of values for the
independent variables.
A recent study of 15 shoppers showed that the correlation between the time spent in the
store and the dollars spent was 0.235. Using a significance level equal to 0.05, which of
the following is true?
A) The null hypothesis that the population mean is equal to zero should be rejected and
we should conclude that the true correlation is not equal to zero.
B) Based on the sample data there is not enough evidence to conclude that the true
correlation is different from zero.
C) The sample correlation coefficient could be zero since the test statistic does not fall
in the rejection region.
D) The null hypothesis should be rejected because the test statistic exceeds the critical
value.
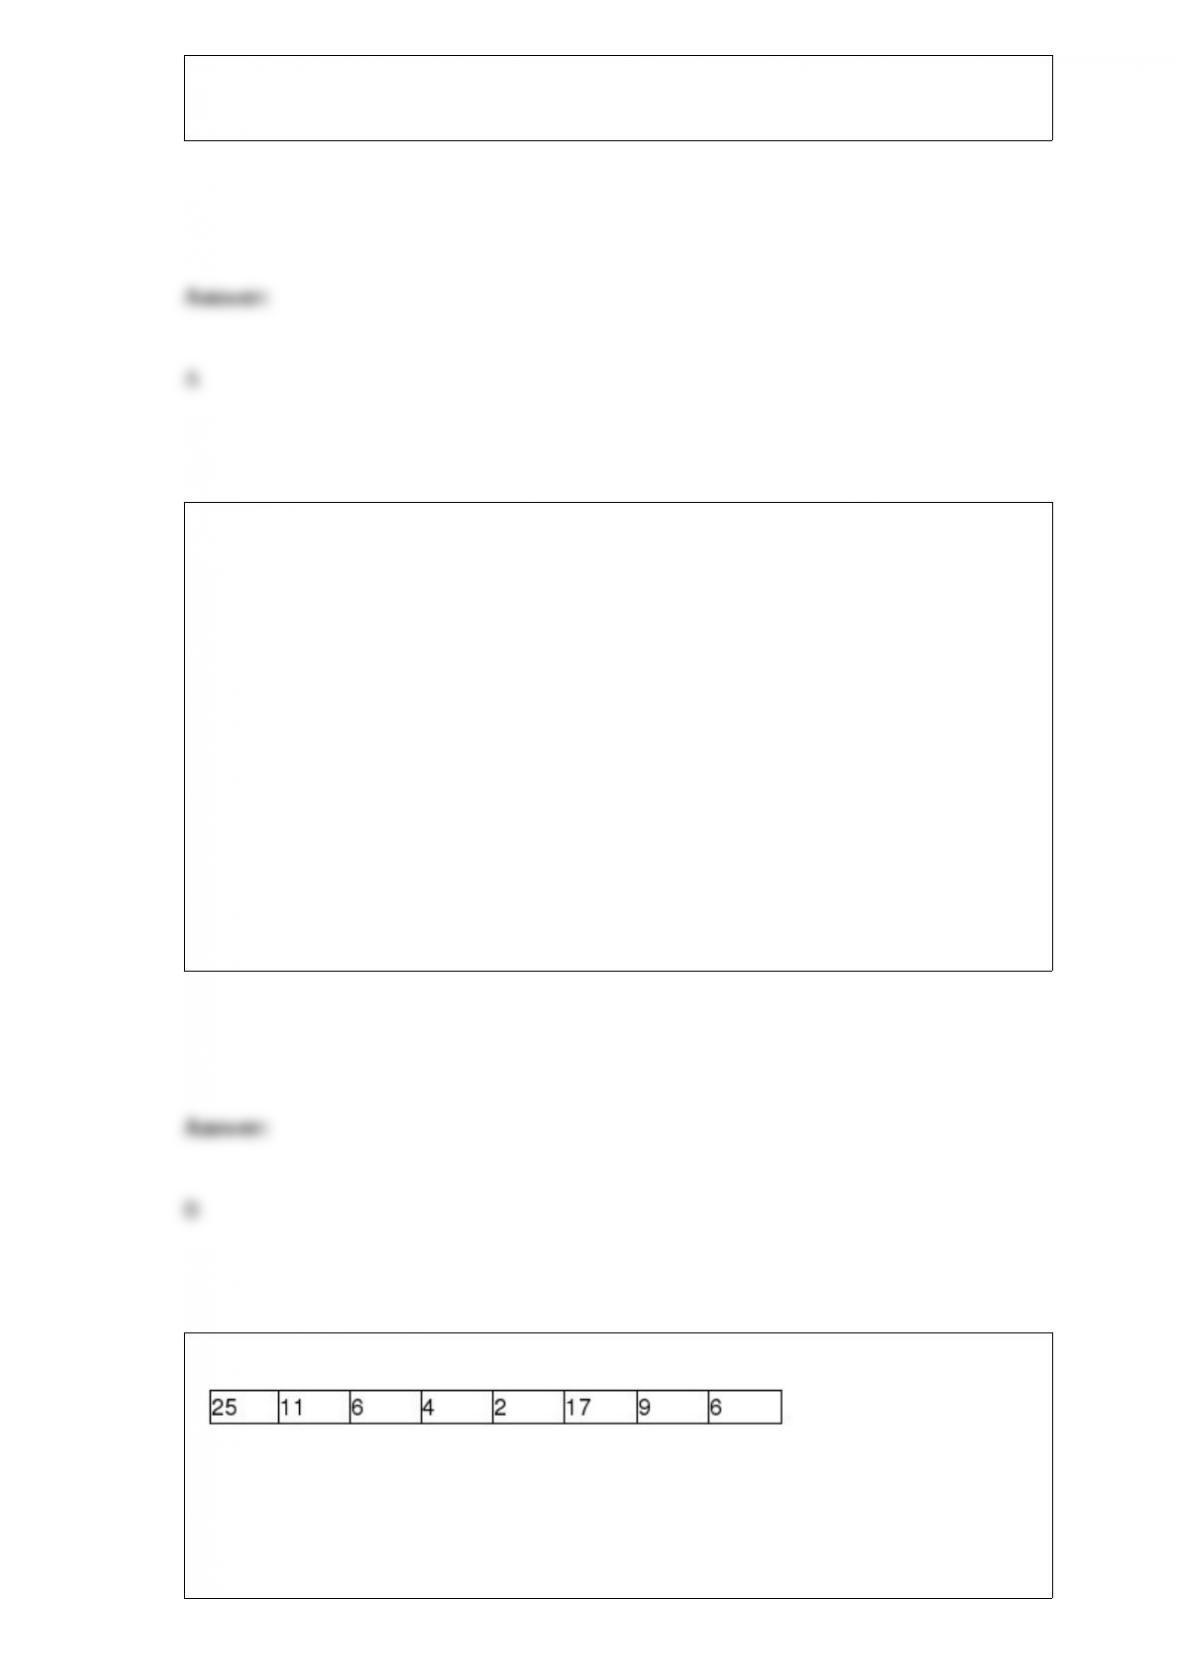
Consider the following sample data:
For these data the median is:
A) 7.5

B) 3.5
C) 10
D) None of the above
When a pair of dice are rolled, the outcome for each die can be said to be:
A) mutually exclusive.
B) mutually inclusive.
C) dependent.
D) independent.
Cross County Bicycles makes two mountain bike models that each come in three
colors. The following table shows the production volumes for last week:
What is the probability that the product manufactured is a YZ-99?
A) 0.2088
B) 0.3819
C) 0.3157
D) 0.1324
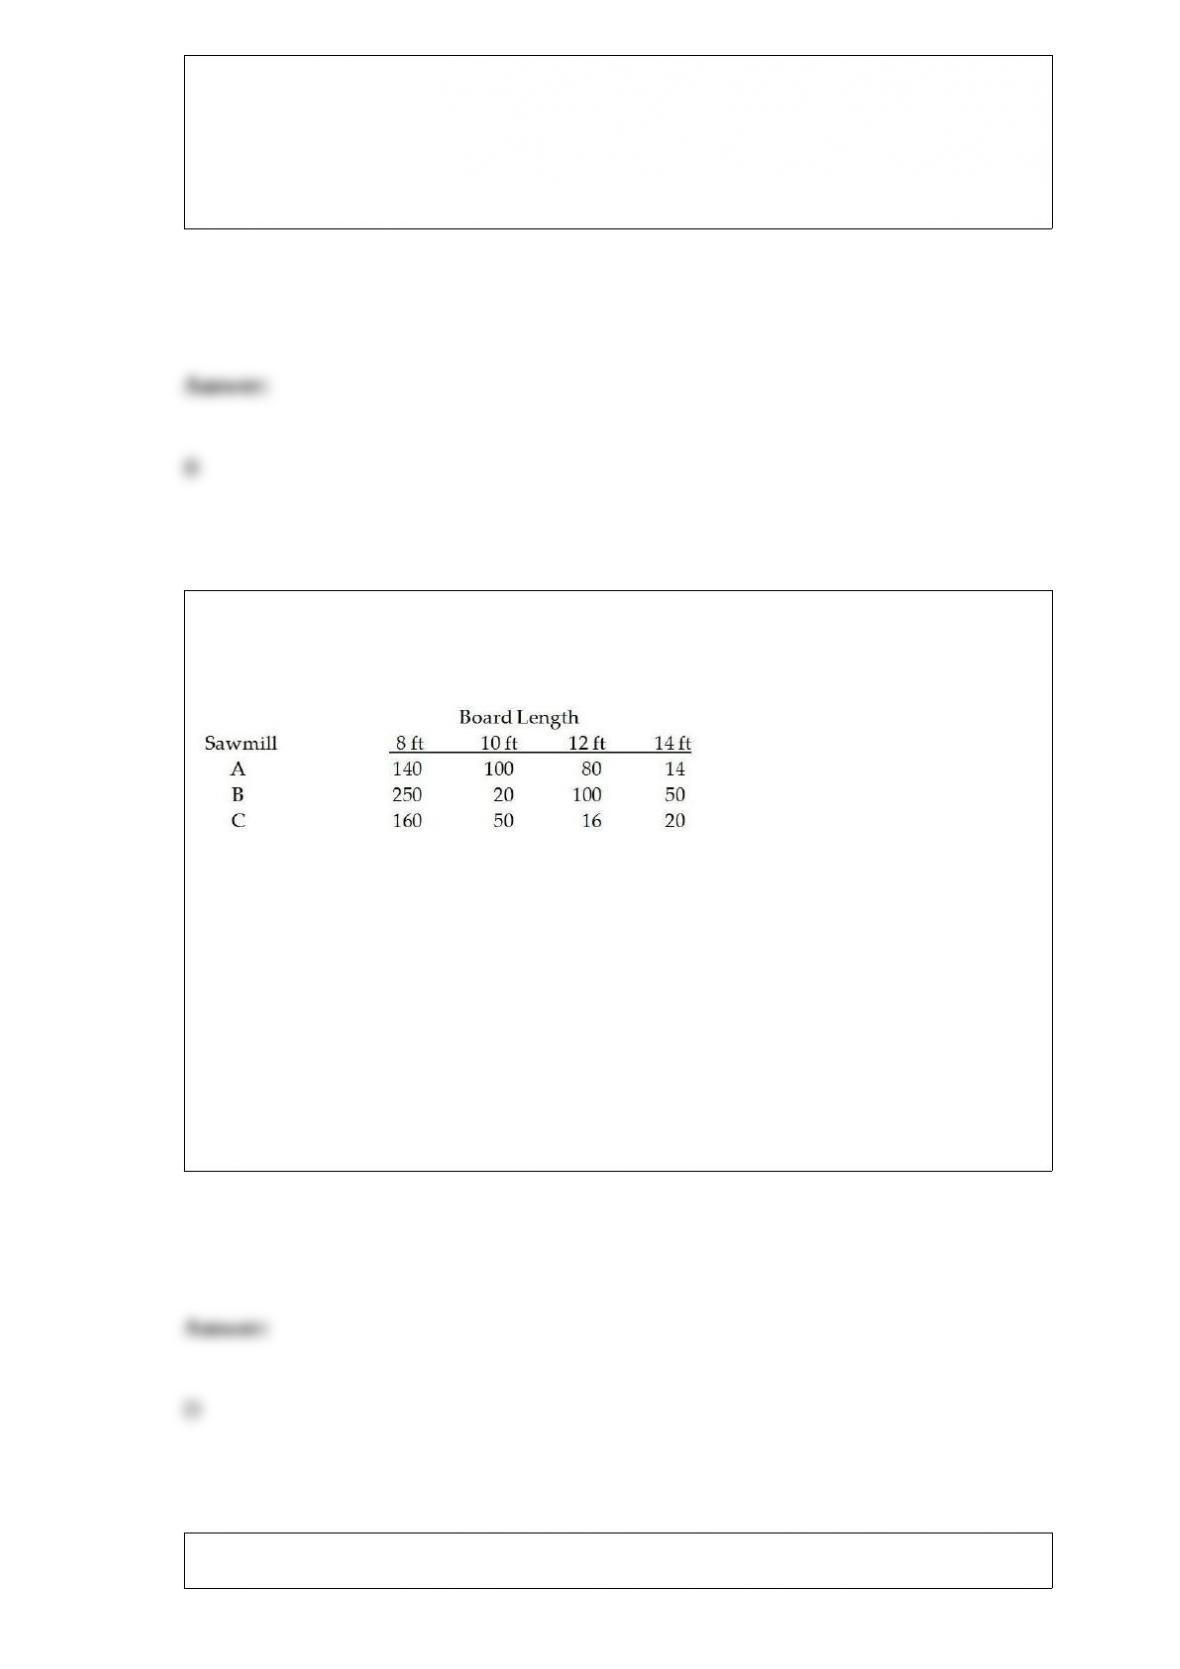
The Anderson Lumber Company has three sawmills that produce boards of different
lengths. The following table is a joint frequency distribution based on a random sample
of 1,000 boards selected from the lumber inventory.
Based on these data, the probability of selecting a board from inventory that is 10 feet
long is:
A) 0.196
B) 0.450
C) 0.084
D) 0.170
To increase productivity, workers went through a training program. The management
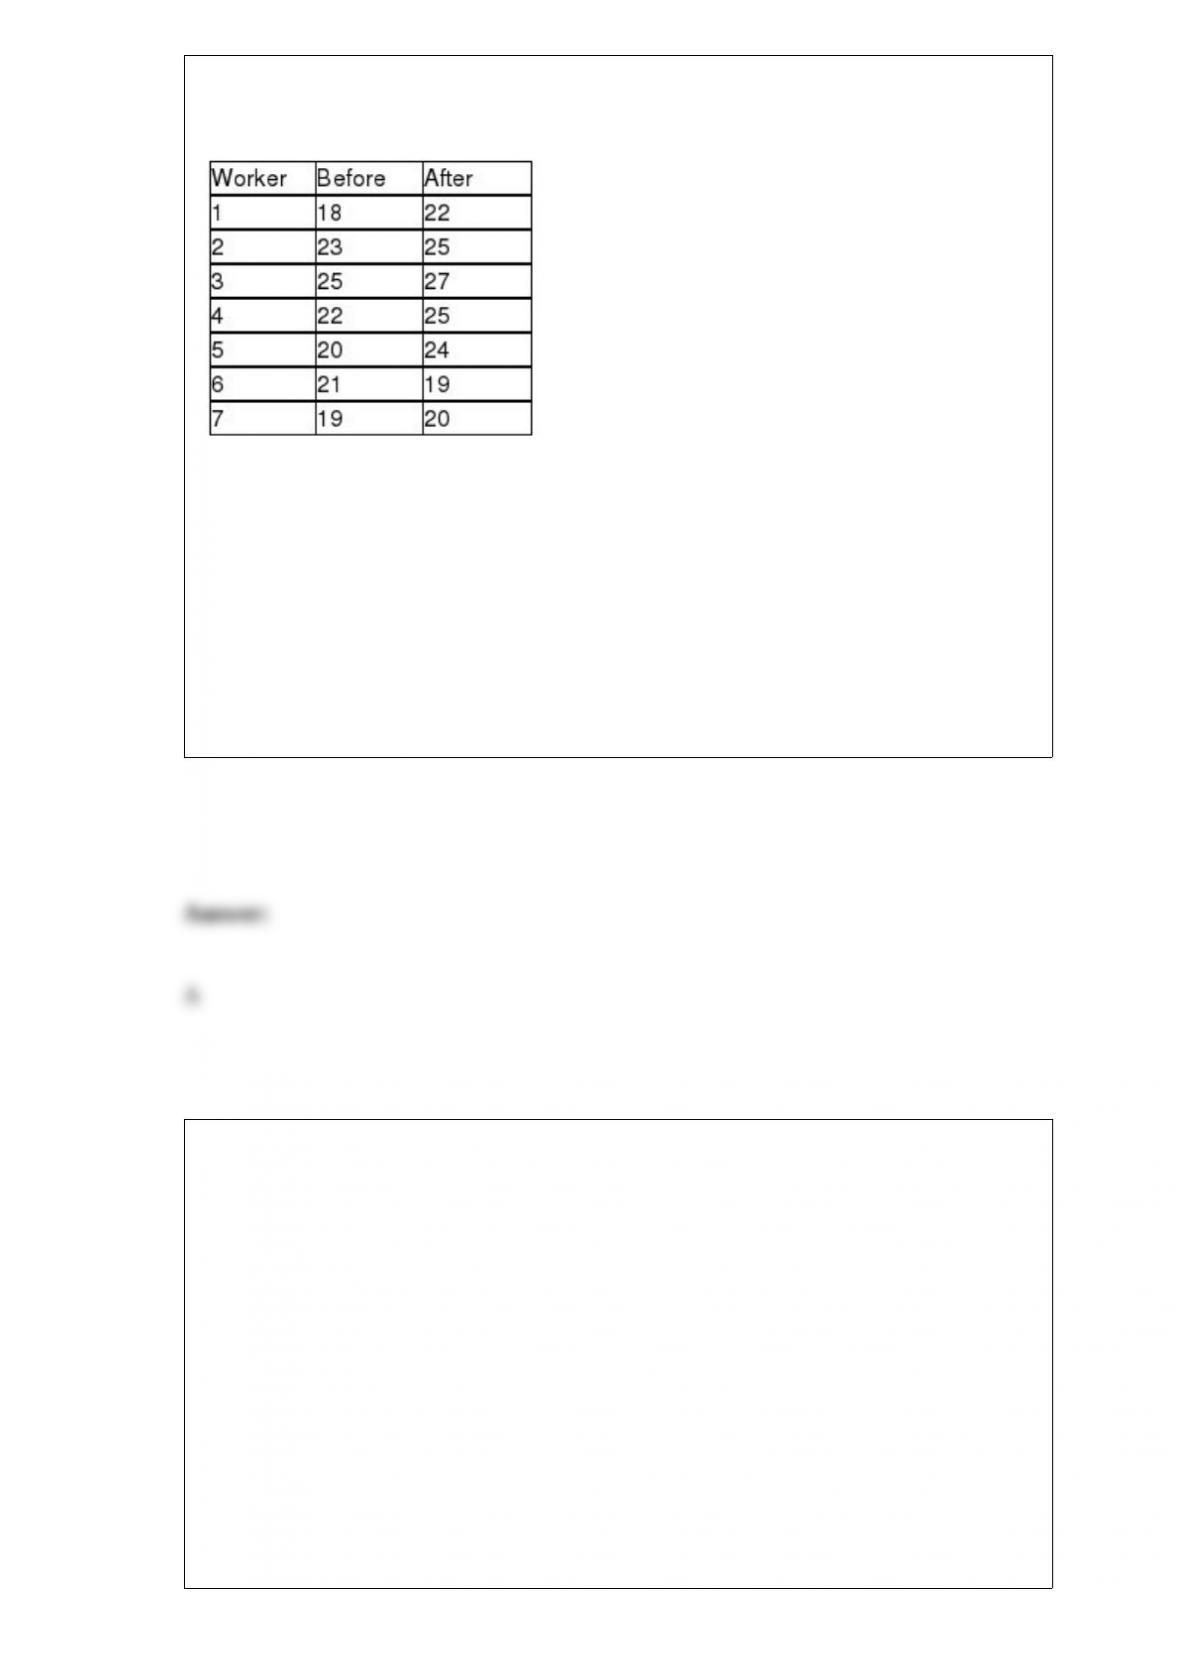
wanted to know the effectiveness of the program. A sample of seven workers was taken
and their daily production rates before and after the training are shown below.
Based on the data, the training program is:
A) effective.
B) ineffective.
C) neither effective nor ineffective.
D) None of the above
A recent article in The Wall Street Journal entitled “As Identity Theft Moves Online,
Crime Rings Mimic Big Business” states that 39% of the consumer scam complaints by
American consumers are about identity theft. Suppose a random sample of 90
complaints is obtained. Of these complaints, 40 were regarding identity theft. Based on
these sample data, what conclusion should be reached about the statement made in The
Wall Street Journal? (Test using α= 0.10.)
A) Since z = 1.947 > 1.645, we reject the null hypothesis.
There is sufficient evidence to conclude that the 0.39 rate quoted in the WSJ article is
wrong.
B) Since z = 2.033 > 1.96, we reject the null hypothesis.
There is sufficient evidence to conclude that the 0.39 rate quoted in the WSJ article is

wrong.
C) Since z = 1.341 < 1.645, we do not reject the null hypothesis.
There is insufficient evidence to conclude that the 0.39 rate quoted in the WSJ article is
wrong.
D) Since z = 0.97 < 1.645, we do not reject the null hypothesis.
There is insufficient evidence to conclude that the 0.39 rate quoted in the WSJ article is
wrong.