
The only two types of random variables are discrete and continuous random variables.
A 95 percent confidence interval for a mean will contain 95 percent of the population
within the interval.
Sawyer & Company is a law firm in Dallas, Texas. Recently, the administrative
manager prepared a report for the managing partners that showed the number of court
cases handled by the firm monthly over the past three years. It was appropriate for her
to use a line chart in this case.
A bar chart is the same as a histogram.

If a decision maker is concerned that the chance of making a Type II error is too large,
one option that will help reduce the risk is to reduce the significance level.
A simple random sample is selected in a manner such that each possible sample of a
given size has an equal chance of being selected.
A major car magazine has recently collected data on 30 leading cars in the U.S. market.
It is interested in building a multiple regression model to explain the variation in
highway miles. The following correlation matrix has been computed from the data
collected:
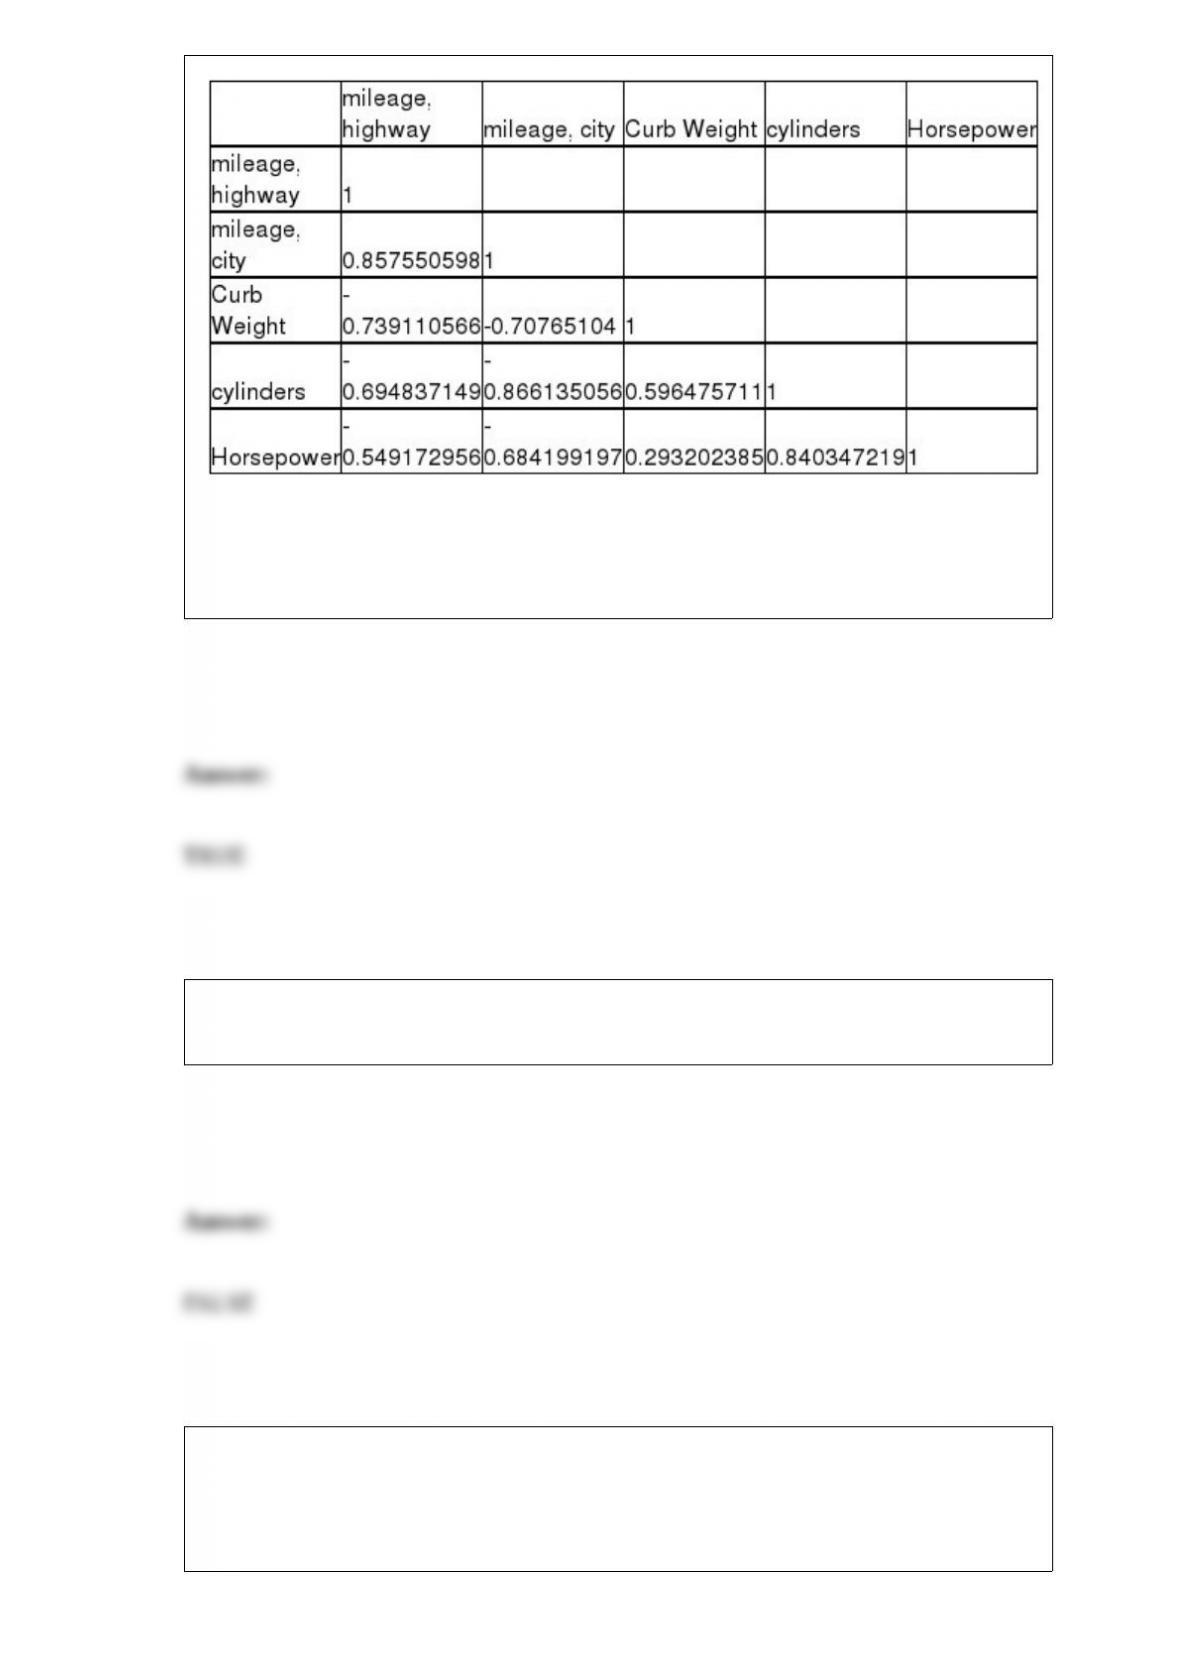
Based on this information, if we test using a 0.05 level of significance, the critical value
for testing whether any of the independent variables are significantly correlated with the
dependent variable is t = 2.0484.
If the forecast errors are autocorrelated, this is a good indication that the model has
been specified correctly.
Herb Criner, an analyst for the Folgerty Company, recently gave a report in which he
stated that the annual sales forecast based on 20 years of annual sales data was done
using a seasonally adjusted, trend-based forecasting technique. Given the information
presented here, this statement has the potential to be credible.
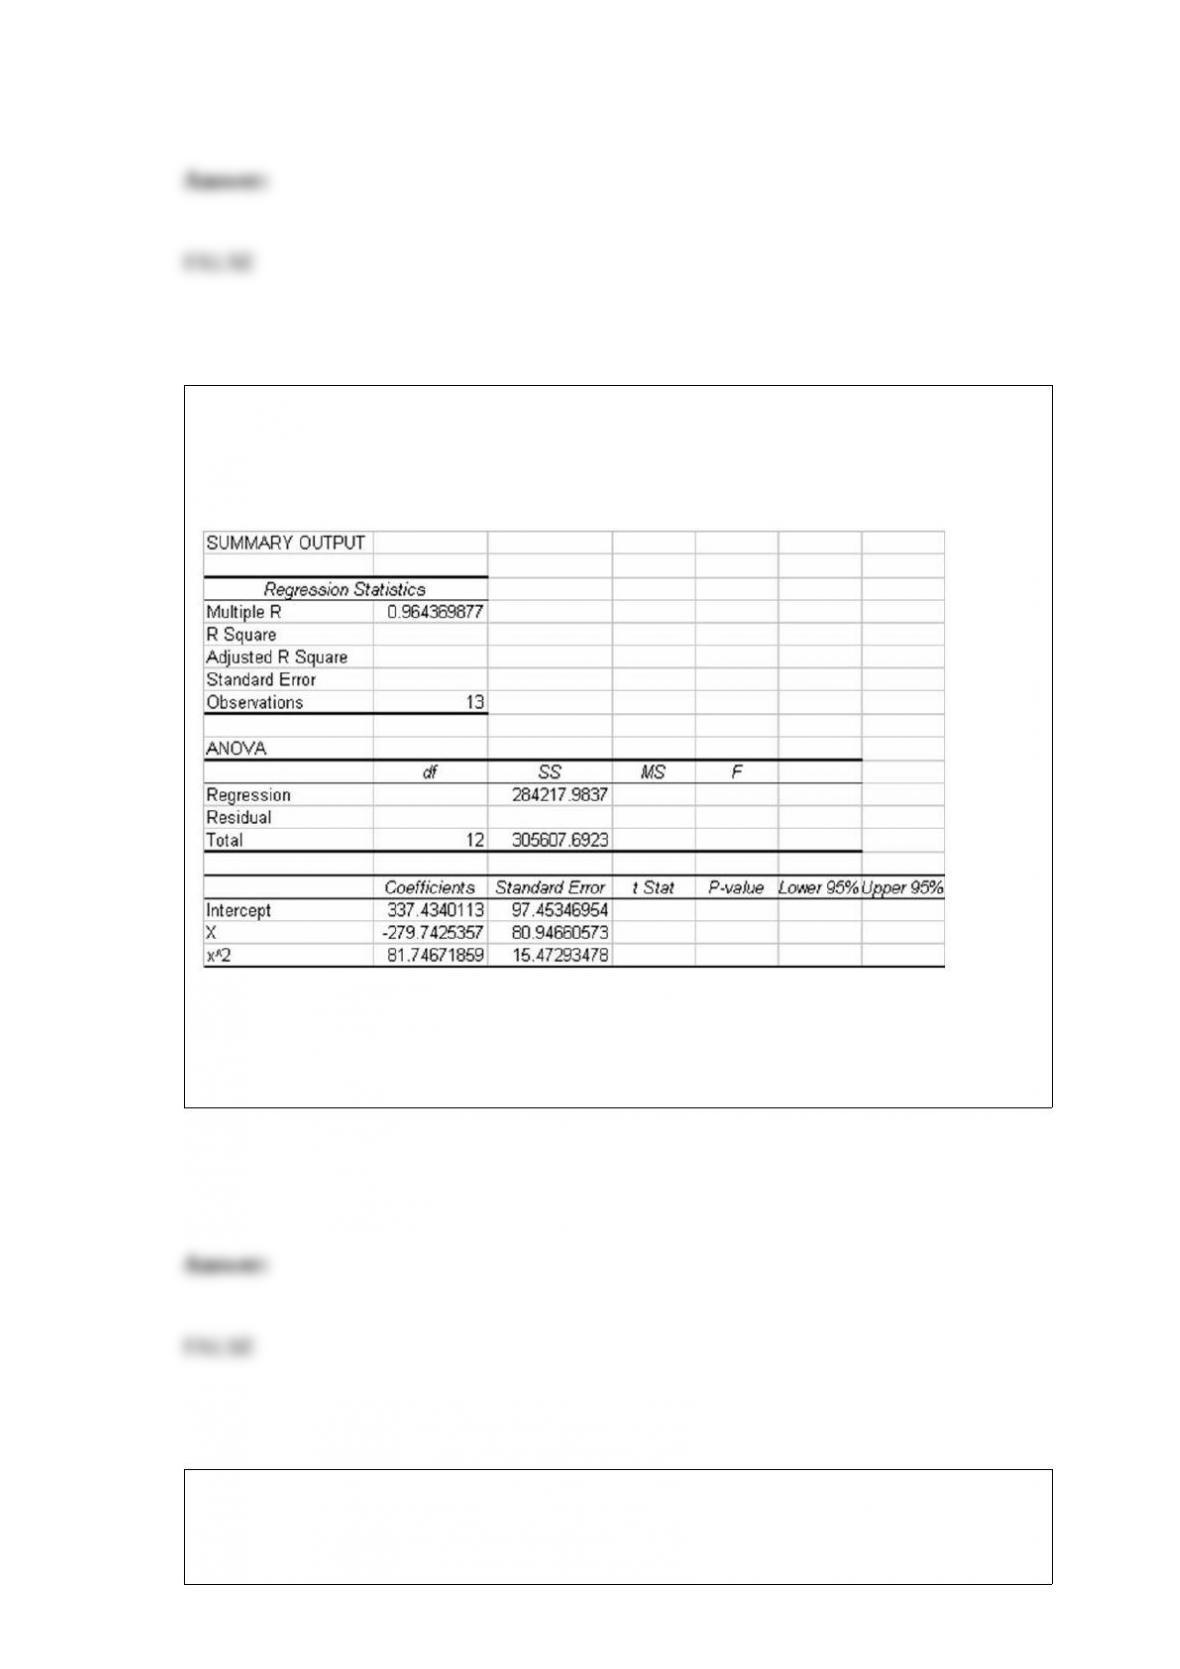
The following output is for a second-order polynomial regression model where the
independent variables are x and x2 (x^2 in output). Some of the output has been
omitted.
Considering the above information, it is clear that the second-order polynomial model
will be a more effective regression model for explaining the variation in the y variable
than would a linear regression model involving only one independent variable, x.
If one or more parameters are left unspecified in a goodness-of-fit test, they must be
estimated from the sample data and one degree of freedom is lost for each parameter
that must be estimated.
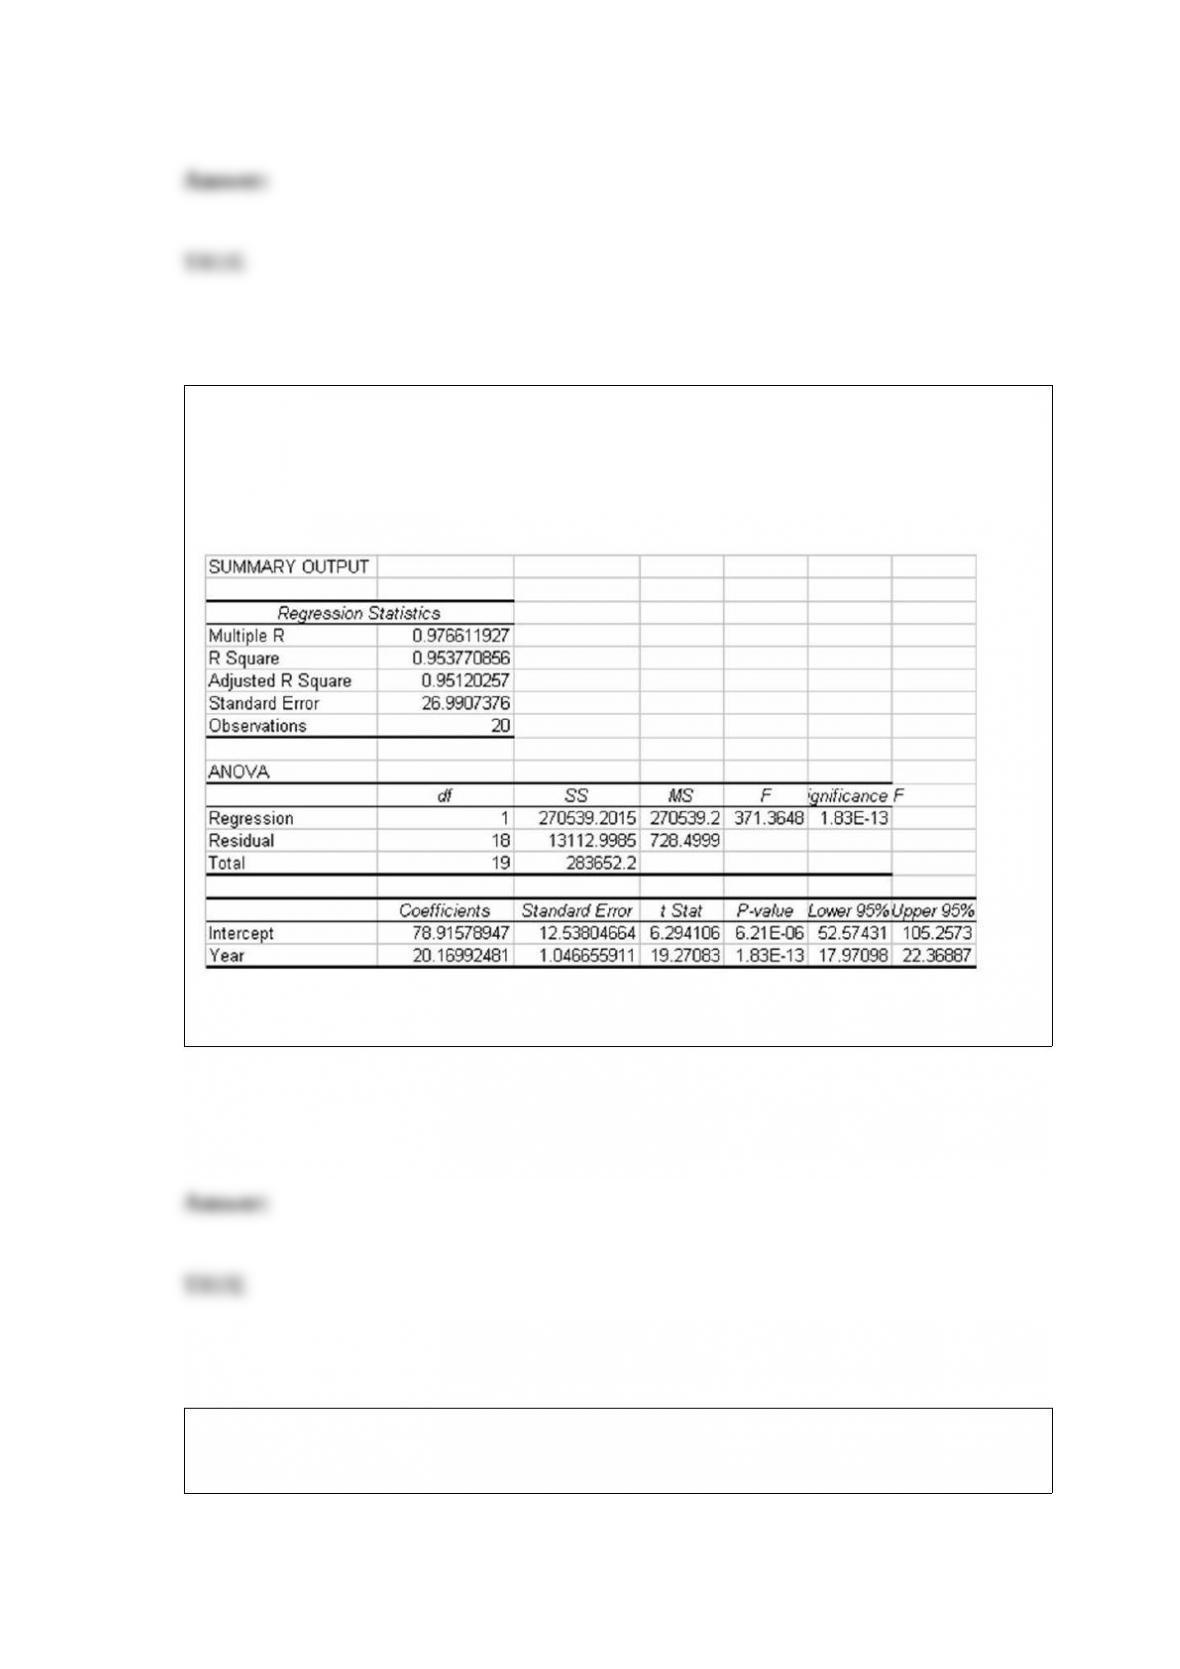
Gibson, Inc. is a holding company that owns several businesses. One such business is a
truck sales company. To help in managing this operation, managers at Gibson have
collected sales data for the past 20 years showing the number of trucks sold each year.
They have then developed the linear trend forecasting model shown as follows:
Based on this information, the fitted value for year 1 is about 99.
If the R-squared value for a regression model is high, the regression model will
necessarily provide accurate forecasts of the y variable.

To show the relationship between amount of rainfall and the number of car accidents,
the best type of graph to use is a scatter diagram.
If the population is not normally distributed, the t-distribution cannot be used.
If the historical data on which the model is being built consist of weekly data, the
forecasting period would also be weekly.
The fact that teachers’ salaries in Wisconsin are correlated with egg prices in Texas
means that the two variables are spuriously correlated since a change in one variable
could not cause the change in the other.
One difference between the binomial distribution and Poisson distribution is that the
binomial’s upper bound is the number of trials while the Poisson has no particular upper
bound.
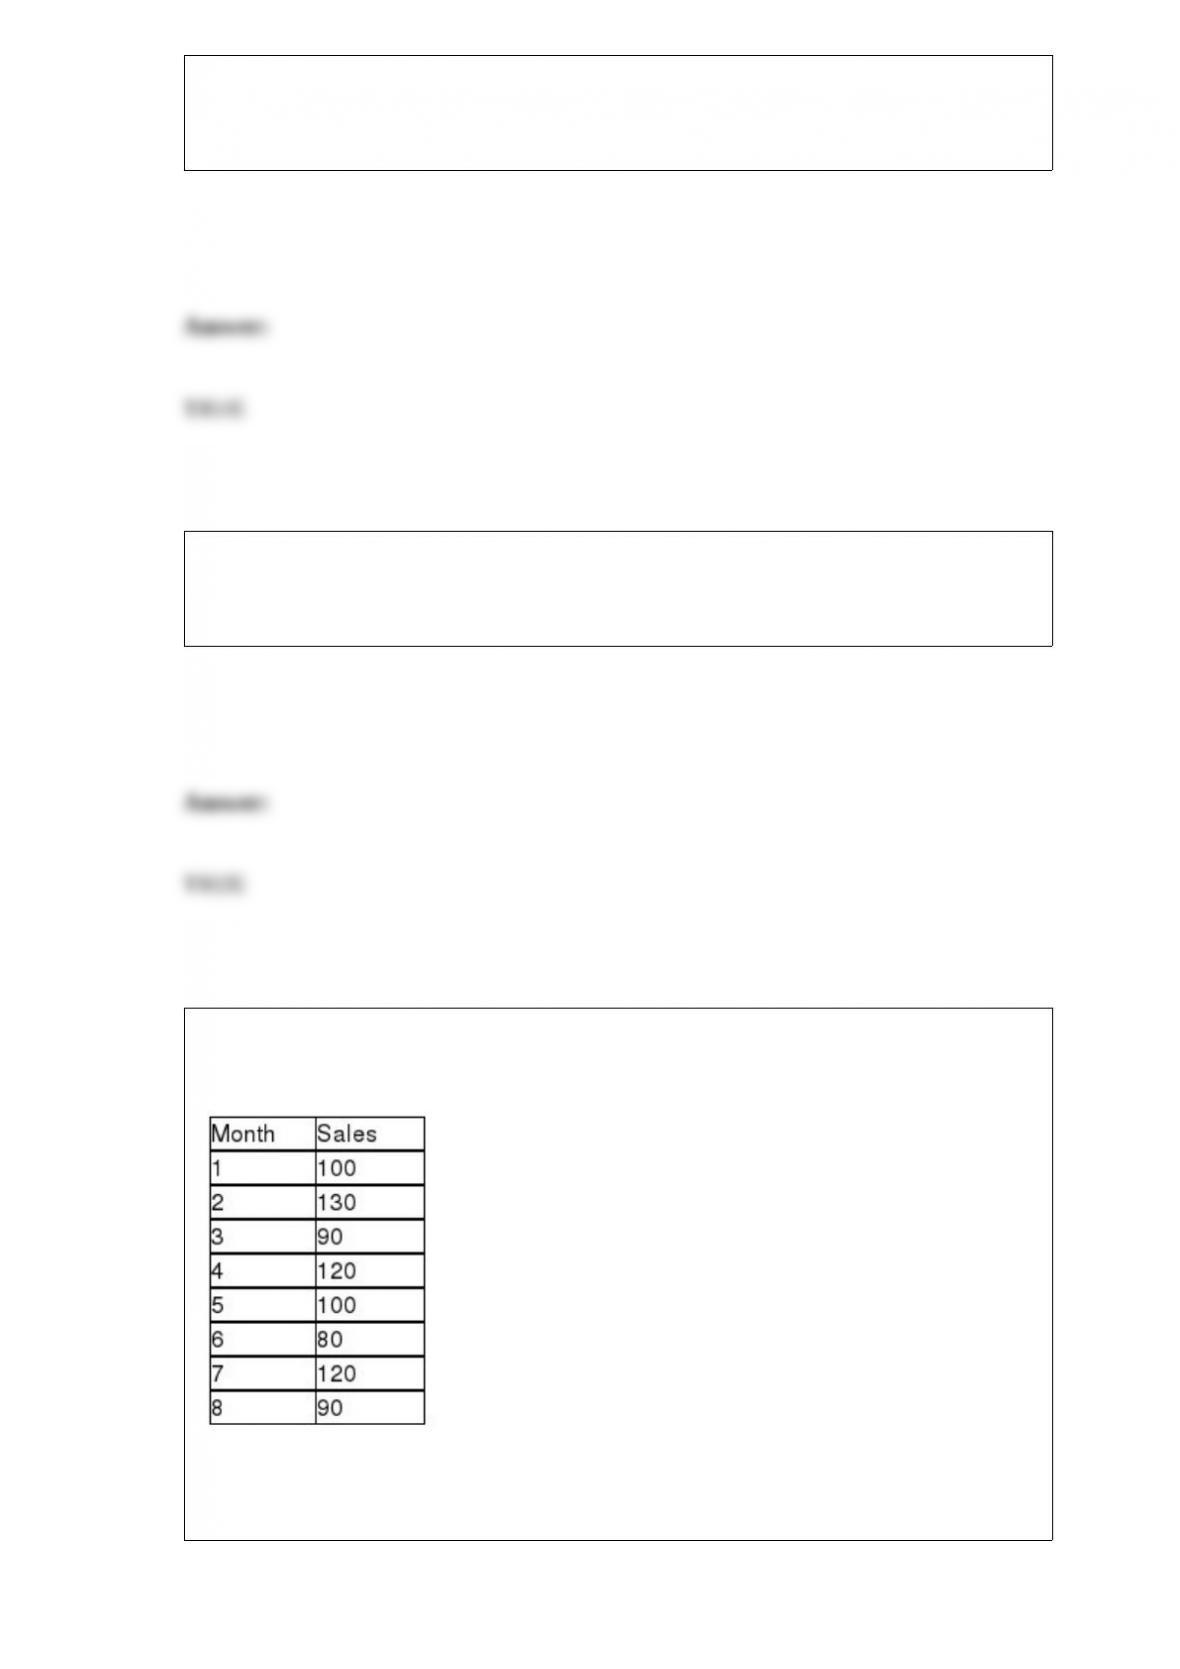
The owners of Hal’s Cookie Company have collected sales data for the past 8 months.
These data are shown as follows:
Using a smoothing constant equal to 0.20 and starting forecast in period 1 of 100, the
forecast value for period 9 is approximately 104.2.

A random sample of 100 people was selected from a population of customers at a local
bank. The mean age of these customers was 40. If the population standard deviation is
thought to be 5 years, the margin of error for a 95 percent confidence interval estimate
is .98 year.
A complete polynomial model contains terms of all orders less than or equal to the pth
order.
An increase in sample size will tend to result in less sampling error.

In a one-tailed hypothesis test, the larger the significance level, the greater the critical
value will be.
The distribution of T-values in the Wilcoxon Matched-Pairs Signed Rank test is
approximately normal if the sample size (number of matched pairs) exceeds 25.
A probability distribution with an expected value greater than the expected value of a
second probability distribution will also have a higher standard deviation.
If a forecasting model produces forecast errors (residuals) that are negatively correlated,
then we expect a negative residual to be followed by another negative residual to be
followed by another negative residual and so forth.

In a two-tailed hypothesis test for the difference between two population variances, if s1
= 3 and s2 = 5, then the test statistic is F = 2.7778.
If a decision maker wishes to reduce the chance of making a Type II error, one option is
to increase the sample size.
A study was recently conducted in which people were asked to indicate which news
medium was their preferred choice for national news. The following data were
observed:

Given this data, if we wish to test whether the preferred news source is independent of
age, the cell with the largest expected cell frequency is also the cell with the largest
observed frequency.
In a goodness-of-fit test, when the null hypothesis is true, the expected value for the
chi-square test statistic is zero.
A claim was recently made that stated that the median income for male and female
graduates is the same for those graduating with a degree in operations management. In
order to test this claim using the Mann-Whitney U test, the same number of males and
females must be selected.
In using the Kruskal-Wallis test the sample sizes for each population must be equal.

One of the basic tools for creating a trend-based forecasting model is regression
analysis.
In a two-factor ANOVA, the total sum of squares can be partitioned into four parts; the
variation due to factor A, the variation due to factor B, the variation due to blocking,
and the error variation.
One of the key quality characteristics in many service environments is that the variation
in service time be reasonably small. Recently, a major amusement park company
initiated a new line system at one of its parks. It then wished to compare this new
system with the old system in place at a comparable park in another state. At issue is
whether the standard deviation in waiting time is less under the new line system than
under the old line system. The following information was collected:
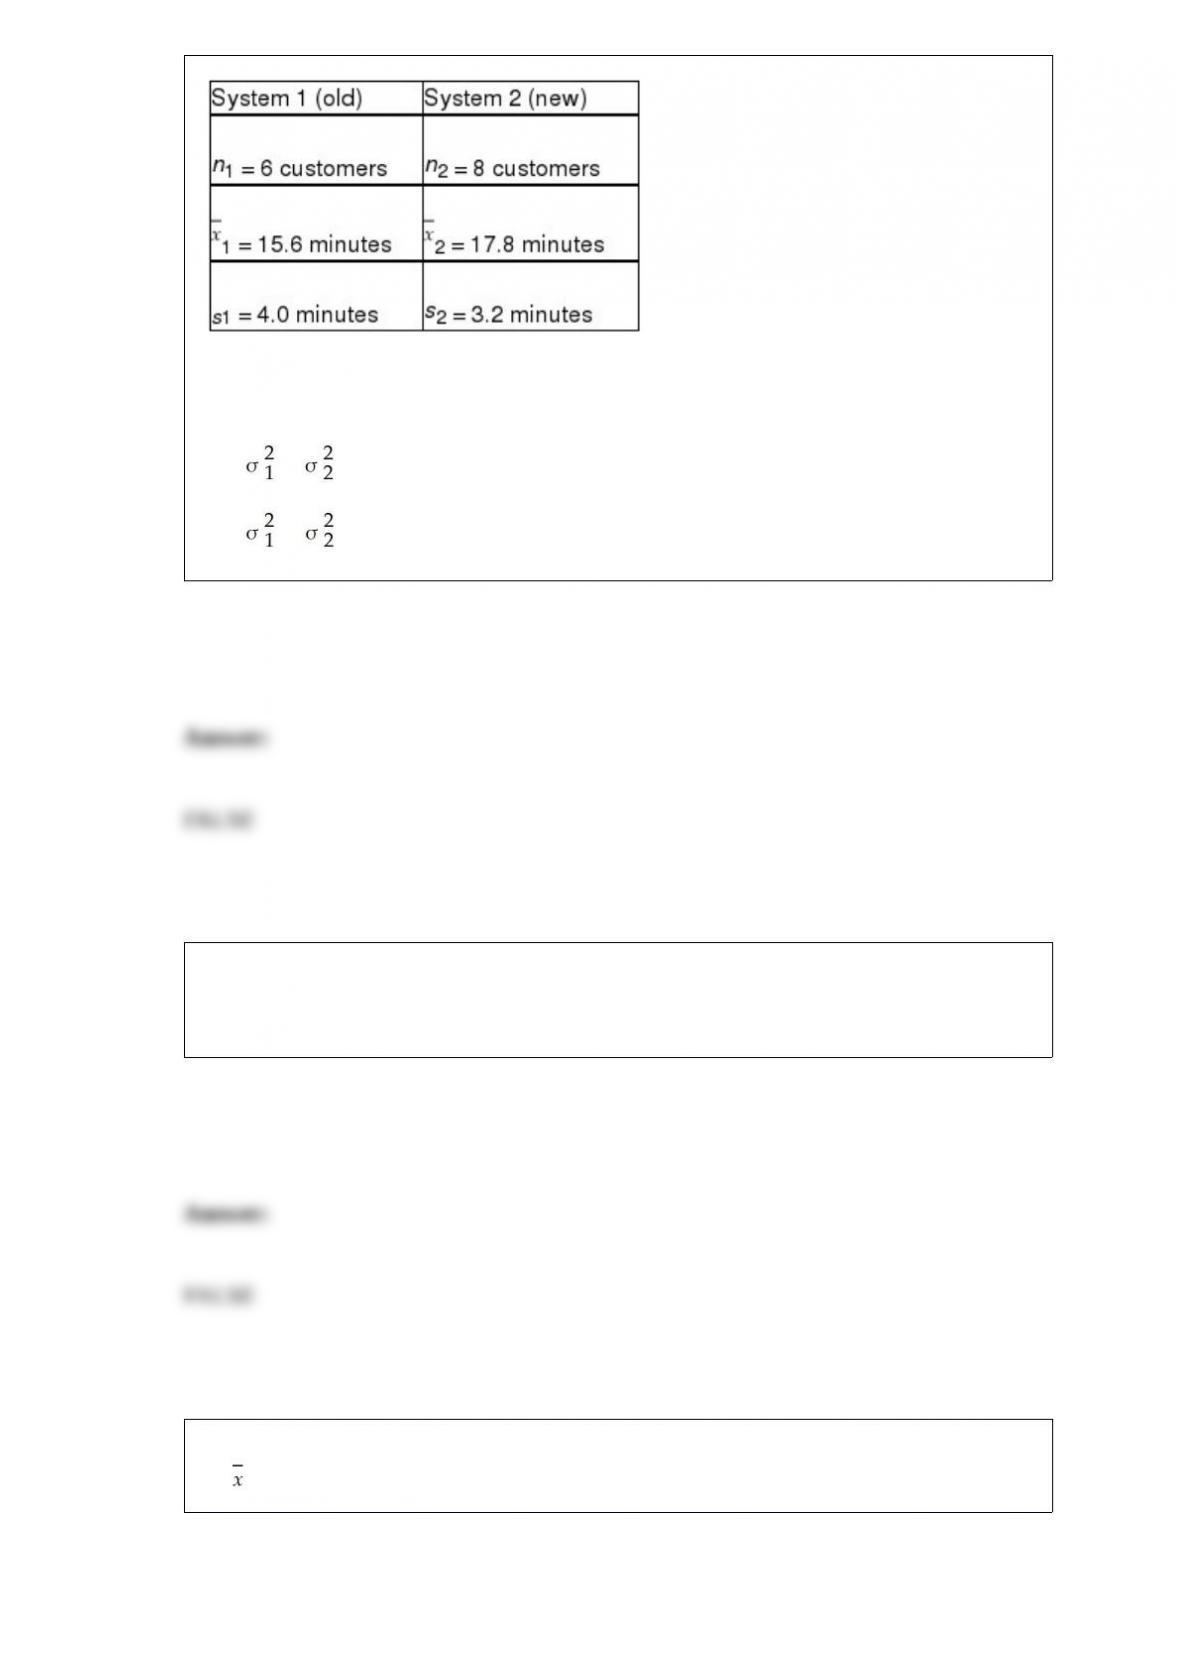
Assuming that it wishes to conduct the test using a 0.05 level of significance, the
correct null and alternative hypotheses would be:
H0 : ≠
Ha : =
When a group of university students takes a poll of their fellow students on whether
they support a proposed fee increase, the sampling method they would use when
students walking near the library are surveyed would be called a random sample.
It is entirely possible for the R-chart to show that a process is in statistical control and
the -chart to show that the same process is out of control.
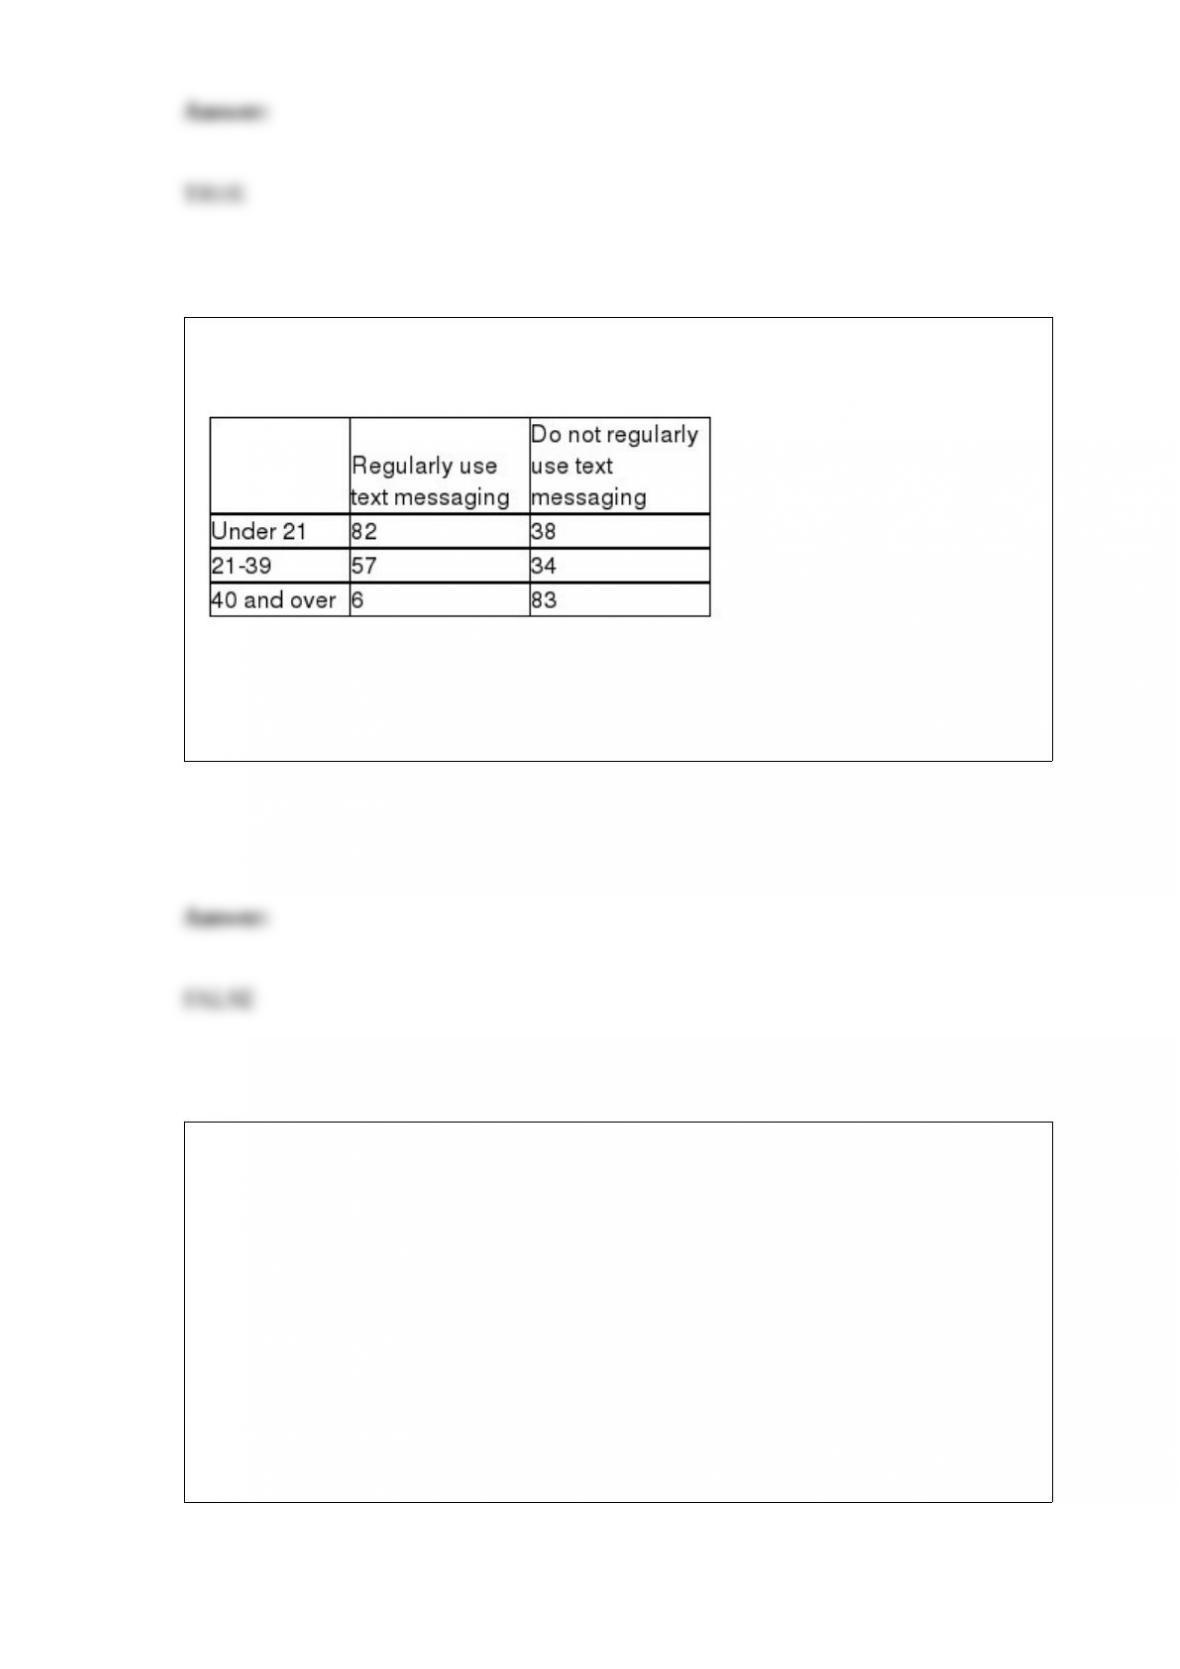
A cell phone company wants to determine if the use of text messaging is independent of
age. The follow data has been collected from a random sample of their customers.
Using the data above, in order to test for the independence of age and the use of text
messaging, the expected value for the “under 21 and regularly use text messaging” cell
is 82.
Suppose the life of a particular brand of calculator battery is approximately normally
distributed with a mean of 75 hours and a standard deviation of 10 hours. What is the
probability that a single battery randomly selected from the population will have a life
between 70 and 80 hours?
A) 0.2412
B) 0.3830
C) 0.1712
D) 0.5121

Hubble Construction Company has submitted a bid on a state government project that is
to be funded by the federal government’s stimulus money in Arizona. The price of the
bid was predetermined in the bid specifications. The contract is to be awarded on the
basis of a blind drawing from those who have bid. Five other companies have also
submitted bids.
What is the probability of the Hubble Construction Company winning the bid?
A) 0.2778
B) 0.1667
C) 0.6944
D) 0.0278
The Center on Budget and Policy Priorities (www.cbpp.org) reported that average
out-of-pocket medical expenses for prescription drugs for privately insured adults with
incomes over 200% of the poverty level was $173 in 2002. Suppose an investigation
was conducted in 2012 to determine whether the increased availability of generic drugs,
Internet prescription drug purchases, and cost controls have reduced out-of-pocket drug
expenses. The investigation randomly sampled 196 privately insured adults with
incomes over 200% of the poverty level, and the respondents’ 2012 out-of-pocket
medical expenses for prescription drugs were recorded. These data are in the file Drug
Expenses. Based on the sample data, can it be concluded that 2012 out-of-pocket
prescription drug expenses are lower than the 2002 average reported by the Center on
Budget and Policy Priorities? Use a level of significance of 0.01 to conduct the
hypothesis test.
A) Because t = -2.69 is less than -2.3456, do not reject H0

Conclude that 2012 average out-of-pocket prescription drug expenses are not lower
than the 2002 average.
B) Because t = -2.69 is less than -2.3456, reject H0
Conclude that 2012 average out-of-pocket prescription drug expenses are lower than the
2002 average.
C) Because t = -1.69 is less than -0.8712, reject H0
Conclude that 2012 average out-of-pocket prescription drug expenses are lower than the
2002 average.
D) Because t = -1.69 is less than -0.8712, do not reject H0
Conclude that 2012 average out-of-pocket prescription drug expenses are not lower
than the 2002 average.
A study was conducted to determine if differences in new textbook prices exist between
on-campus bookstores, off-campus bookstores, and Internet bookstores. To control for
differences in textbook prices that might exist across disciplines, the study randomly
selected 12 textbooks and recorded the price of each of the 12 books at each of the three
retailers. You may assume normality and equal-variance assumptions have been met.
The partially completed ANOVA table based on the study’s findings is shown here:
Complete the ANOVA table by filling in the missing sums of squares, the degrees of
freedom for each source, the mean square, and the calculated F-test statistic for each
possible hypothesis test.
A) Textbooks df = 11, MSBL = 1,511.3, F (Textbooks) = 40.05, Retailer df = 2, MSB =
1.2, , SSW = 851.2, Error df = 22, MSW = 38.7, Total df = 35
B) Textbooks df = 11, MSBL = 1,511.3, F (Textbooks) = 39.05, Retailer df = 2, MSB =
1.2, , SSW = 851.2, Error df = 22, MSW = 38.7, Total df = 35
C) Textbooks df = 12, MSBL = 1,511.3, F (Textbooks) = 39.05, Retailer df = 2, MSB =
1.2, , SSW = 851.2, Error df = 22, MSW = 38.7, Total df = 36
D) Textbooks df = 11, MSBL = 1,511.3, F (Textbooks) = 39.05, Retailer df = 2, MSB =
1.2, , SSW = 831.2, Error df = 22, MSW = 38.7, Total df = 36
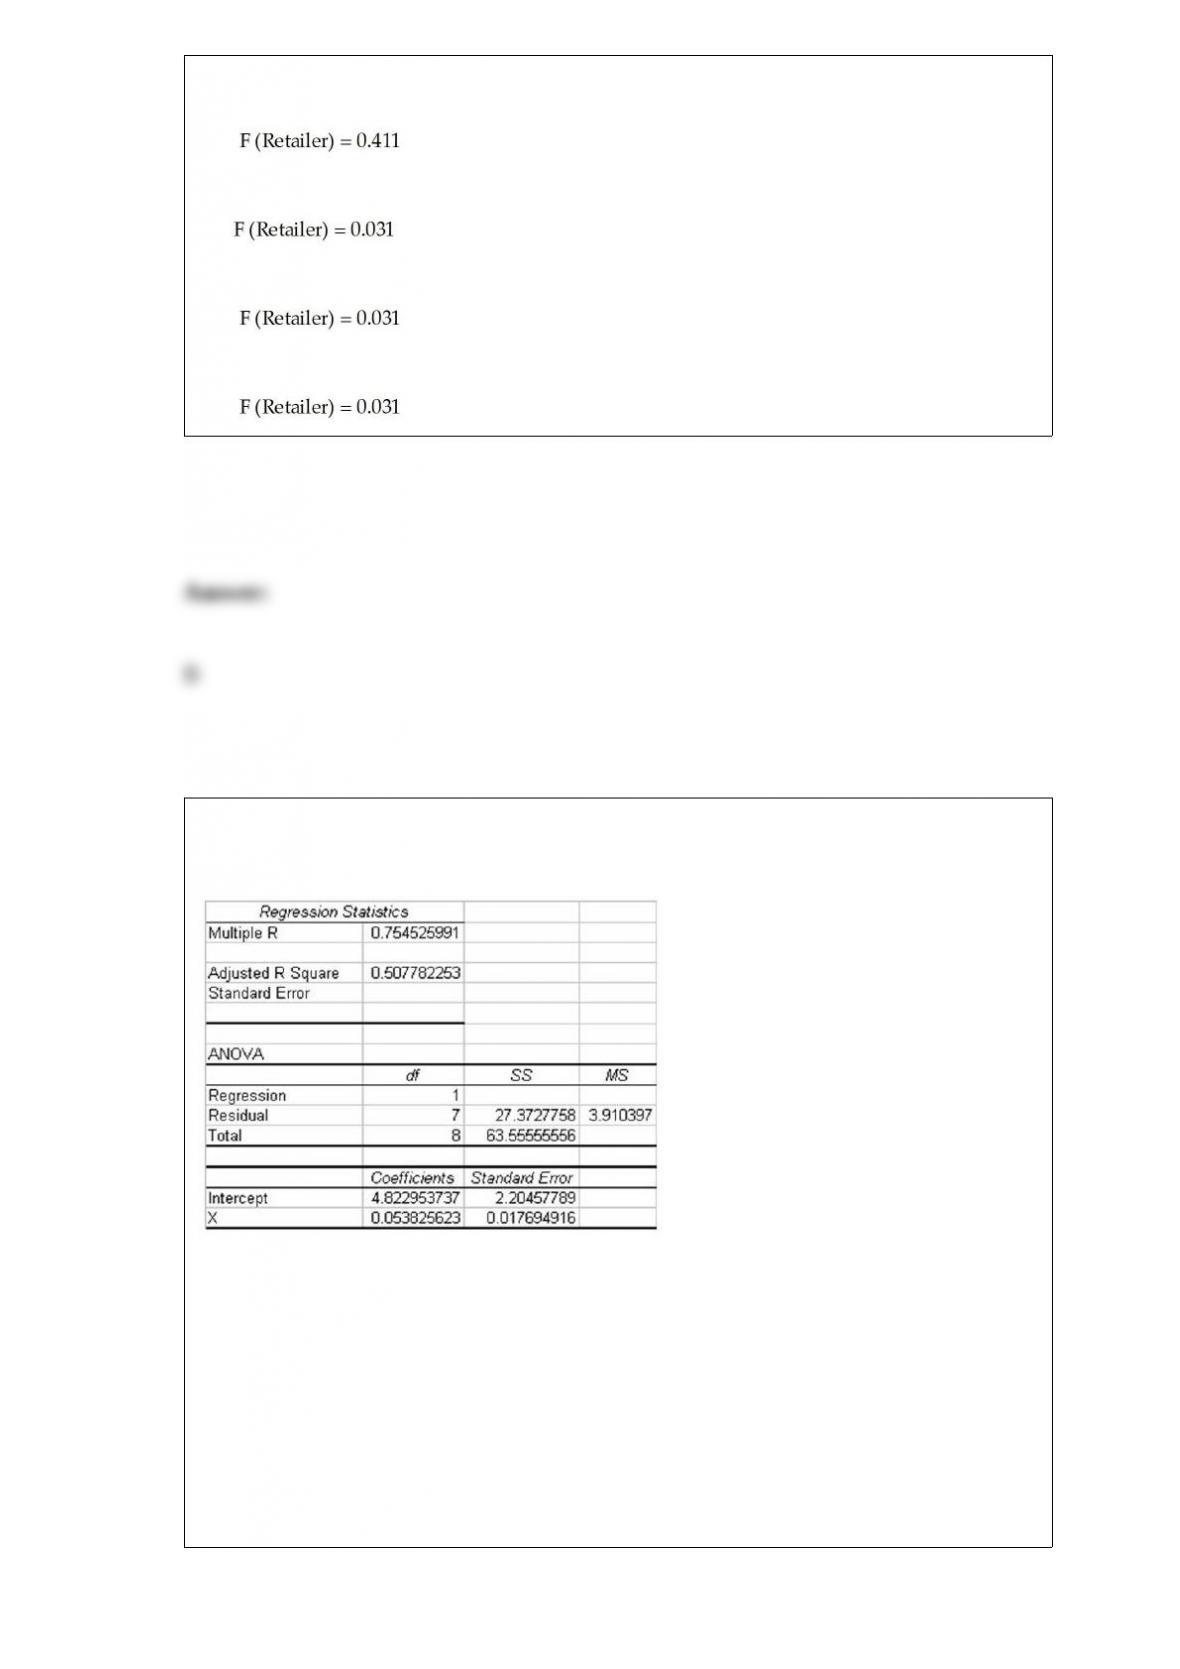
The following regression output is available. Notice that some of the values are
missing.
Given this information, what was the sample size used in the study?
A) 8
B) 18
C) 9
D) 16
A store sells 6 different models of cell phones and have found that they sell an equal
number of each model. The probability distribution that would describe this random
variable is called:
A) uniform distribution.
B) Poisson distribution.
C) continuous distribution.
D) relative frequency distribution.
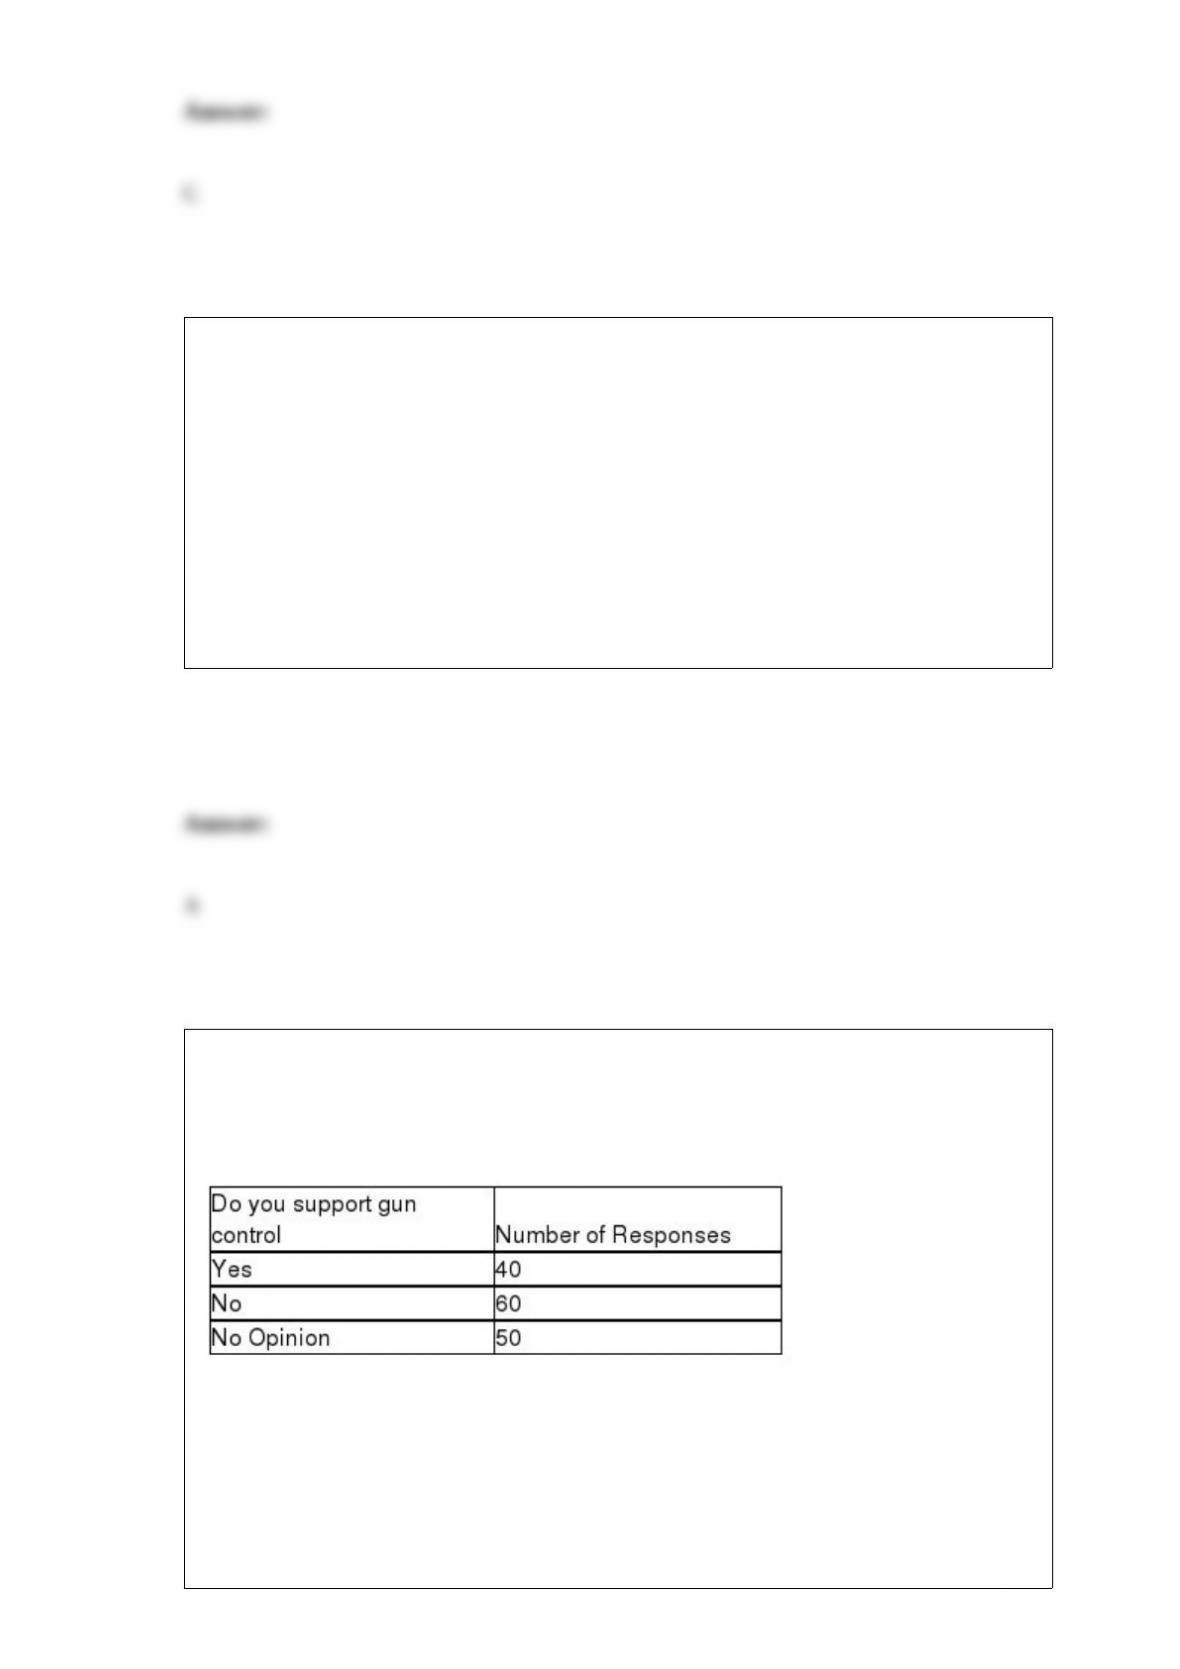
We are interested in determining whether the opinions of the individuals on gun control
(as to Yes, No, and No Opinion) are uniformly distributed.
A sample of 150 was taken and the following data were obtained.
The conclusion of the test with alpha = 0.05 is that the views of people on gun control
are:
A) uniformly distributed.
B) not uniformly distributed.
C) inconclusive.
D) None of the above
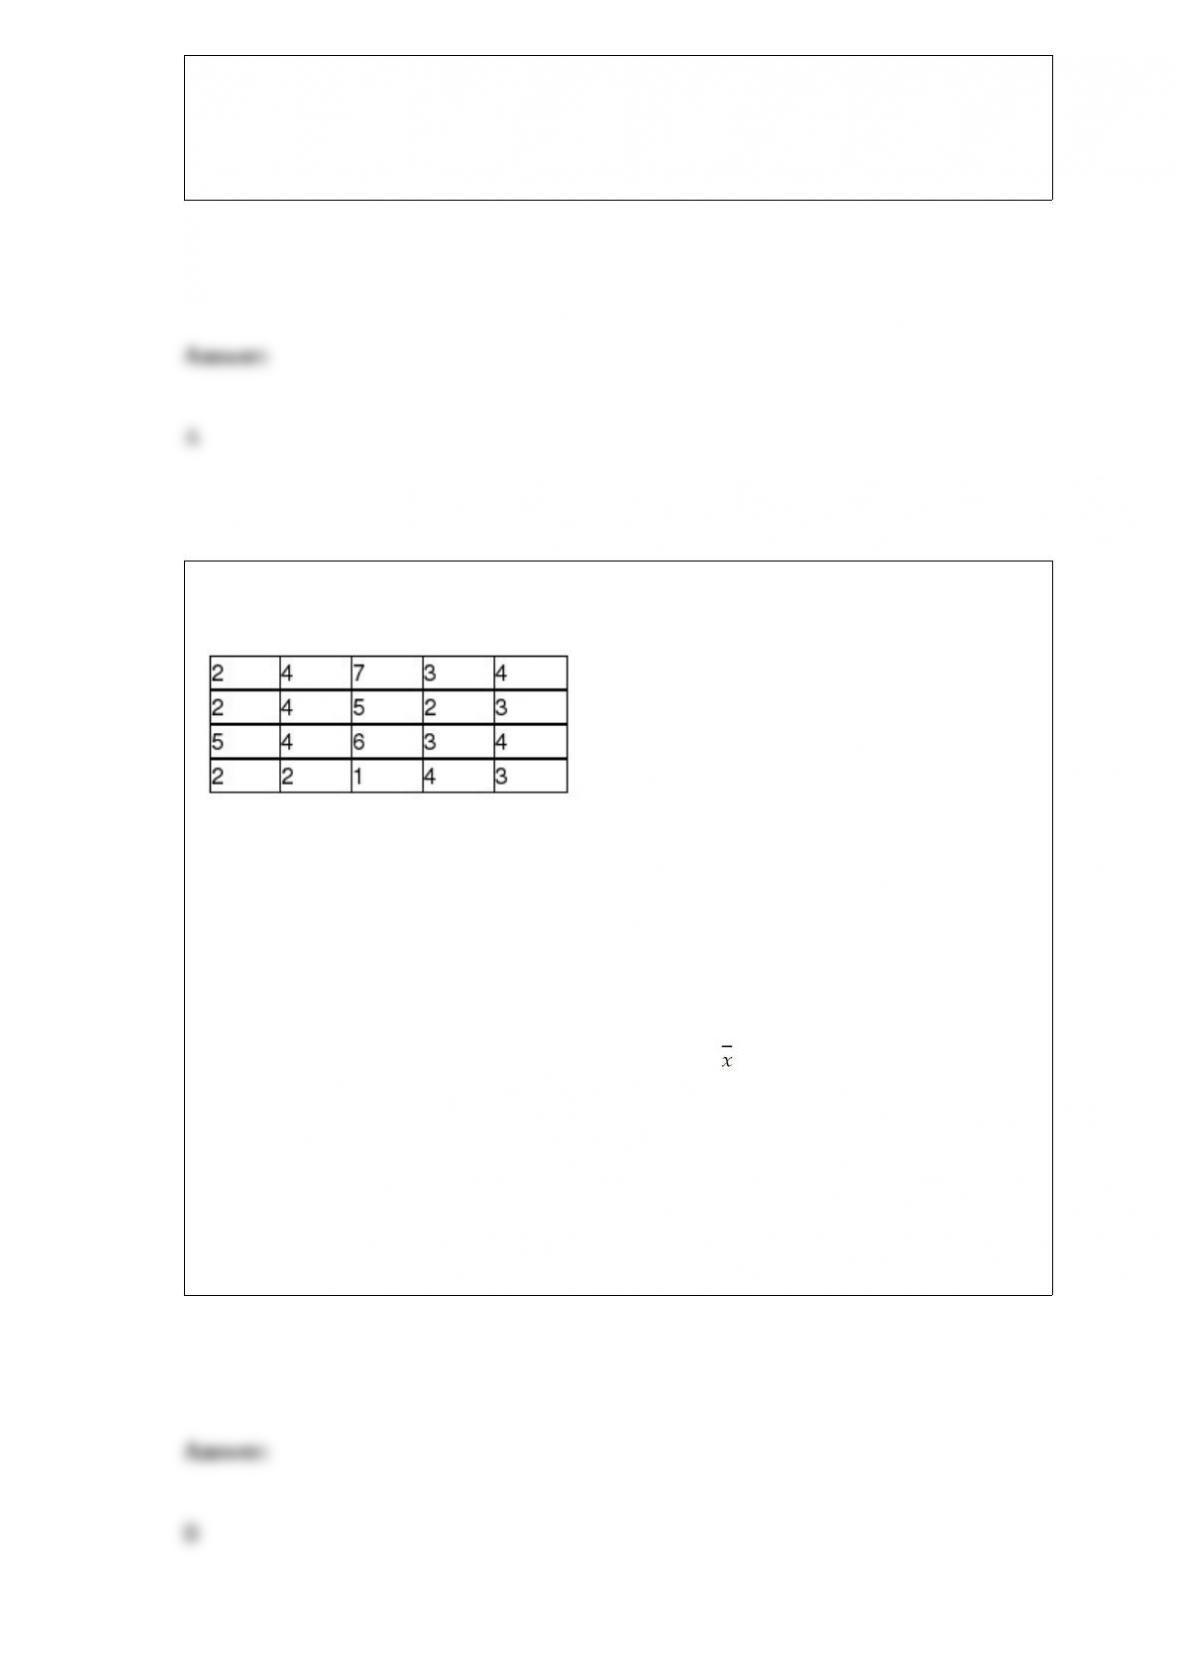
A particular subdivision has 20 homes. The number of people living in each of these
homes is listed as follows:
Which of the following statements is true when comparing a random sample of size
three homes selected from the population to a random sample of size 6 homes selected
from the population?
A) The amount of sampling error that will exist between the sample mean and the
population mean will be half for the larger sample.
B) The most extreme negative sampling error between and μ is reduced by about
0.167 person.
C) We can expect that the larger sample will produce more sampling error due to the
potential to make coding errors.
D) The sampling error that will result from the smaller sample will be less than what we
would see from the larger sample.
A grocery store is interested in determining whether its customers are satisfied with the
quality of service provided. To collect the necessary data, interviewers have been hired
to stand near the store’s exits and to survey customers who have the time and interest to
be surveyed. This type of sampling is called:
A) systematic random sampling.
B) ratio sampling.
C) convenience sampling.
D) stratified sampling.
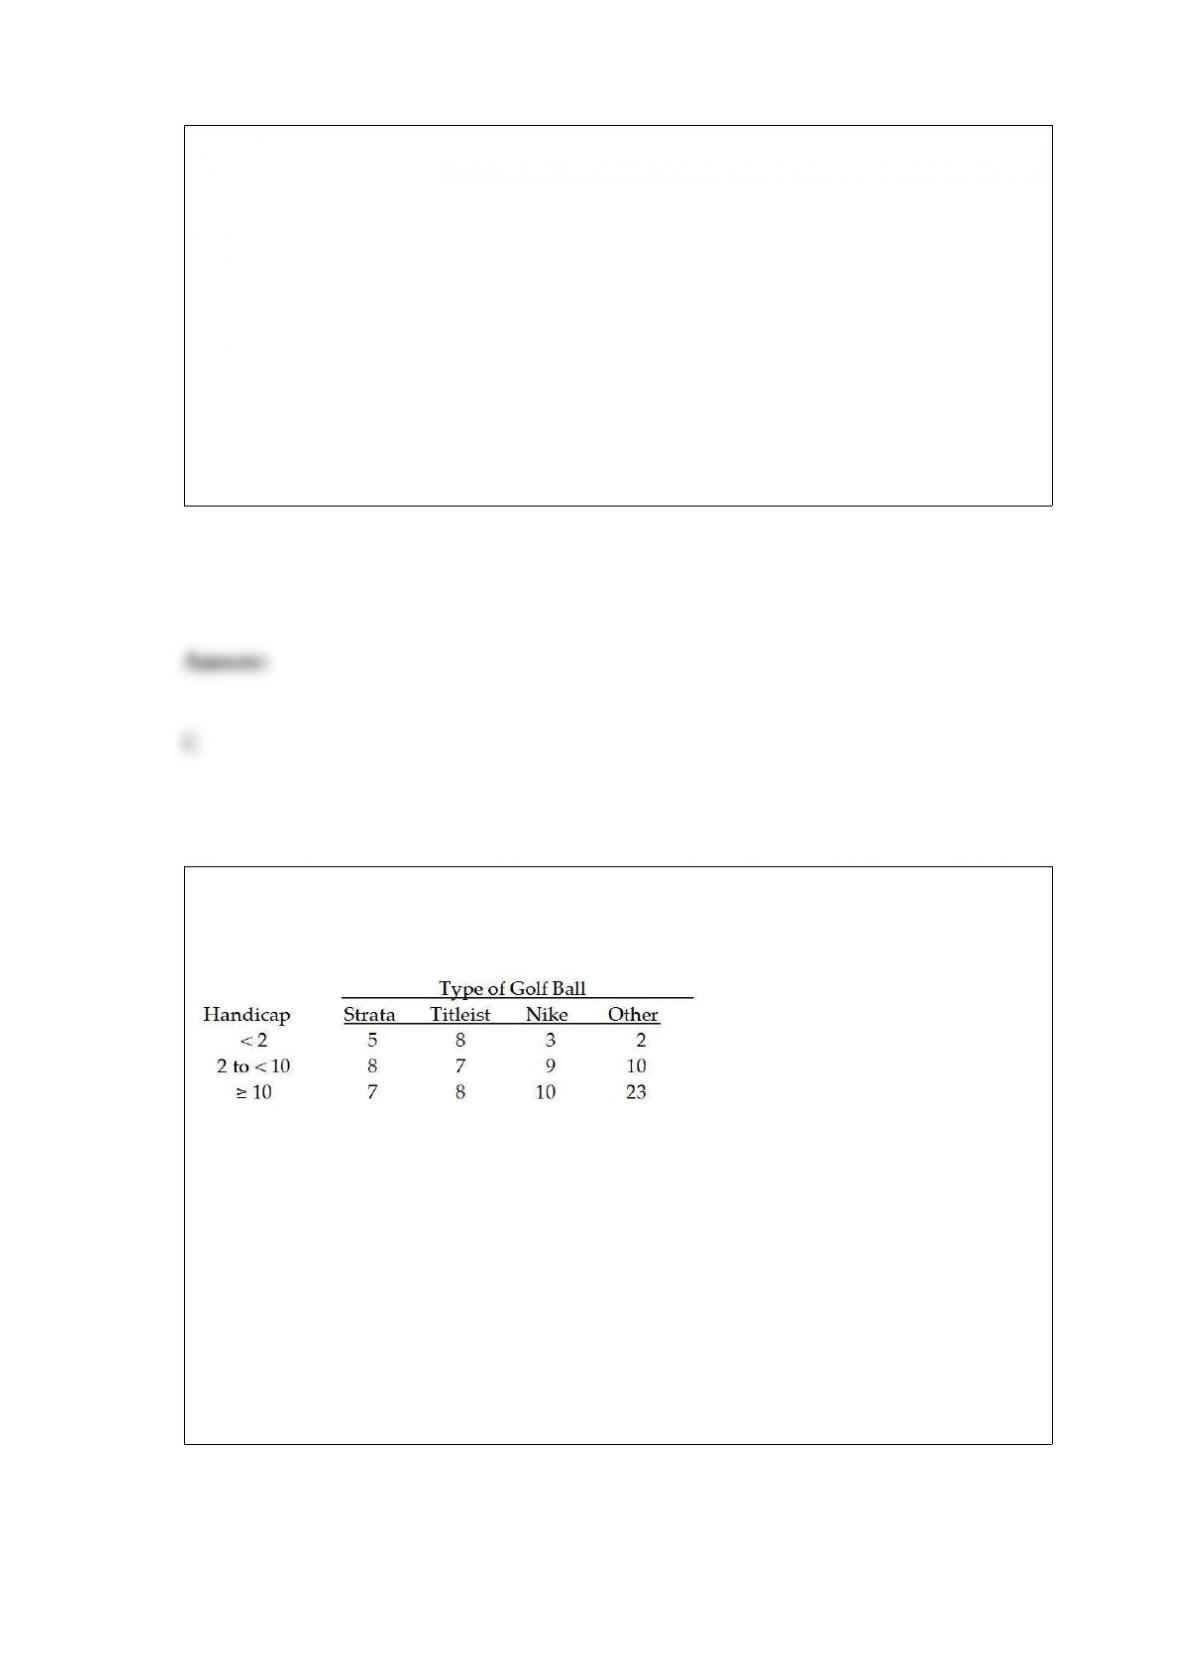
The managers of a local golf course have recently conducted a study of the types of golf
balls used by golfers based on handicap. A joint frequency table for the 100 golfers
covered in the survey is shown below:
Based on these data, if a player has a handicap that is 10 or more, the probability that he
or she will use a Nike golf ball is:
A) 0.21
B) 0.10
C) 0.45
D) 0.48
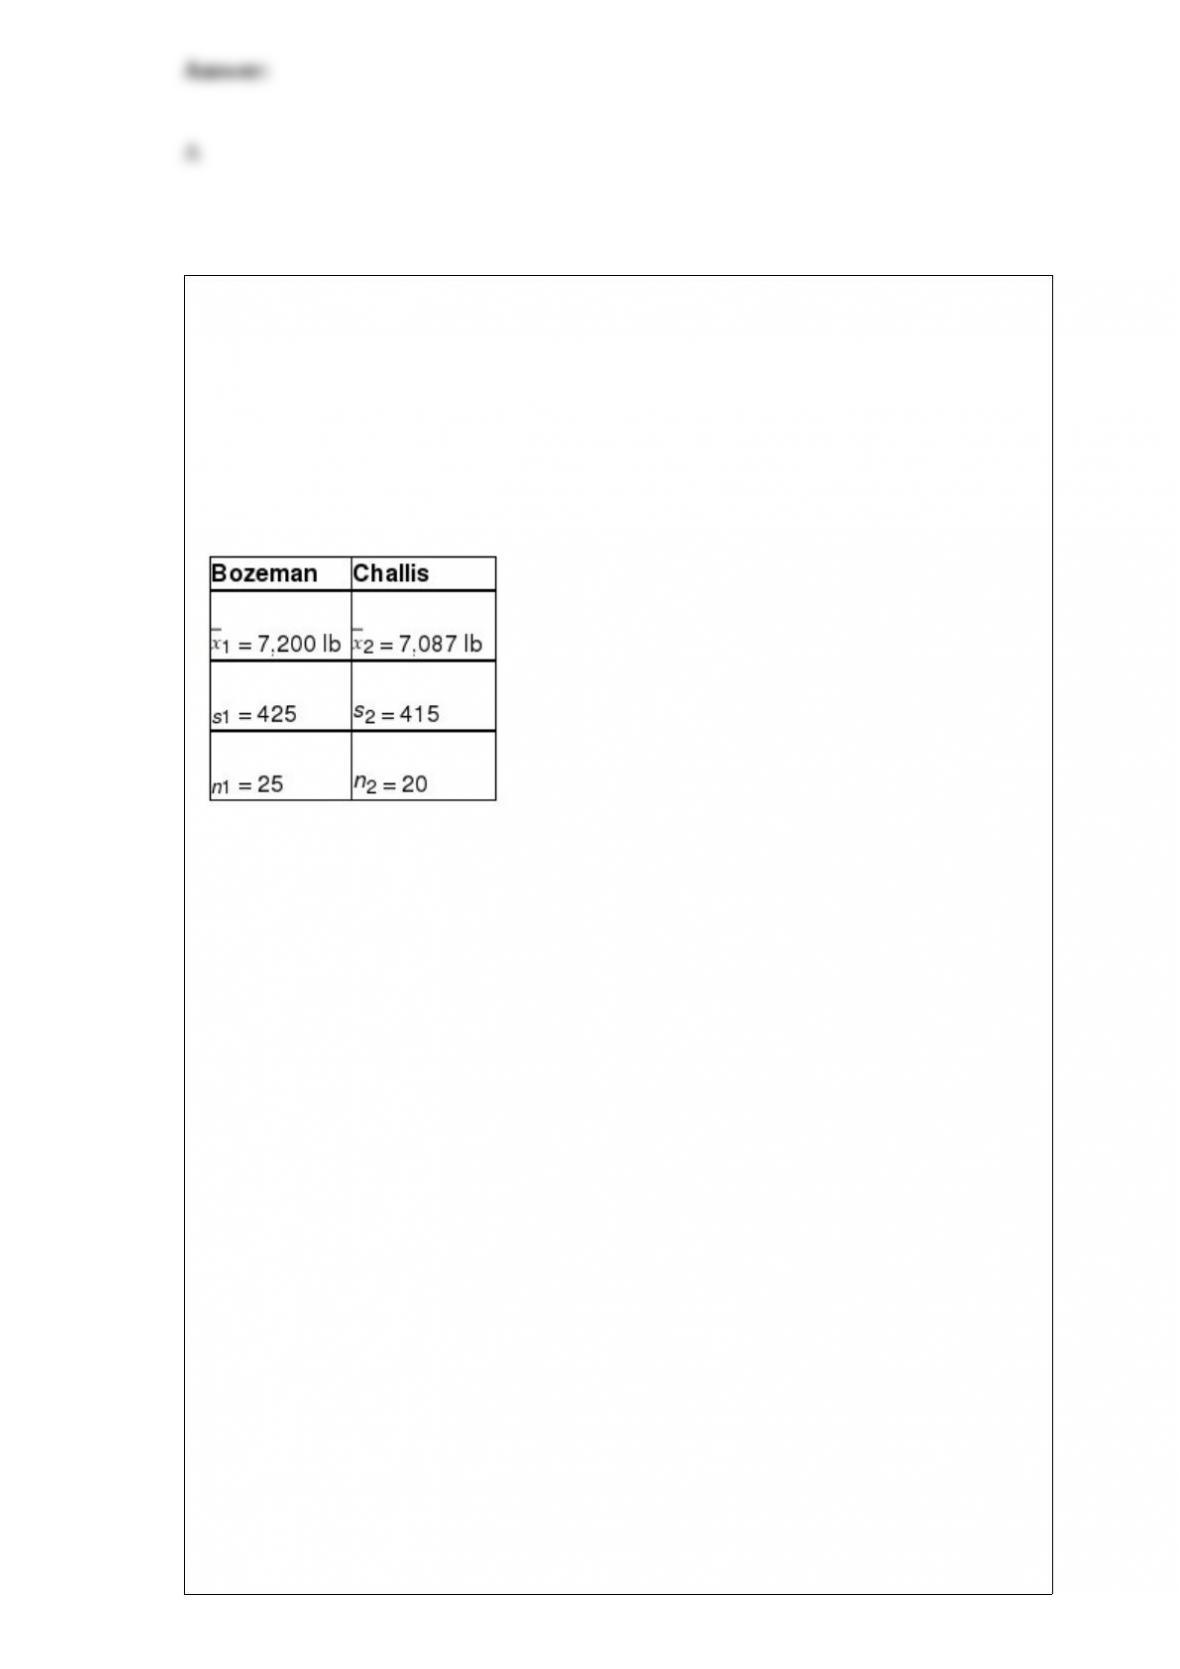
Descent, Inc., produces a variety of climbing and mountaineering equipment. One of its
products is a traditional three-strand climbing rope. An important characteristic of any
climbing rope is its tensile strength. Descent produces the three-strand rope on two
separate production lines: one in Bozeman and the other in Challis. The Bozeman line
has recently installed new production equipment. Descent regularly tests the tensile
strength of its ropes by randomly selecting ropes from production and subjecting them
to various tests. The most recent random sample of ropes, taken after the new
equipment was installed at the Bozeman plant, revealed the following:
Descent’s production managers are willing to assume that the population of tensile
strengths for each plant is approximately normally distributed with equal variances.
Based on the sample results, can Descent’s managers conclude that there is a difference
between the mean tensile strengths of ropes produced in Bozeman and Challis?
Conduct the appropriate hypothesis test at the 0.05 level of significance.
A) Because the calculated value of t = 0.896 is neither less than the lower tail critical
value of t = -2.0167, nor greater than the upper tail critical value of t = 2.0167, do not
reject the null hypothesis. Based on these sample data, at the α = 0.05 level of
significance there is not sufficient evidence to conclude that the average tensile strength
of ropes produced at the two plants is different.
B) Because the calculated value of t = 0.451 is neither less than the lower tail critical
value of t = -2.0167, nor greater than the upper tail critical value of t = 2.0167, do not
reject the null hypothesis. Based on these sample data, at the α = 0.05 level of
significance there is not sufficient evidence to conclude that the average tensile strength
of ropes produced at the two plants is different.
C) Because the calculated value of t = -2.8126 is less than the lower tail critical value of
t = -2.0167, reject the null hypothesis. Based on these sample data, at the α = 0.05 level
of significance there is sufficient evidence to conclude that the average tensile strength
of ropes produced at the two plants is different.
D) Because the calculated value of t = 2.8126 is greater than the lower tail critical value
of t = -2.0167, reject the null hypothesis. Based on these sample data, at the α = 0.05

level of significance there is sufficient evidence to conclude that the average tensile
strength of ropes produced at the two plants is different.
An advertising company has developed a new ad for one of the national car
manufacturing companies. The ad agency is interested in testing whether the proportion
of favorable response to the ad is the same between male adults versus female adults. It
plans on conducting the test using an alpha level equal to 0.05. A sample of 100 adults
of each gender will be used in the study. Each person will be asked to view the ad and
indicate whether they find the ad to be “pleasing” or not. The samples resulted in 57
males that liked the ad and 47 females that liked the ad. Based on this information, what
is the value of the test statistic?
A) z = 1.645
B) z = 1.42
C) t = 2.234
D) z = 1.024
Even before the record gas prices during the summer of 2008, an article written by Will
Lester of the Associated Press reported on a poll in which 80% of those surveyed say
that Americans who currently own a SUV (sport utility vehicle) should switch to a more
fuel-efficient vehicle to ease America’s dependency on foreign oil. This study was
conducted by the Pew Research Center for the People & the Press. As a follow-up to
this report, a consumer group conducted a study of SUV owners to estimate the mean
mileage for their vehicles. A simple random sample of 91 SUV owners was selected,

and the owners were asked to report their highway mileage. The following results were
summarized from the sample data:
= 18.2 mpg
s = 6.3 mpg
Based on these sample data, compute and interpret a 90% confidence interval estimate
for the mean highway mileage for SUVs.
A) (15.4, 21.0)
B) (12.4, 24.0)
C) (17.6, 18.8)
D) (17.1, 19.3)
The director of a state agency believes that the average starting salary for clerical
employees in the state is less than $30,000 per year. To test her hypothesis, she has
collected a simple random sample of 100 starting clerical salaries from across the state
and found that the sample mean is $29,750. Assuming the population standard deviation
is known to be $2,500 and the significance level for the test is to be 0.05, what is the
critical value (stated in dollars)?
A) For alpha = .05 and a one tailed, lower tail test, the critical value is z = -1.645.
Solving for the critical x-bar: -1.645 = (x-bar – 30,000)/250, x-bar = $29,588.75
B) For alpha = .05 and a one tailed, lower tail test, the critical value is z = -1.96.
Solving for the critical x-bar: -1.96 = (x-bar – 30,000)/250, x-bar = $34,211.14
C) For alpha = .05 and a one tailed, lower tail test, the critical value is z = -1.645.
Solving for the critical x-bar: -1.645 = (x-bar – 30,000)/250, x-bar = $34,211.14
D) For alpha = .05 and a one tailed, lower tail test, the critical value is z = -1.96.
Solving for the critical x-bar: -1.96 = (x-bar – 30,000)/250, x-bar = $30,411.25

A company that makes shampoo wants to test whether the average amount of shampoo
per bottle is 16 ounces. The standard deviation is known to be 0.20 ounces. Assuming
that the hypothesis test is to be performed using 0.10 level of significance and a random
sample of n = 64 bottles, which of the following would be the correct formulation of the
null and alternative hypotheses?
A) H0 : = 16
HA : = 16
B) H0 : μ = 16
HA : μ ≠ 16
C) H0 : μ ≥ 16
HA : μ < 16
D) H0 : ≥ 16
HA : < 16
A major retail clothing store is interested in estimating the difference in mean monthly
purchases by customers who use the store’s in-house credit card versus using a Visa,
Mastercard, or one of the other major credit cards. To do this, it has randomly selected a
sample of customers who have made one or more purchases with each of the types of
credit cards. The following represents the results of the sampling:
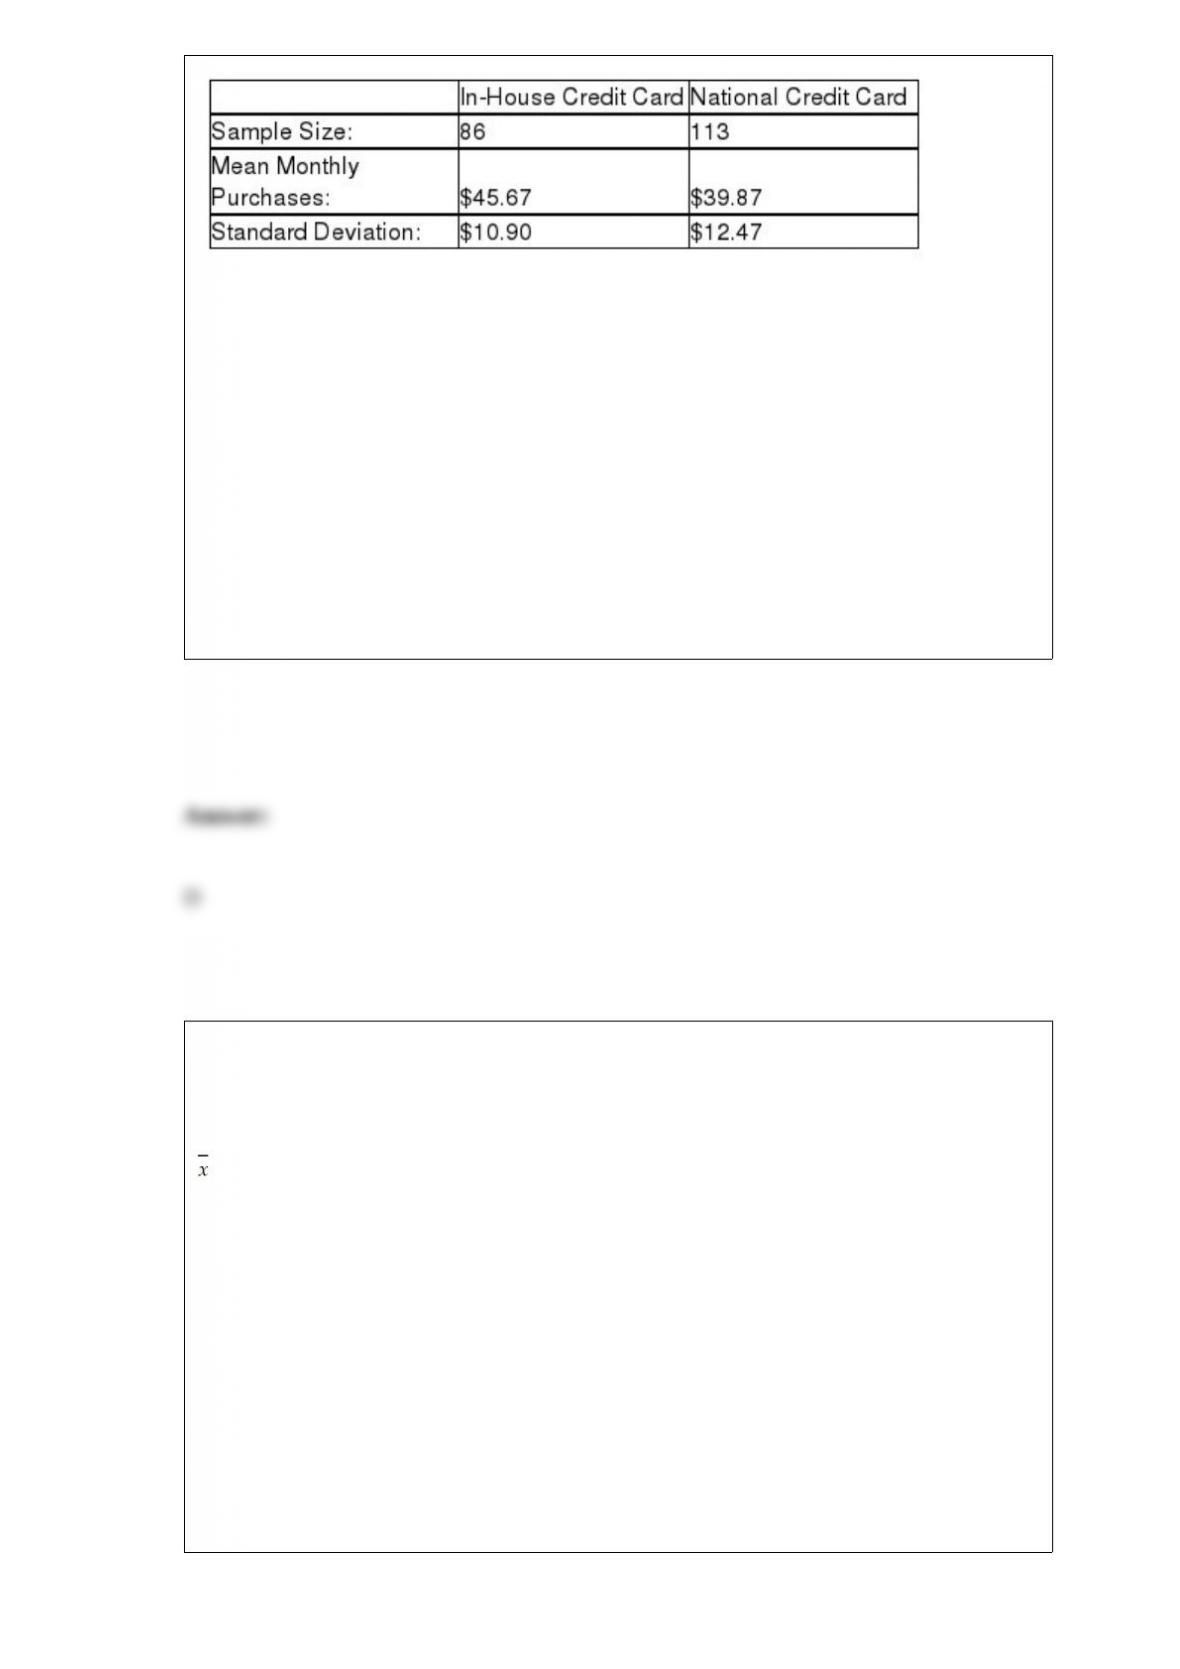
Suppose that the managers wished to test whether there is a statistical difference in the
mean monthly purchases by customers using the two types of credit cards, using a
significance level of .05, what is the value of the test statistic assuming the standard
deviations are known?
A) t = 3.49
B) z = 11.91
C) z = 2.86
D) z = 3.49
In an application to estimate the mean number of miles that downtown employees
commute to work roundtrip each day, the following information is given:
n = 20
= 4.33
s = 3.50
Based on this information, the upper limit for a 95 percent confidence interval estimate
for the true population mean is:
A) about 5.97 miles.
B) about 7.83 miles.
C) nearly 12.0 miles.
D) about 5.86 miles.

A distribution has a coefficient of variation of 65 percent and mean of 74. What is the
value of the standard deviation?
A) 0.65
B) 4810
C) 113.8
D) 48.1
Which of the following data collection methods is most likely to generate the largest
nonresponse?
A) Mail surveys
B) Direct observation
C) Telephone surveys
D) Personal interviews

A claim was recently made on national television that two of every three doctors
recommend a particular pain killer. Suppose a random sample of n = 300 doctors
revealed that 180 said that they would recommend the painkiller. If the TV claim is
correct, what is the probability of 180 or fewer in the sample agreeing?
A) 0.4929
B) 0.0049
C) 0.9929
D) 0.0142
Joint frequency distributions are used to display:
A) the histograms of two variables analyzed simultaneously.
B) the number of occurrences at each of the possible joint occurrences of two variables.
C) the cumulative distribution of a variable with two possible outcomes.
D) the relative frequency of two variables.
Consider the situation in which a study was recently conducted to determine whether
the median price of houses is the same in Seattle and Phoenix. The following data were

collected.
Given these data, if a Mann-Whitney U test is to be used, the U statistic for Seattle is:
A) 45
B) 35
C) 22
D) 14
The asking price for homes on the real estate market in Baltimore has a mean value of
$286,455 and a standard deviation of $11,200. The mean and standard deviation in
asking price for homes in Denver are $188,468 and $8,230, respectively. Recently, one
home sold in each city where the asking price for each home was $193,000. Based on
these data, which of the following conclusions can be made?
A) The two homes have approximately the same standardized values.
B) The distribution of asking prices in the two cities is bell-shaped.
C) The house in Baltimore is relatively farther from the mean than the house in Denver.
D) The asking prices of homes in Denver is less variable than those in Baltimore.

The box and whisker plot CANNOT be used to identify:
A) skewedness.
B) centerness.
C) outliers.
D) symmetry.
Dynamic random-access memory (DRAM) memory chips are made from silicon wafers
in manufacturing facilities through a very complex process called wafer fabs. The
wafers are routed through the fab machines in an order that is referred to as a recipe.
The wafers may go through the same machine several times as the chip is created. The
data file DRAM Chips contains a sample of processing times, measured in fractions of
hours, at a particular machine center for one chip recipe.
Compute the mean processing time.
A) 0.24 minutes
B) 0.22 minutes
C) 0.31 minutes
D) 0.33 minutes

For the following hypothesis test
With n = 100 and p = 0.66, state the conclusion.
A) Because the computed value of z = -2.0785 is less than the critical value of z = -1.96,
reject the null hypothesis and conclude that the population proportion is less than 0.75.
B) Because the computed value of z = -0.3412 is less than the critical value of z =
-1.645, reject the null hypothesis and conclude that the population proportion is less
than 0.75.
C) Because the computed value of z = 1.4919 is greater than the critical value of z =
-1.96, accept the null hypothesis and conclude that the population proportion is greater
than 0.75.
D) Because the computed value of z = -0.3412 is greater than the critical value of z =
-1.645, accept the null hypothesis and conclude that the population proportion is greater
than 0.75.
Under what circumstances does the variance inflation factor signal that
multicollinearity may be a problem?
A) When the value of VIF exceeds the size of the sample from which the regression
model was developed
B) When the VIF value is approximately 1.0
C) When the VIF is greater than or equal to 5
D) When the VIF is a negative value
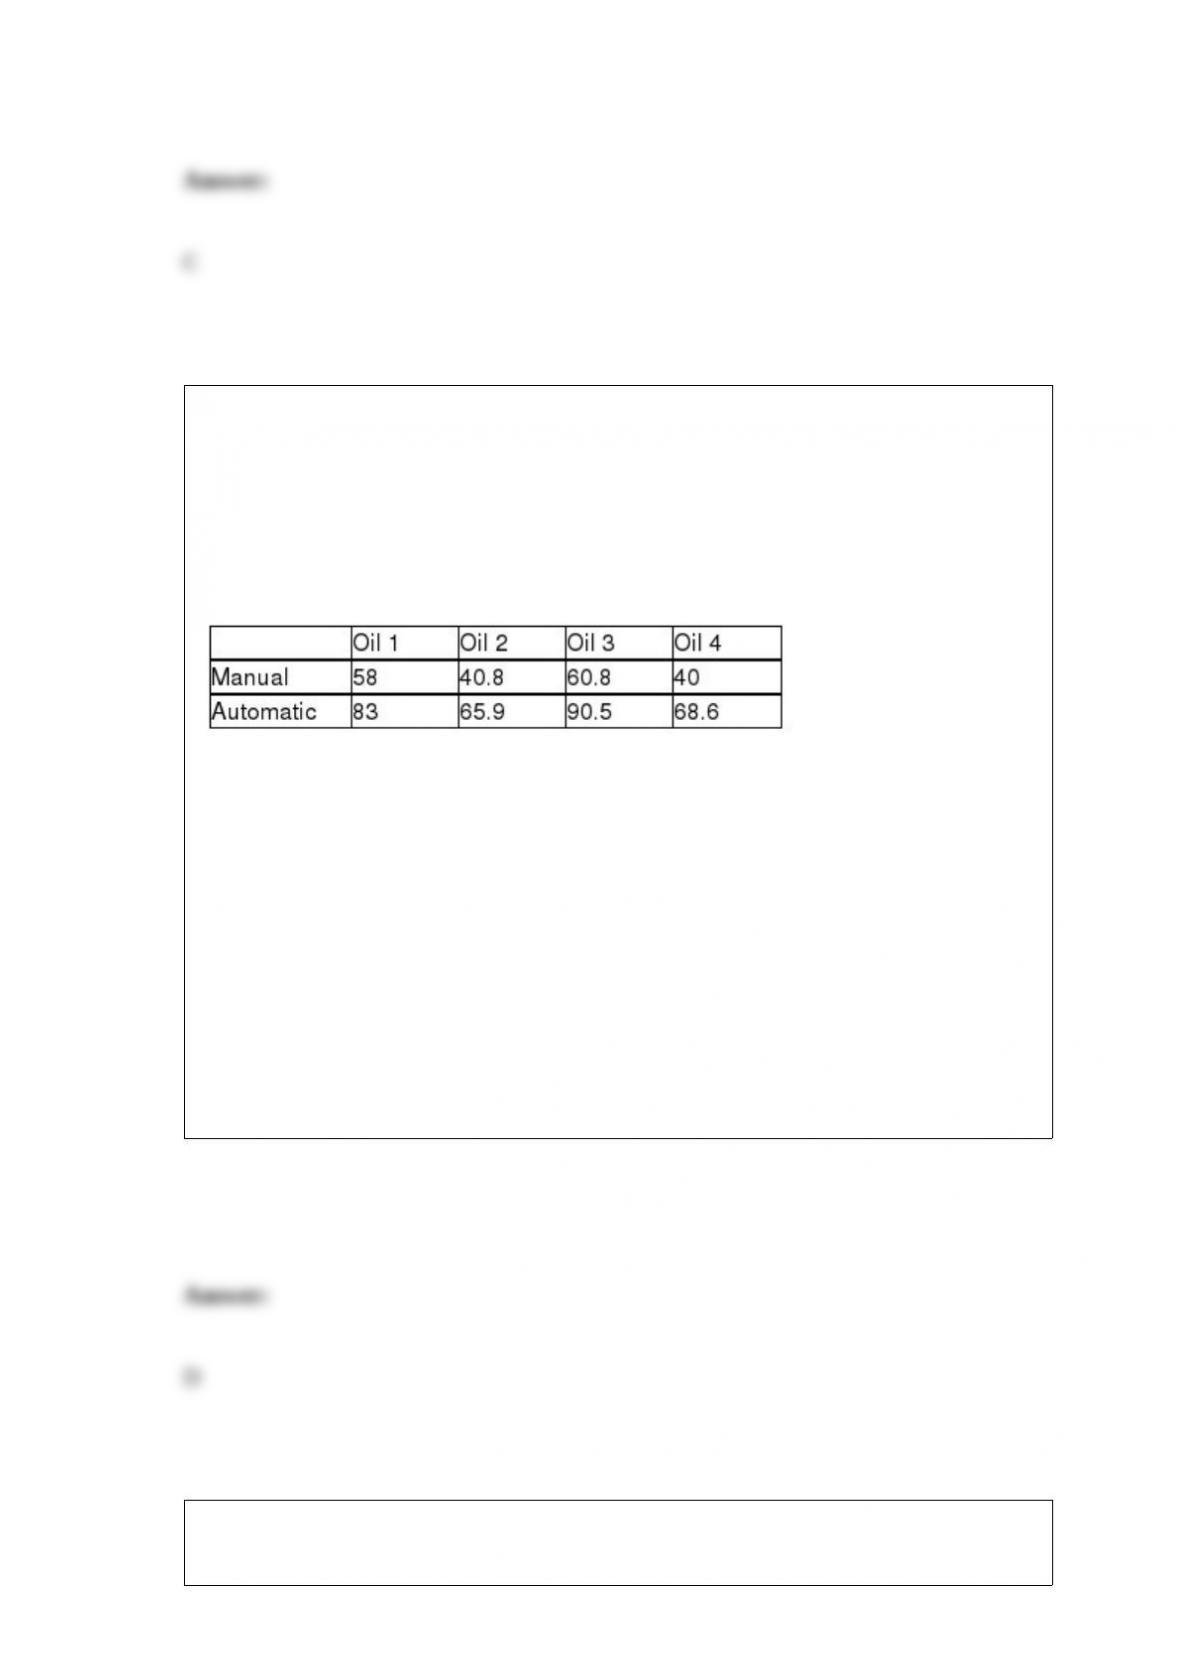
A car company is interested in testing to see whether the mean miles that a car engine
will last without changing oil is the same or different depending on which brand of oil
is used. The engineers also wish to control for the type of transmission (manual or
automatic) that is used. To conduct this test, the car company obtains enough engines so
that all four oil brands can be tested in a design that involves no replication. The
following data reflect the miles the engine lasted until problems were encountered. Data
are in thousands of miles.
Assuming that the hypothesis tests are conducted using a significance level equal to
0.05, which of the following statements is true?
A) Based on the data, Oil 1 and Oil 3 give statistically more miles on average than do
the other two oils.
B) The type of transmission does seem to have an impact on the mean miles that an
engine will last.
C) The F-critical value for testing whether blocking is effective is 10.128.
D) All of the above are true.
Consider the following data, which represent the number of miles that employees
commute from home to work each day. There are two samples: one for males and one
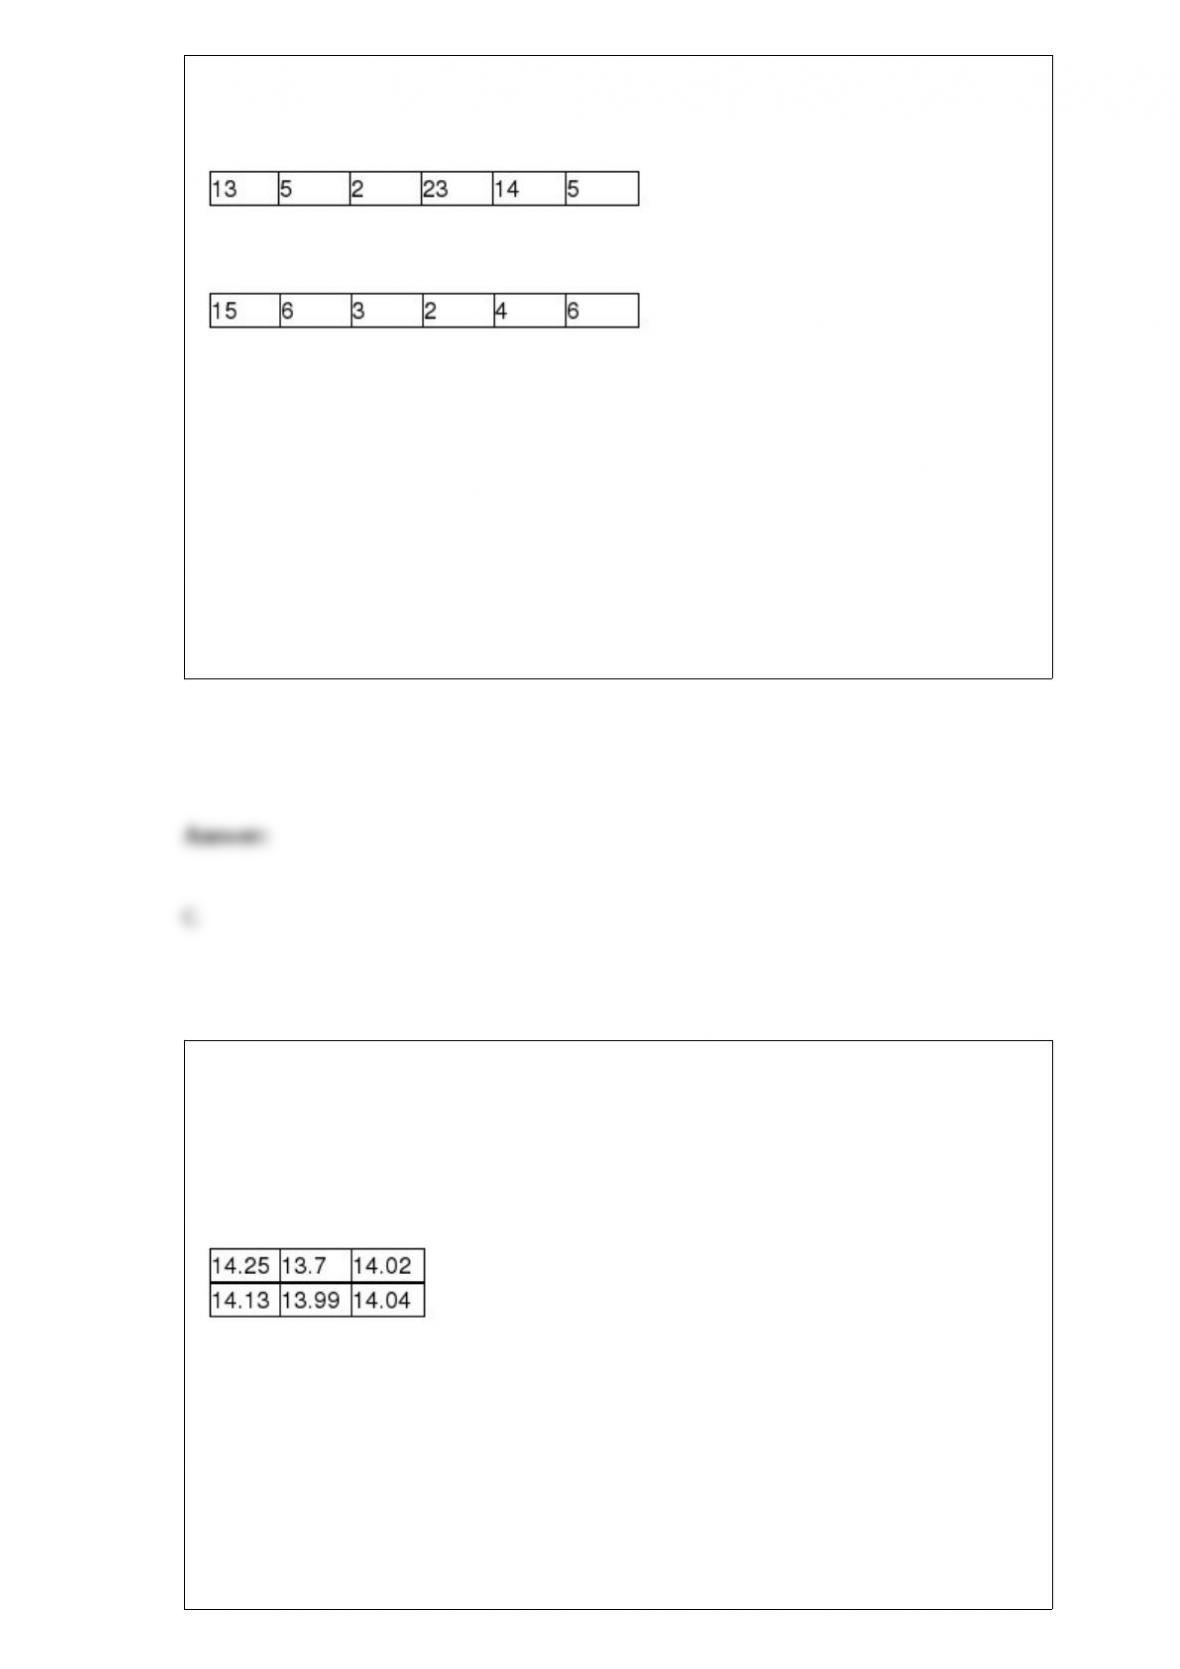
for females.
Males:
Females:
Which of the following statements is true?
A) The female distribution is more variable since the range for the females is greater
than for the males.
B) Females in the sample commute farther on average than do males.
C) The males in the sample commute farther on average than the females.
D) Males and females on average commute the same distance.
The R.D. Wilson Company makes a soft drink dispensing machine that allows
customers to get soft drinks from the machine in a cup with ice. When the machine is
running properly, the average number of fluid ounces in the cup should be 14.
Periodically the machines need to be tested to make sure that they have not gone out of
adjustment. To do this, six cups are filled by the machine and a technician carefully
measures the volume in each cup. In one such test, the following data were observed:
Based on these sample data, which of the following is true if the significance level is .
05?
A) No conclusion can be reached about the status of the machine based on a sample
size of only six cups.
B) The null hypothesis cannot be rejected since the test statistic is approximately t =
0.20, which is not in the rejection region.
C) The null hypothesis can be rejected since the sample mean is greater than 14.
D) The null can be rejected because the majority of the sample values exceed 14.
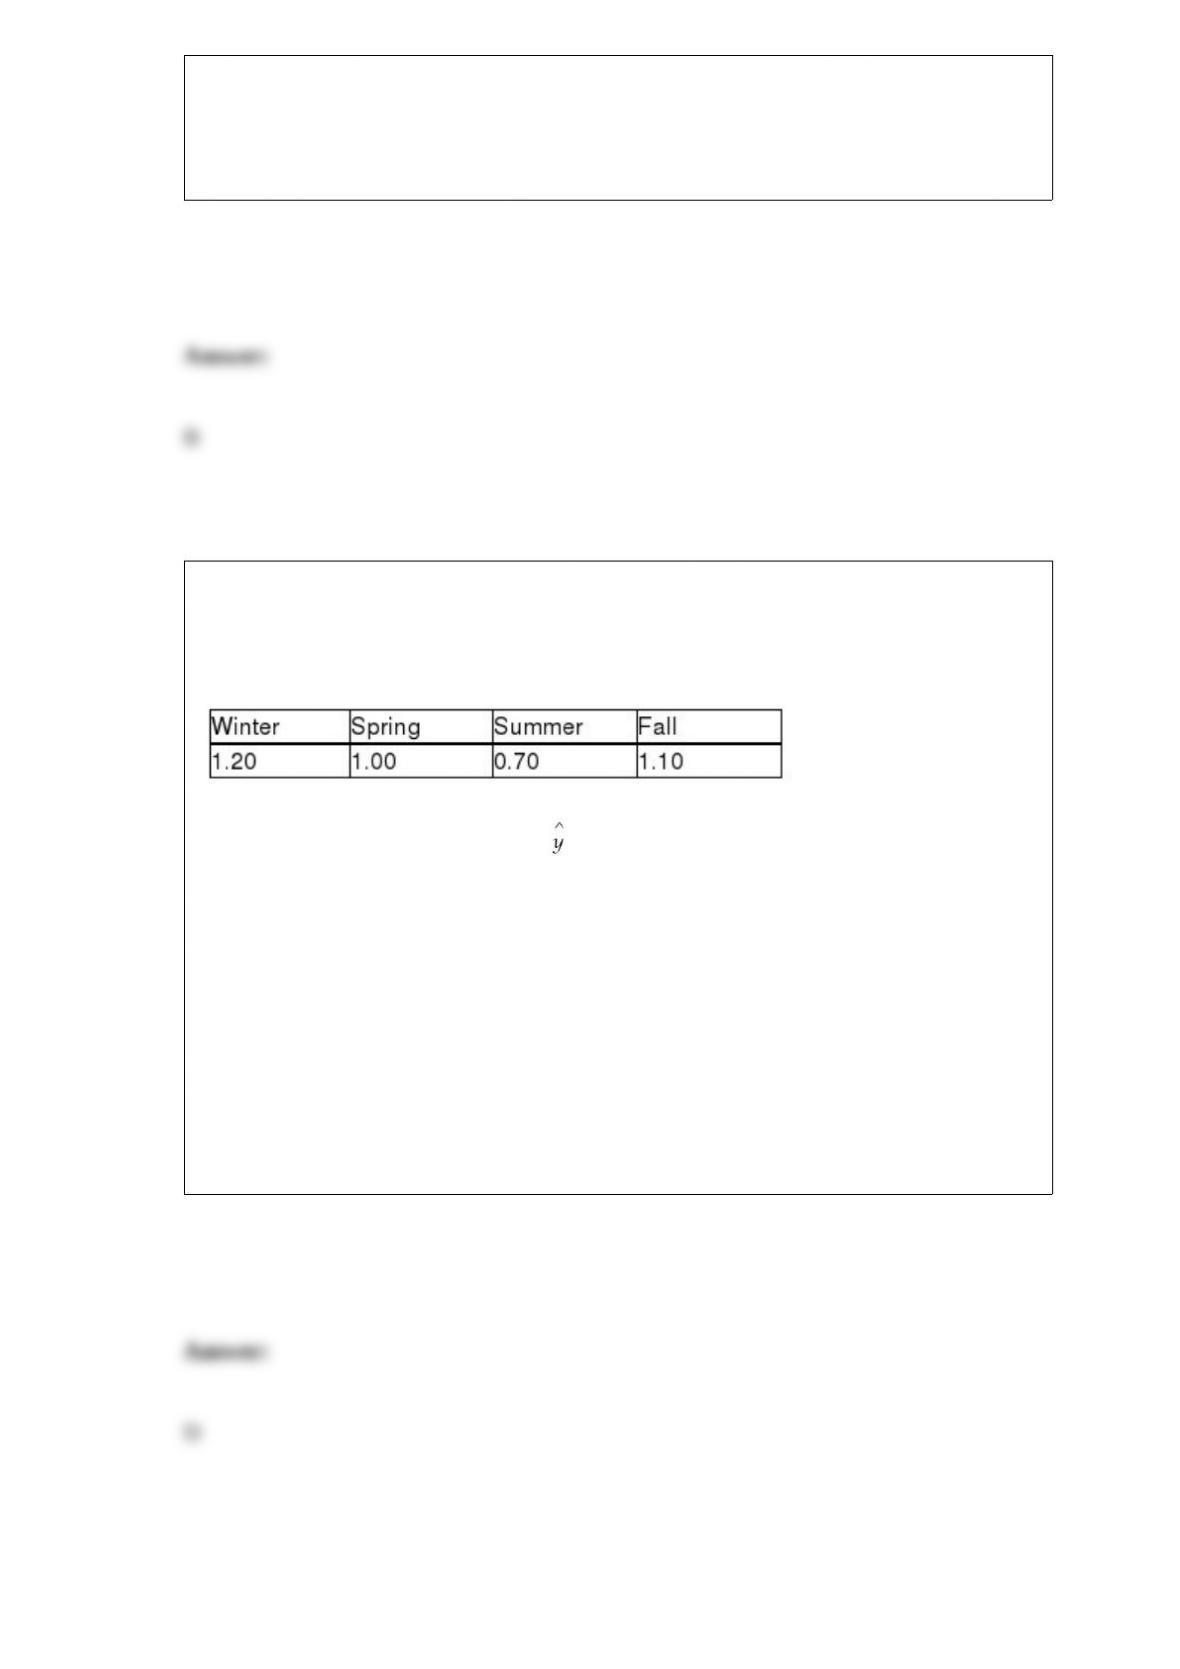
A company has developed a linear trend regression model based on 16 quarters of data.
The independent variable is the measure of time (t = 1 thru 16 where quarter 1 is winter
quarter, 2 is spring, etc.). The company has also developed seasonal indexes for each
quarter as follows:
The linear trend forecast equation is: = 120 + 56t.
Given this information, which of the four quarters beginning next winter (period t = 17)
will have the highest seasonally adjusted forecast?
A) Winter
B) Spring
C) Summer
D) Fall

A frequency histogram should be computed from which type of data?
A) Quantitative data
B) Categorical data
C) Nominal level data
D) Ordinal data