
When determining the sample size for a proportion, if you have no previous
information available to estimate p, then the best value to use is π = 0.5.
When testing whether two paired populations have equal medians and the sample sizes
are large, it is appropriate to convert the Wilcoxon Matched-Pairs Signed Rank test to a
paired sample t-test.
An advantage of exponential smoothing techniques over a regression-based trend model
is that the exponential smoothing model allows us to weigh each observation equally,
thereby giving a fairer method of developing a forecast.
A potato chip manufacturer has two packaging lines and wants to determine if the
variances differ between the two lines. They take a sample of n= 15 bags from each line
and find the following:

The value of the test statistic is F = 1.5
The time-series component that implies a long-term upward or downward pattern is
called the trend component.
A study has recently been conducted by a major computer magazine publisher in which
the objective was to develop a multiple regression model to explain the variation in
price of personal computers. Three independent variables were used. The following
computer printout shows the final output. However, several values are omitted from the
printout.

Given this information, the regression model explains just under 70 percent of the
variation in the price of personal computers.
The director of the city Park and Recreation Department claims that the mean distance
people travel to the city’s greenbelt is more than 5.0 miles. Assume that the population
standard deviation is known to be 1.2 miles and the significance level to be used to test
the hypothesis is 0.05 when a sample size of n = 64 people are surveyed. Given this
information, if the sample mean is 15.90 miles, the null hypothesis should be rejected.
A positive population slope of 12 (β1 = 12) means that a 1-unit increase in x causes an
average 12-unit increase in y.
The editor of a local newspaper is interested in determining the percentage of
subscribers who read the paper’s editorials. The statistical technique that he would use

is called estimation.
The margin of error is one-half the width of the confidence interval.
Three brands of running shoes are each tested by 10 different runners. The amount of
wear on the sole of the shoes is then measured. The objective is to determine if there is
any difference among the three brands of shoes based on how long the soles last. The
null hypothesis is:
H0 : μ1 = μ2 = μ3.
A distribution is said to be symmetric when the sample mean and the population mean
are equal.

Open-end questions are typically included in a survey when the objective is to provide
the maximum opportunity for the respondent to express his or her opinion.
If one independent variable affects the relationship between a second independent
variable and the dependent variable, it is said that there is interaction between the two
independent variables.
A sampling distribution for is the distribution of all possible sample means that could
be computed from the possible samples of a given sample size.

It has been determined the weight of bricks made by the Dillenger Stone Company is
uniformly distributed between 1 and 1.5 pounds. Based on this information, the
probability that two randomly selected bricks will each weigh more than 1.3 pounds is
0.16.
If the standard error for the sampling distribution of a proportion is equal to 0.0327 and
if the population proportion, p, is equal to .80, the sample size must be 150.
Based on the empirical rule we can assume that all bell-shaped distributions have
approximately 95 percent of the values within 2 standard deviations of the mean.
When calculating prediction intervals for predicted values of y based on a given x, all
95 percent prediction intervals will be of equal width.

Populations with larger means will also have larger standard deviations since the data
will be more spread out for populations with larger means.
When a construction company bids on a contract, the events will be win or lose. The
closer the probability is to 0.50, the greater the uncertainty about whether the company
will win or lose the bid.
The distribution of bankcard balances for customers is highly right-skewed with a mean
of $1,100 and a standard deviation equal to $250. Based on this information,
approximately 68 percent of the customers will have bank balances between $850 and
$1,350.

Assume that n = 18 people are asked a yes/no survey question, and 6 people say “yes”
while 12 people say “no.” Based on this information the sample proportion can be
assumed normally distributed.
The statistical process control (SPC) chart is one of the most important tools for
identifying important issues to improve quality.
After taking a speed-reading course, students are supposed to be able to read faster than
they could before taking the course. A pilot sample of n = 25 students showed a mean
increase of 300 words per minute with a standard deviation equal to 60 words per
minute. To estimate the population mean with 95 percent confidence and a margin of
error of 10 minutes, the required sample size is approximately 139 students.

When calculating a confidence interval, the reason for using the t-distribution rather
than the normal distribution for the critical value is that the population standard
deviation is unknown.
When a decision maker determines the required sample size for estimating a population
mean, a change in the confidence level will result in a change in the required sample
size, provided that the margin of error is also modified accordingly.
One of the key quality characteristics in many service environments is that the variation
in service time be reasonably small. Recently, a major amusement park company
initiated a new line system at one of its parks. It then wished to compare this new
system with the old system in place at a comparable park in another state. At issue is
whether the standard deviation in waiting time is less under the new line system than
under the old line system. The following information was collected:

Assuming that it wishes to conduct the test using a 0.05 level of significance, the test
statistic will be .
Suppose it is known that the mean purchase price for all homes sold last year in
Blacksburg, Virginia was $203,455. Recently, two studies were done on home sales
prices. In the first study, a random sample of 200 homes was selected from the
population. In the second study, a random sample of 60 homes was selected. Based on
this information, we know that the second study would contain more sampling errors
than the first study due to the smaller sample size.
A large tire manufacturing company has claimed that its top line tire will average more
than 80,000 miles. If a consumer group wished to test this claim, they would formulate
the following null and alternative hypotheses:
H0 : μ ≥ 80,000
Hα : μ ≠ 80,000

In a double smoothing model, large values for the two smoothing constants will result
in greater smoothing of the time series.
If we wish to test whether two related populations have equal medians, an appropriate
nonparametric test to use is:
A) the Mann-Whitney U test.
B) the Kruskal-Wallis test.
C) the Wilcoxon signed rank test.
D) the Wilcoxon matched-pairs signed rank test.
Which of the following is true about the difference between stem and leaf diagrams and
histograms?

A) There is no difference.
B) The stem and leaf diagram shows more information by showing the individual
values.
C) The histogram shows the shape center and spread of the distribution while the stem
and leaf does not.
D) The stem and leaf diagram shows less information than a histogram.
A package delivery service claims that no more than 5 percent of all packages arrive at
the address late. Assuming that the conditions for the binomial hold, if a sample of size
10 packages is randomly selected and the 5 percent rate holds, what is the probability
that more than 2 packages will be delivered late?
A) 0.0115
B) 0.0105
C) 0.0862
D) 0.0746
Which of the following is a key difference between a bar chart and a histogram?
A) A bar chart typically has gaps between the bars while a histogram has no gaps.

B) A bar chart is developed to analyze a continuous variable, while a histogram is used
to analyze discrete variables.
C) Both A and B are correct.
D) There is actually no real difference between a bar chart and a histogram.
Construct a 95% confidence interval estimate for the population mean given the
following values:
A) (295.54, 304.56)
B) (297.42, 302.58)
C) (296.52, 303.48)
D) (293.18, 306.82)
A major textbook publisher has a contract with a printing company. Part of the contract
stipulates that no more than 5 percent of the pages should have any type of printing
error. Suppose that the company selects a random sample of 400 pages and finds 33 that
have an error. If the printer is meeting the standard, what is the probability that a sample
would have 33 or more errors?
A) 0.1245

B) 0.4986
C) 0.0014
D) 0.1250
As the automobile accident rate increases, insurers are forced to increase their premium
rates. Companies such as Allstate have recently been running a campaign they hope will
result in fewer accidents by their policyholders. For each six-month period that a
customer goes without an accident, Allstate will reduce the customer’s premium rate by
a certain percentage. Companies like Allstate have reason to be concerned about driving
habits, based on a survey conducted by Drive for Life, a safety group sponsored by
Volvo of North America, in which 1,100 drivers were surveyed. Among those surveyed,
74% said that careless or aggressive driving was the biggest threat on the road.
One-third of the respondents said that cell phone usage by other drivers was the driving
behavior that annoyed them the most.
Based on these data, assuming that the sample was a simple random sample, construct
and interpret a 95% confidence interval estimate for the true proportion in the
population of all drivers who are annoyed by cell phone users.
A) (0.313, 0.347)
B) (0.306, 0.354)
C) (0.302, 0.358)
D) (0.316, 0.344)

Portfolio A of a collection of stocks is considered more risky than portfolio B if:
A) portfolio A has a higher mean than portfolio B.
B) portfolio A has a higher variance than portfolio B.
C) portfolio A has a higher standard deviation.
D) portfolio A has a higher coefficient of variation than portfolio B.
Given the following time series data:
and using smoothing constants of alpha = 0.3, the exponential smoothing forecast for
time period 3 is
A) 18
B) 19.2
C) 20
D) 40

Which of the following statements is true?
A) The mean of a population will always be larger than the population standard
deviation.
B) The mean of the population will generally be larger than the mean of the sample
selected from that population.
C) The population mean and a sample mean for a sample selected from that population
will usually be different values.
D) The population mean and sample mean will always be identical.
The high temperature is recorded each day for a period of 1 year. This is an example of:
A) nominal data.
B) ordinal data.
C) time-series data.
D) cross-sectional data.
Recently a shipping company took 30 samples, each of size n = 100, of packages that it
was responsible for delivering. Out of the 3,000 total packages, 300 were delivered late.
In setting up an appropriate process control chart, what would be the correct 3-sigma
upper control limit value?
A) 0.03
B) 0.13
C) 0.19
D) 0.07
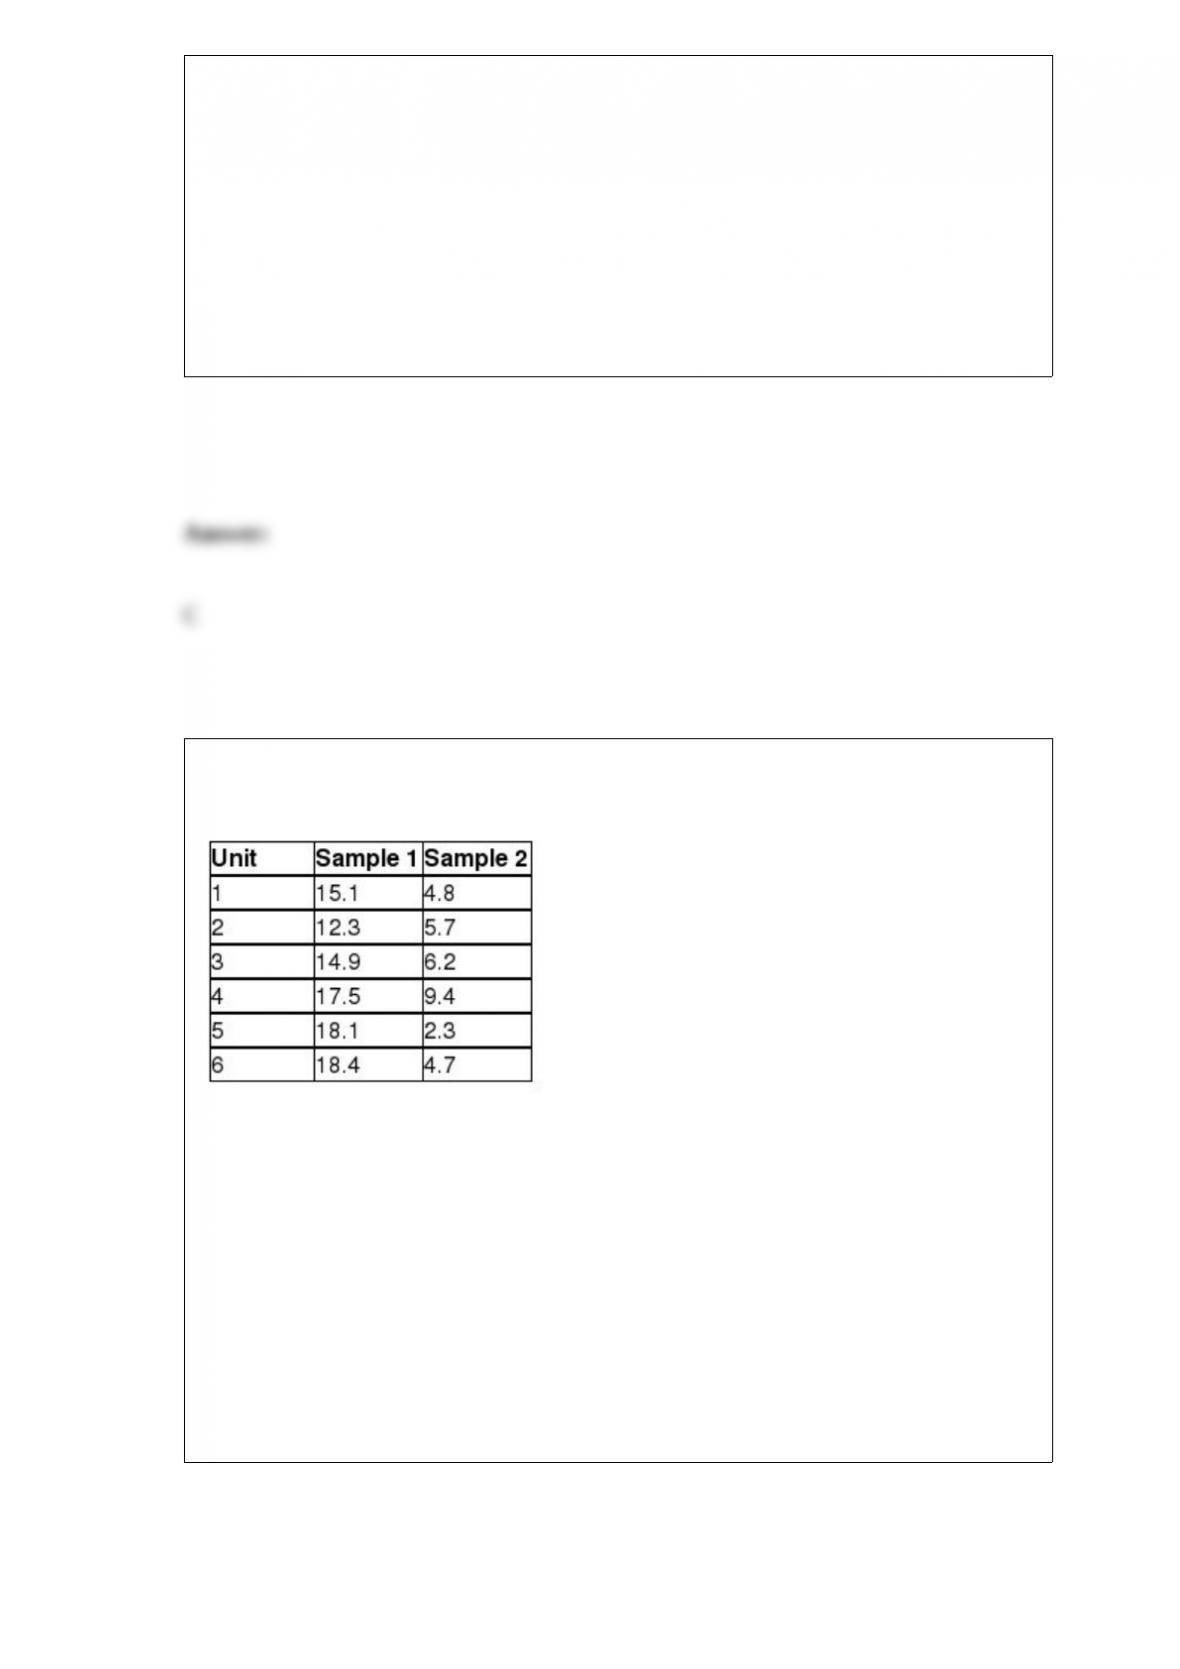
The following samples are observations taken from the same elements at two different
times:
Perform a test of hypothesis to determine if the difference in the means of the
distribution at the first time period is 10 units larger than at the second time period. Use
a level of significance equal to 0.10.
A) Because t = 1.98 > 2.0150, the null hypothesis must be rejected.
B) Because t = 1.67 > 2.0150, the null hypothesis must be rejected
C) Because t = 1.02 < 2.0150, the null hypothesis cannot be rejected.
D) Because t = 0.37 < 2.0150, the null hypothesis cannot be rejected.

When employing a small sample Mann-Whitney U test for a two-tailed test, which of
the following is true?
A) The sample sizes need to be equal.
B) Select as the test statistic the smaller of the two U values.
C) Select either of the U values to be the test statistic.
D) The alpha level should be doubled.
You are given the following results of a paired-difference test:
= -4.6
sd = 0.25
n = 16
Construct a 99% confidence interval estimate for the paired difference in mean values.
A) -2.912 ——– -2.718
B) -4.784 ——– -4.416
C) -5.241 ——– -4.971
D) -3.141 ——– -2.812
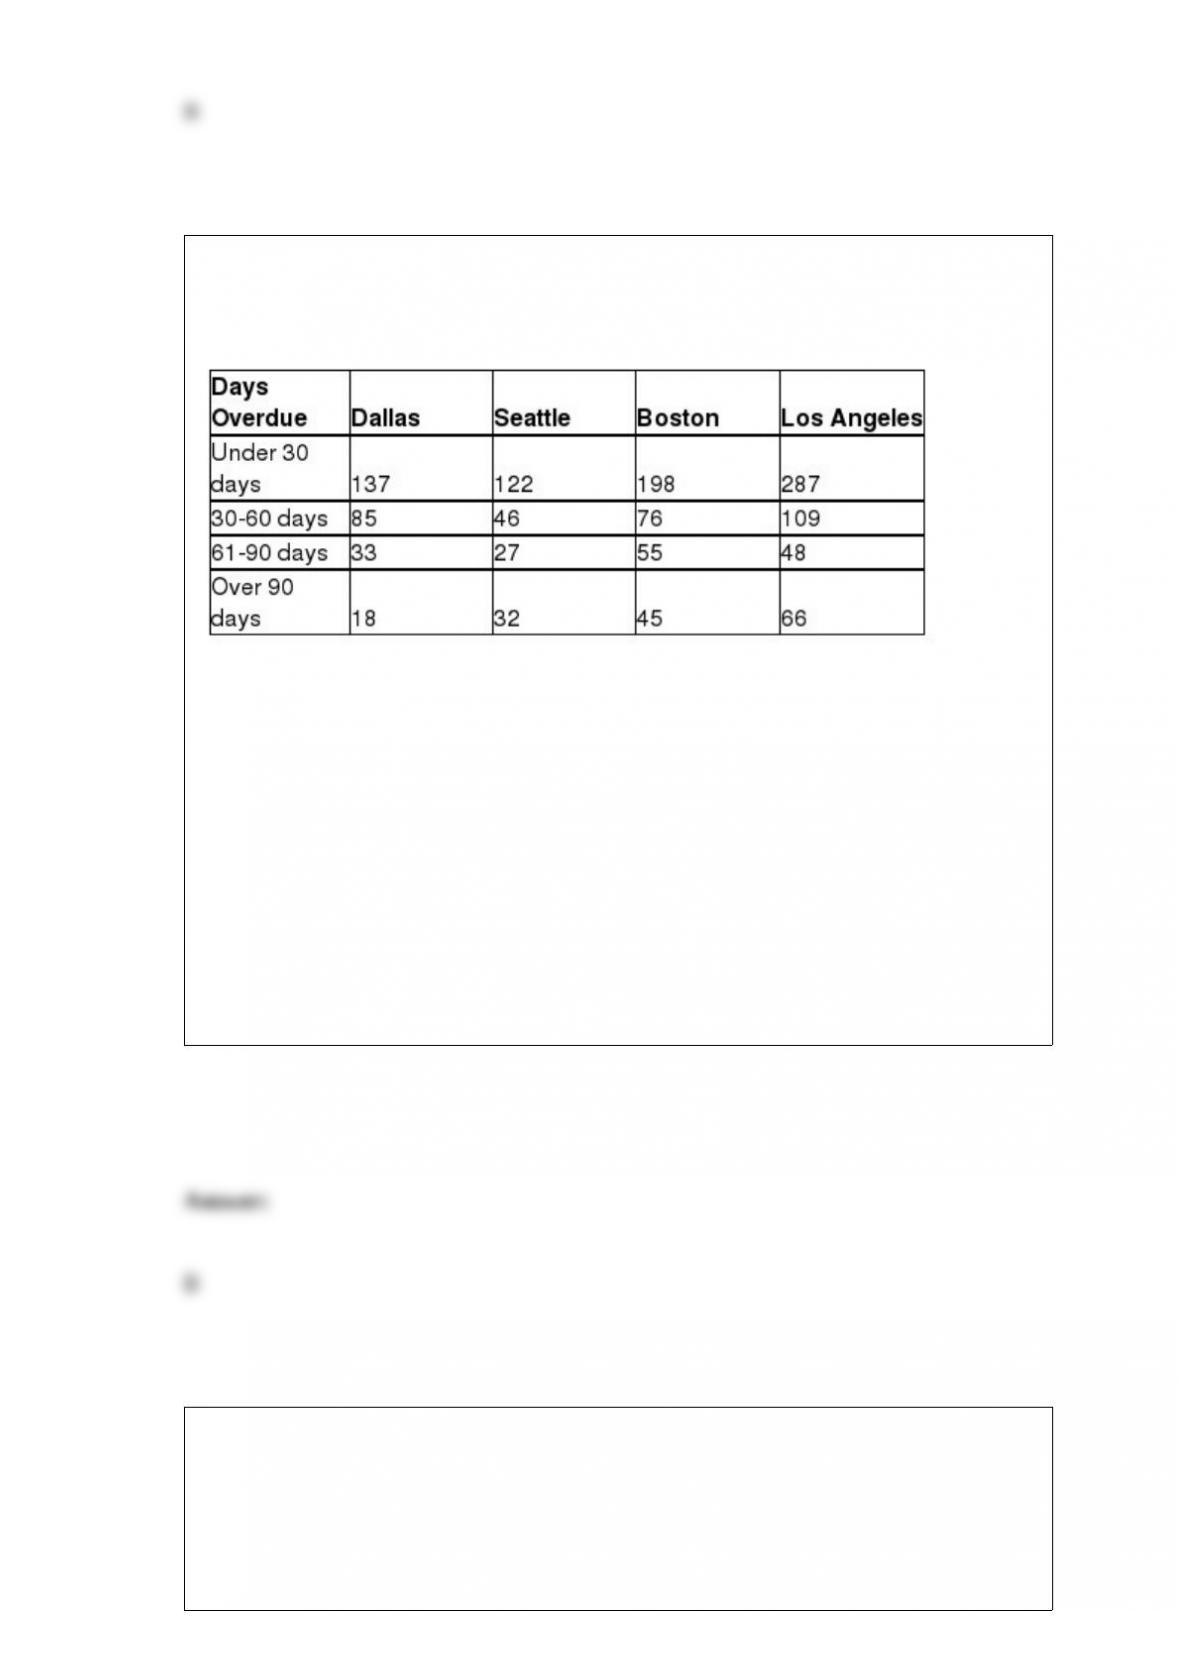
Micron Technology has sales offices located in four cities: Dallas, Seattle, Boston, and
Los Angeles. An analysis of the company’s accounts receivables reveals the number of
overdue invoices by days, as shown here.
Assume the invoices are stored and managed from a central database.
What is the probability that a randomly selected invoice from the database is over 90
days old and from the Seattle office?
A) 0.2702
B) 0.0231
C) 0.3461
D) 0.7765
Recently a study of fans attending the New York Mets baseball games was conducted
and 500 fans were surveyed. In forming a frequency distribution of the number of miles
fans traveled from home to the stadium, it was found that 247 fans traveled between 0
and 5 miles. Based on this information what was the relative frequency for this class?
A) 0.247

B) 0.30
C) 0.494
D) Can’t be determined without more information.
A random sample of 340 people in Chicago showed that 66 listened to WJKT-1450, a
radio station in South Chicago Heights. Based on this information, what is the upper
limit for the 95 percent confidence interval estimate for the proportion of people in
Chicago that listen to WJKT-1450?
A) 1.96
B) Approximately 0.0009
C) About 0.2361
D) About 0.2298
A random sample of 100 items is selected from a population of size 350. What is the
probability that the sample mean will exceed 200 if the population mean is 195 and the
population standard deviation equals 20? (Hint: Use the finite correction factor since
the sample size is more than 5% of the population size.)
A) 0.0415

B) 0.0016
C) 0.0241
D) 0.0171
Which of the following will result in a larger margin of error in an application involving
the estimation of a population mean?
A) Increasing the sample size
B) Decreasing the confidence level
C) Increasing the sample standard deviation
D) All of the above
A study was recently done in which 500 people were asked to indicate their preferences
for one of three products. The following table shows the breakdown of the responses by
gender of the respondents.
If the people conducting the study wish to assess the probability that product A will be
preferred by members of the target population, the method of assessment to be used

would most likely be:
A) classical probability assessment.
B) subjective assessment.
C) relative frequency of occurrence.
D) independent events.
The critical value in a null hypothesis test is called alpha.
In a simple exponential smoothing model, which of the following statements is true?
A) The forecast values are determined by computing a moving average of the previous
4 data periods if we are working with quarterly data.
B) The larger the smoothing constant, the more smoothing that takes place in the model.
C) If the data contain a lot of random or irregular ups and downs, then a larger
smoothing constant should be used in an attempt to model these fluctuations.
D) More smoothing of the data will take place if a smoothing constant value close to
zero is used.

A study was conducted to determine if differences in new textbook prices exist between
on-campus bookstores, off-campus bookstores, and Internet bookstores. To control for
differences in textbook prices that might exist across disciplines, the study randomly
selected 12 textbooks and recorded the price of each of the 12 books at each of the three
retailers. You may assume normality and equal-variance assumptions have been met.
The partially completed ANOVA table based on the study’s findings is shown here:
Based on the study’s findings, can it be concluded that there is a difference in the
average price of textbooks across the three retail outlets? Conduct the appropriate
hypothesis test at the alpha = 0.10 level of significance.
A) F = 0.0411 < Fα=0.10 = 2.56, reject the null hypothesis. Thus, based on these sample
data we can conclude that there is a difference in textbook prices at the three different
types of retail outlets.
B) F = 0.0411 < Fα=0.10 = 2.56, do not reject the null hypothesis. Thus, based on these
sample data we cannot conclude that there is a difference in textbook prices at the three
different types of retail outlets.
C) F = 0.031 < Fα=0.10 = 2.56, reject the null hypothesis. Thus, based on these sample
data we can conclude that there is a difference in textbook prices at the three different
types of retail outlets.
D) F = 0.031 < Fα=0.10 = 2.56, do not reject the null hypothesis. Thus, based on these
sample data we cannot conclude that there is a difference in textbook prices at the three
different types of retail outlets.

Hono Golf is a manufacturer of golf products in Taiwan and China. One of the golf
accessories it produces at its plant in Tainan Hsing, Taiwan, is plastic golf tees. The
injector molder produces golf tees that are designed to have an average height of 66
mm. To determine if this specification is met, random samples are taken from the
production floor. One sample is contained in the file labeled THeight. Determine if the
process is not producing the tees to specification. Use a significance level of 0.01.
A) Since t = 2.1953 < 2.8073 do not reject H0. There is not sufficient evidence to
conclude that the average height of the plastic tees is different from 66 mm.
B) Since t = 2.1953 < 2.8073 reject H0. There is sufficient evidence to conclude that the
average height of the plastic tees is different from 66 mm.
C) Since t = 1.2814 < 1.9211 do not reject H0. There is not sufficient evidence to
conclude that the average height of the plastic tees is different from 66 mm.
D) Since t = 1.2814 < 1.9211 reject H0. There is sufficient evidence to conclude that the
average height of the plastic tees is different from 66 mm.
A large orchard owner in the state of Washington is interested in determining whether
the mean number of bushels of peaches per acre is the same or different depending on
the type of tree that is used. He also thinks that production may be affected by the type
of fertilizer that is used. To test, he has set up a test in which a one-acre plot of peach
trees with a combination each of 5 varieties and 3 fertilizer types are studied. The
following data reflect the number of bushels of peaches on each acre plot.

Assuming that the hypothesis tests will be conducted using an alpha equal 0.05 level,
which of the following is true?
A) The total sum of squares is approximately 4,570,900.
B) The grower was justified in controlling for the fertilizer type since the test shows
that blocking was effective.
C) Based on the data, the grower can conclude that there is a difference in mean
production of peaches across the different types of tree.
D) A, B and C are all true.
In an article entitled “Fuel Economy Calculations to Be Altered,” James R. Healey
indicated that the government planned to change how it calculates fuel economy for
new cars and trucks. This is the first modification since 1985. It is expected to lower
average mileage for city driving in conventional cars from 10% to 20%. AAA has
forecast that the 2008 Ford F-150 would achieve 15.7 mile per gallon (mpg). The 2008
Ford F-150 was tested by AAA members driving the vehicle themselves and was found
to have an average of 14.3 mpg. Assume that the mean obtained by AAA members is
the true mean for the population of 2008 Ford F-150 trucks and that the population
standard deviation is 5 mpg. Suppose 100 AAA members were to test the 2008 F-150.
Determine the probability that the average mpg would be at least 15.7.
A) 0.0026
B) 0.0121

C) 0.0451
D) 0.0001
Chicago Connection, a local pizza company, delivers pizzas for free within the market
area. The delivery drivers are paid $2.00 per delivery plus they get to keep any tips. To
estimate the proportion of deliveries that result in a tip to the driver, a random sample of
64 deliveries was selected. Of these, 48 times a tip was received. Based on this
information, and using a 95 percent confidence level, the margin of error for the
estimate is approximately .1061.
Data was collected on the number of television sets in a household, and it was found
that the mean was 3.5 and the standard deviation was 0.75.
Based on these sample data, what is the standardized value corresponding to 5
televisions?
A) -2.00
B) 1.5
C) 2.00
D) 1.125

Which of the following is not an assumption of the multiple regression model?
A) The mean of the residuals is equal to the variance at all combinations of levels of the
independent variables.
B) The regression error terms are normally distributed.
C) The model error terms are independent.
D) The residuals have a constant variance for all combinations of values for the
independent variables.
An advertising company wishes to estimate the mean household income for all single
working professionals who own a foreign automobile. If the advertising company wants
a 90% confidence interval estimate with a margin of error of $2,500, what sample size
is needed if the population standard deviation is known to be $27,500?
A) 156
B) 328
C) 251
D) 415

In an article entitled “Fuel Economy Calculations to Be Altered,” James R. Healey
indicated that the government planned to change how it calculates fuel economy for
new cars and trucks. This is the first modification since 1985. It is expected to lower
average mileage for city driving in conventional cars from 10% to 20%. AAA has
forecast that the 2008 Ford F-150 would achieve 15.7 mile per gallon (mpg). The 2008
Ford F-150 was tested by AAA members driving the vehicle themselves and was found
to have an average of 14.3 mpg. Assume that the mean obtained by AAA members is
the true mean for the population of 2008 Ford F-150 trucks and that the population
standard deviation is 5 mpg. The current method of calculating the mpg forecasts that
the 2008 F-150 will average 16.8 mpg. Determine the probability that these same 100
AAA members would average more than 16.8 mpg while testing the 2008 F-150.
A) 0
B) 0.0155
C) 0.0412
D) None of the above
Which of the following statements is true with respect to the confidence level
associated with an estimation application?
A) The confidence level is a percentage value between 50 and 100 that corresponds to
the percentage of all possible confidence intervals, based on a given sample size, that
will contain the true population value.
B) The probability that the confidence interval estimate will contain the true population
value.
C) The degree of accuracy associated with the confidence interval estimate.
D) None of the above

For the following hypothesis test
With n = 100 and p = 0.66, state the decision rule in terms of the critical value of the
test statistic
A) The decision rule is: reject the null hypothesis if the calculated value of the test
statistic, z, is less than the critical value of the test statistic z = -1.96. Otherwise, do not
reject.
B) The decision rule is: reject the null hypothesis if the calculated value of the test
statistic, z, is less than the critical value of the test statistic z = -1.645. Otherwise, do not
reject.
C) The decision rule is: reject the null hypothesis if the calculated value of the test
statistic, z, is greater than the critical value of the test statistic z = 1.96. Otherwise, do
not reject.
D) The decision rule is: reject the null hypothesis if the calculated value of the test
statistic, z, is greater than the critical value of the test statistic z = 1.645. Otherwise, do
not reject.