The range is a measure of central tendency.
When the relationship between the variables is statistically significant using simple
regression analysis, we have enough evidence to state that the independent variable
caused the change in the dependent variable.
The ounces of soda consumed by an adult next month are an example of a discrete
random variable.
Expected value calculations are long-term results that occur as the result of making a
decision over and over again even though in reality, the decision might be made only
once.

The null hypothesis for the Kruskal-Wallis test always states that there is no difference
among the means of the populations being tested.
Percentiles measure the approximate percentage of values in the data set that are below
the value of interest.
The estimated class width for a frequency distribution using grouped quantitative data
should be rounded to an integer value to make the class boundaries more readable.

The addition rule is used to determine the probability of the intersection (joint
probability) of two events occurring, or P(A and B).
Income and age are examples of data that are technically discrete but are normally
displayed in a continuous format.
We suspect the presence of multicollinearity in the model when regression coefficients
have the opposite sign from what we would normally expect.
The sum of squares error (SSE) represents the random variation in the data not
attributed to either the main factor or the blocking factor.

Once we set the value for αfor a hypothesis test, the value for β becomes fixed.
An exponential probability distribution allows us to calculate the probability of a
specific number of successes for a certain number of trials.
The farther out into the future that we project the regression trend line, the less reliable
the forecasted value will be.
In decision trees, square symbols are used to denote alternatives.
The probability that Event A or Event B will occur refers to the union of Event A and
Event B.
In general stepwise regression, once an independent variable enters the model, it cannot
leave the model at a later step.
A scatter plot is a graphical display showing the relative position of the three quartiles
as a box on a number line along with the minimum and maximum values in the data set
and any outliers.
Clustered bar charts are preferred over stacked bar charts when you are comparing data
within categories, such as which team scored more points in 2009 when compared to
2010.
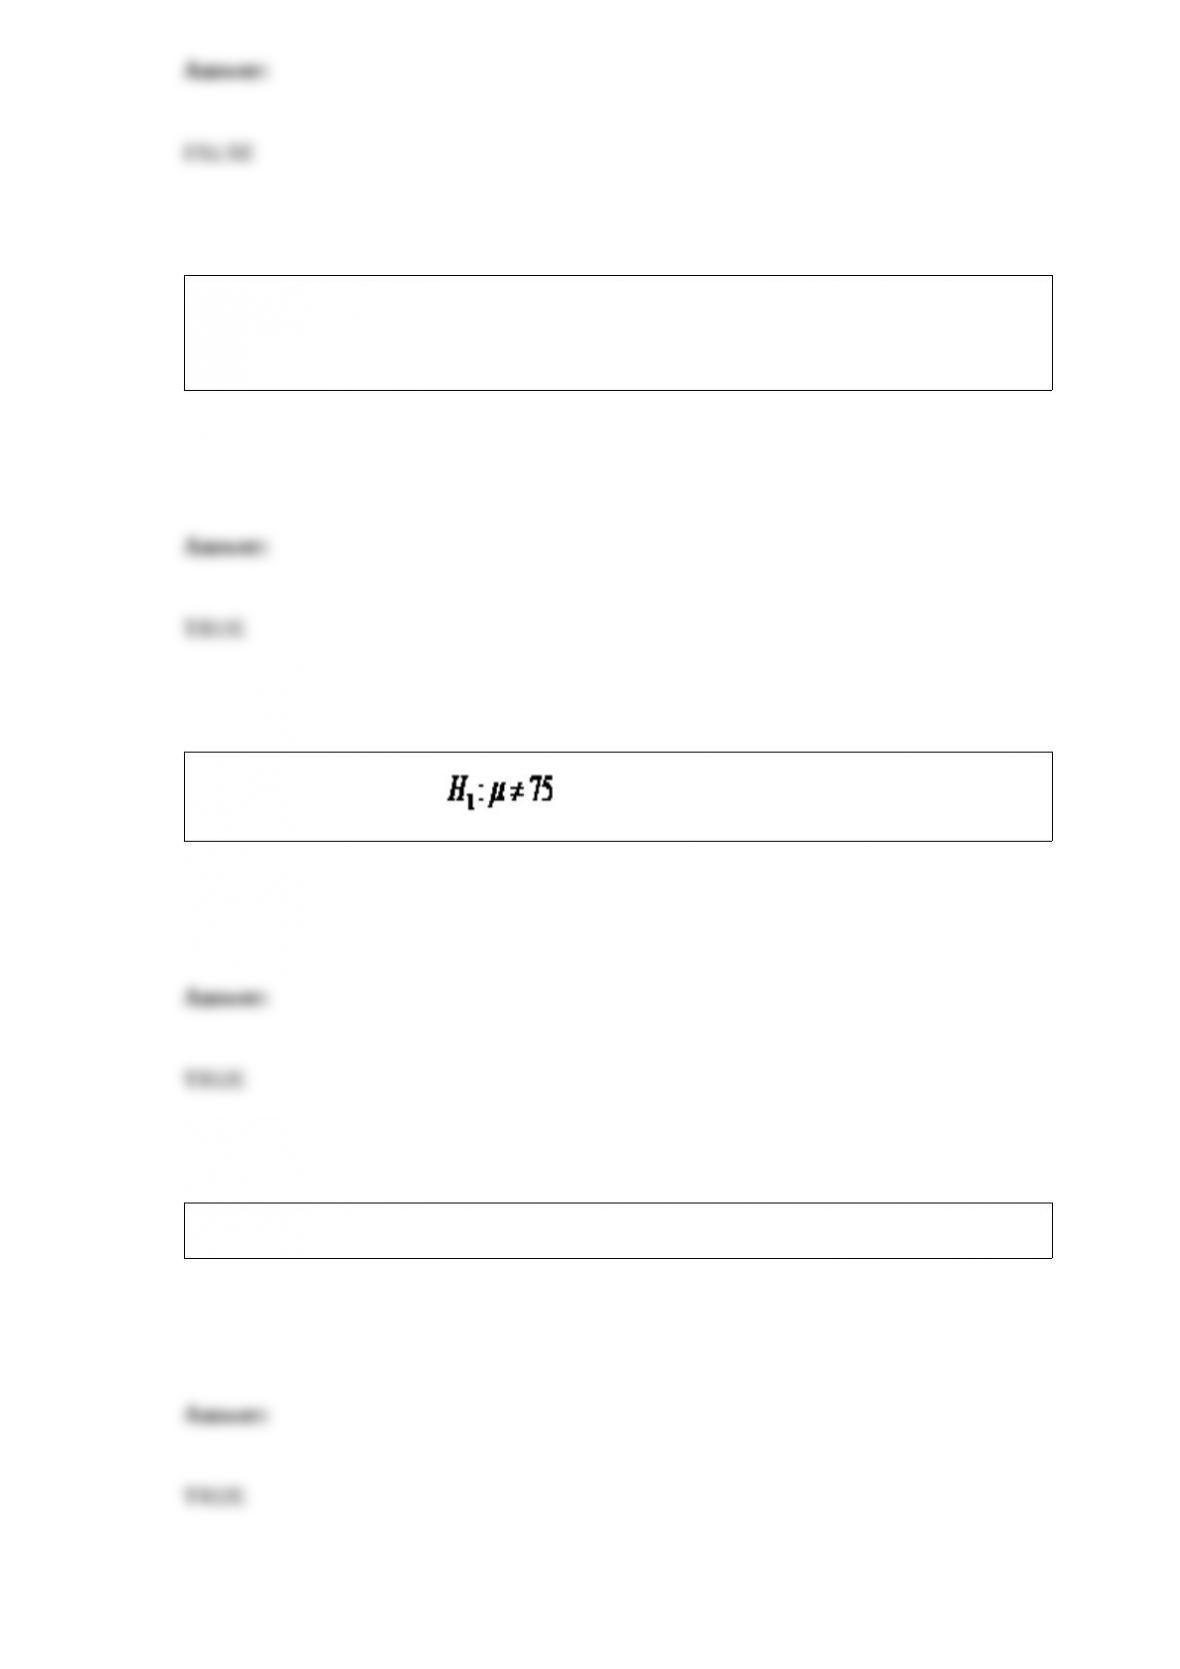
The hypothesis statement is an example of a two-tail hypothesis test.
A hypothesis test using dependent samples is known as a matched-pair test.
Excel’s random sampling tool uses sampling with replacement.
All analysis of variance procedures require that each of the populations being compared
follows the normal probability distribution.
The purpose of hypothesis statements is to draw a conclusion about the population
parameters for which we do not have complete knowledge.
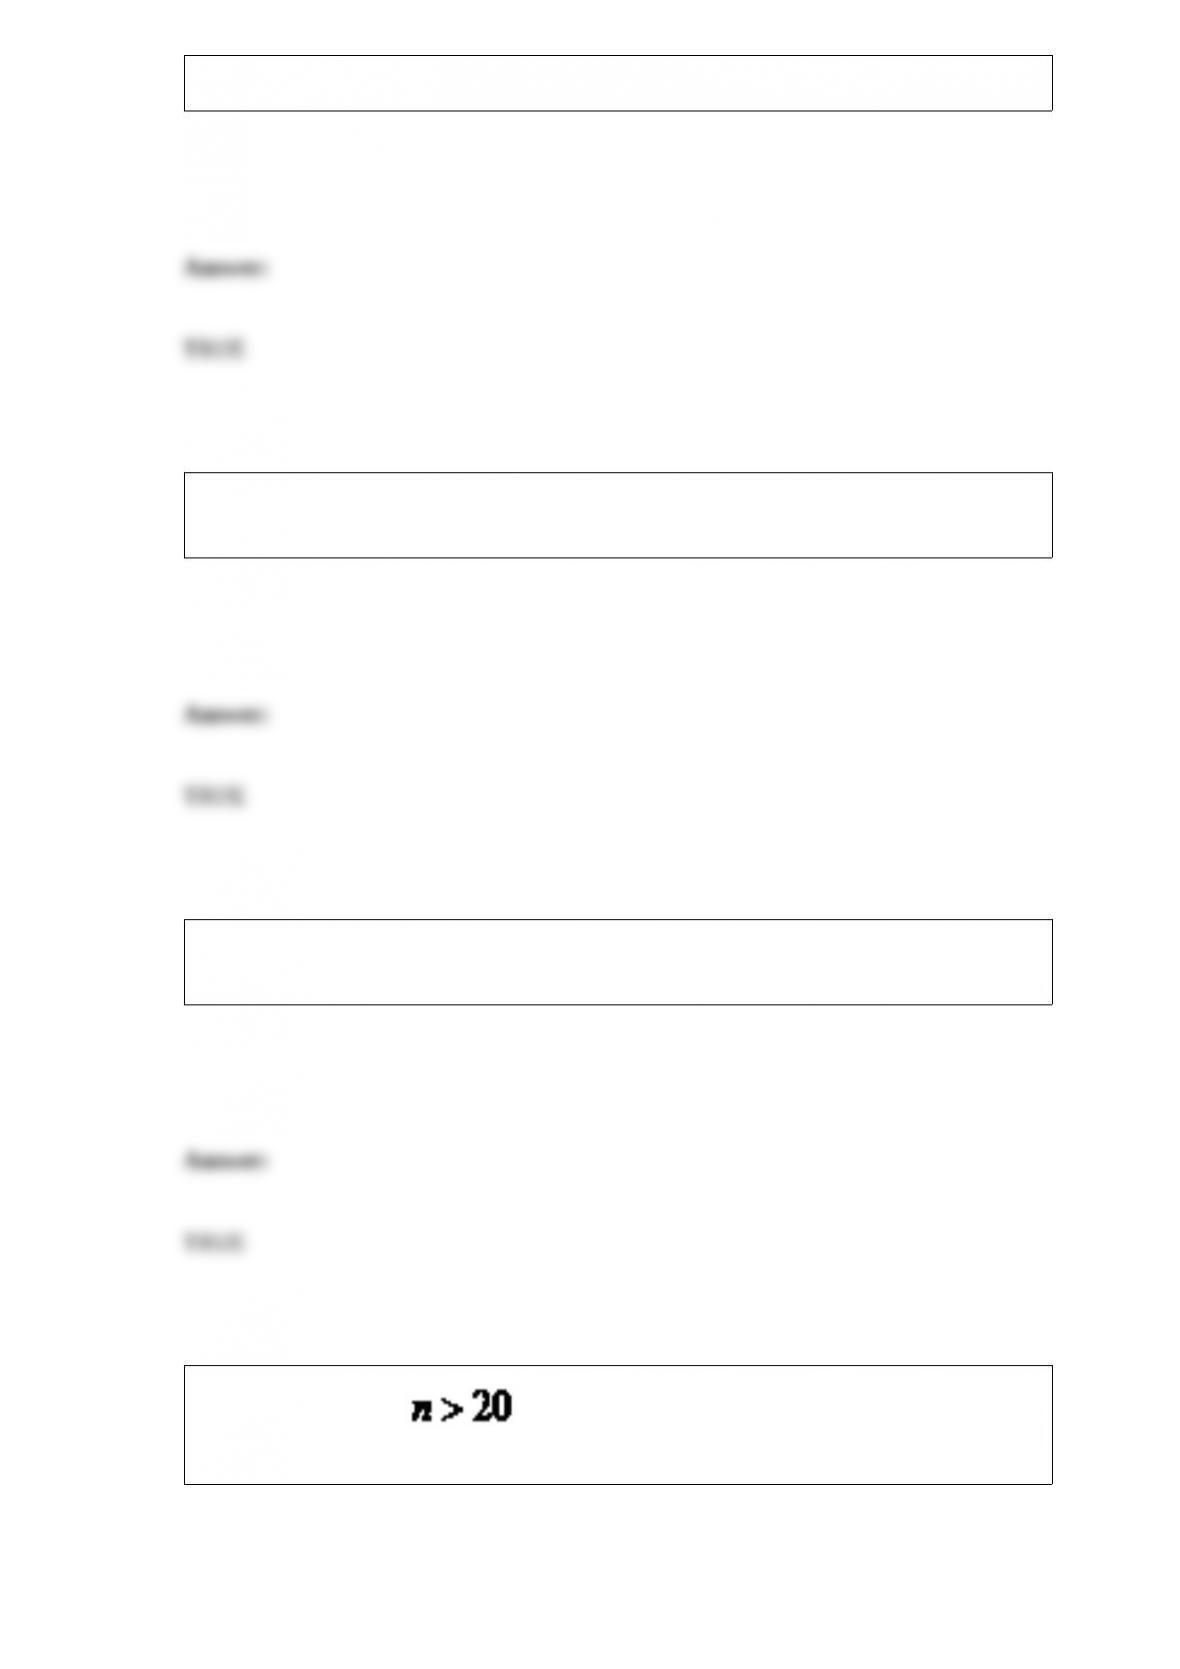
With a sample size of , the sampling distribution for the sign test, assuming
the null hypothesis is true, follows the student’s t-distribution.

Rating the satisfaction of a hotel room on a 1-5 scale is an example of a discrete random
variable.
The number of occurrences in a Poisson distribution must range from zero to n.
An event with a single outcome in its most basic form that cannot be simplified is
known as a simple probability.

When in doubt about your assumption that the population variances are equal when
comparing two population means, the best strategy is to proceed with the unequal
variances test.
When calculating the sample mean of grouped data, the value represents an estimate of
the true sample mean.
Many hotel chains that offer free Wi-Fi service to their customers have experienced
increasing demand for Internet bandwidth and increasing costs. Marriott International
would like to test the hypothesis that the proportion of customers that are carrying two
Wi-Fi devices exceeds 0.60. A random sample of 120 Marriott customers found that 78
have two Wi-Fi devices. Marriott International would like to set α = 0.01. The p-value
for this hypothesis test would be ________.
A) 0.0207
B) 0.0440
C) 0.0766
D) 0.1314
A golfer would like to test the hypothesis that the variance of his golf score equals 10.0.
A random sample of 28 rounds of golf had a sample standard deviation of 3.5. Using α
= 0.10, the lower critical value for this hypothesis test would be ________.
A) 12.401
B) 13.848
C) 16.151
D) 17.334
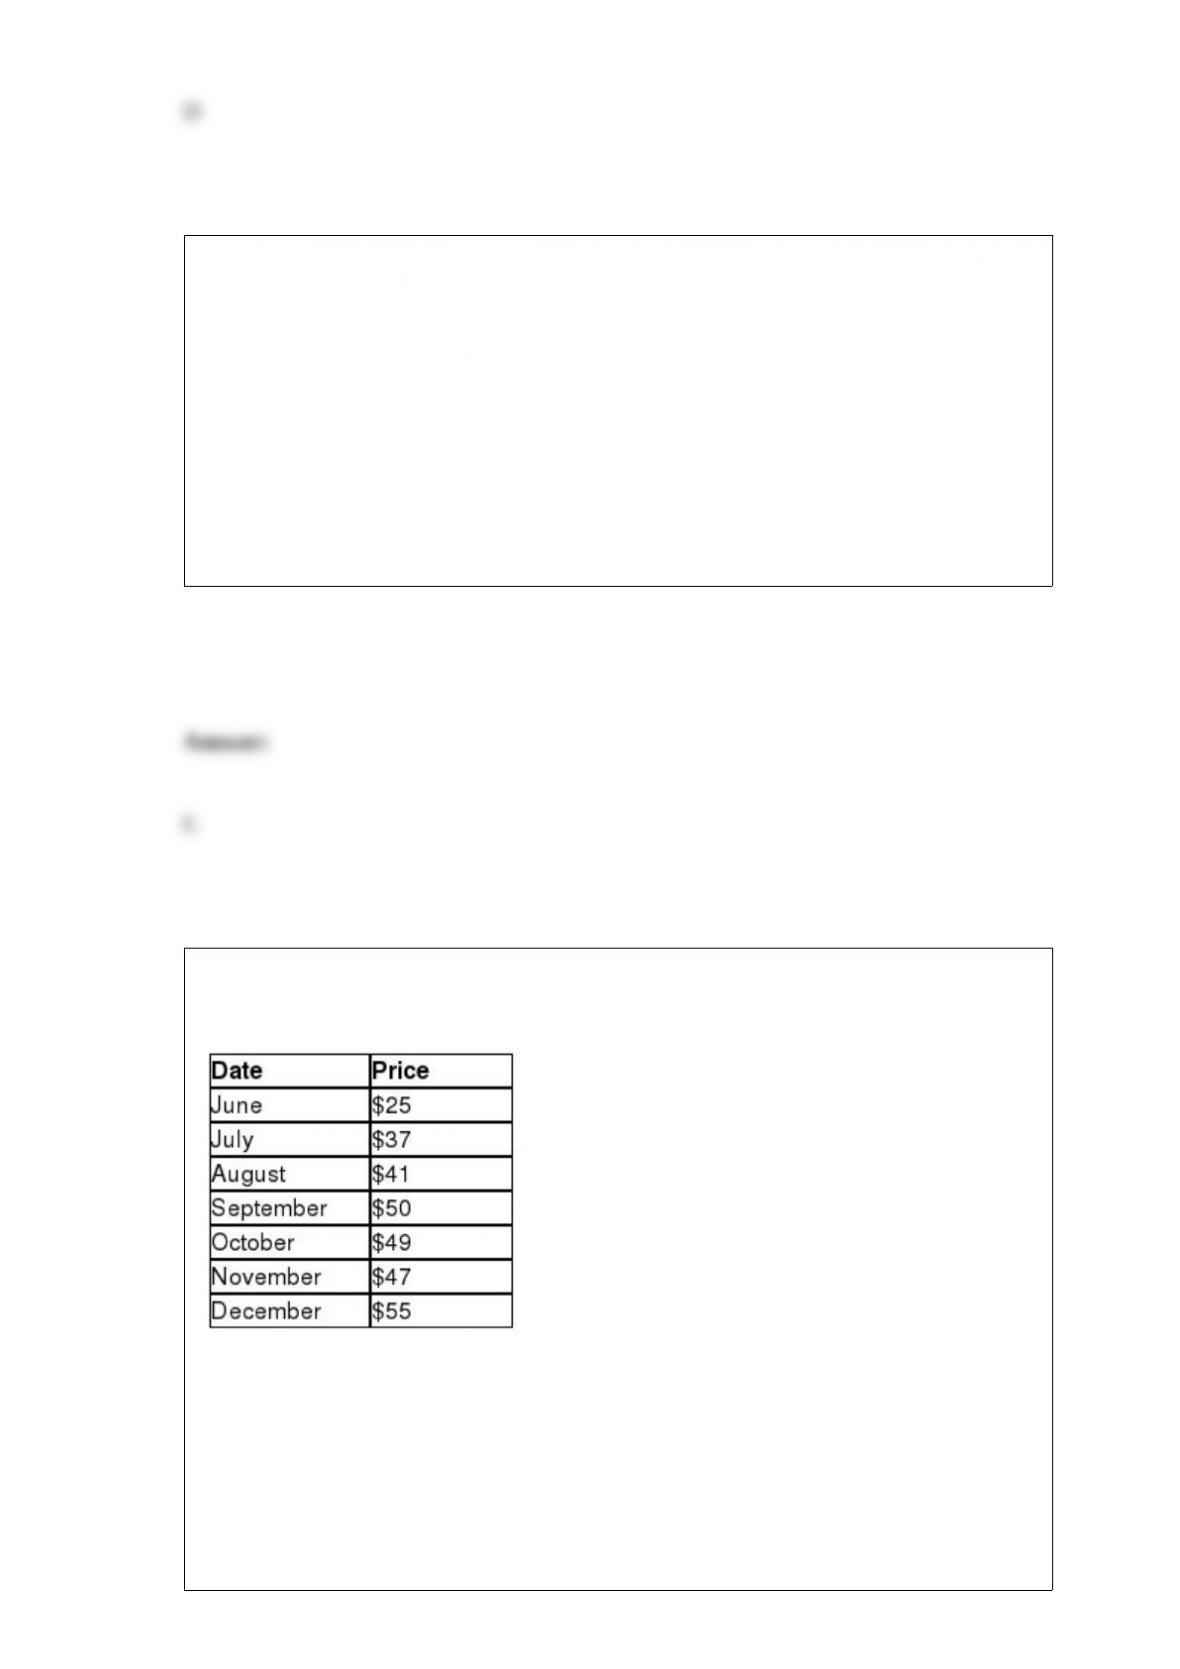
The following data represent the end-of-month stock price of Facebook rounded to the
nearest dollar from June to December.
The mean absolute deviation using trend projection is ________.
A) 1.73
B) 1.98
C) 2.55

D) 3.35
Dover Motors is a car dealership that sells new and used cars. Suppose they sold 140
used cars during the most recent quarter. The average selling price was $10,325 with a
standard deviation of $2,880. A random sample of 60 used cars from this population
was selected. What is the probability that the sample mean exceeds $10,000?
A) 0.5987
B) 0.6736
C) 0.8749
D) 0.9115
Entertainment Software Association would like to test if the median age of “gamers”
(those that routinely play video games) is more than 30 years old. The following table
summarizes the ages of a random sample of gamers.
The p-value for this hypothesis test is ________.

A) 0.0044
B) 0.0367
C) 0.0647
D) 0.0913
A golfer would like to test the hypothesis that the variance of his golf score equals 10.0.
A random sample of 28 rounds of golf had a sample standard deviation of 3.5. The
degrees of freedom for this hypothesis test would be ________.
A) 24
B) 25
C) 26
D) 27
Costco Wholesale claims that Costco members prefer its Kirkland brand toilet paper
over the leading national brand. To test this claim, Costco recorded the preferences of a
random sample of customers which are summarized in the table below.
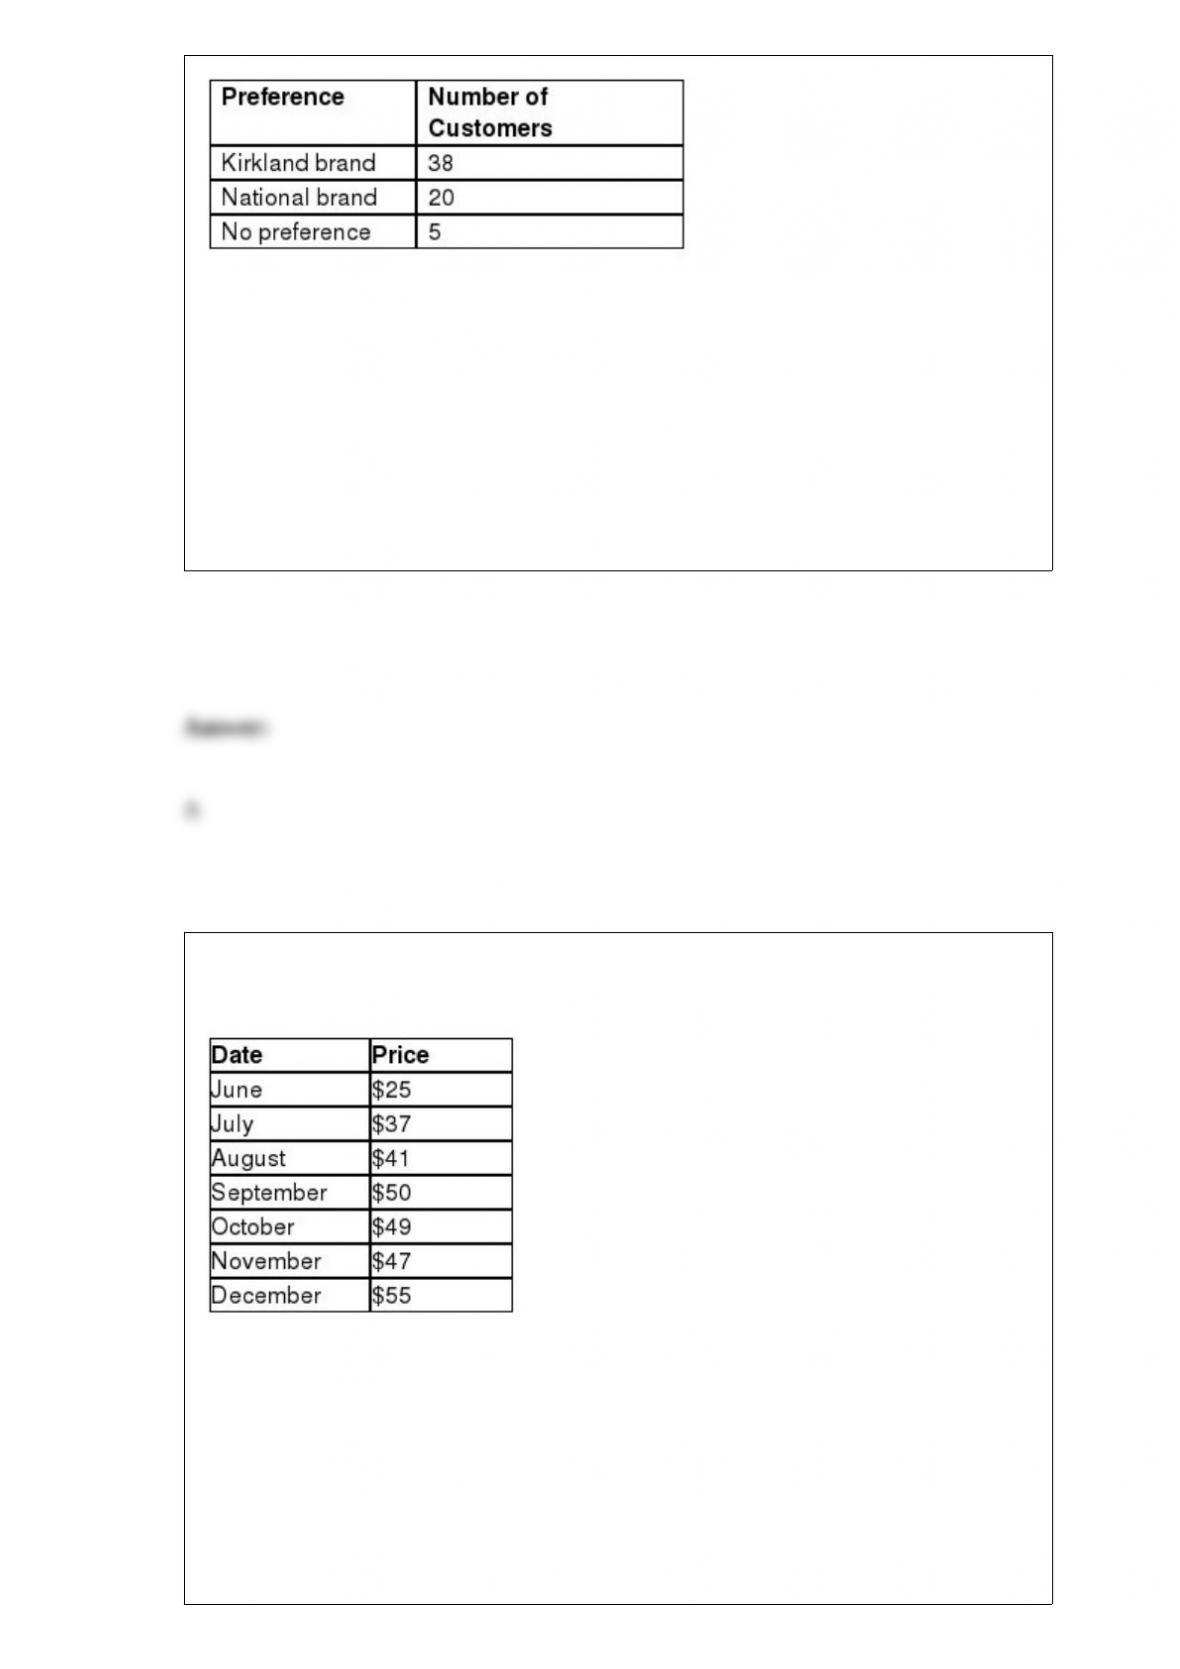
The mean for the sampling distribution for this hypothesis test is ________.
A) 29.0
B) 32.0
C) 36.5
D) 38.0
The following data represent the end-of-month stock price of Facebook rounded to the
nearest dollar from June to December.
The residual for the end of September is ________.
A) -3.5
B) -4.2
C) 1.8

D) 6.6
Assume that the flight time for a United Airlines flight from Philadelphia to Dallas
follows the uniform probability distribution between 210 and 250 minutes. What is the
standard deviation of this distribution?
A) 5.23
B) 7.91
C) 9.60
D) 11.55
The table below shows the number of cars sold last month by seven employees at
Concord Motors and their number of years of sales experience.
Management would like to use simple regression analysis to estimate monthly car sales
using the number of years of sales experience. The average monthly sales for an
employee with five years of sales experience is ________.
A) 8.50
B) 10.23
C) 12.01
D) 14.62
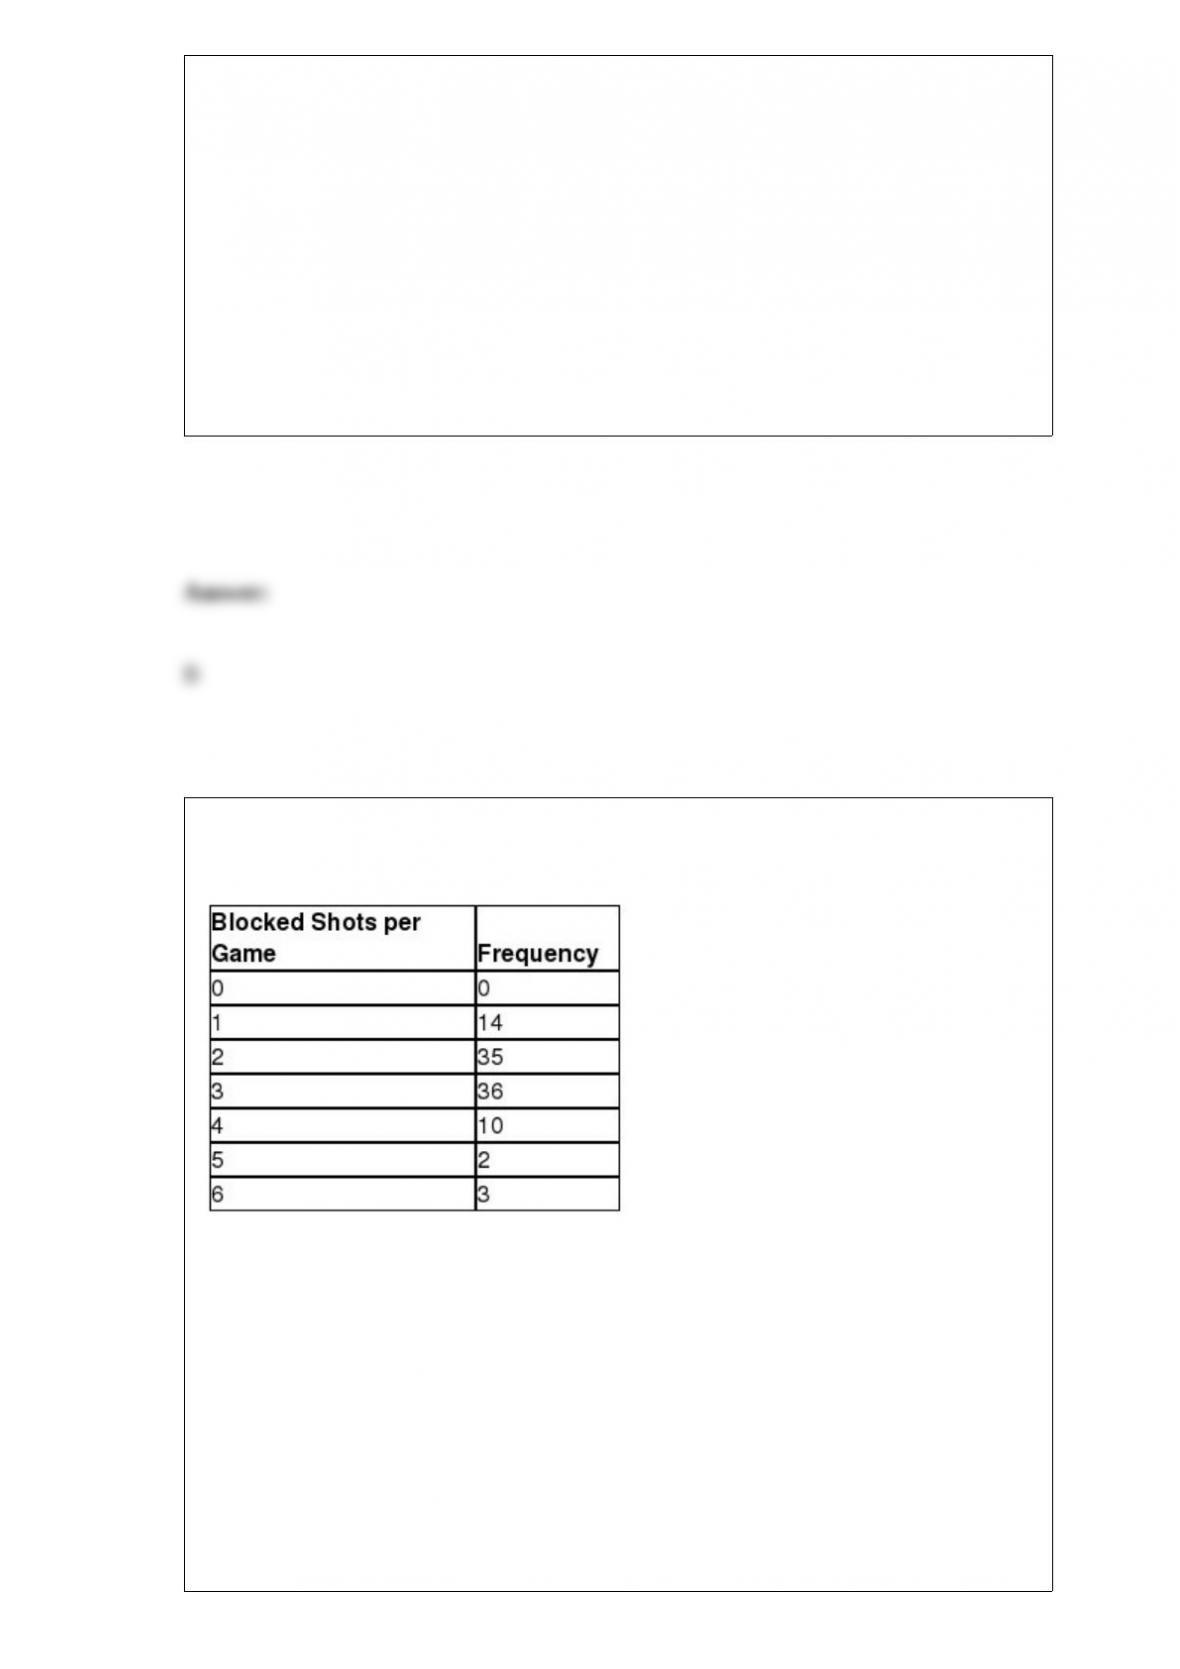
The following distribution shows the frequency distribution of the number of shots a
particular NBA player blocked in one game for a random sample of 100 games.
You have been assigned the task to test if the distribution of blocked shots per game for
this player follows the Poisson distribution using α = 0.05. The expected number of
games from this sample that this player blocks exactly three shots is ________.
A) 9.21
B) 17.52
C) 20.38
D) 21.76

During the 3 pm to 5 pm time period, cars arrive at a bank’s drive-through window at an
average rate of 15 customers per hour. Assume that the time between arrivals follows
the exponential distribution. What is the probability that a randomly selected customer
will arrive less than 5 minutes after the previous customer?
A) 0.4246
B) 0.5477
C) 0.7135
D) 0.8831
Consider the following stem and leaf display.
Which data value occurs most often?
A) 1
B) 5

C) 31
D) 59
The batting order of baseball players for a game would be an example of ________
data.
A) nominal
B) ordinal
C) interval
D) ratio
A manufacturer of smartphone batteries will randomly select 20 batteries from the
process each day and count the number of defects. Historically, 4% of the batteries
produced by this company have been defective. The following data represent the
frequency of defective batteries from a random sample of 200 days.
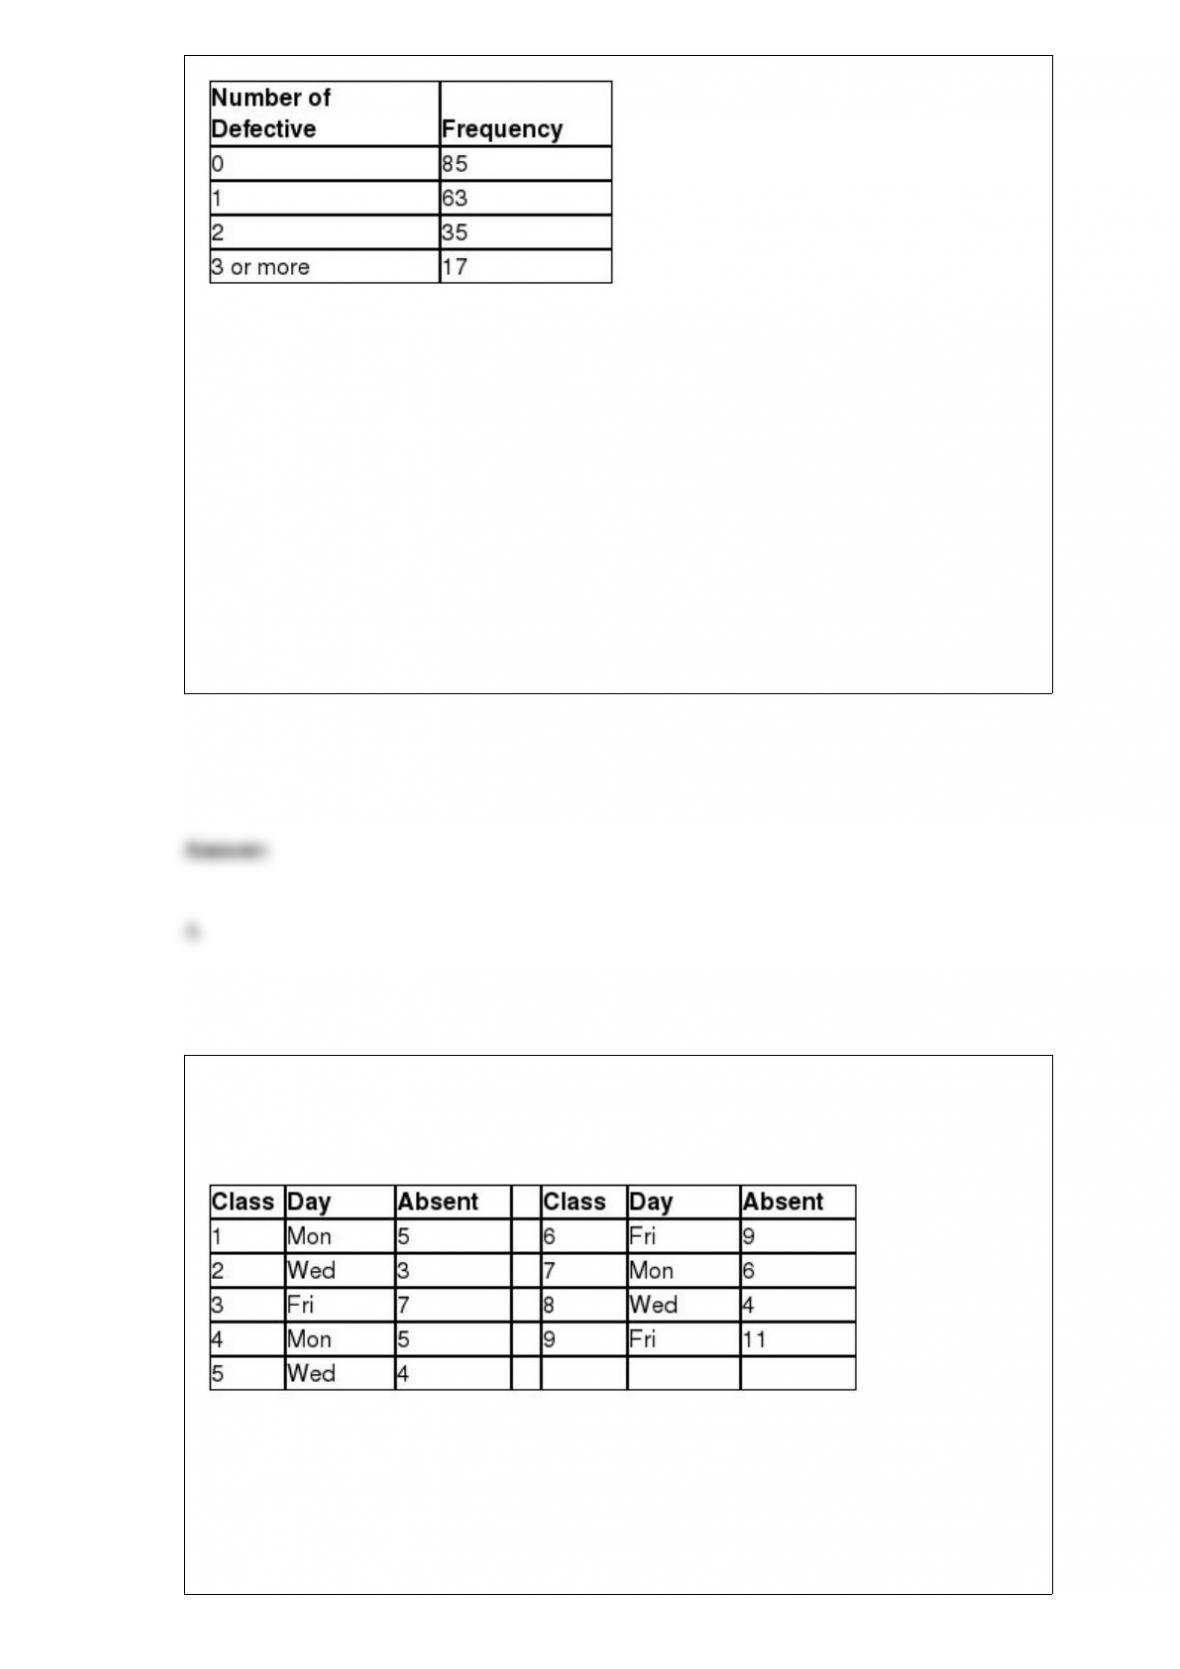
The manufacturer would like to test if the probability distribution for defective batteries
follows the binomial distribution with p = 0.04 and n = 20 using α = 0.05. The expected
number of days from this sample that 3 or more batteries from the batch of 20 are
defective is ________.
A) 15.08
B) 37.74
C) 71.70
D) 75.48
A large statistics class meets on Monday, Wednesday, and Friday each week during the
semester. The following data shows the number of absent students for the last nine
classes.
The three-period centered moving average for Class 5 is ________.
A) 4.8
B) 5.3

C) 6.0
D) 7.0
Two variables have a correlation coefficient equal to -0.65 from a sample size of 10.
Which one of the following statements describes the results of the hypothesis test that
the population correlation coefficient is less than zero using α = 0.05?
A) Because the test statistic is less than the critical value, we can reject the null
hypothesis and conclude that the population correlation coefficient is less than zero.
B) Because the test statistic is less than the critical value, we can reject the null
hypothesis and conclude that the population correlation coefficient is not less than zero.
C) Because the test statistic is greater than the critical value, we can reject the null
hypothesis and conclude that the population correlation coefficient is less than zero.
D) Because the test statistic is greater than the critical value, we fail to reject the null
hypothesis and conclude that the population correlation coefficient is not less than zero.
The mathematical operation of multiplication can be performed on interval data.

Which one of the following statements is true for a symmetrical distribution?
A) The mean is greater than the median.
B) The mean is less than the median.
C) The mean is greater than the mode.
D) The mean is roughly equal to the median.
The purpose of the blocking factor in randomized block ANOVA is to
________________.
A) increase some of the variability in the blocking factor which may allow us to better
detect a difference due to the main factor
B) remove some of the variability in the blocking factor which may allow us to better
detect a difference due to the main factor
C) increase some of the variability in the main factor which may allow us to better
detect a difference due to the blocking factor
D) remove some of the variability in the main factor which may allow us to better
detect a difference due to the blocking factor

When testing for the presence of positive autocorrelation and the Durbin-Watson
statistic is less than the lower critical value, which one of the following statements is
true?
A) We fail to reject the null hypothesis and conclude that a positive autocorrelation is
present in the time series.
B) We fail to reject the null hypothesis and conclude that no positive autocorrelation is
present in the time series.
C) We reject the null hypothesis and conclude that a positive autocorrelation is present
in the time series.
D) The hypothesis test is inconclusive.
Sarah is the office manager for a group of financial advisors who provide financial
services for individual clients. She would like to investigate whether a relationship
exists between the number of presentations made to prospective clients in a month and
the number of new clients per month. The following table shows the number of
presentations and corresponding new clients for a random sample of six employees.
Sarah would like to use simple regression analysis to estimate the number of new
clients per month based on the number of presentations made by the employee per
month. The test statistic for testing the hypothesis that the population coefficient of
determination is greater than zero is ________.

A) -1.16
B) 0.35
C) 1.03
D) 1.45
Bridgestone would like to estimate the average tread life of a particular brand of
automobile tire. Fifty customers who have purchased this tire are sampled and asked
about the tread life of their tires. This is an example of using _______________.
A) secondary data
B) qualitative data
C) descriptive statistics
D) inferential statistics
The Department of Housing and Urban Development (HUD) would like to test the
hypothesis that the average size of a newly constructed house last year is different from
the average size of a newly constructed house in 2000. The following data summarizes
the sample statistics for house sizes, in square feet, for both years. Assume that the
population variances are equal.
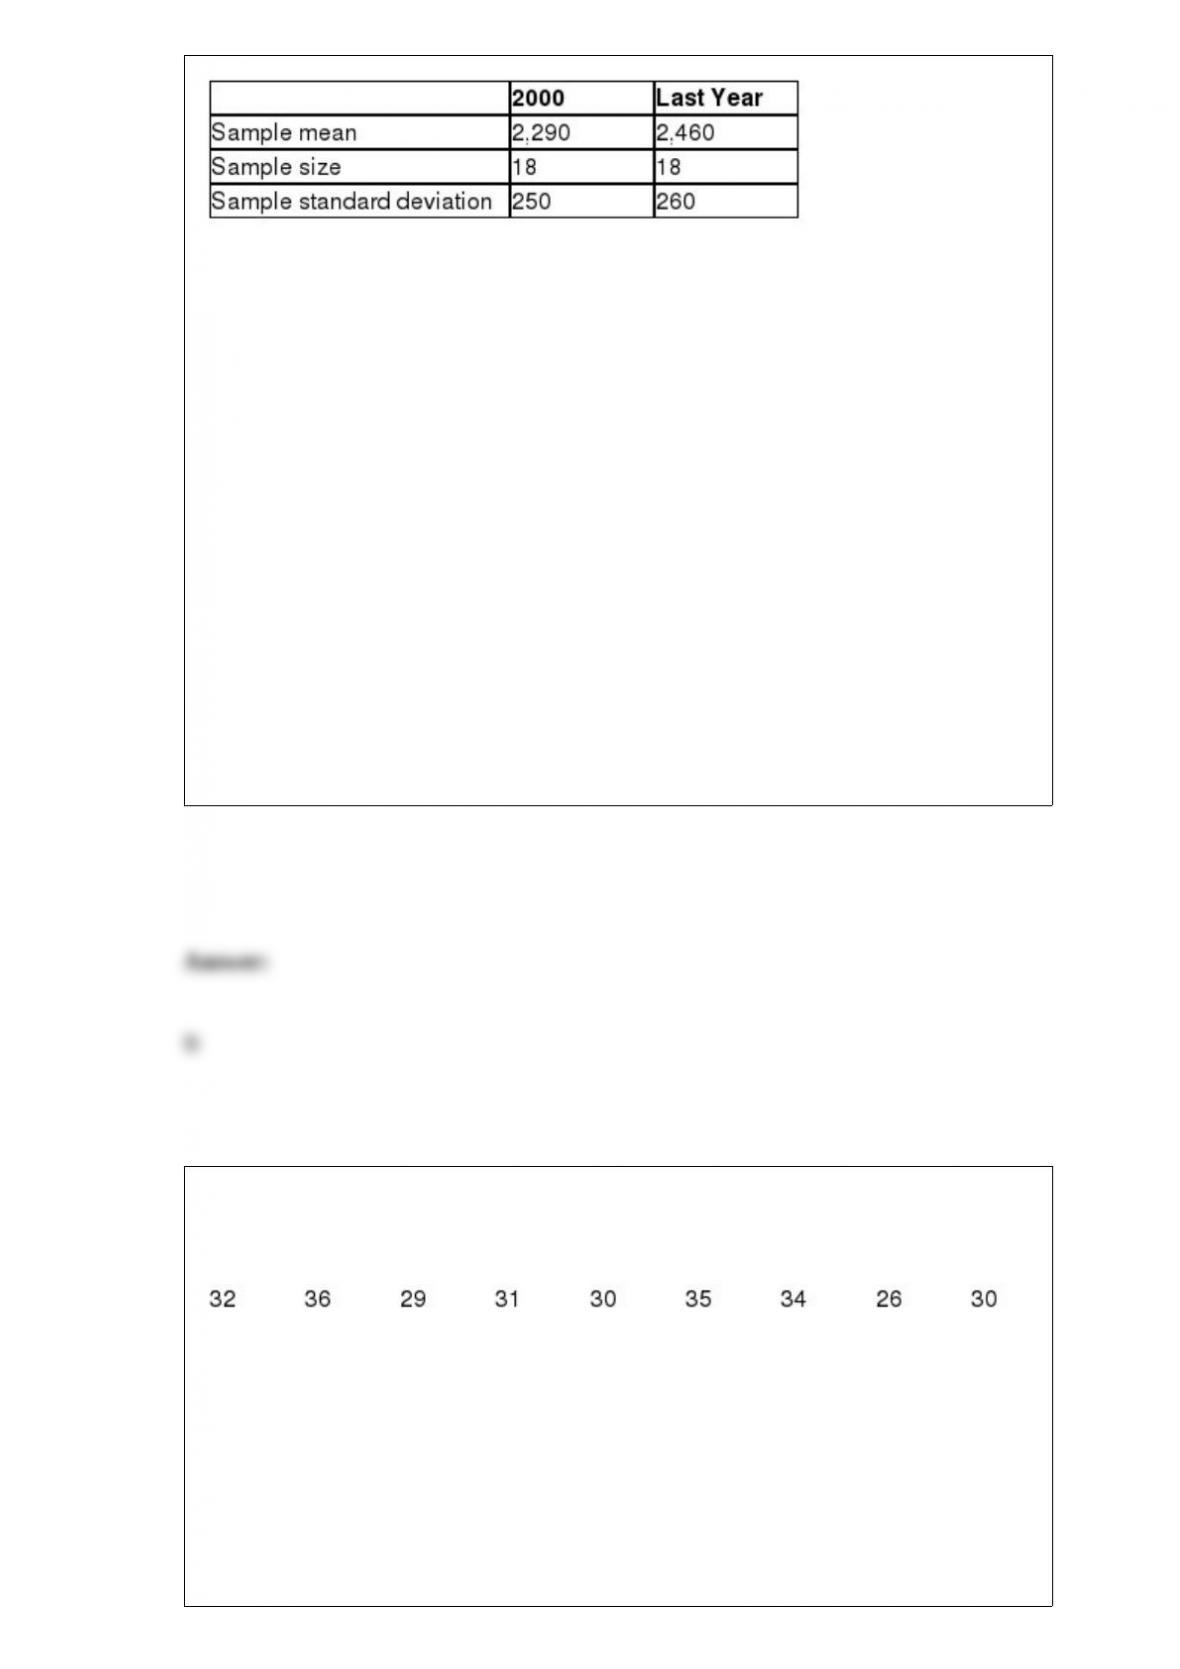
If Population 1 is defined as homes built in 2000 and Population 2 is defined as homes
built last year, which one of the following statements is true?
A) Because the 90% confidence interval does not include zero, HUD can conclude that
the average size of a newly constructed house last year is not different from the average
size of a newly constructed house in 2000.
B) Because the 90% confidence interval does not include zero, HUD can conclude that
the average size of a newly constructed house last year is different from the average
size of a newly constructed house in 2000.
C) Because the 90% confidence interval includes zero, HUD cannot conclude that the
average size of a newly constructed house last year is different from the average size of
a newly constructed house in 2000.
D) Because the 90% confidence interval includes zero, HUD can conclude that the
average size of a newly constructed house last year is equal to the average size of a
newly constructed house in 2000.
The MCAT is the admission exam that medical schools use as one of the criteria for
accepting students. The exam is based on a scale of 0-45. The following data shows the
MCAT scores for nine students.
What percentile is the student who scored a 35 on the MCAT exam?
A) 66th
B) 70th
C) 78th
D) 83rd
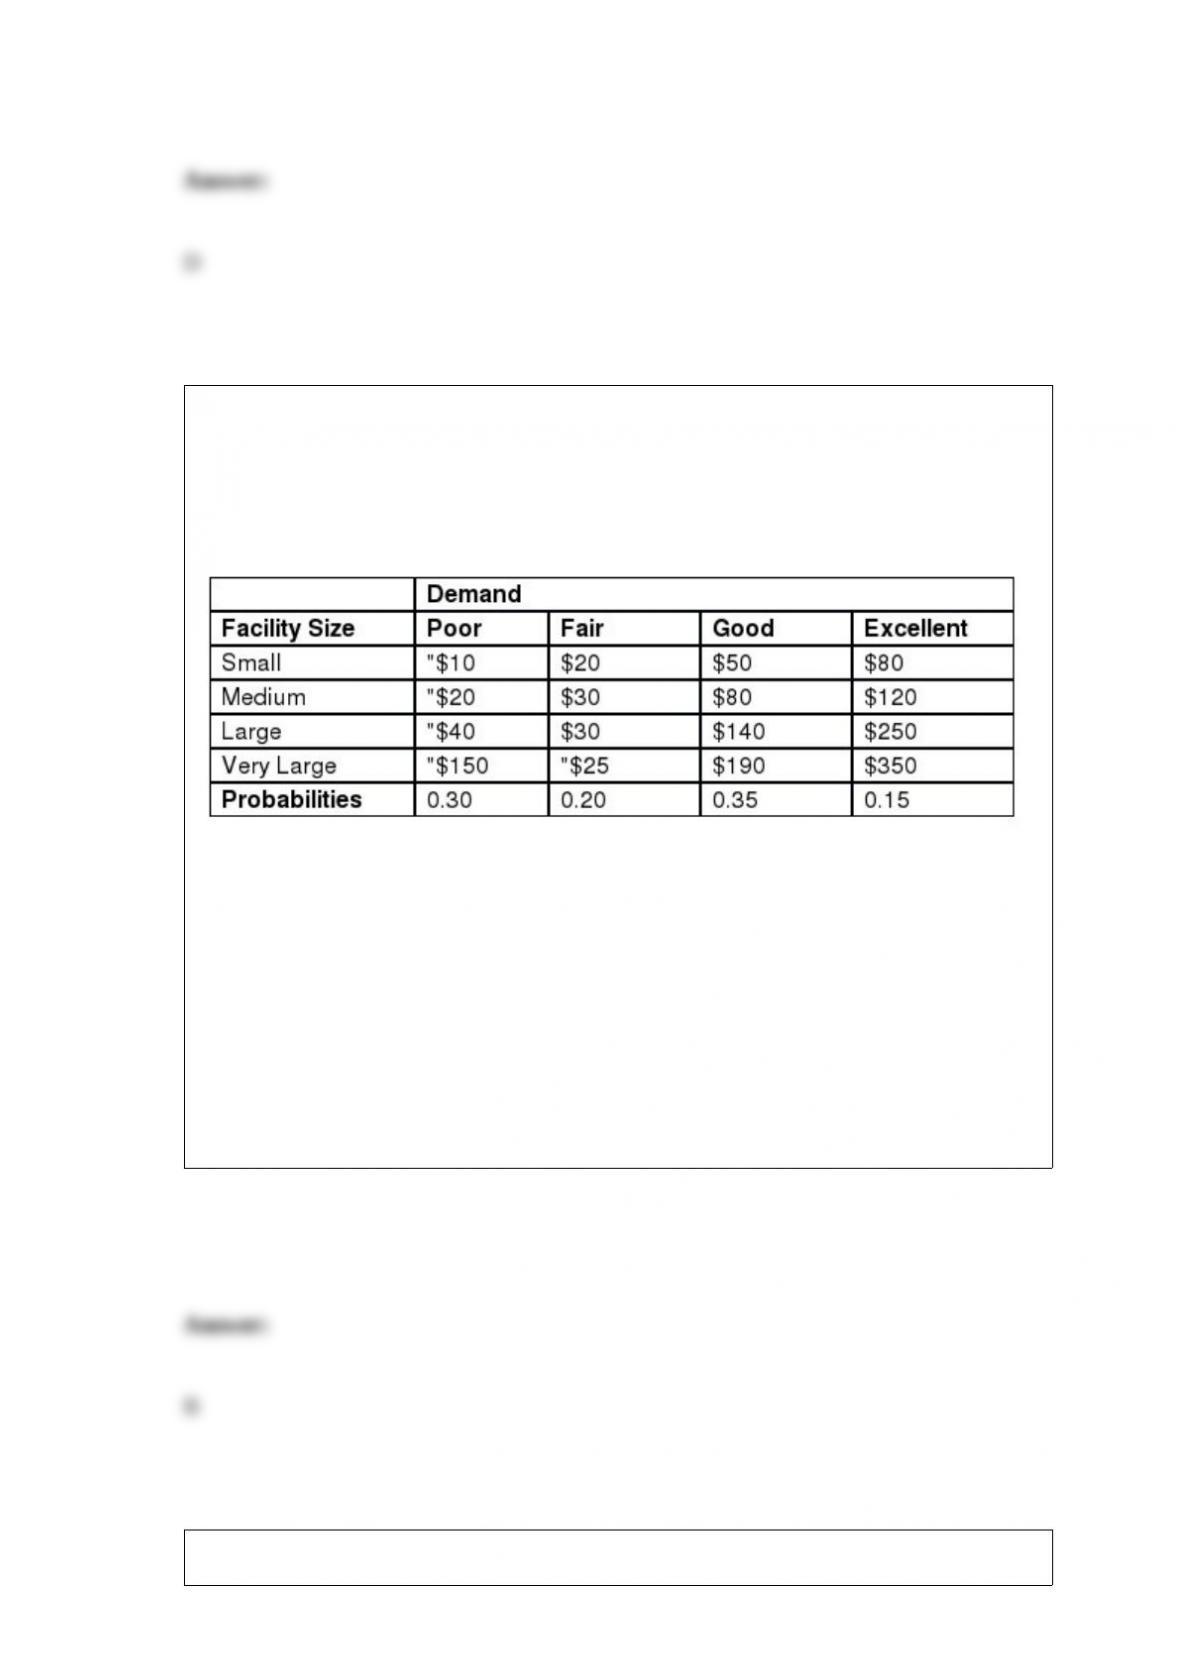
Scott has decided to invest in constructing and operating a new sandwich shop and
needs to decide how large to build this new facility. The annual profit, including the
depreciated investment, will depend on the demand for his products. The following
decision table shows the payoffs, in thousands of dollars, for various combinations of
facility size and demand along with Scott’s estimates for each demand level.
The expected monetary value, in thousands of dollars, for building a small facility is
_______.
A) $26.00
B) $30.50
C) $32.00
D) $35.50
The following table shows the number of employees at Diamond Corporation over the
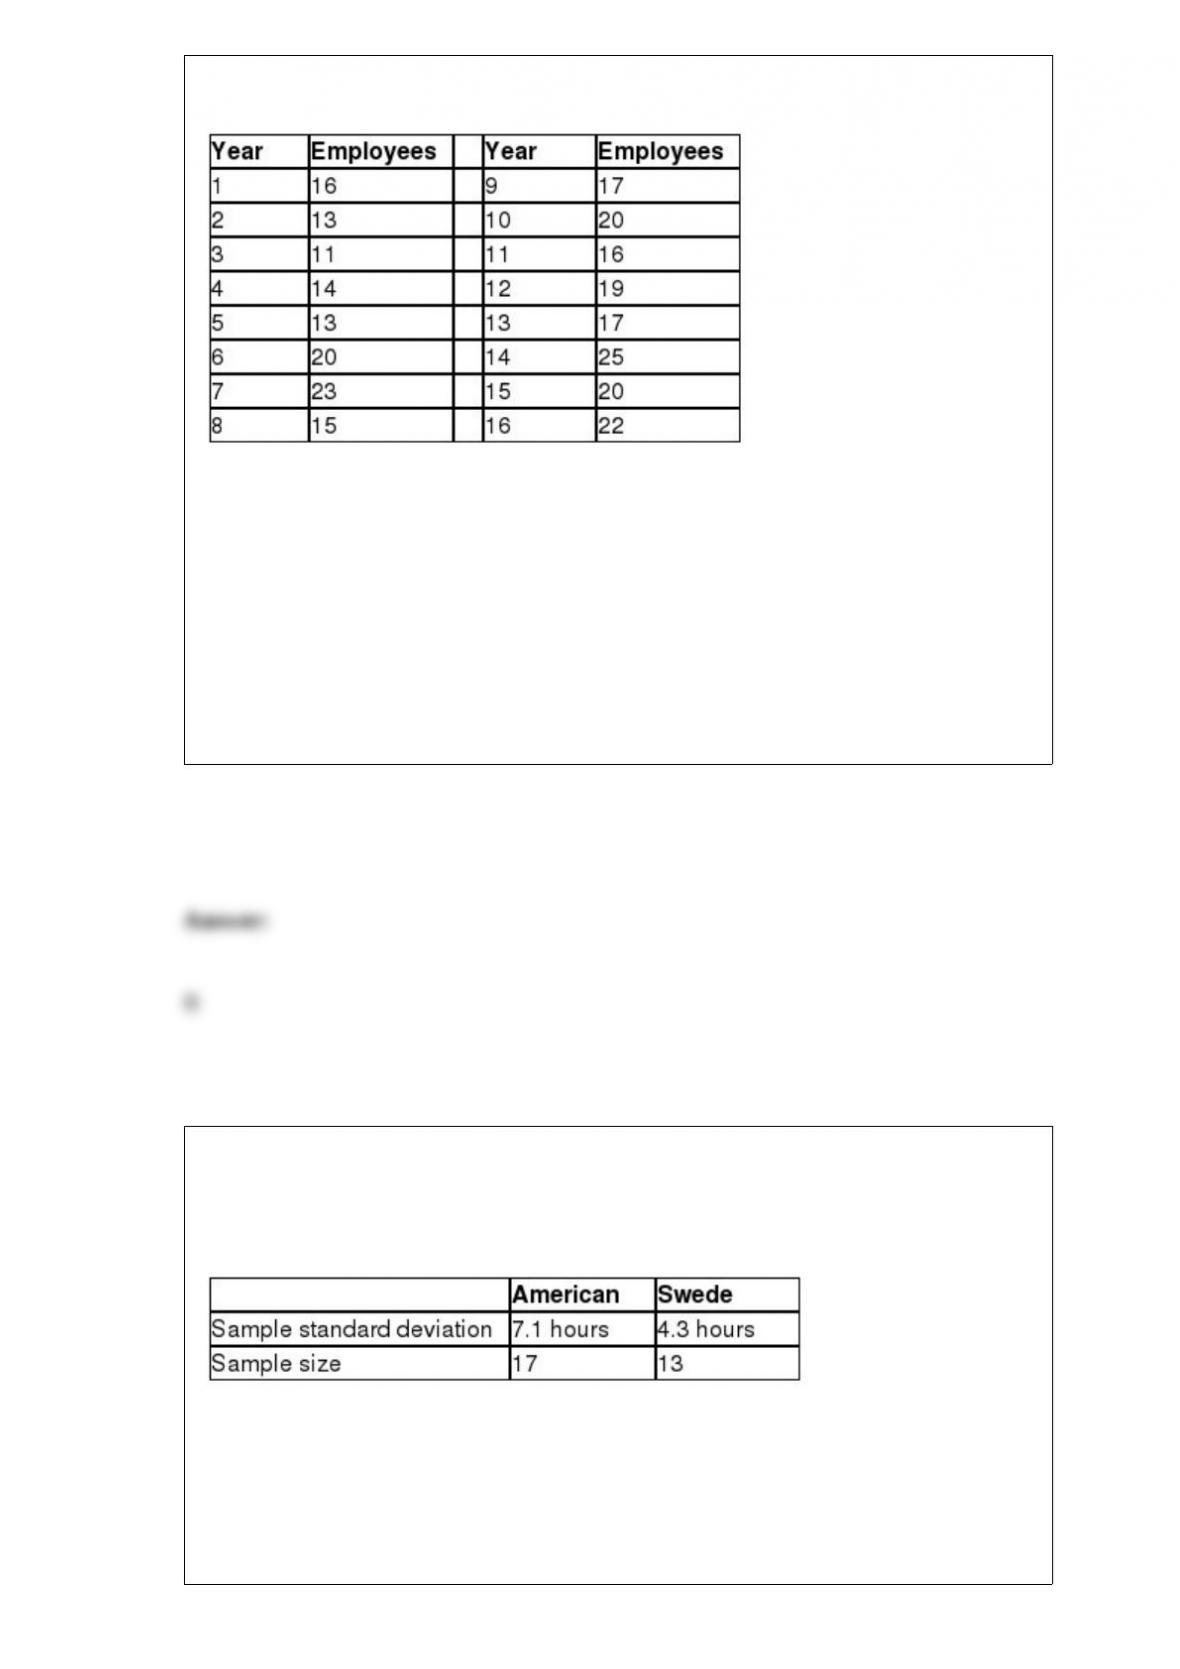
past 16 years.
The predicted number of employees for Year 17 using trend projection is ________.
A) 20.7
B) 22.3
C) 23.5
D) 24.0
You have been assigned to test the hypothesis that the variability for the number of
hours per week that an American works is equal to the variability for the number of
hours per week that a Swede works. The following data summarizes the sample
statistics for the number of hours worked per week for workers in each country.
Using α = 0.10, the critical value for this hypothesis test would be ________.
A) 1.906
B) 1.930
C) 2.599
D) 2.708
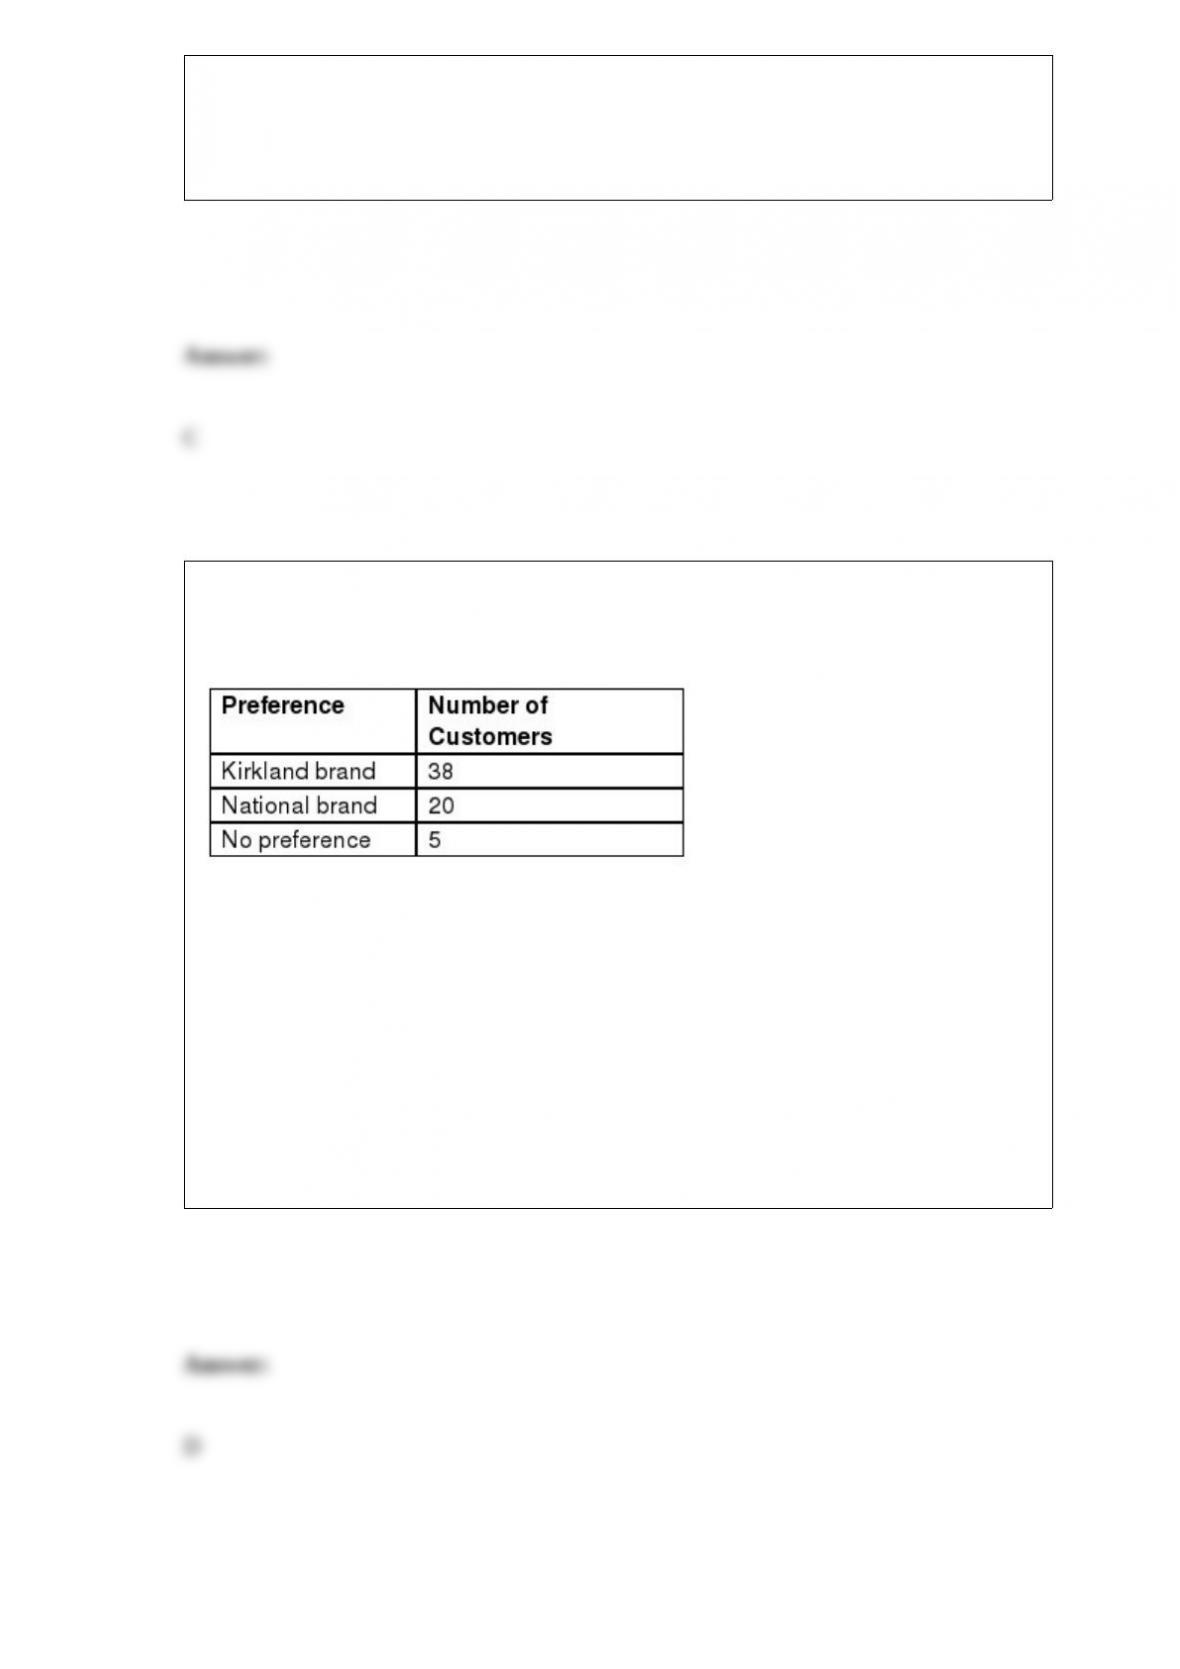
Costco Wholesale claims that Costco members prefer its Kirkland brand toilet paper
over the leading national brand. To test this claim, Costco recorded the preferences of a
random sample of customers which are summarized in the table below.
The standard deviation for the sampling distribution for this hypothesis test is
________.
A) 2.875
B) 3.011
C) 3.549
D) 3.808

Recently, Experian reported that the average credit score for a new-car loan was 753.
Suppose Ally Financial, a bank holding company that finances car loans, would like to
test the hypothesis that the average credit score has increased since the Experian report.
A random sample of 20 new-car loans had an average credit score of 764.2 with a
sample standard deviation of 34.5. Ally Financial would like to set α = 0.05. The
conclusion for this hypothesis test would be that because the test statistic is
_________________.
A) more than the critical value, we can conclude that the average credit score for a
new-car loan is more than 753
B) more than the critical value, we cannot conclude that the average credit score for a
new-car loan is not more than 753
C) less than the critical value, we can conclude that the average credit score for a
new-car loan is more than 753
D) less than the critical value, we cannot conclude that the average credit score for a
new-car loan is not more than 753
The Wall Street Journal reported that there is evidence that Mac users are shown more
expensive hotel prices when using Orbitz than PC users. Perform a hypothesis test to
determine if the median hotel price for Mac users on Orbitz is higher than for PC users.
The following data summarizes the sample statistics for hotel rates using Orbitz for PC
and Mac users..
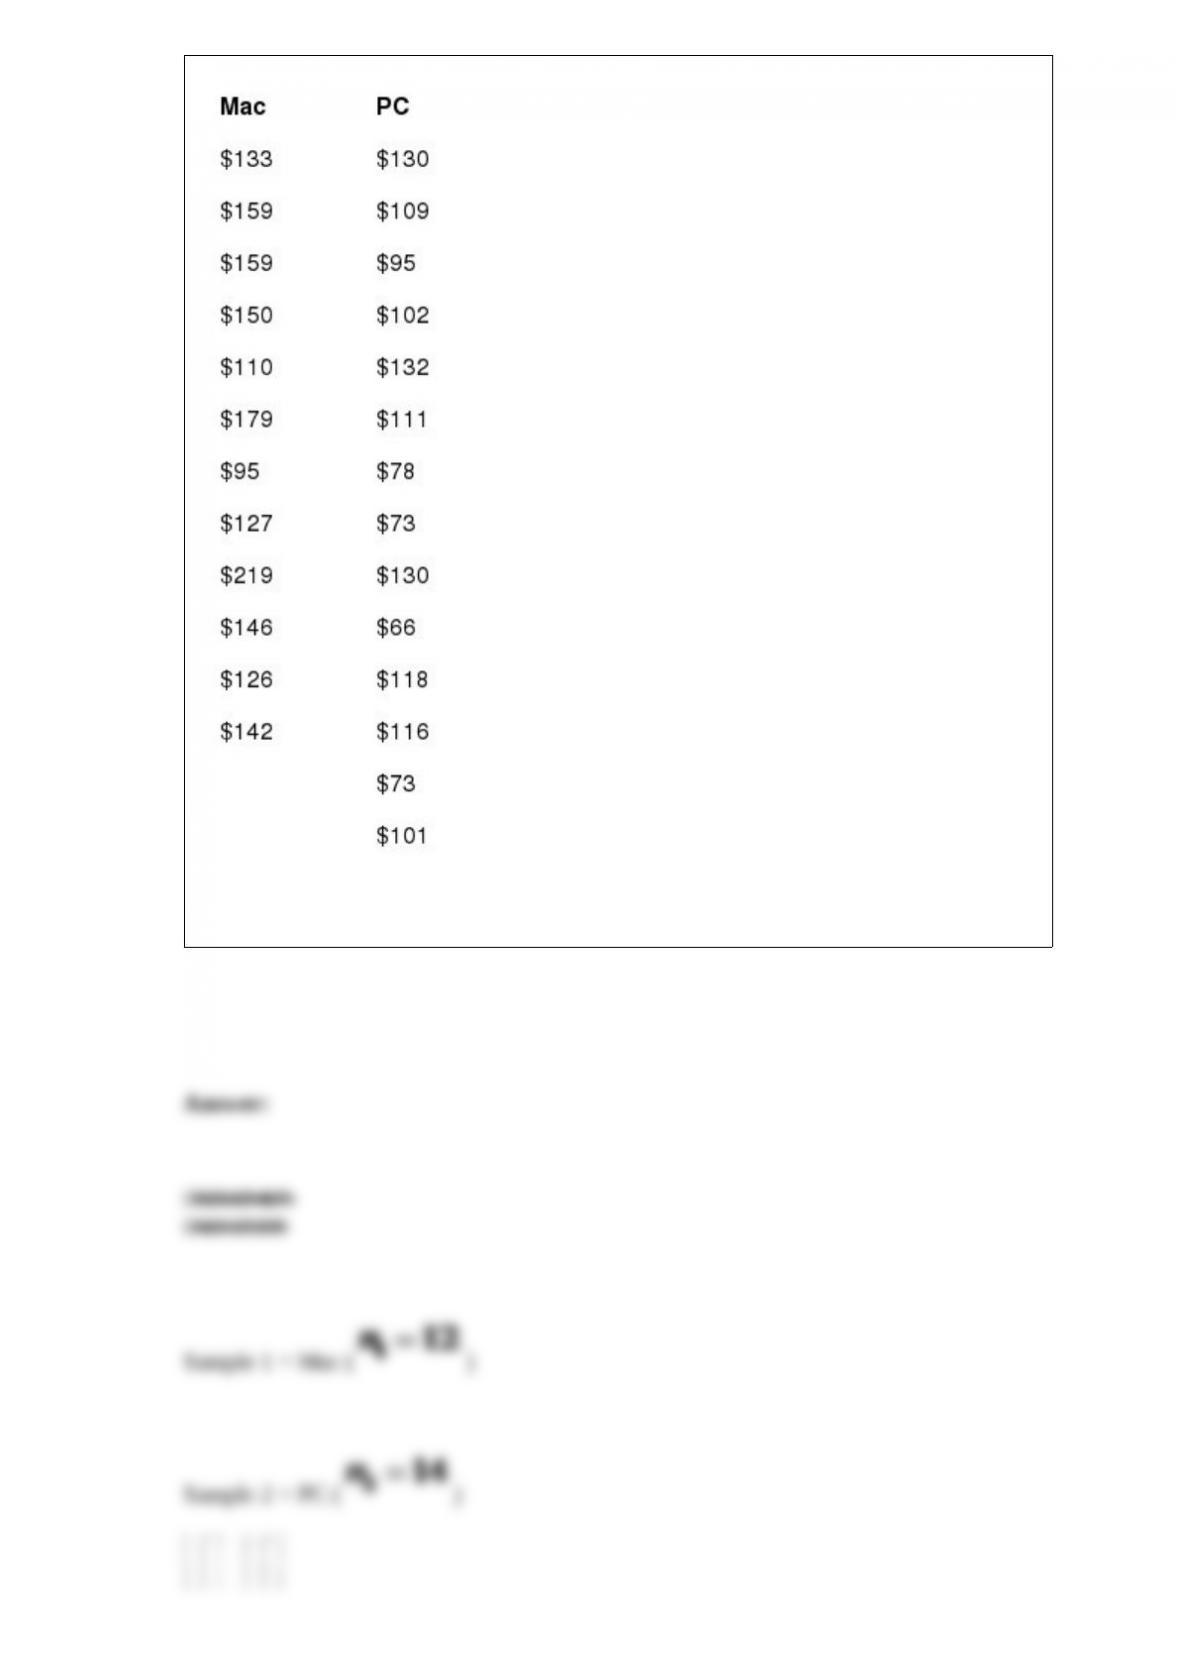
Perform this hypothesis test using α = 0.05.
The management of the Green Bay Packers football team would like to test the
hypothesis that the average price of a ticket is less than $225 on the secondary market.
A random sample of 40 customers paid an average of $207 for their ticket. Assume that
the standard deviation of the price of tickets for Packers games is $43. The Green Bay
Packers would like to set α = 0.01. Use the p-value approach to test this hypothesis.
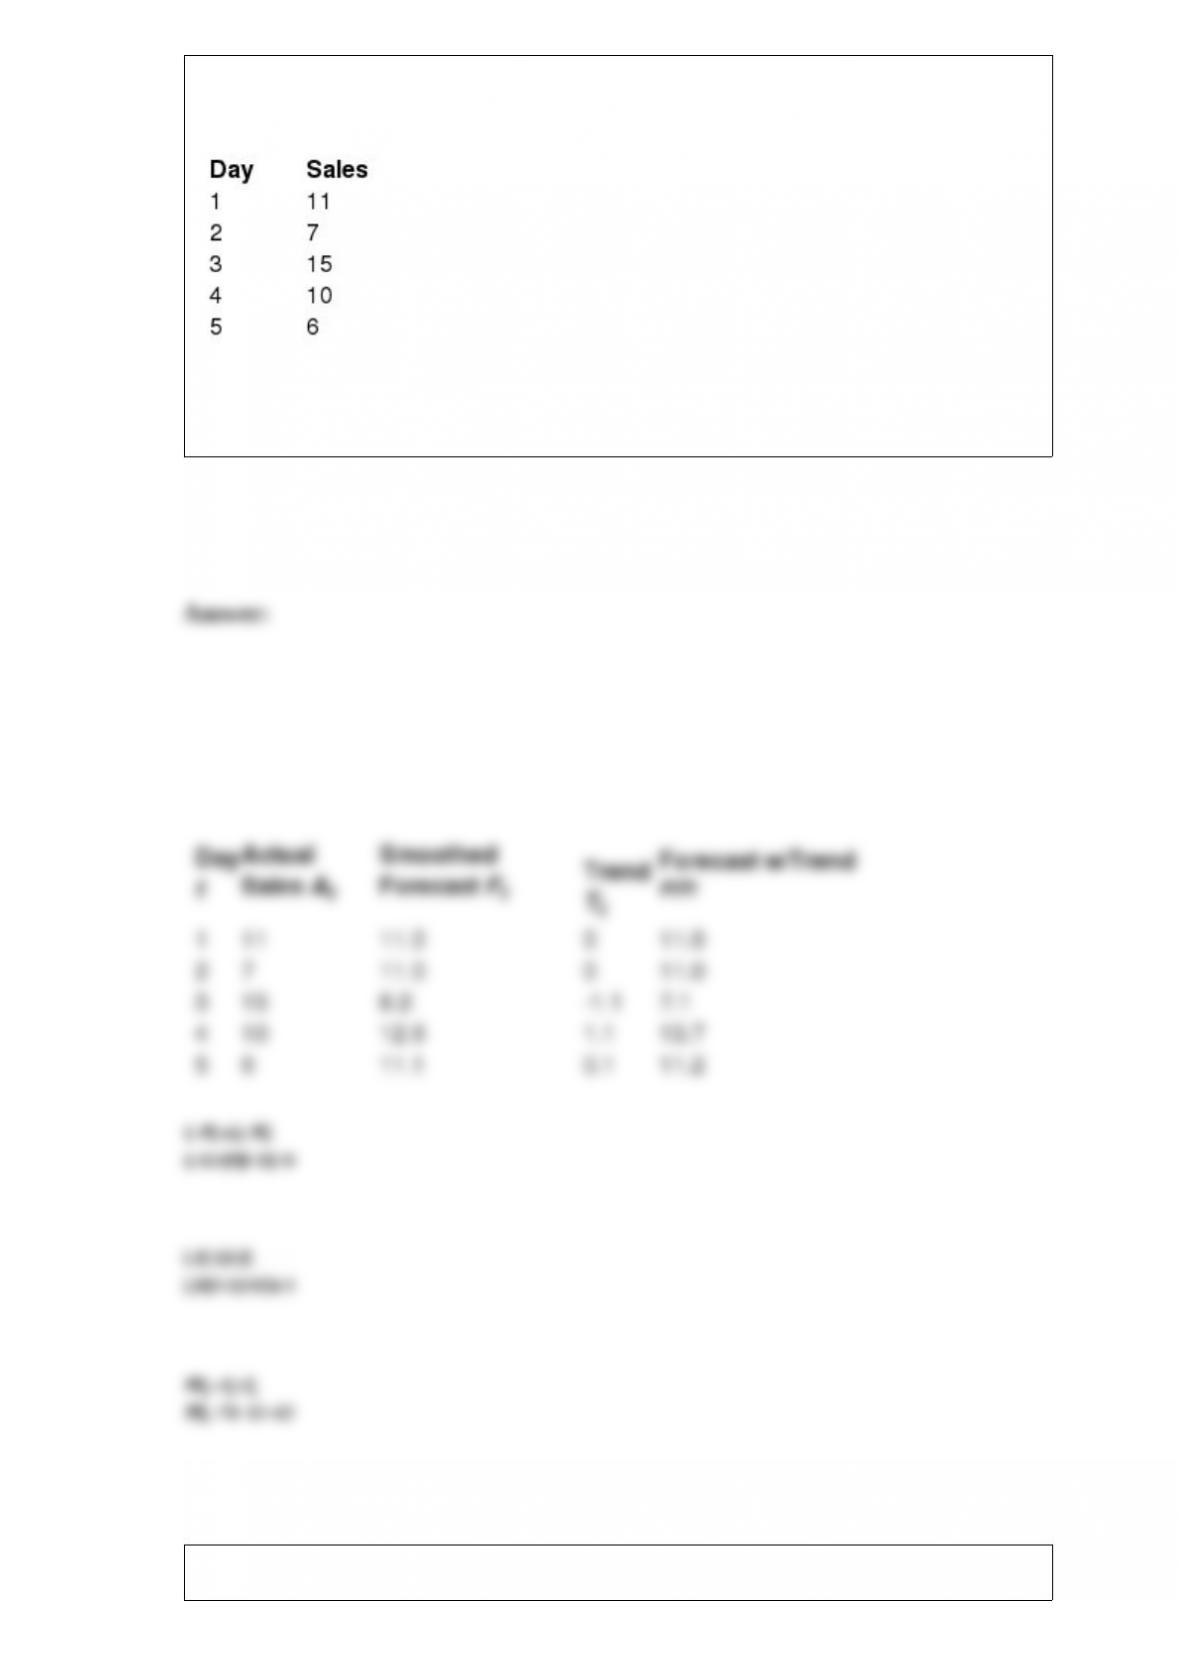
The following data represent the number of ceiling fans sold for each of the past five
days for a Home Depot store.
Calculate the sales forecast for Day 6 using exponential smoothing with trend
adjustment with α = 0.7 and β = 0.4.
The USDA would like to investigate if a difference exists in the proportion of people
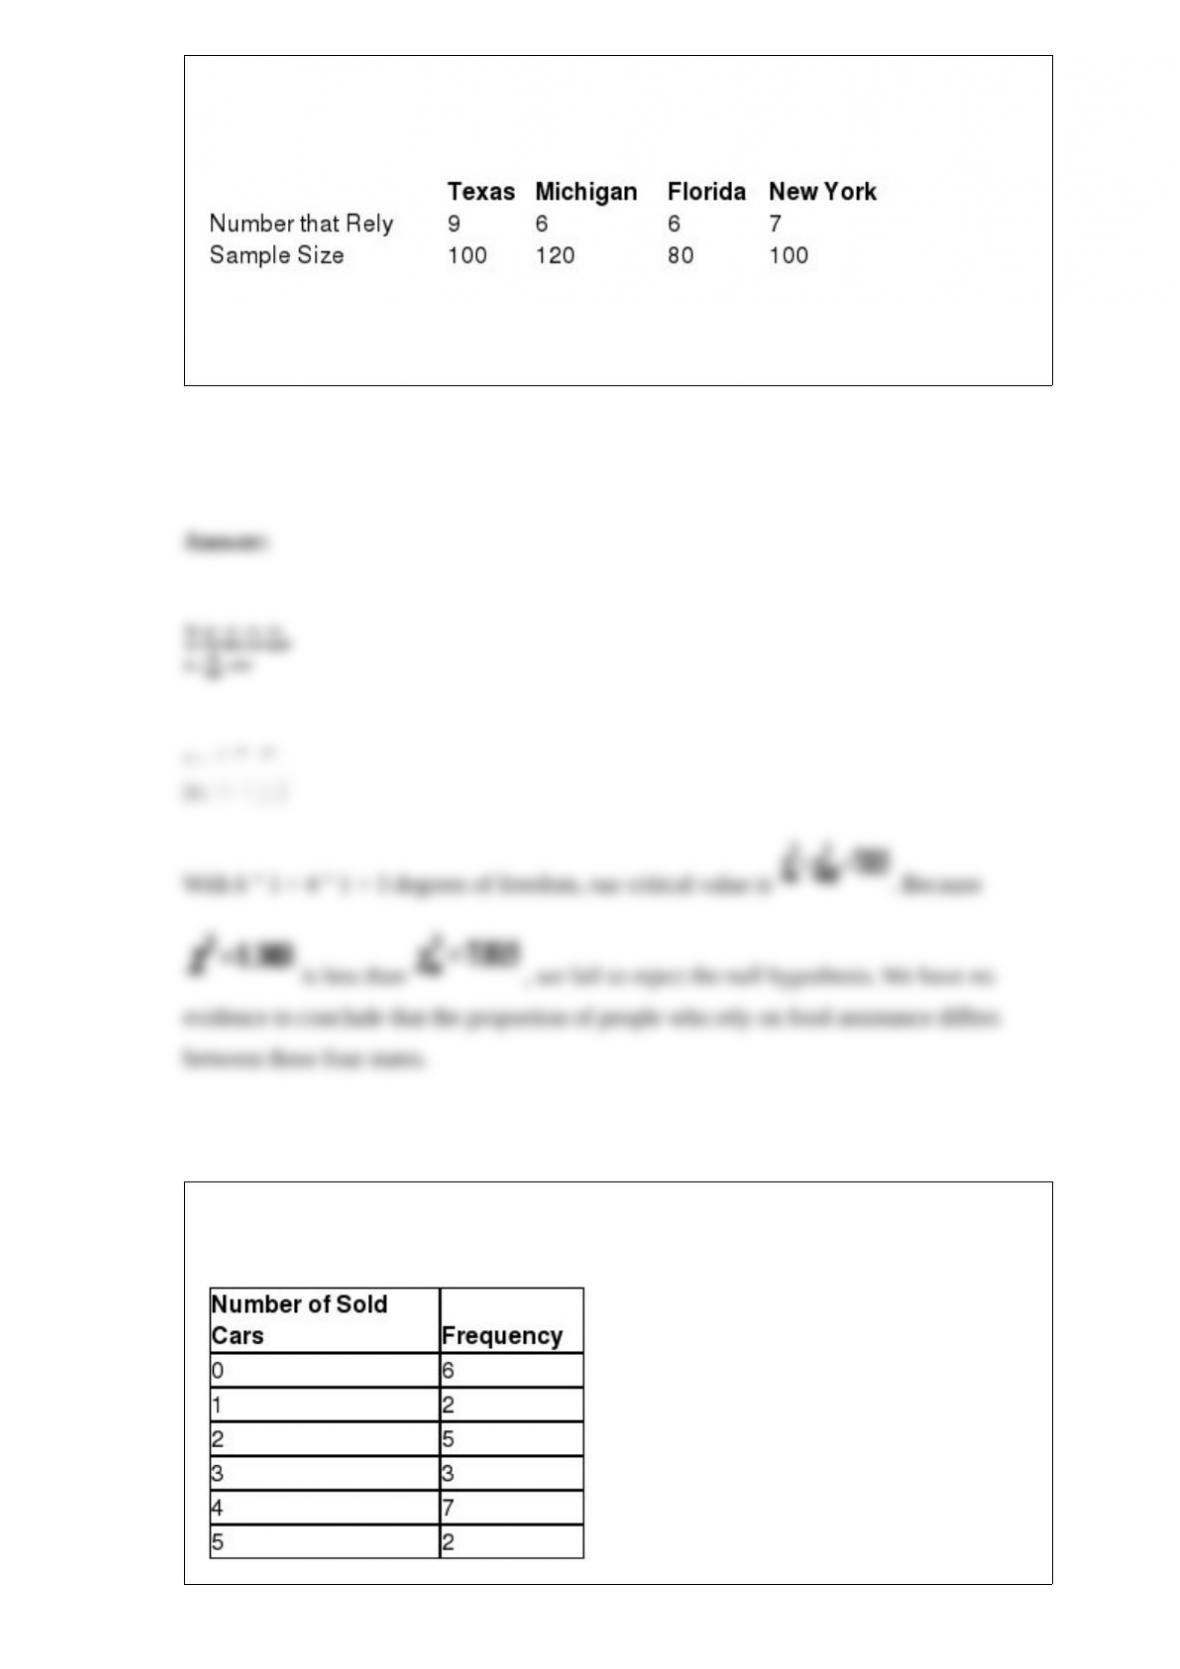
who rely on food assistance between the states of Texas, Michigan, Florida, and New
York. The following data represent the number people who rely on food assistance from
random samples taken from each state.
Perform a chi-square test to determine if the proportion of people who rely on food
assistance differs between these four states using α = 0.05.
The following table shows the number of used cars sold each day over the last 25
business days at Newark Motors.
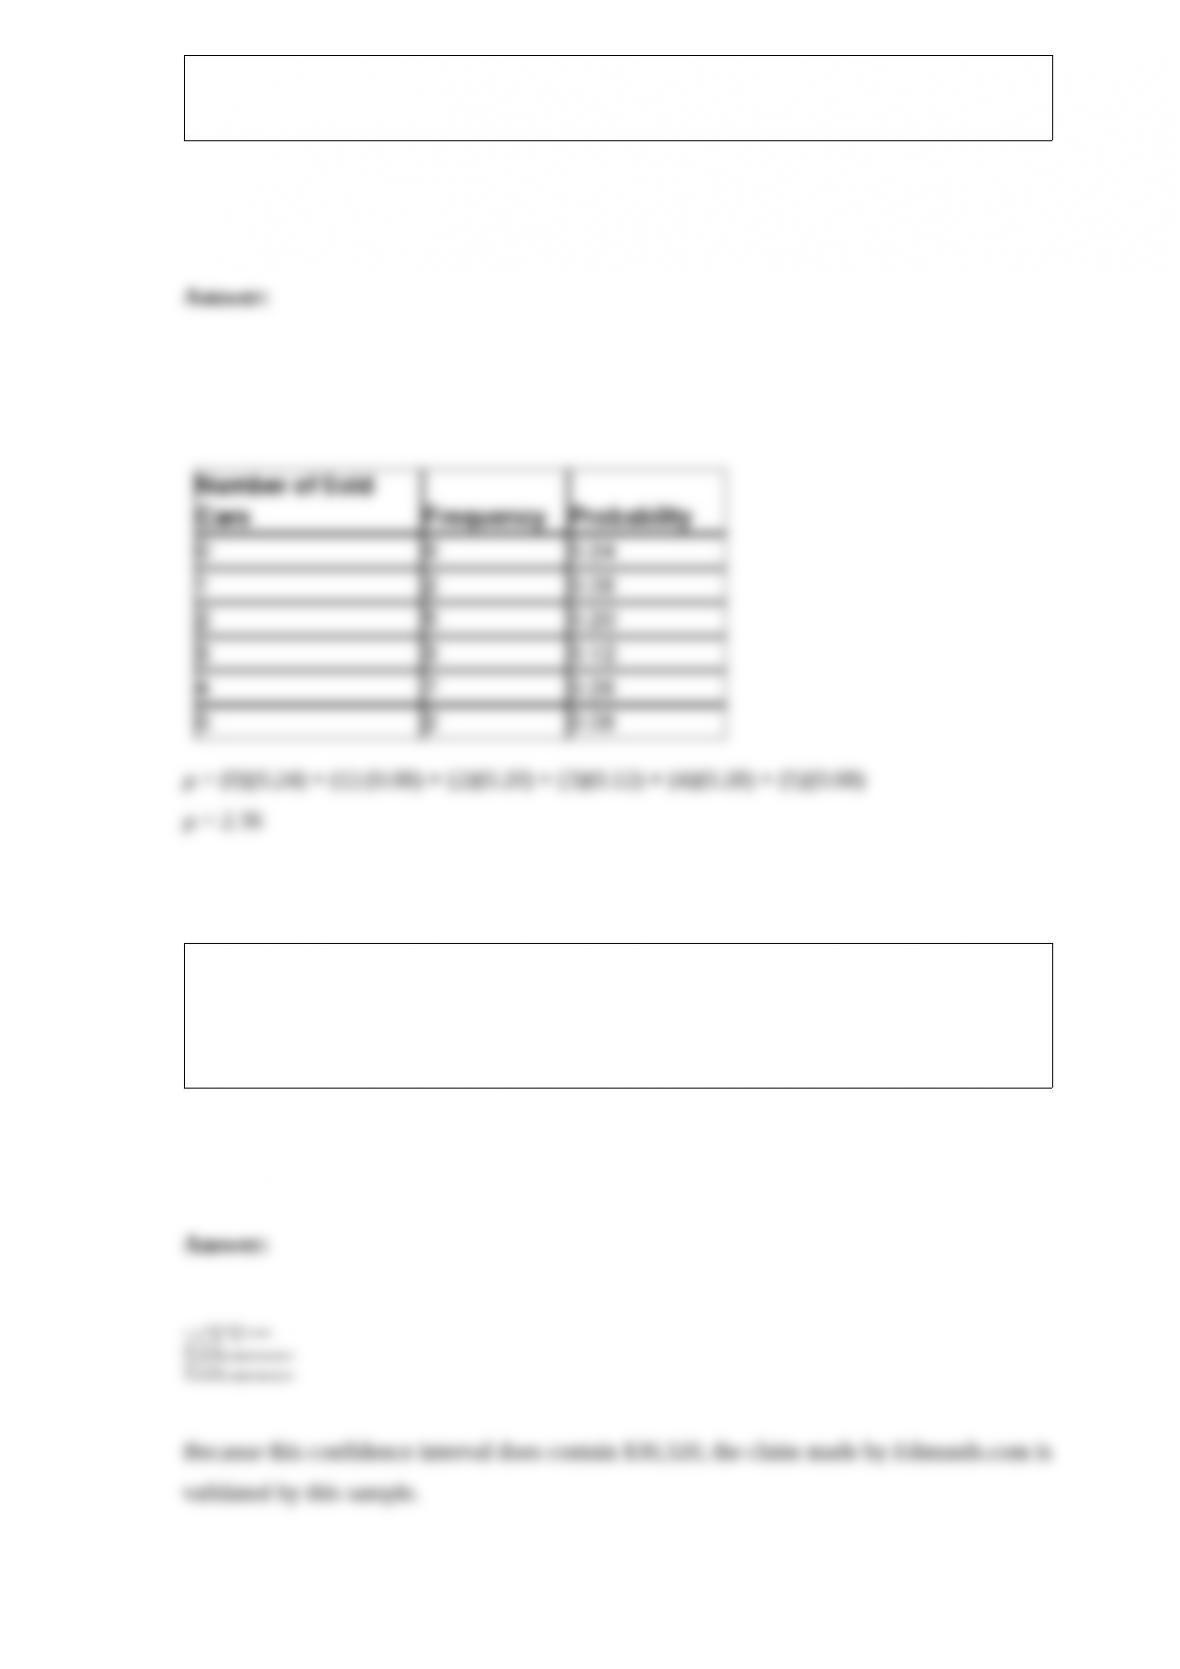
What is the mean number of cars sold per day?
According to Edmunds.com, the average price that shoppers paid for a new car is
$30,320. Assume that the standard deviation for the price shoppers pay is $8,740. A
random sample of 38 people who purchased a new car paid an average of $32,700. Use
a 98% confidence interval to test the validity of claim made by Edmunds.com.
A college student population of freshman and seniors was surveyed to determine if they
prefer traditional textbooks or digital textbooks. According to this sample, 60% of
freshman students preferred digital textbooks. Forty percent of the sample consisted of
freshman students. Also, 20% of senior students preferred digital textbooks. Given that
a student prefers digital textbooks, use Bayes’ Theorem to determine the probability that
the student is a freshman.
The following table shows the number of spam e-mails that arrive in my inbox each
day.
What is the probability of receiving five or more spam e-mails today?
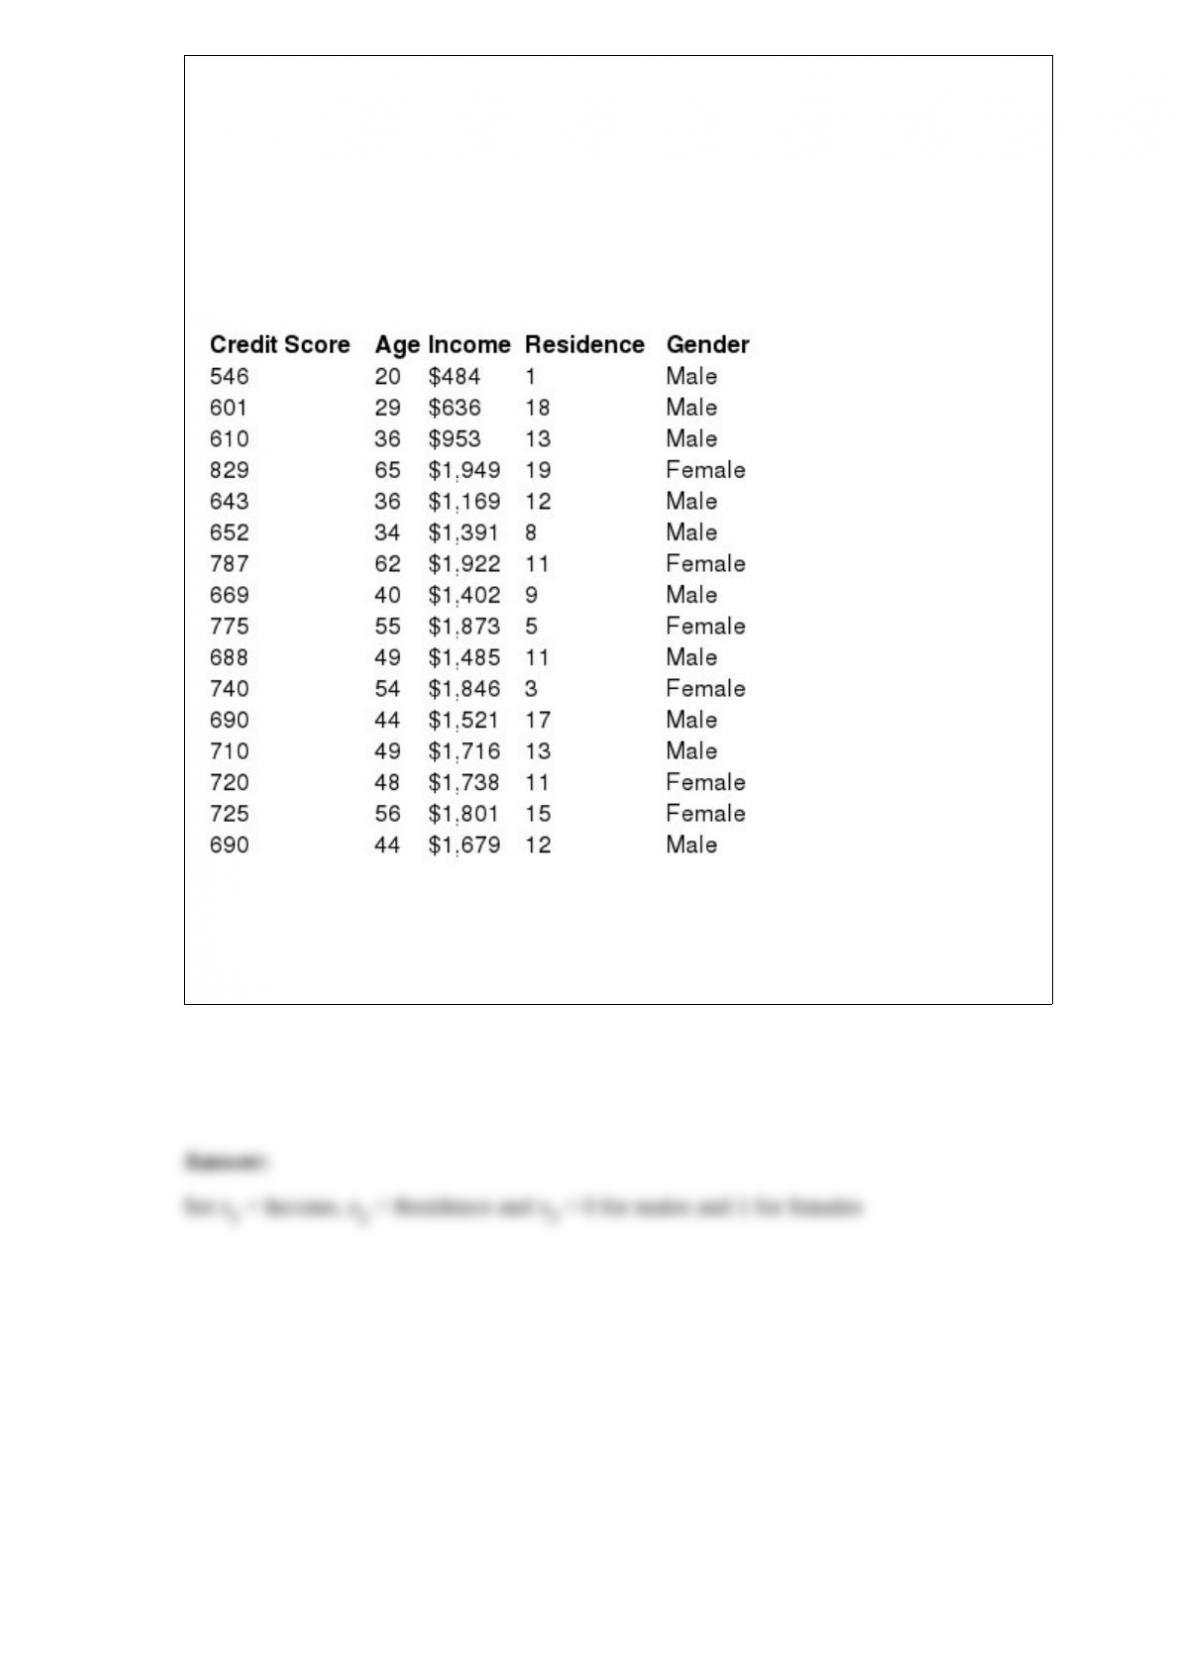
Use the following information to answer the question(s) below.
Suppose CitiMortgage would like to develop a regression model that would predict a
person’s credit score based on their age, weekly income, years living in their current
residence, and gender (Male = 0, Female = 1). The following data represent the values
for the independent and dependent variables from a random sample of adults.
Perform a general stepwise regression for the CitiMortgage data using the independent
variables that do not exhibit multicollinearity. Use 0.05 as the p-values to enter and
remove. Interpret the meaning of the regression coefficients for the final model.