The chi-square test of independence does not allow us to state that one variable causes a
change in another variable when the null hypothesis is rejected.
The multiple correlation coefficient is the percent of variation in the dependent variable
explained by all of the independent variables.
The dependent variable in a scatter plot is influenced by changes in the independent
variable.
The rejection region for a two-population variance test will always be in the lower tail
of the sampling distribution.

The exponential probability distribution is a discrete distribution that is often used to
describe time between customer arrivals.
When determining the payoffs for a decision table with order quantity as the alternative
and demand as the state of nature, the quantity sold will always be the maximum of the
order quantity and demand.
Pareto chartsare a specific type of bar chart used in quality control programs by
businesses to graphically display the causes of problems.
Observing whether a customer purchases or does not purchase an extended warranty for
a new laptop would be best described using a uniform probability distribution.
There is no statistical technique for directly testing a hypothesis about a population
standard deviation.
Decision making under uncertainty is the procedure of choice when we have no
information about the probability for each state of nature.
The hypothesis statement H: μ < 60 is an example of an alternative hypothesis.
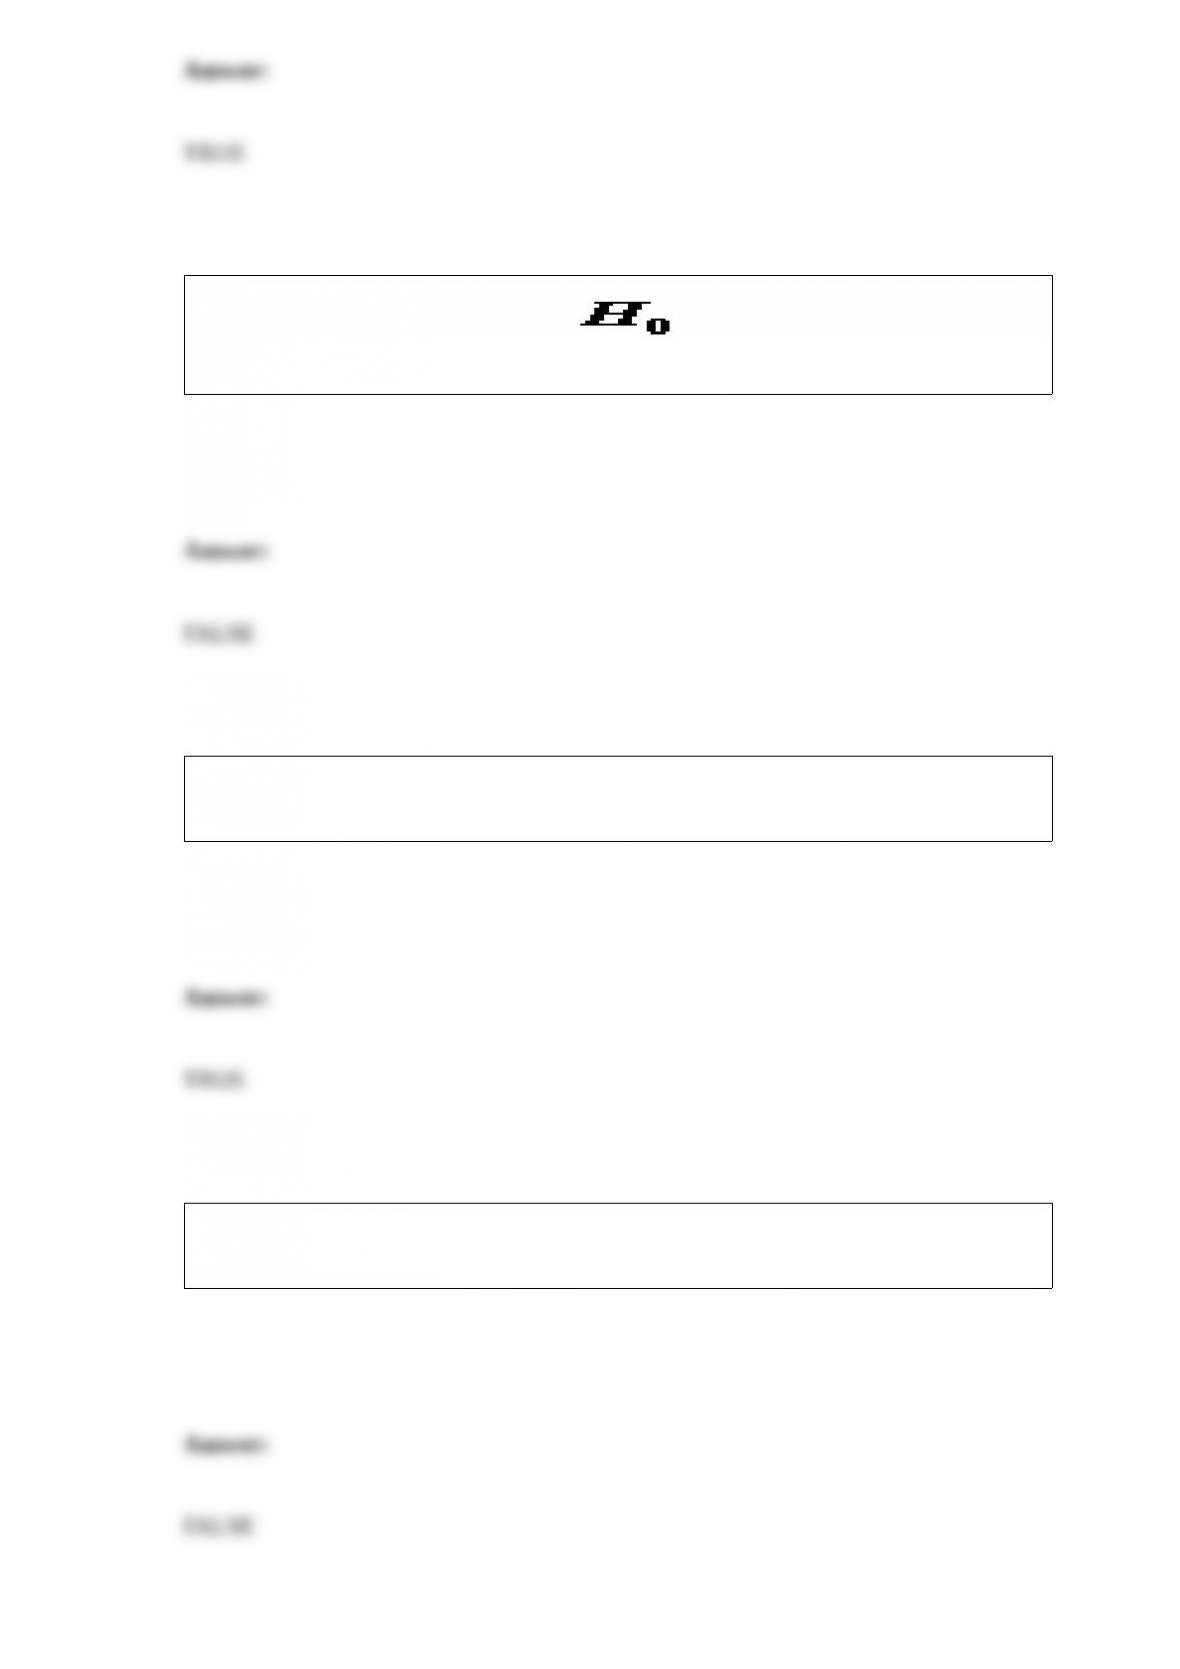
The alternative hypothesis, denoted by , represents the status quo and
involves stating the belief that the population parameter is, ≤, =, or ≥ a specific value.
The expected value under risk (EVUR) is the expected monetary value that corresponds
to the best alternative when making a decision under risk.
The sum of the cumulative relative frequencies for the cumulative relative frequency
distribution should be equal to or very close to 1.0 due to rounding.
A sample proportion equal to 0.50 will require the smallest sample size to achieve a
particular margin of error for a confidence interval for the proportion.
Choose a pie chart rather than a bar chart if you want to compare the relative sizes of
the classes to one another and together they comprise all possible categories.
The expected value of sample information (EVSI) represents the lower limit of how
much you should pay to gather a sample to acquire additional information about the
alternatives.
Simple linear regression describes a straight line that explains how a change in a
dependent variable influences a change in an independent variable.

It is recommended to choose the appropriate value of alpha for the hypothesis test after
the data has been collected from the sample.
When performing a hypothesis test to compare two or more population proportions, the
observed frequencies must always be integer values.
Parametric statistics can be used to perform a hypothesis test to estimate the population
median.
A sample space is described as mutually exclusive if it includes every possible simple
event that can occur.
The number of cells in a two-way ANOVA procedure is equal to the number of levels in
Factor A multiplied by the number of levels of Factor B.
Statistics is the mathematical science that deals with the collection, analysis, and
presentation of data”data that can then be used as a basis for inference and induction.
The shape of the t-distribution becomes similar to the binomial distribution as the
sample size increases.
Data values that have z-scores above +1.0 or below -1.0 are categorized as outliers.
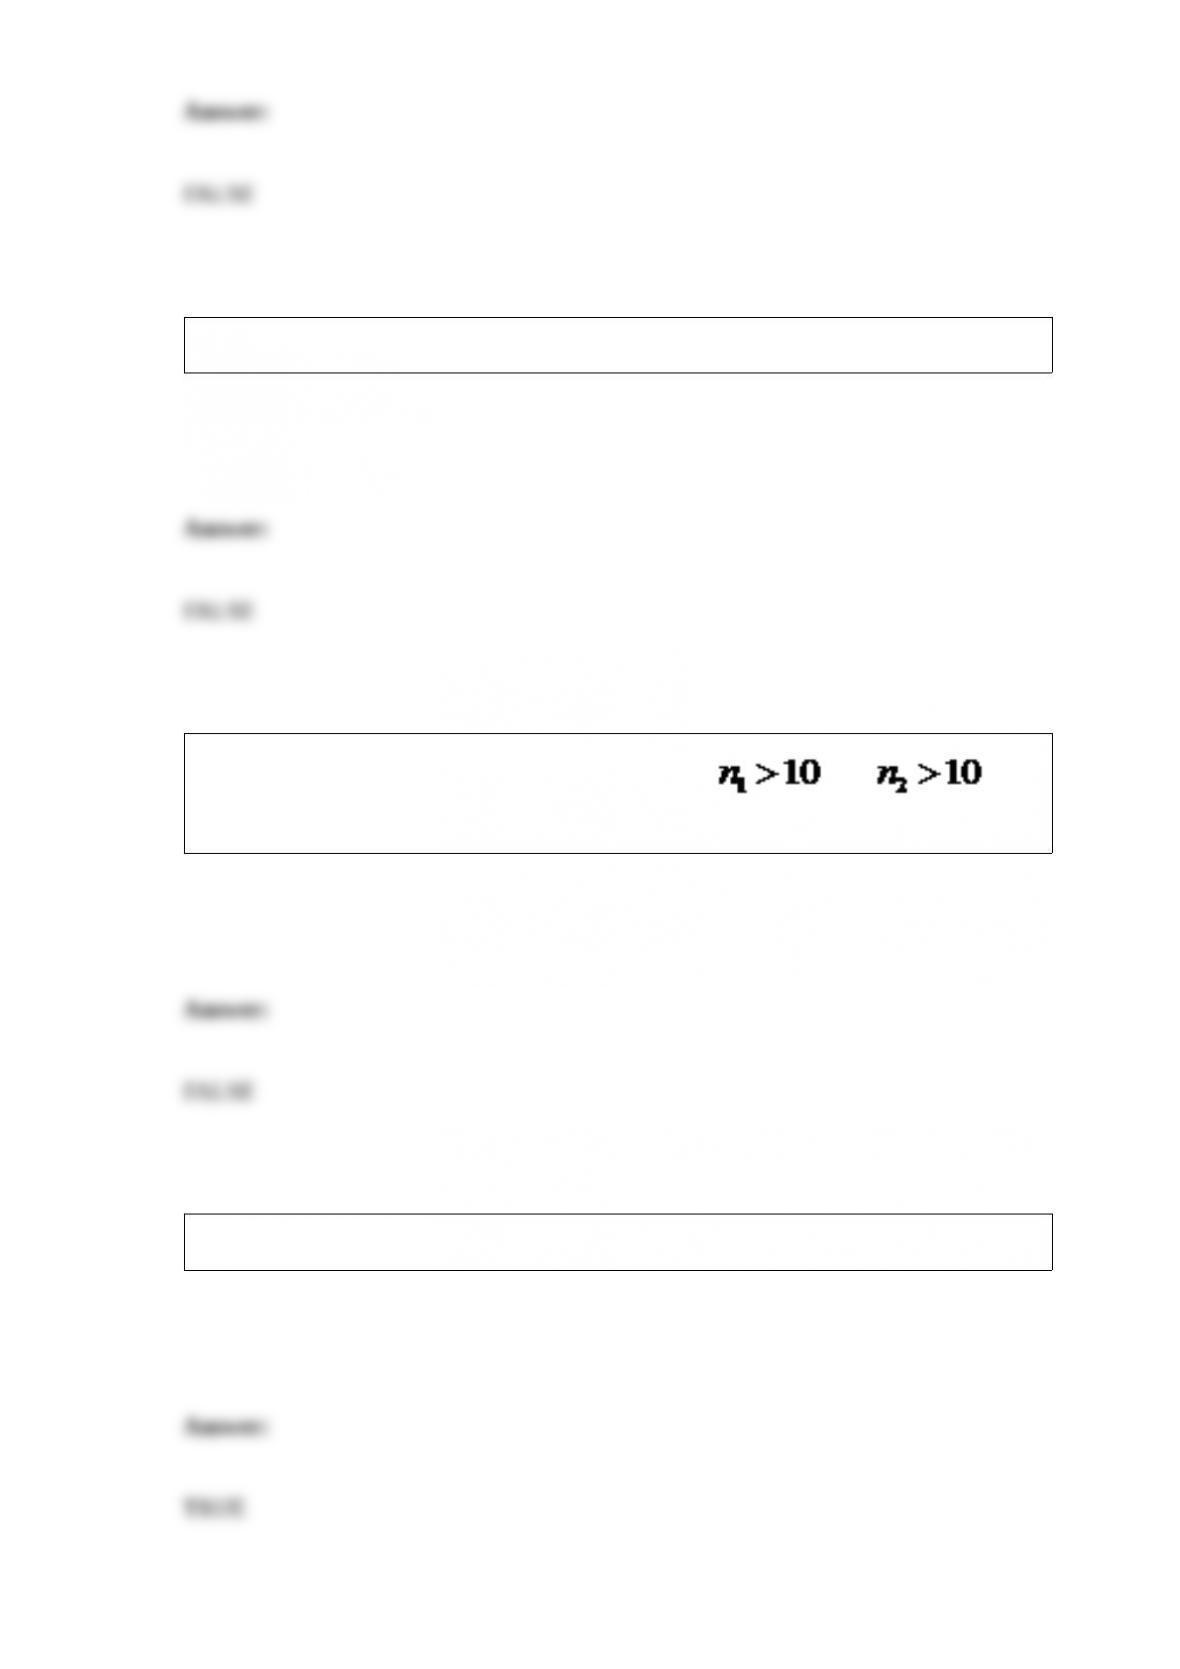
The large sample case of the Wilcoxon rank-sum test ( and ), the
test statistic can be approximated by the binomial probability distribution.
Typical values for alpha generally range from 1% to 10% for hypothesis testing.
The degrees of freedom for the sum of squares error for randomized block ANOVA
equal the number of blocks multiplied by the number of population means being
compared.
In a two-way ANOVA procedure, there are two hypotheses to be testedthe test for
Factor A and the test for factor B.
The value of β depends on the actual value of μ or p.
The appropriate test statistic for one-way ANOVA follows the normal probability
distribution.

Consider the following events:
Event A = The survey respondent is a registered Republican.
Event B = The survey respondent lives in Ohio.
Events A and B are mutually exclusive.
The sampling distribution of the mean describes the pattern that individual observations
tend to follow when randomly drawn from a population.
Measuring the entire population is usually preferred over measuring a sample from the
population.

The expected value under certainty (EVUC) provides us with an upper limit for how
much we should pay for additional information to improve our decision.
In order to get valid results, the hypothesis test for comparing two population variances
requires that the populations from which the samples are drawn be normally distributed.
A local church has a congregation consisting of 480 adult members. The church’s
administrators would like to estimate the average weekly donation per member per
week. A random sample of 65 members was found to have an average donation of
$50.40 and a standard deviation of $12.30. The 95% confidence interval to estimate the
average weekly donation is ________.
A) ($47.56, $53.24)
B) ($43.30, $57.50)
C) ($45.41, $55.39)
D) ($44.30, $56.08)
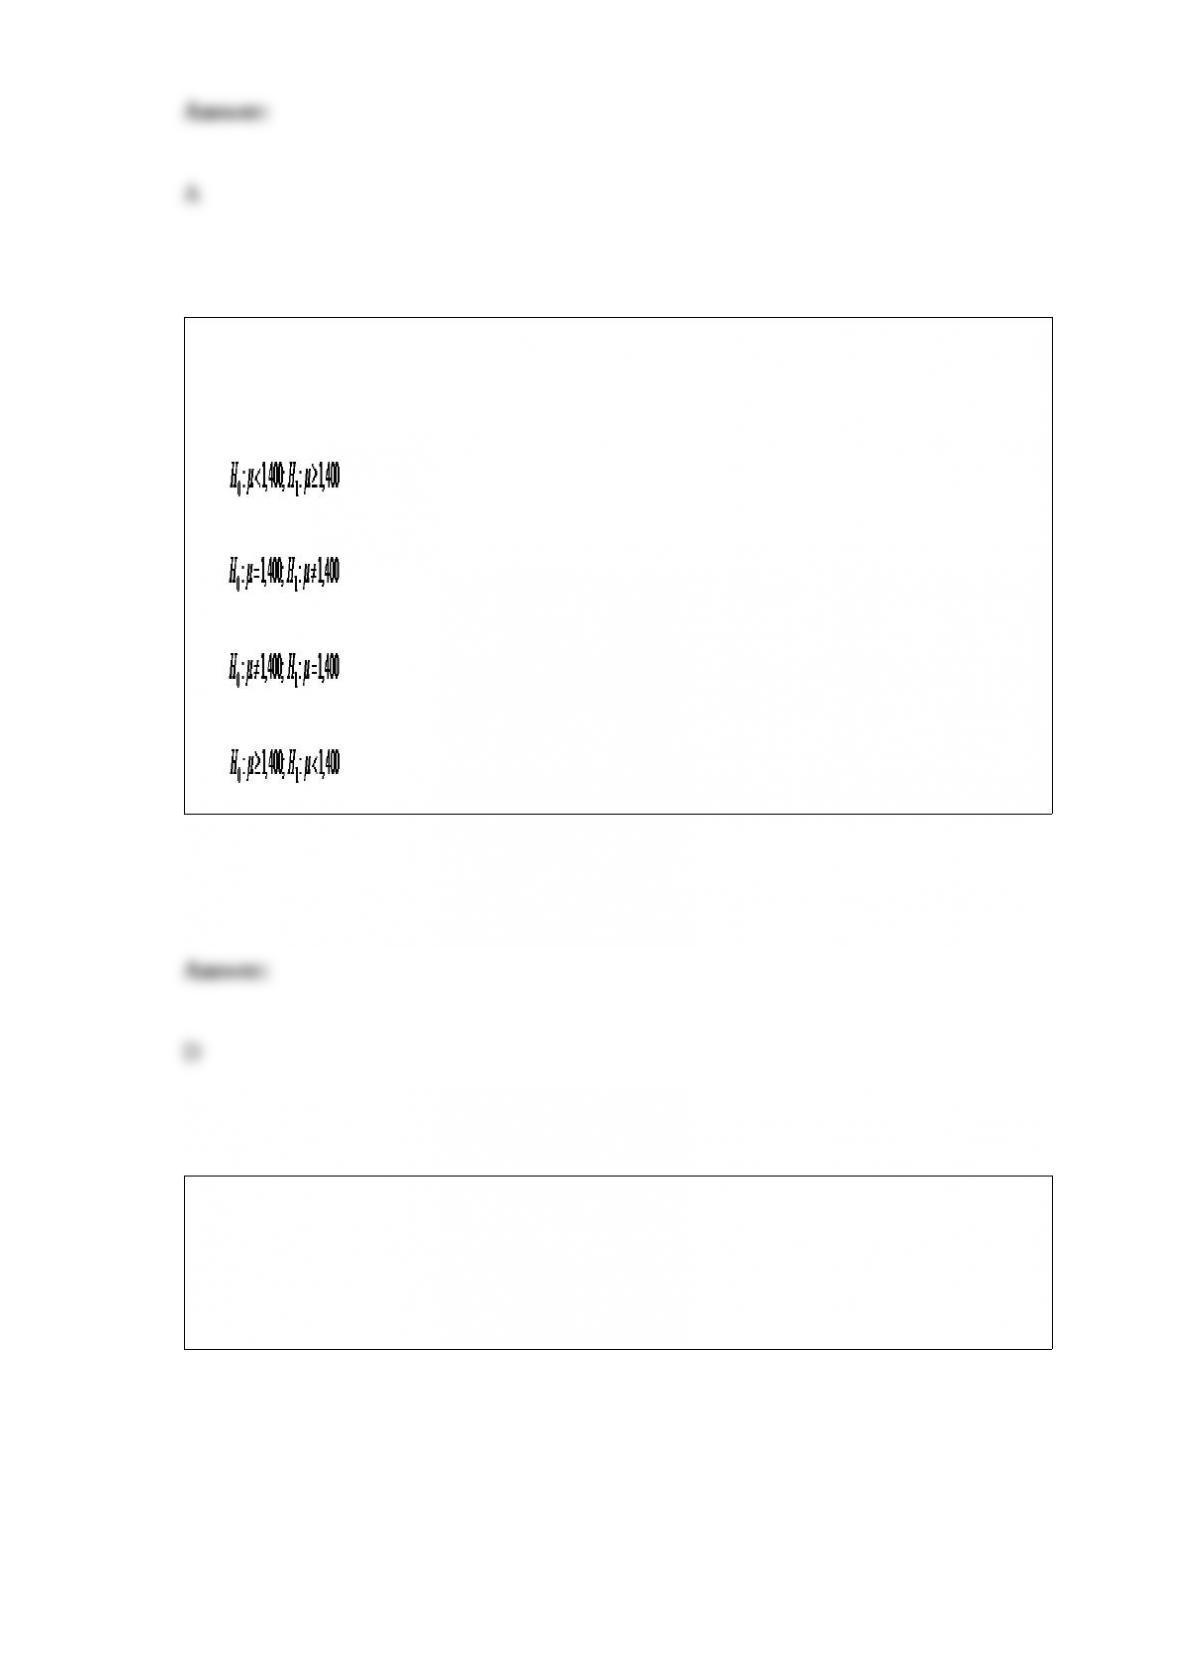
Travelocity would like to test if the average roundtrip airfare between New York and
London is less than $1,400. The correct hypothesis statement for this test would be
________________.
A)
B)
C)
D)
Sarah is the office manager for a group of financial advisors who provide financial
services for individual clients. She would like to investigate whether a relationship
exists between the number of presentations made to prospective clients in a month and
the number of new clients per month. The following table shows the number of
presentations and corresponding new clients for a random sample of six employees.
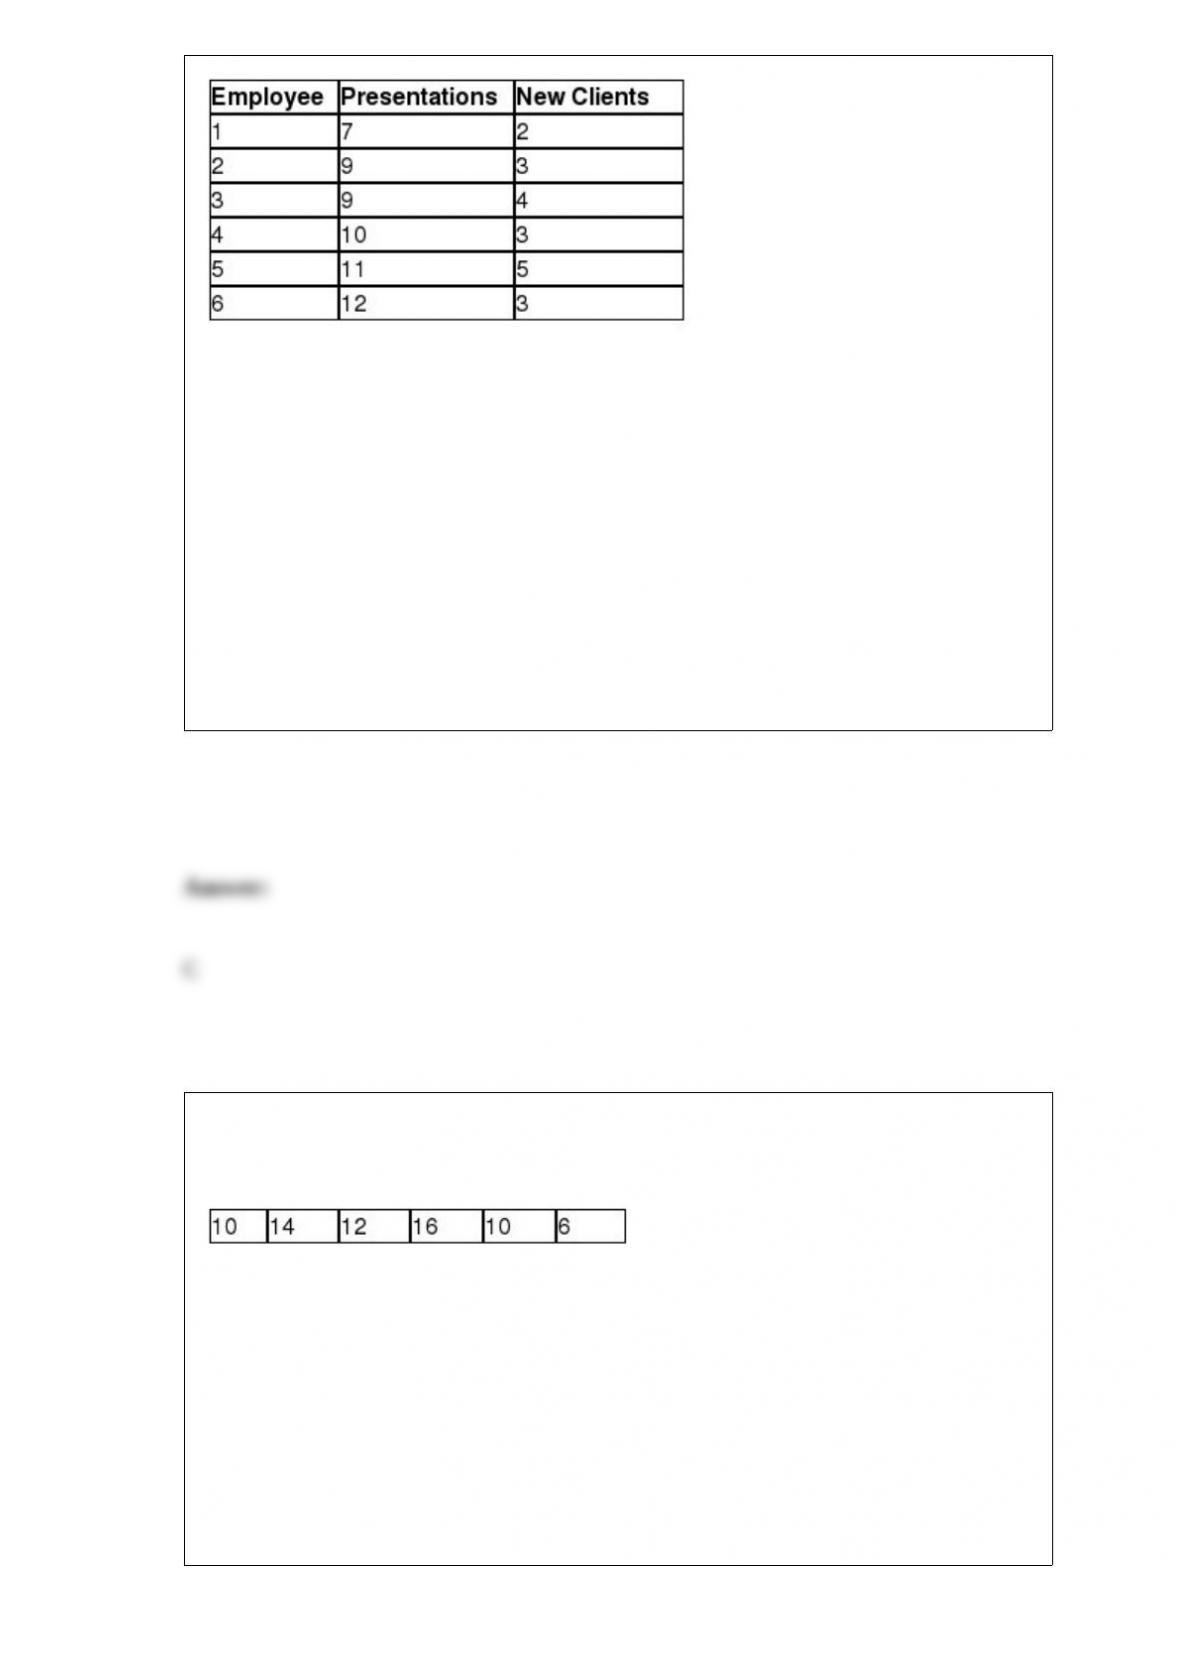
Sarah would like to use simple regression analysis to estimate the number of new
clients per month based on the number of presentations made by the employee per
month. The test statistic for testing that the population slope is not equal to zero is
________.
A) -0.89
B) 0.64
C) 1.20
D) 3.19
Suppose Apple would like to test the hypothesis that the standard deviation for the web
browsing battery life of the iPad equals 3.0 hours. The following data represents the
battery life, in hours, experienced by a random sample of six users.
Using α = 0.05, the upper critical value for this hypothesis test would be ________.
A) 0.831
B) 1.237
C) 12.833
D) 14.449
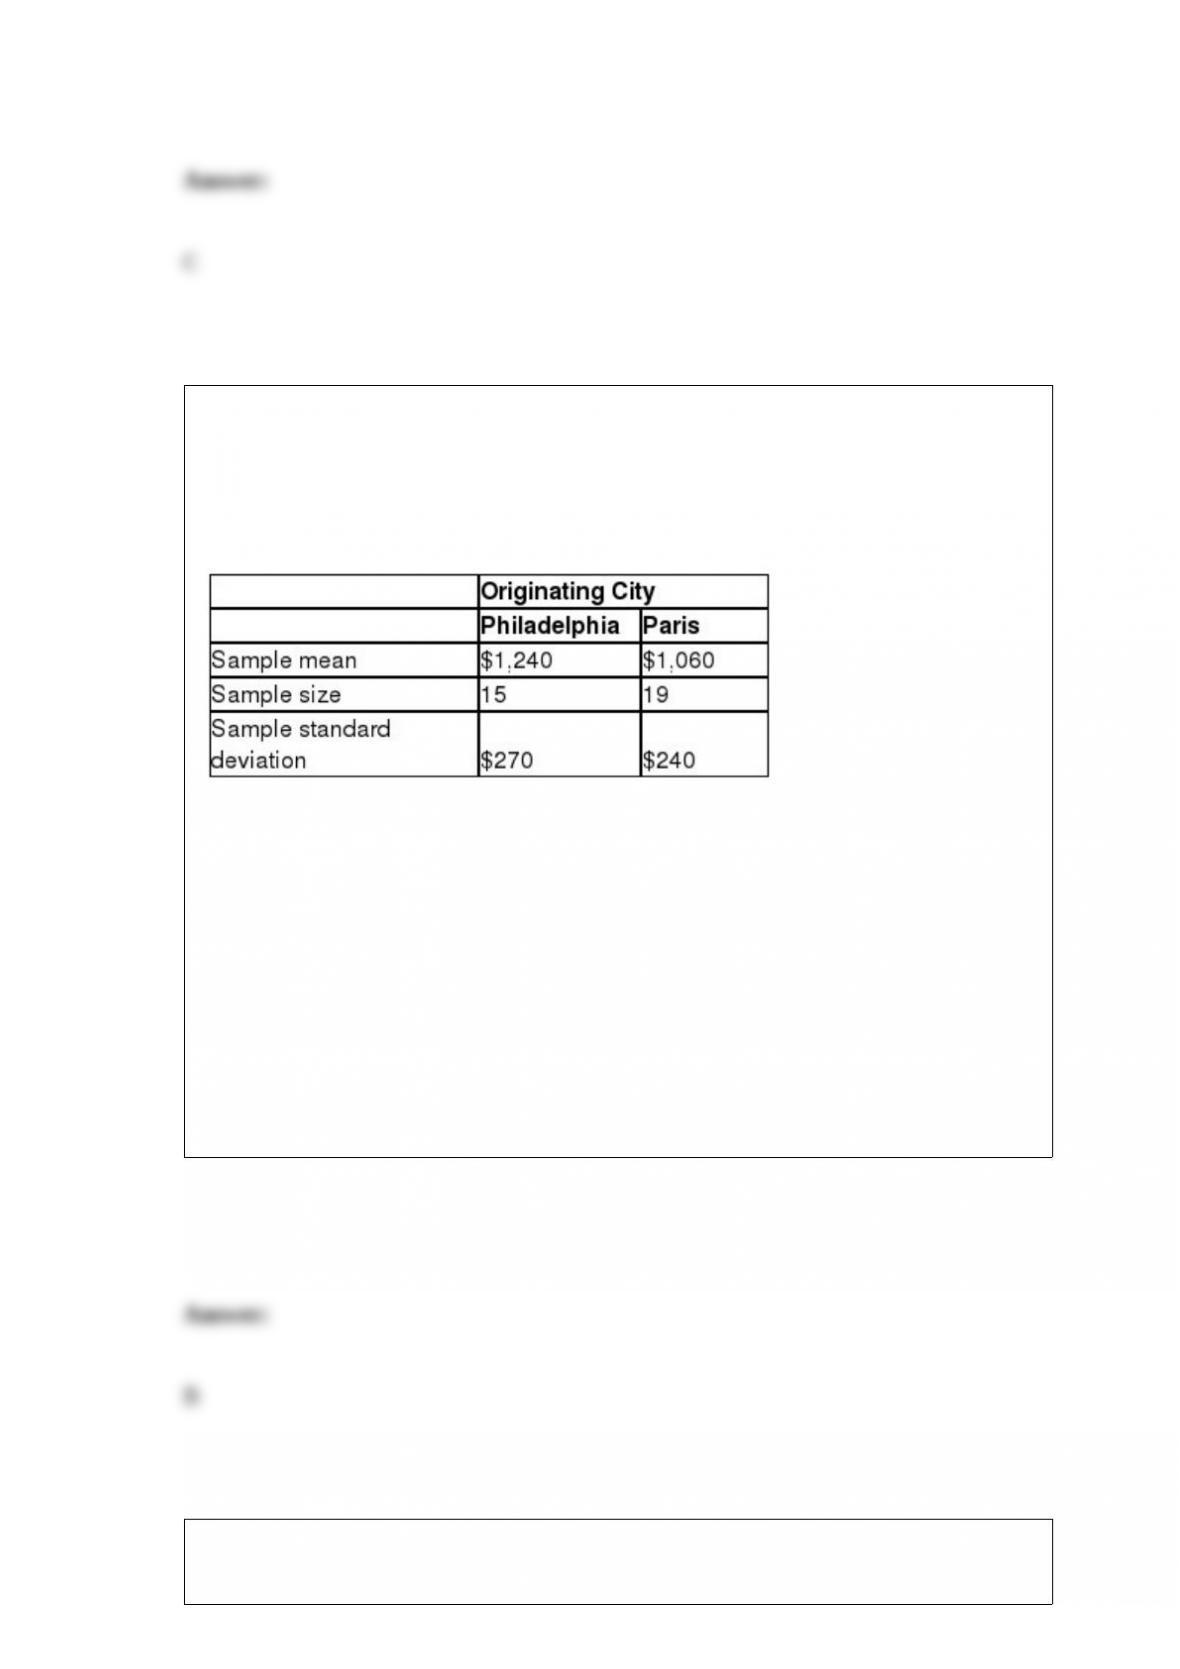
Expedia would like to test the hypothesis that the average roundtrip airfare between
Philadelphia and Paris is higher for a flight originating in Philadelphia when compared
to a flight originating in Paris. The following data summarizes the sample statistics for
roundtrip flights originating in both cities. Assume that the population variances are
equal.
If Population 1 is defined as flights originating in Philadelphia and Population 2 is
defined as flights originating in Paris, using α = 0.05, the critical value for this
hypothesis test would be ________.
A) 1.309
B) 1.694
C) 2.037
D) 2.449
Suppose Apple would like to test the hypothesis that the standard deviation for the web
browsing battery life of the iPad equals 3.0 hours. The following data represents the

battery life, in hours, experienced by a random sample of six users.
The sample standard deviation is ________.
A) 2.41
B) 2.66
C) 3.19
D) 3.50
Use the information below to answer the following question(s).
A snack food producer is considering introducing a new product to the consumer
market. It can choose to build a new facility for production of the new product, use an
existing facility, or outsource the production to another company. The company
estimates that the probability of strong demand for this product to be 65% and the
probability of weak demand is estimated at 35%. The company also has the option to
hire a marketing research firm to conduct a study to provide additional information
about the demand that has the following track record:
•Historically, this research firm has predicted a strong demand when the eventual
demand was strong 80% of the time.
•Historically, this research firm has predicted a weak demand when the eventual
demand was weak 85% of the time.
The probability that the market survey will predict a weak demand is ________.
A) 0.3325
B) 0.3660
C) 0.4082
D) 0.4275
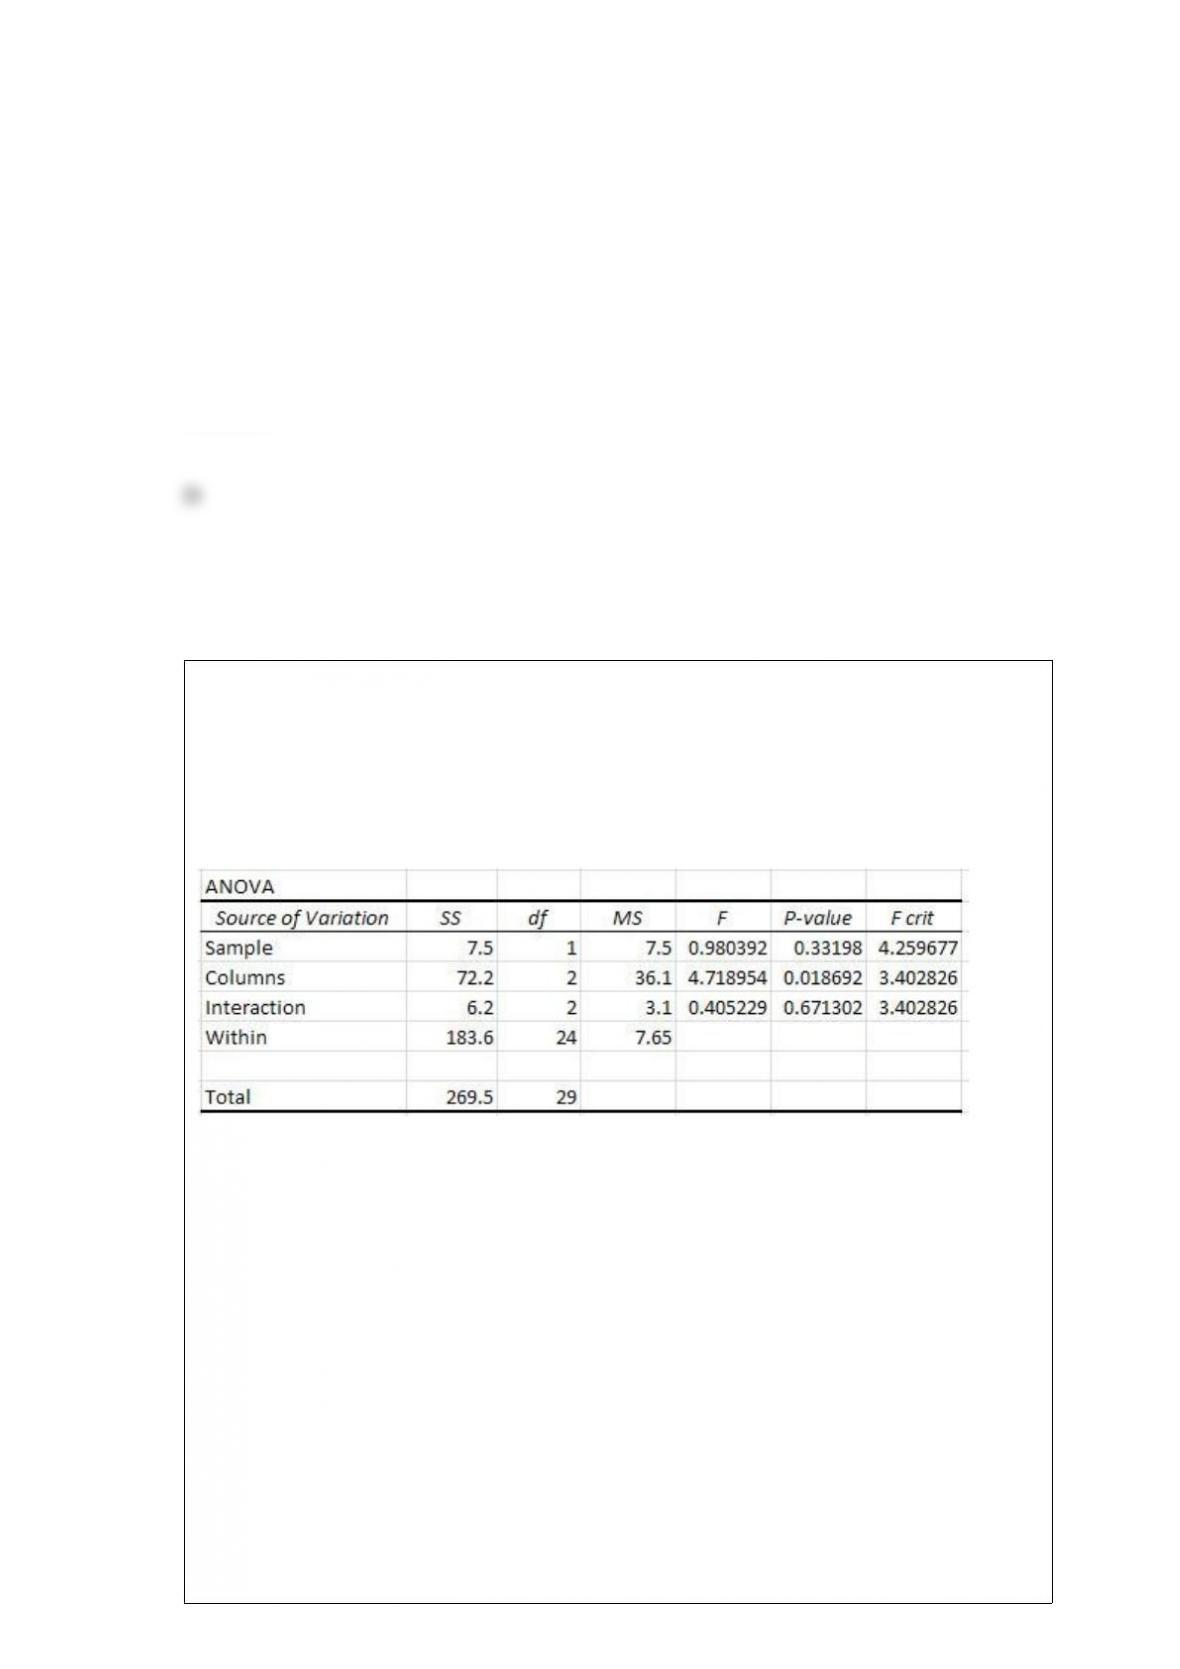
Sara is a regional manager for a restaurant chain that has locations in the towns of
Florence, Camden, and Columbia. A random sample of customers at all three locations
were asked to rate their satisfaction level on a scale of 1 to 20. A two-way ANOVA
procedure was performed on this data using α = 0.05 with Factor A representing each
location and Factor B representing the customer ‘s gender. The results are summarized
below in the ANOVA table.
A conclusion for this ANOVA procedure would be that because the Factor A test
statistic is
______________________________________________________________________
_____.
A) more than the critical value, we can reject the null hypothesis and conclude that
there is no difference in average means for the customer satisfaction scores between
these three locations
B) less than the critical value, we cannot reject the null hypothesis and conclude that
there is no difference in average means for the customer satisfaction scores between
these three locations
C) less than the critical value, we cannot reject the null hypothesis and conclude that
there is a difference in average means for the customer satisfaction scores between
these three locations
D) more than the critical value, we can reject the null hypothesis and conclude that
there is a difference in average means for the customer satisfaction scores between
these three locations
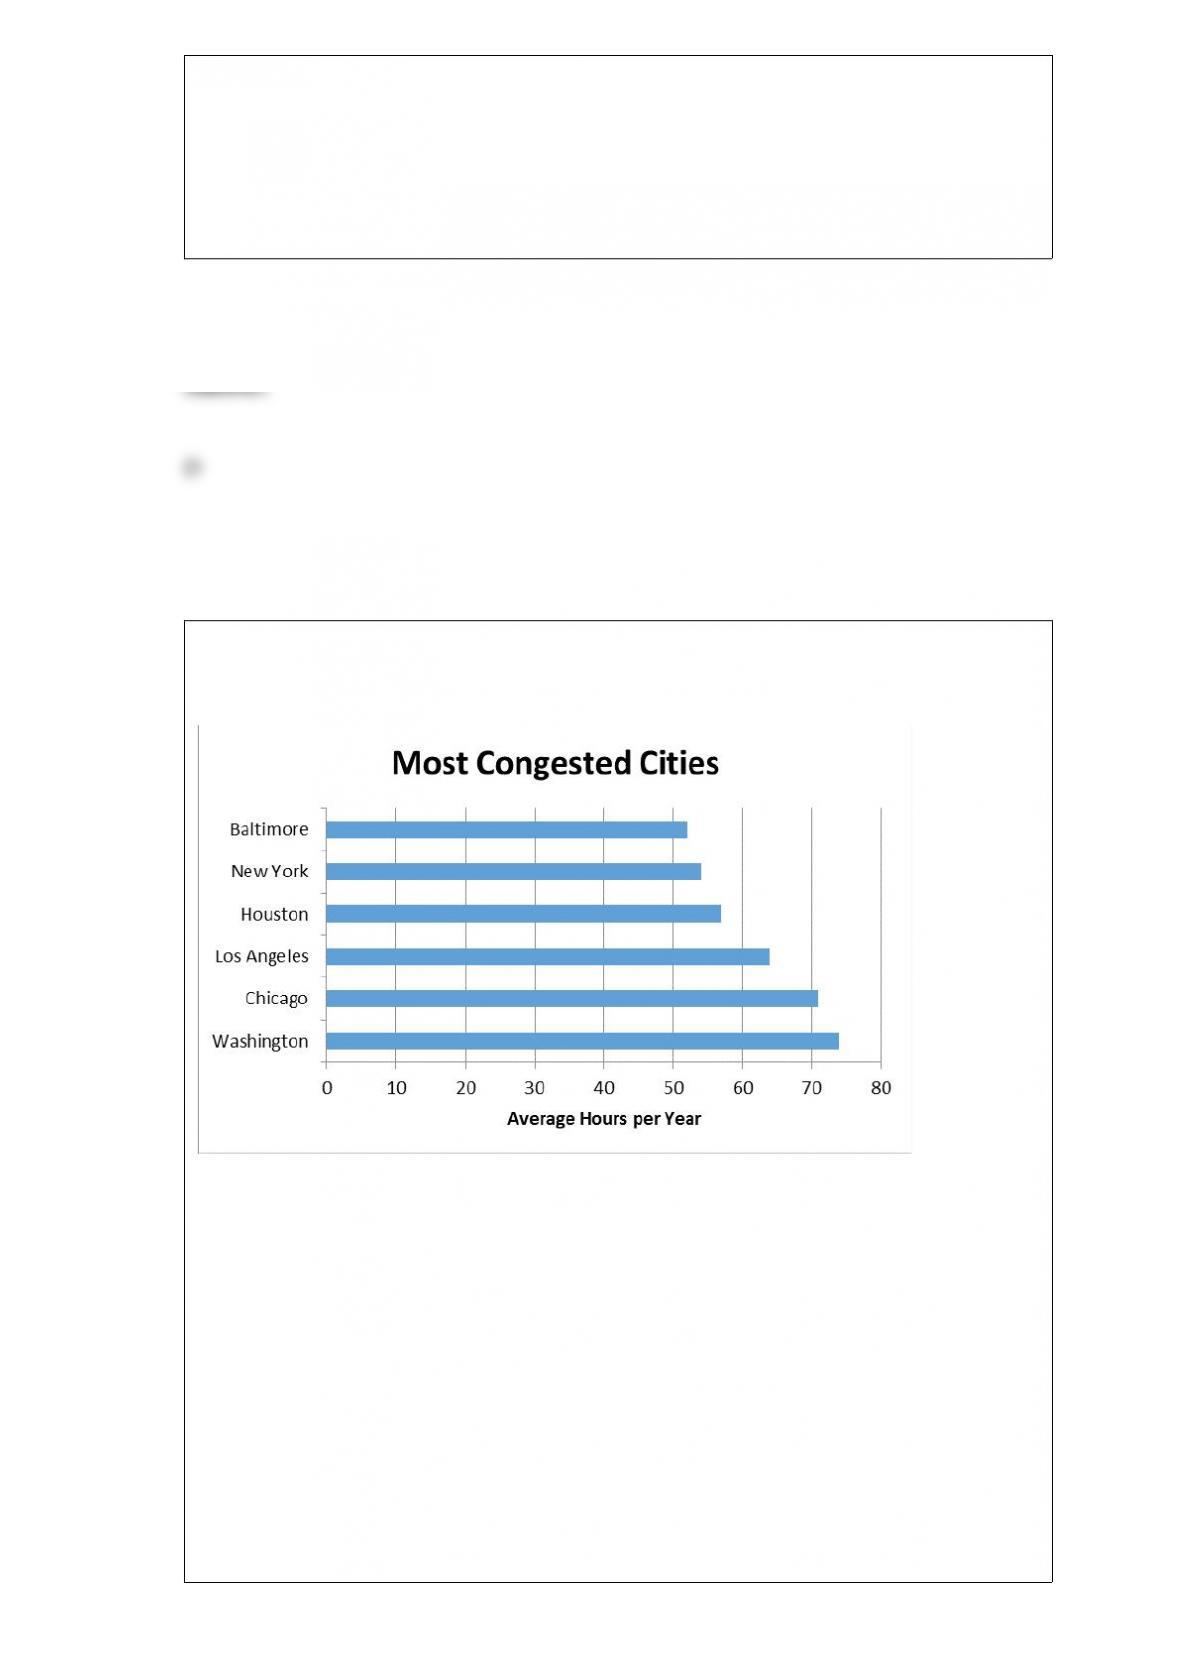
The following chart shows the average number of hours commuters spend in traffic
delays per year at the six most congested cities in the U.S.
Which of the following statements is not correct?
A) Chicago commuters have the highest average number of hours spent per year in
traffic delays.
B) Baltimore commuters have the lowest average number of hours spent per year in
traffic delays.
C) Houston commuters have a higher average number of hours spent per year in traffic
delays when compared to New York commuters.
D) Los Angeles commuters have a lower average number of hours spent per year in
traffic delays when compared to Washington commuters.

A ________ sample is a sample in which every member of the population has an equal
chance of being chosen.
A) systematic
B) simple random
C) probability
D) stratified
________ errors can occur as a result of a questionnaire that contains ambiguous
questions.
A) Nonsampling
B) Sampling
C) Nonprobability
D) Judgment
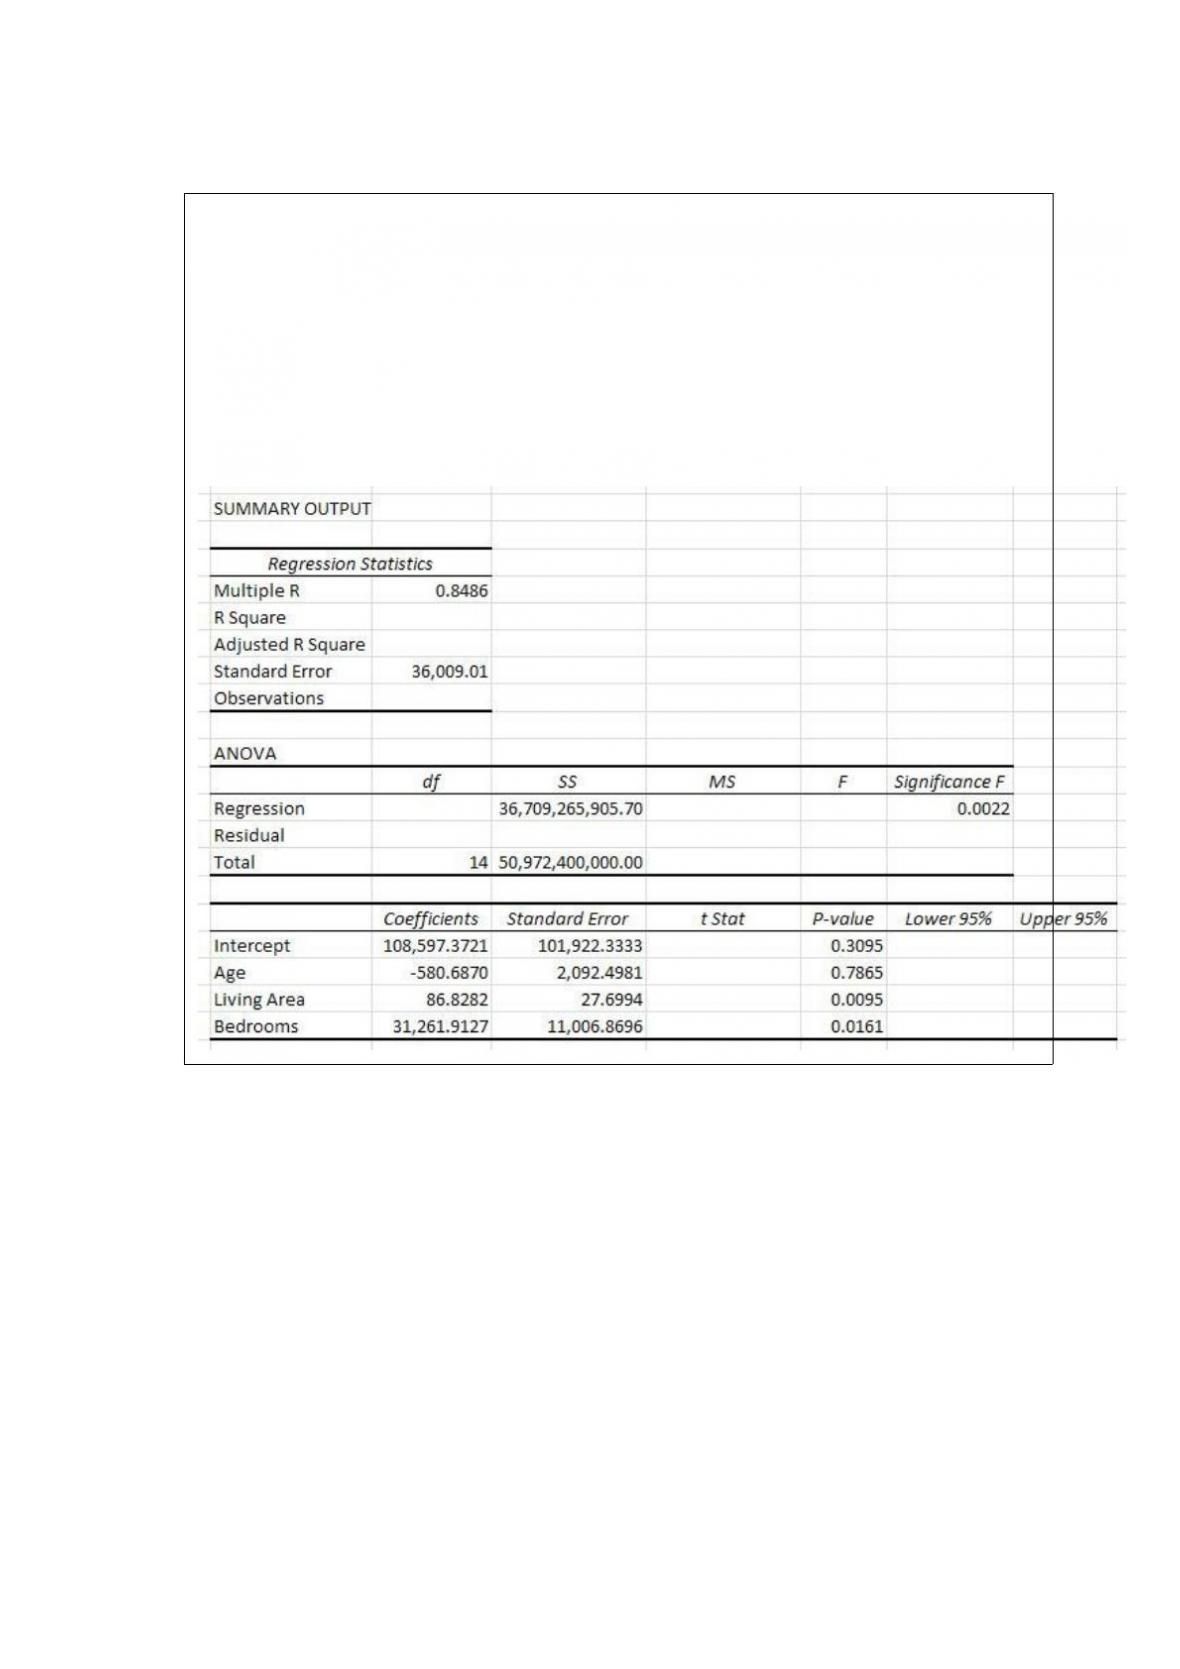
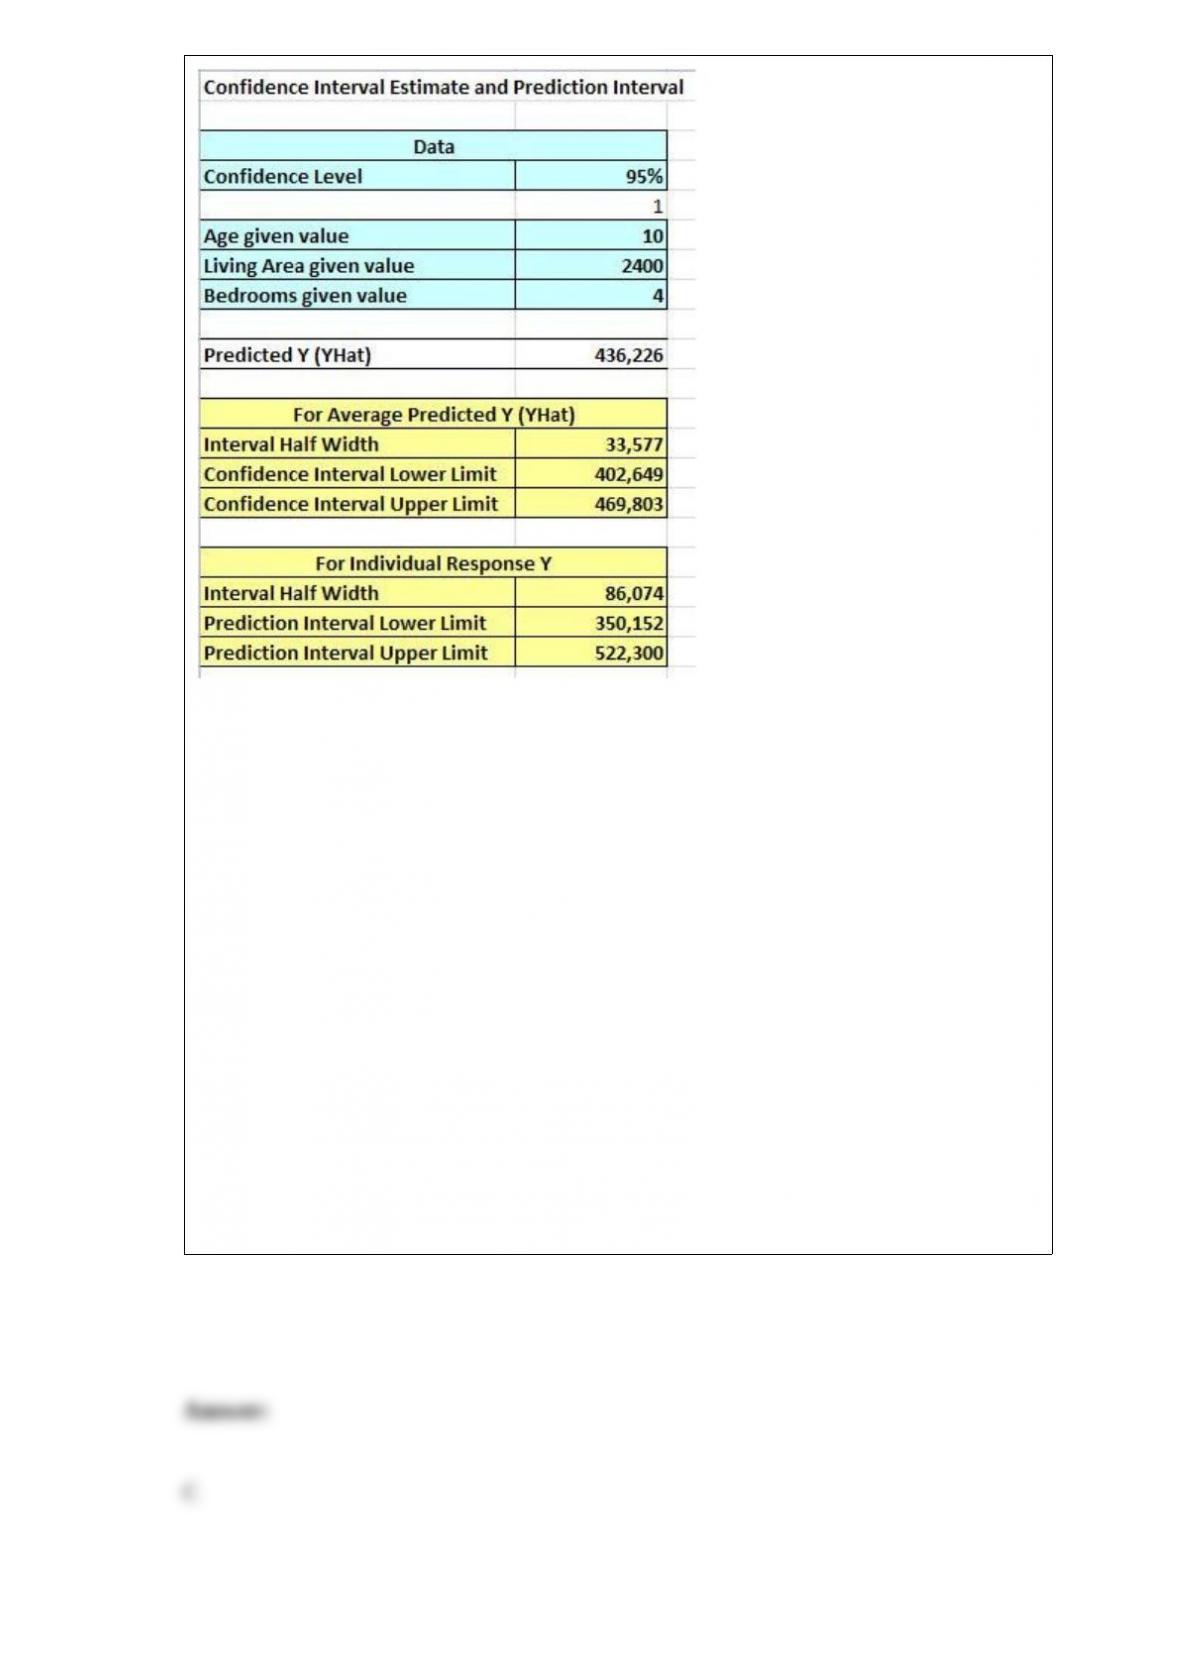
Use the following information to answer the question(s) below.
A home appraisal company would like to develop a regression model that would predict
the selling price of a house based on the age of the house in years (Age), the living area
of the house in square feet (Living Area) and the number of bedrooms (Bedrooms). The
following Excel output shows the partially completed regression output from a random
sample of homes that have recently sold.
Which one of the following statements is true concerning the 95% confidence interval
for the regression coefficient for the Bedrooms variable?
A) Because the confidence interval includes zero, we have evidence to conclude that
there is a relationship between the number of bedrooms in a house and the selling price
of the house.
B) Because the confidence interval includes zero, we have evidence to conclude that
there is no relationship between the number of bedrooms in a house and the selling
price of the house.
C) Because the confidence interval does not include zero, we have evidence to conclude
that there is a relationship between number of bedrooms in a house and the selling price
of the house.
D) Because the confidence interval does not include zero, we have evidence to
conclude that there is no relationship between the number of bedrooms in a house and
the selling price of the house.

A local grocery store receives strawberries from suppliers in Florida and California.
Currently there are 18 strawberry containers on the shelf and 11 of them are from
Florida. A shopper selects three containers to purchase. What is the probability that one
of the containers is from the Florida supplier?
According to the Bureau of Labor Statistics, 7.1% of the labor force was recently
unemployed. A random sample of 100 employable adults was selected. Using the
normal approximation to the binomial distribution, what is the probability that 6 or
more people from this sample are unemployed?
A) 0.3219
B) 0.4030
C) 0.5561
D) 0.7324
In Delaware, cars are inspected each year using state-operated inspection centers. The
Wilmington center has three drive-through lanes where cars are inspected in a sequence
of steps. The following data show the number of minutes that a random sample of
drivers spent waiting and having their cars inspected in the three lanes each day of the
week.
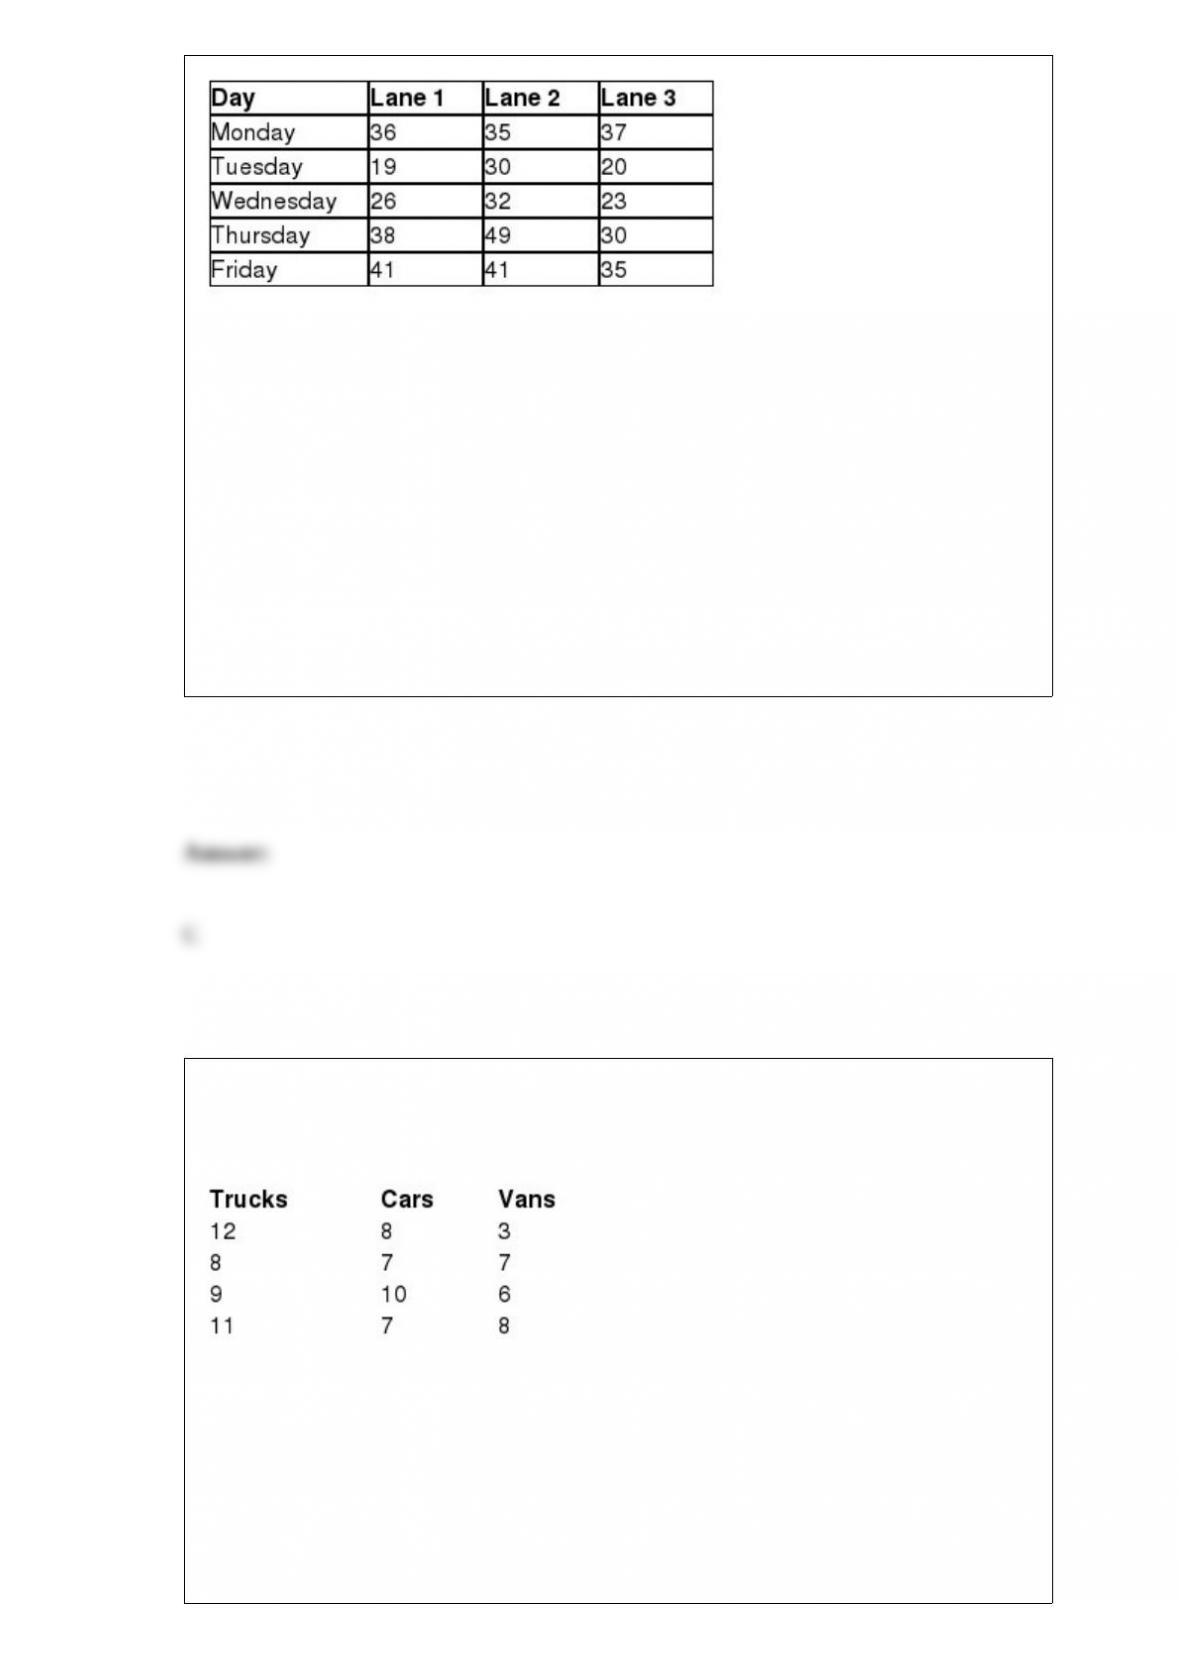
The state of Delaware would like to perform a randomized block ANOVA to test for a
difference in the average times the drivers spend in the three lanes using the weekday as
a blocking factor. The conclusion for the Tukey-Kramer multiple comparisons test using
α = 0.05 is that ________.
A) Lane 1 and Lane 2 are the only pair of average times that are different
B) Lane 1 and Lane 3 are the only pair of average times that are different
C) Lane 2 and Lane 3 are the only pair of average times that are different
D) There are no pair of average times that are different
AutoTrader.com would like to test if a difference exists in the age of three different
types of vehicles currently on the road–trucks, cars, and vans. The following data
represent the age of a random sample of trucks, cars, and vans.
Using α = 0.05, the critical value for this hypothesis test would be ________.
A) 3.885
B) 4.256
C) 5.718

D) 6.040
The sum of squares between (SSB) measures the variation between each sample mean
and the grand mean of the data.
Which of the following statements is not true concerning assumptions that ANOVA
procedures rely on?
A) Each of the populations being compared follows the normal probability distribution.
B) The observations must be independent of one another.
C) The populations being compared have equal variances.
D) The observations are either nominal or ratio data.
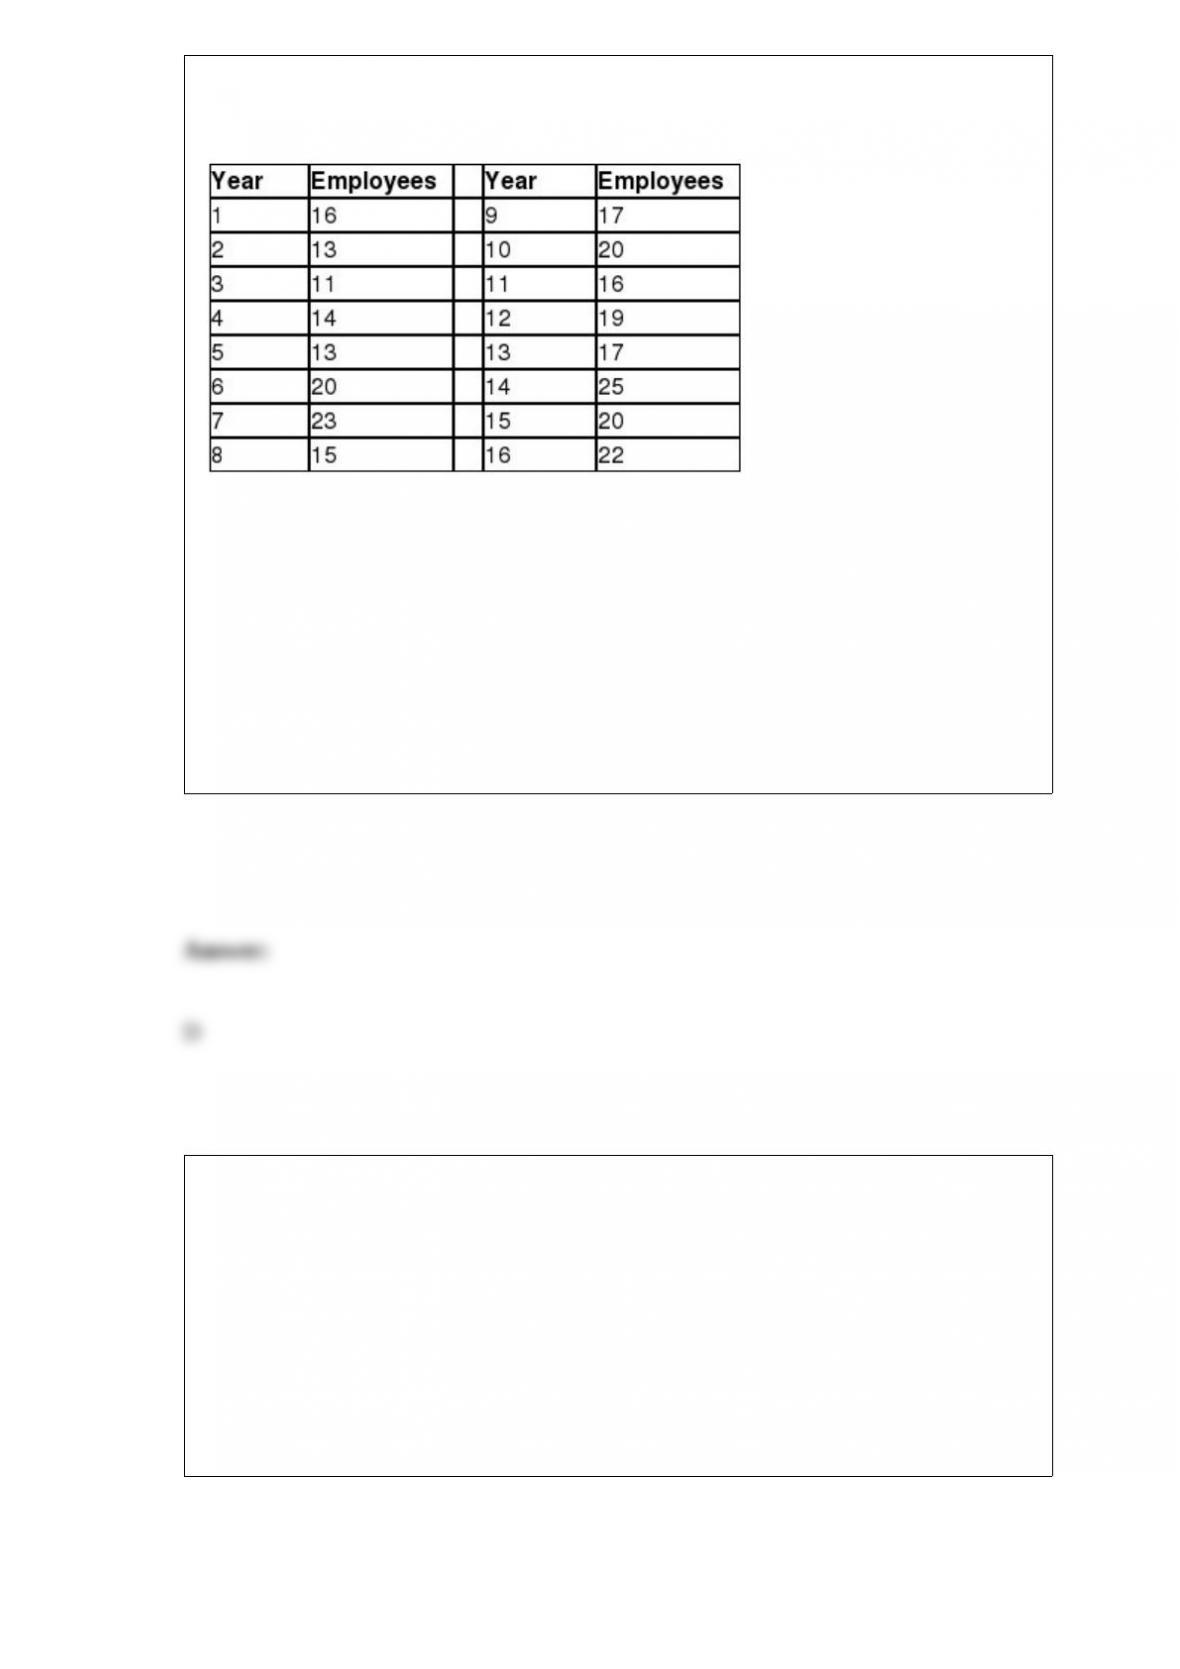
The following table shows the number of employees at Diamond Corporation over the
past 16 years.
The residual for Year 7 is ________.
A) -1.7
B) -3.2
C) 4.8
D) 6.3
Use a ________ chart if you want to compare the relative sizes of the classes in a
frequency distribution and together they comprise all possible categories.
A) horizontal bar
B) vertical bar
C) Pareto
D) pie

Gathering information from potential customers in an effort to determine their
preferences is an example of using statistics in the field of ________.
A) marketing research
B) advertising
C) operations
D) finance
According to the Insurance Research Council, 14% of U.S. drivers are uninsured. A
random sample of seven drivers was selected. What is the probability that three or more
of these drivers are uninsured?
A) 0.0620
B) 0.0956
C) 0.1233
D) 0.1518

The test statistic for testing the significance for the overall regression model follows
the _______________________.
A) normal distribution
B) Student’s t-distribution
C) F-distribution
D) chi-square distribution
A(n) ________ in ANOVA describes the cause of the variation in the data.
A) error rate
B) level
C) block
D) factor
Consider the following data set:
Variable 1: 2 7 5 10 8 10 14
Variable 2: 7 12 10 18 11 21 14
The sample correlation coefficient for this data set is ______.
A) “0.66
B) “0.21
C) 0.50
D) 0.70
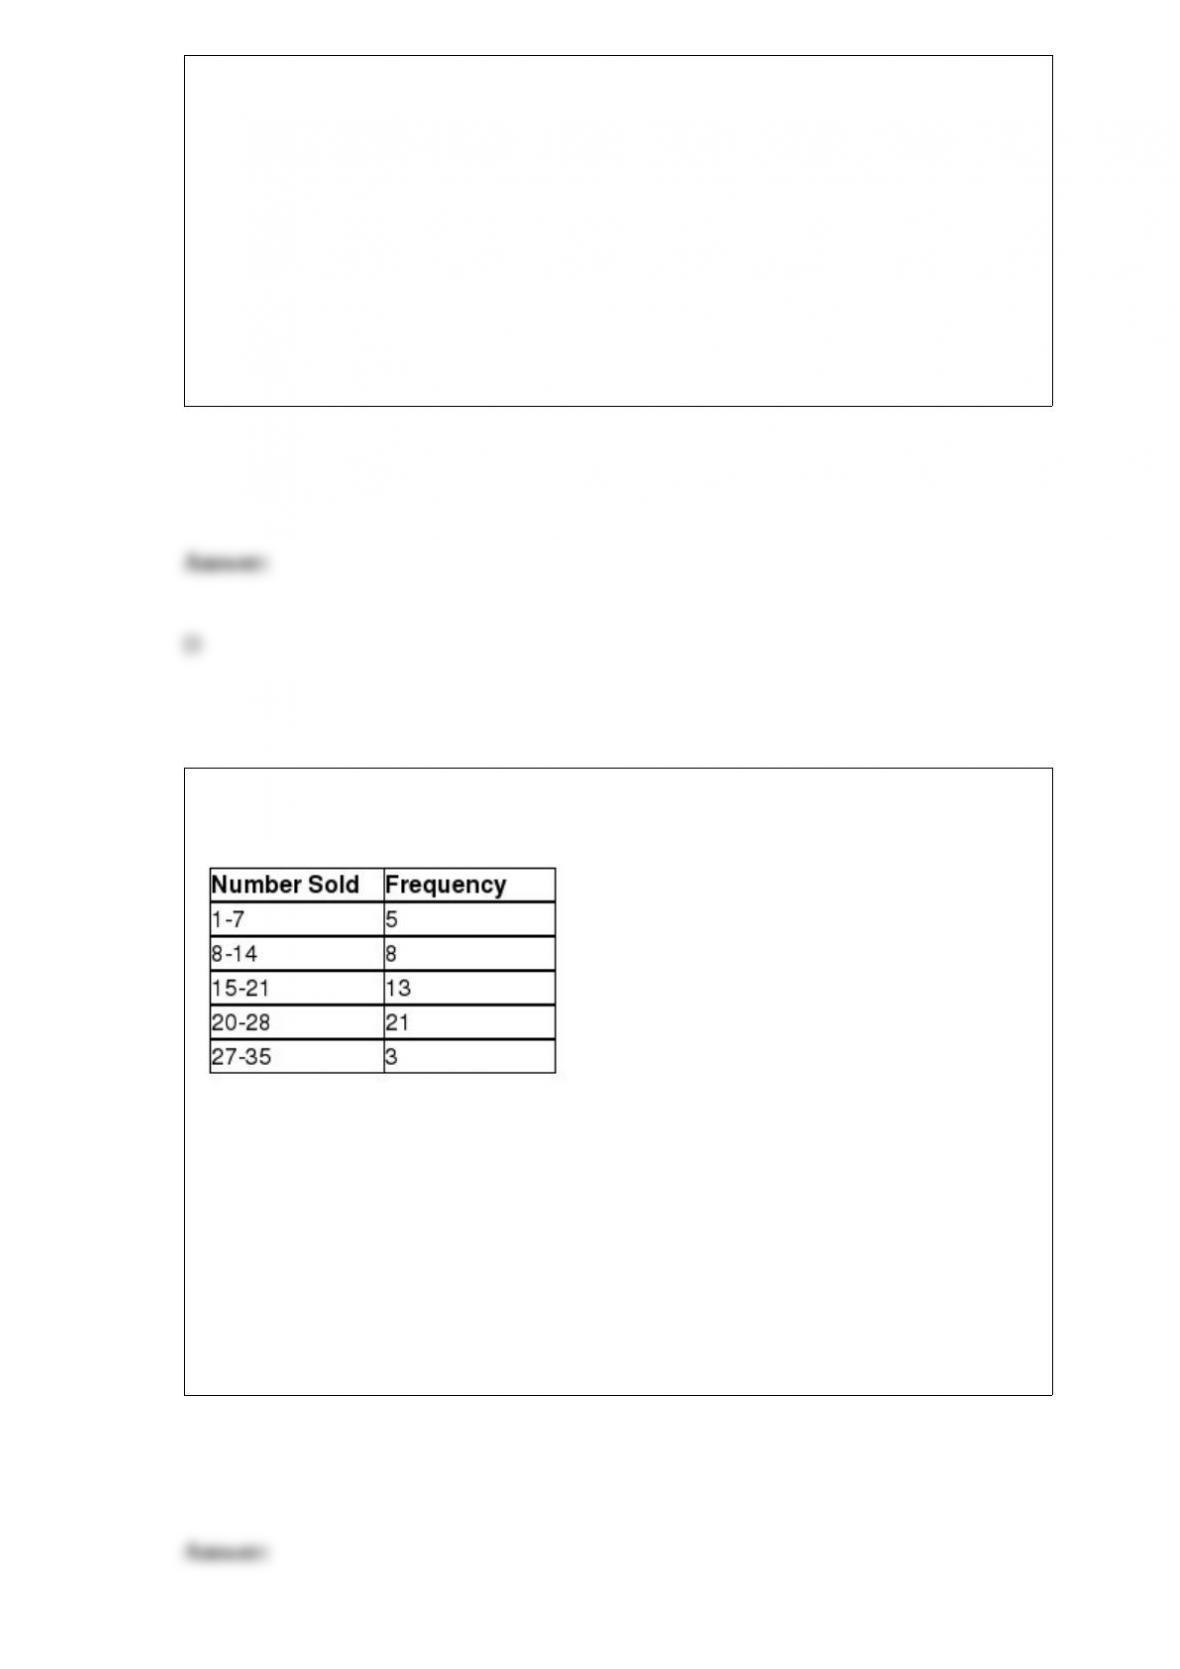
The following frequency distribution displays the daily sales of muffins at Avalon
Bakery.
What is the probability that between 20 and 35 muffins will be sold tomorrow?
A) 0.14
B) 0.48
C) 0.58
D) 0.66
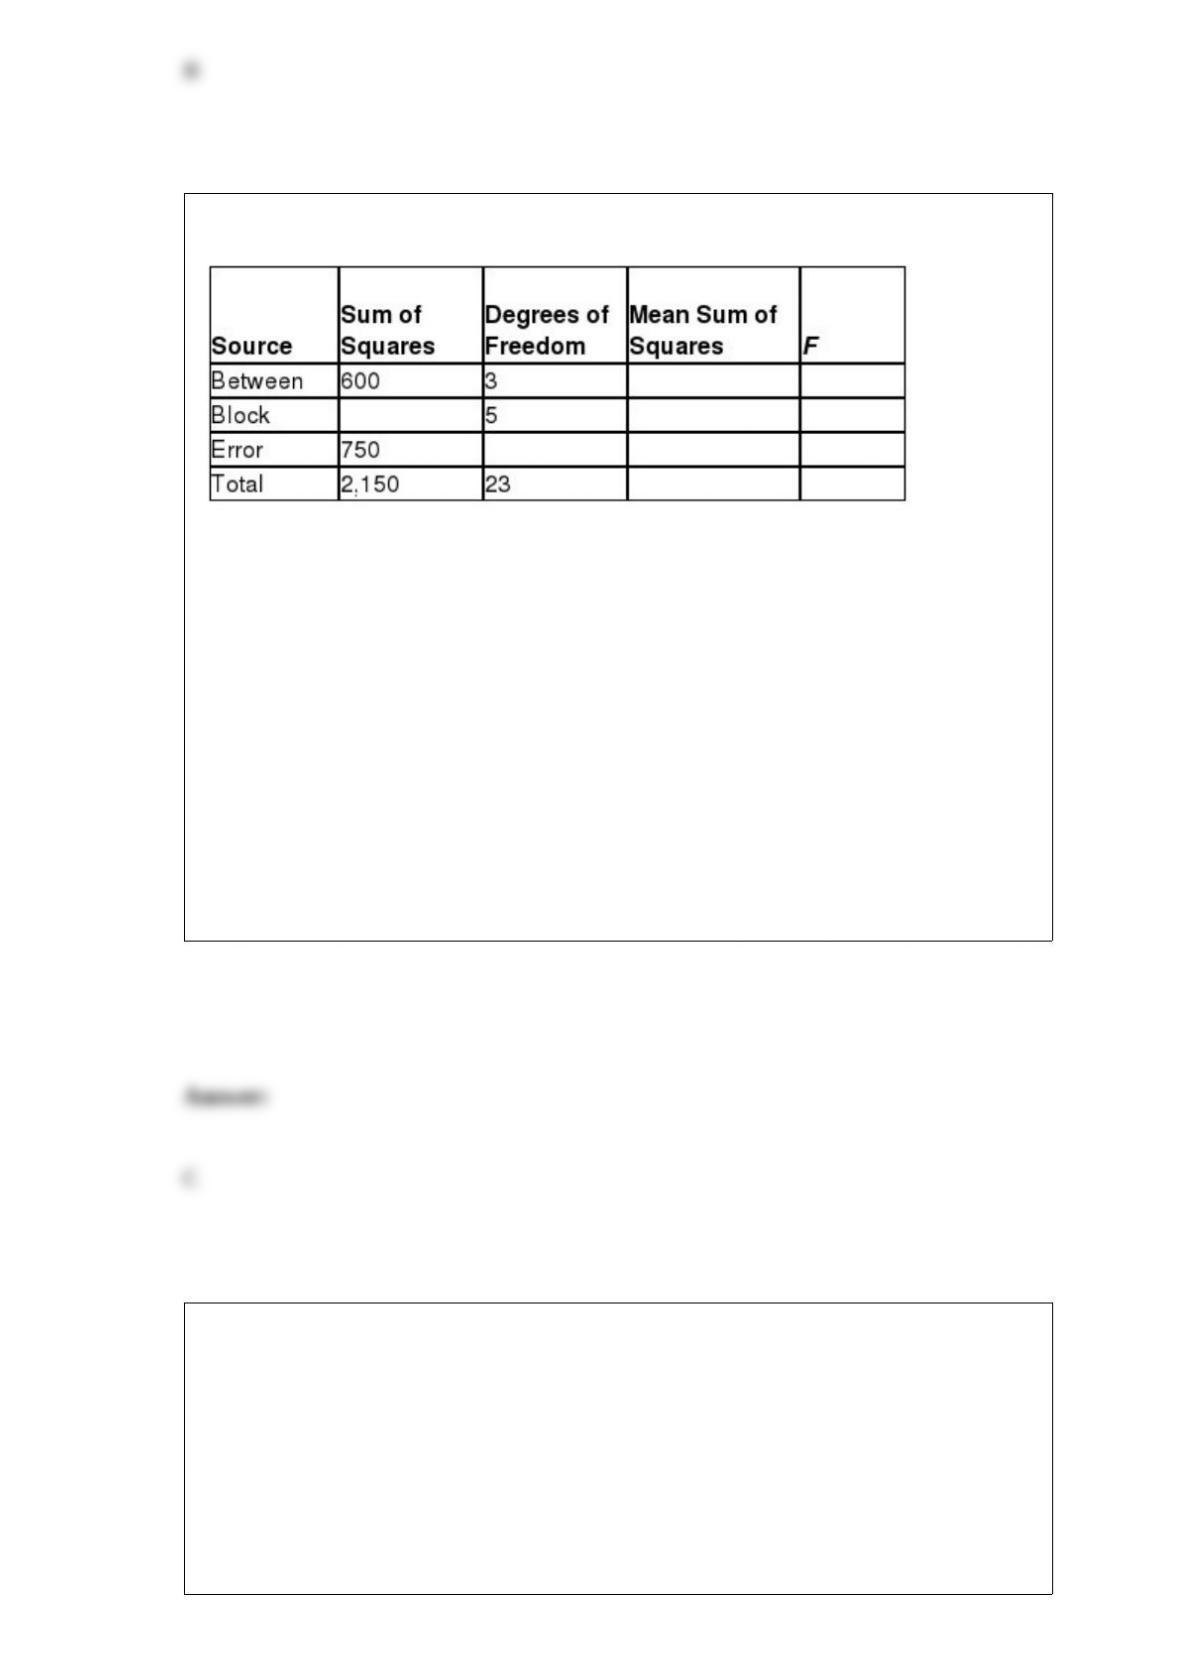
Consider the partially completed randomized block ANOVA summary table.
Using α = 0.05, which one of the following statements is true?
A) Because the blocking factor test statistic is less than the critical value, we can
conclude that the blocking factor was effective.
B) Because the blocking factor test statistic is less than the critical value, we can
conclude that the blocking factor was not effective.
C) Because the blocking factor test statistic is more than the critical value, we can
conclude that the blocking factor was effective.
D) Because the blocking factor test statistic is more than the critical value, we can
conclude that the blocking factor was not effective.
Breyers is a major producer of ice cream and would like to test the hypothesis that the
average American consumes more than 17 ounces if ice cream per month. A random
sample of 15 Americans was found to consume an average of 18.2 ounces of ice cream
last month. The standard deviation for this sample was 3.9 ounces. Breyers would like
to set α = 0.10. The critical value for this hypothesis test would be ________.
A) 1.782
B) 1.345
C) 2.145
D) 2.624
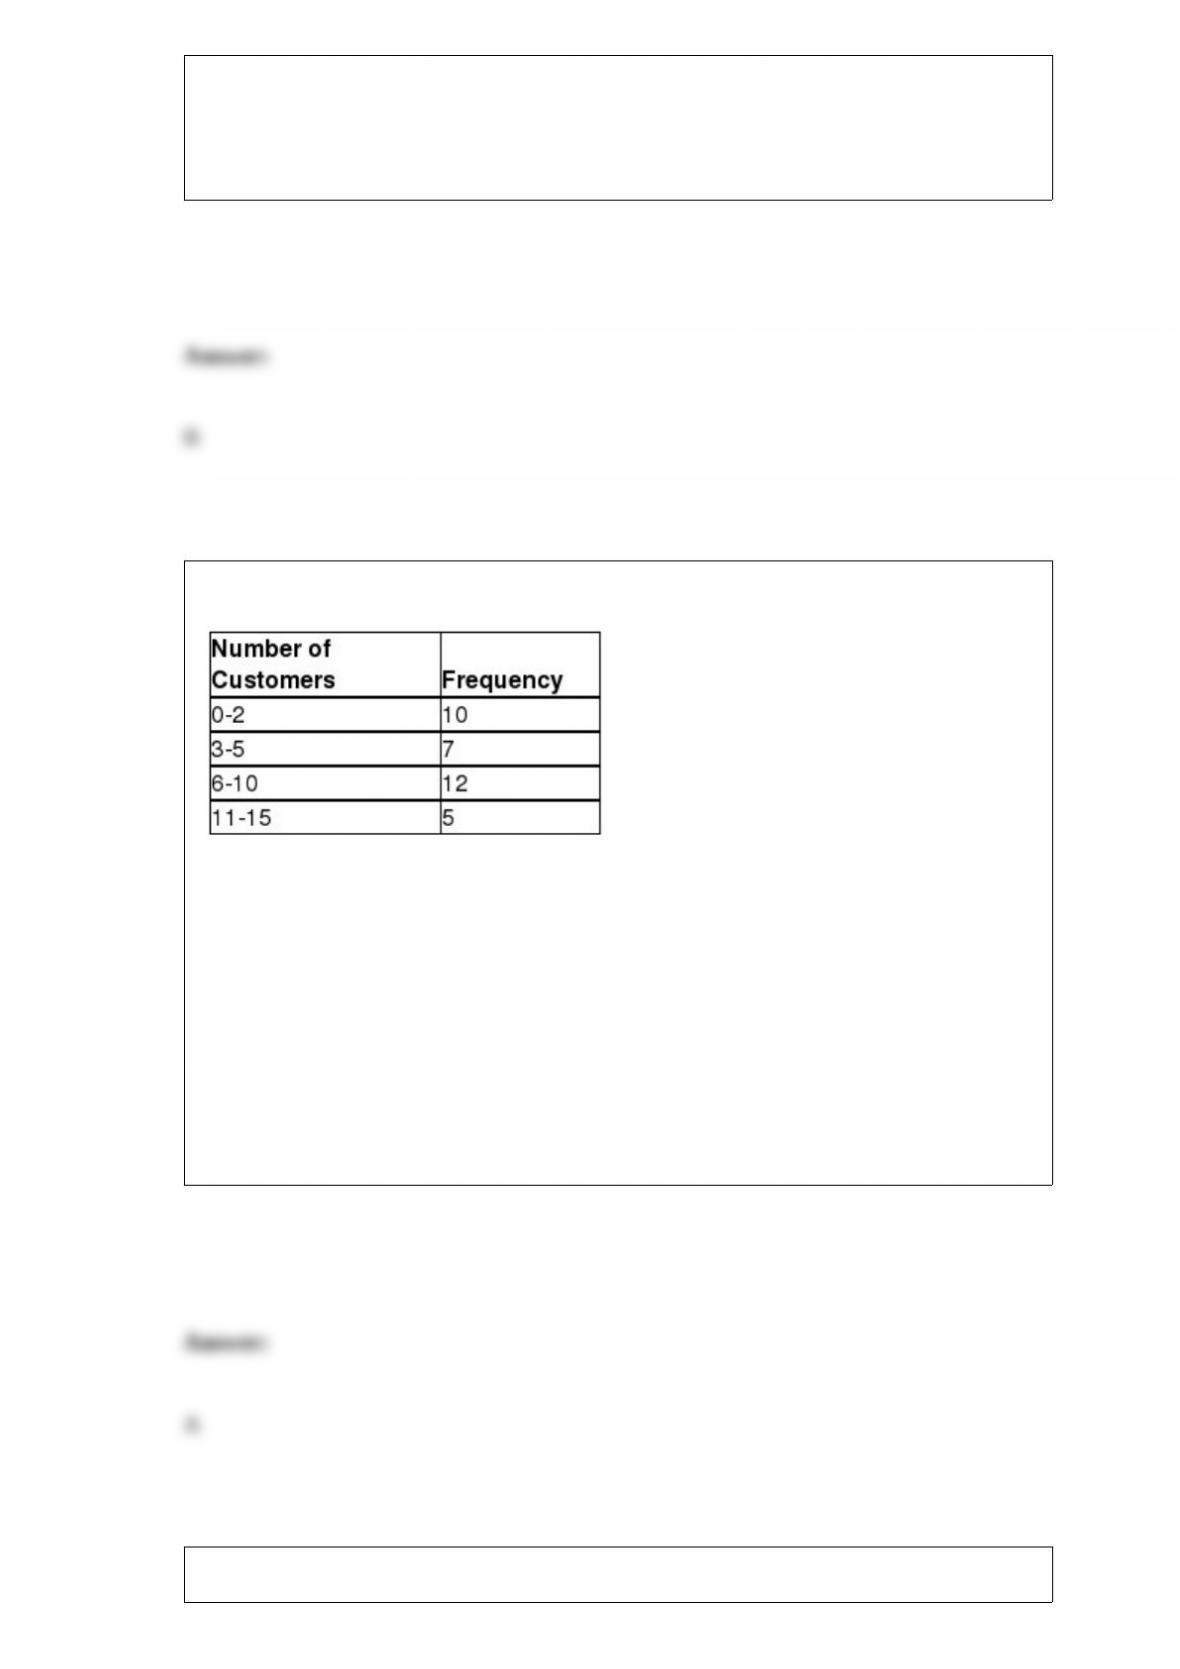
Consider the following frequency distribution.
Which rule for constructing a frequency distribution using grouped quantitative data has
been violated?
A) Use equal-size classes.
B) Use mutually exclusive classes.
C) Avoid empty classes.
D) No rule has been violated.
The following table shows the market share for flat-panel television sales in the second
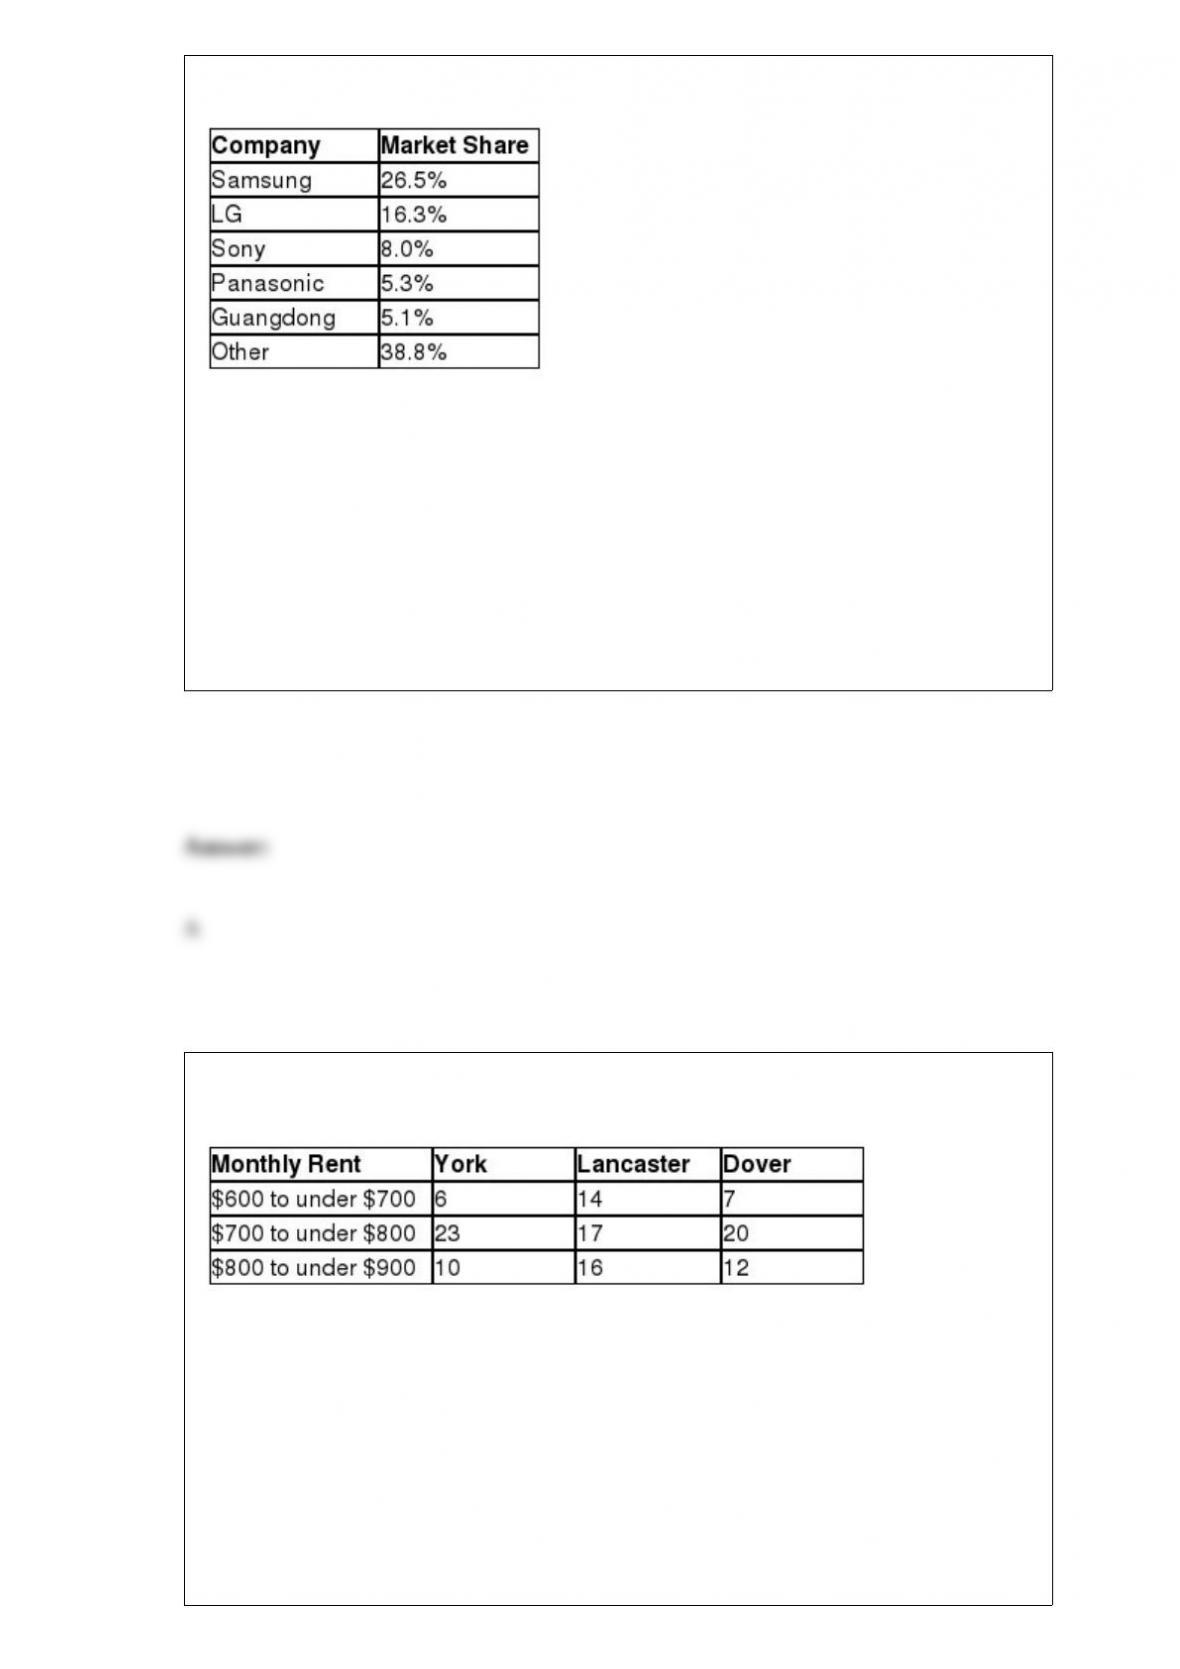
quarter of 2013.
Which of the following data types best describe these values?
A) cross-sectional
B) nominal
C) time series
D) ordinal
The following contingency table shows the number of two-bedroom apartments
grouped by monthly rent and location.
Given that a randomly selected apartment from this sample has a monthly rental of
$600 to under $700, the probability that the apartment was located in York is ________.
A) 0.120
B) 0.222
C) 0.480

D) 0.651
When calculating a confidence interval for the mean using a sample size of less than 30
with an unknown population standard deviation, the ________ is used.
A) normal distribution
B) Poisson distribution
C) binomial distribution
D) Student’s t-distribution
The following graph shows the average price of LCD TVs from 2005 until 2012.
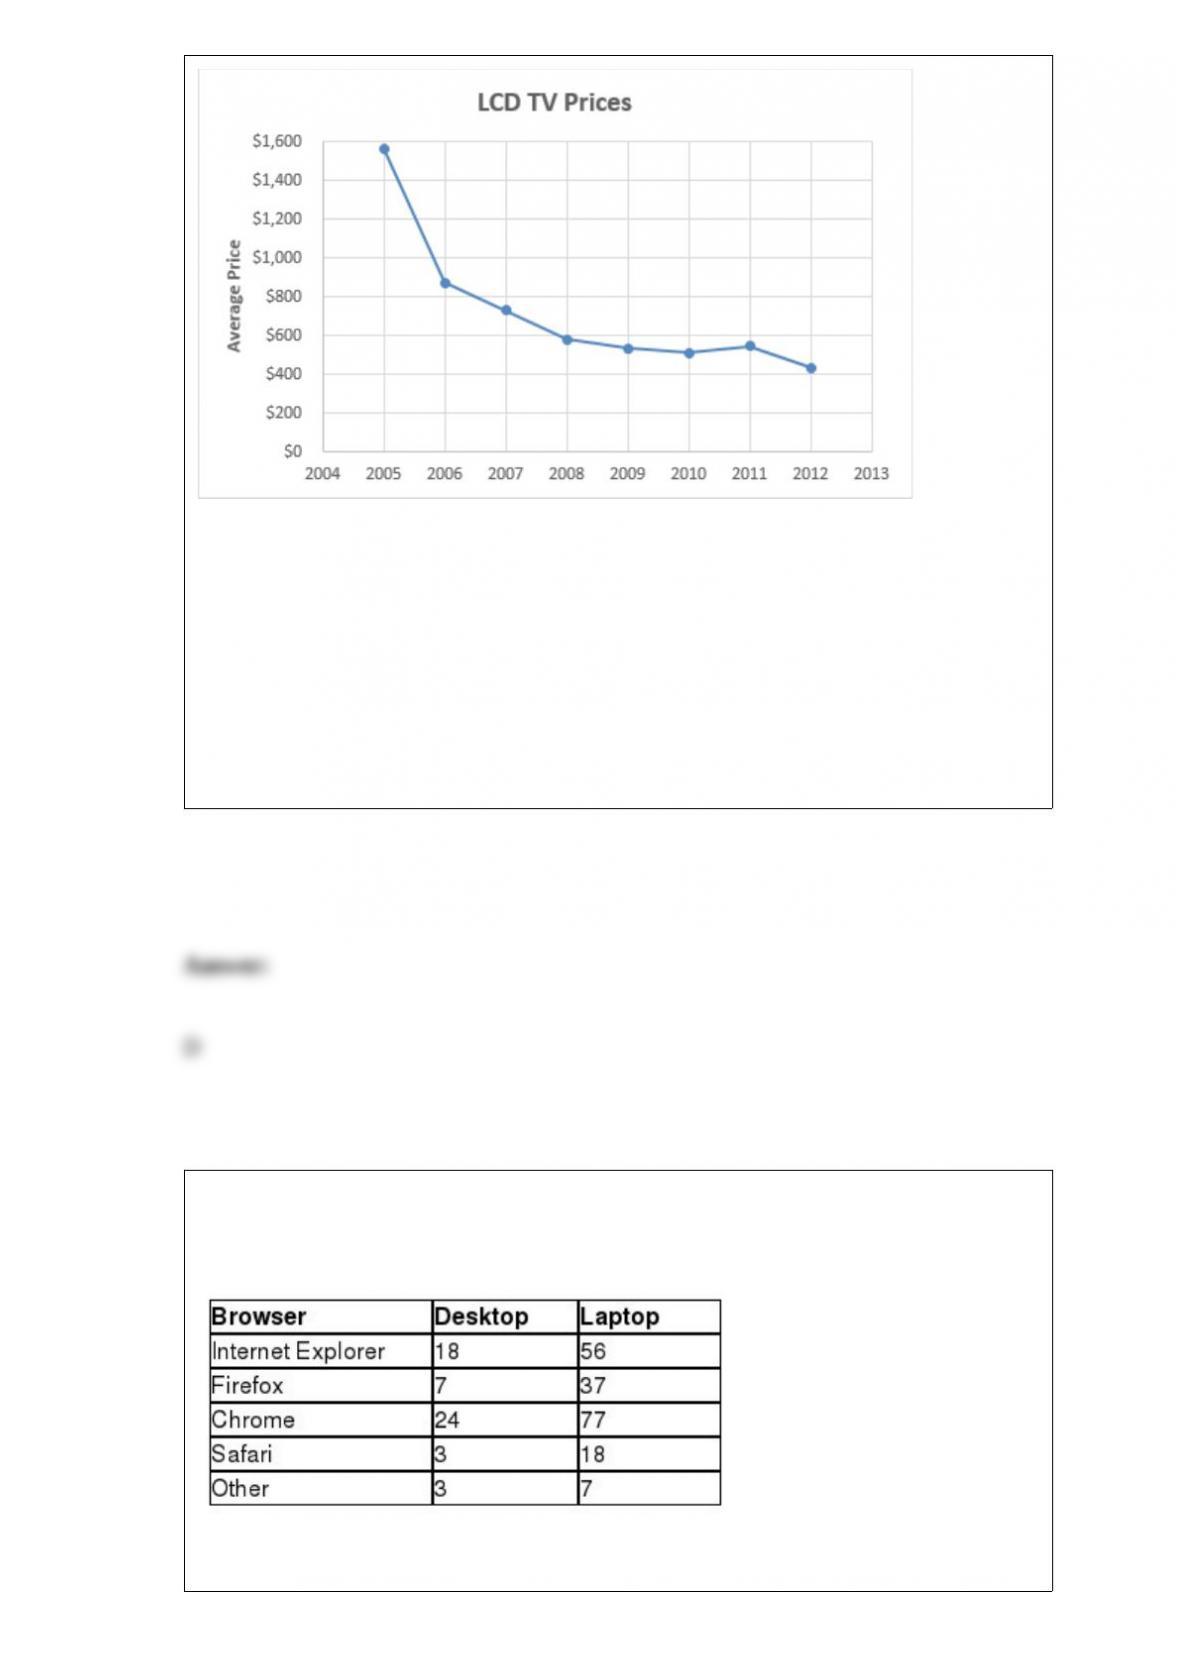
Which one of the following statements is correct?
A) Year is the dependent variable in the graph.
B) Average Price is the independent variable in the graph.
C) Historically, the average price of LCD TVs tends to increase.
D) Historically, the average price of LCD TVs tends to decrease.
A random sample of computer users were asked which browser they primarily relied on
for surfing the Internet and whether this browser was installed on a desktop or laptop
computer. The following contingency table shows these results.
Given that the randomly selected computer was a desktop, the probability that the
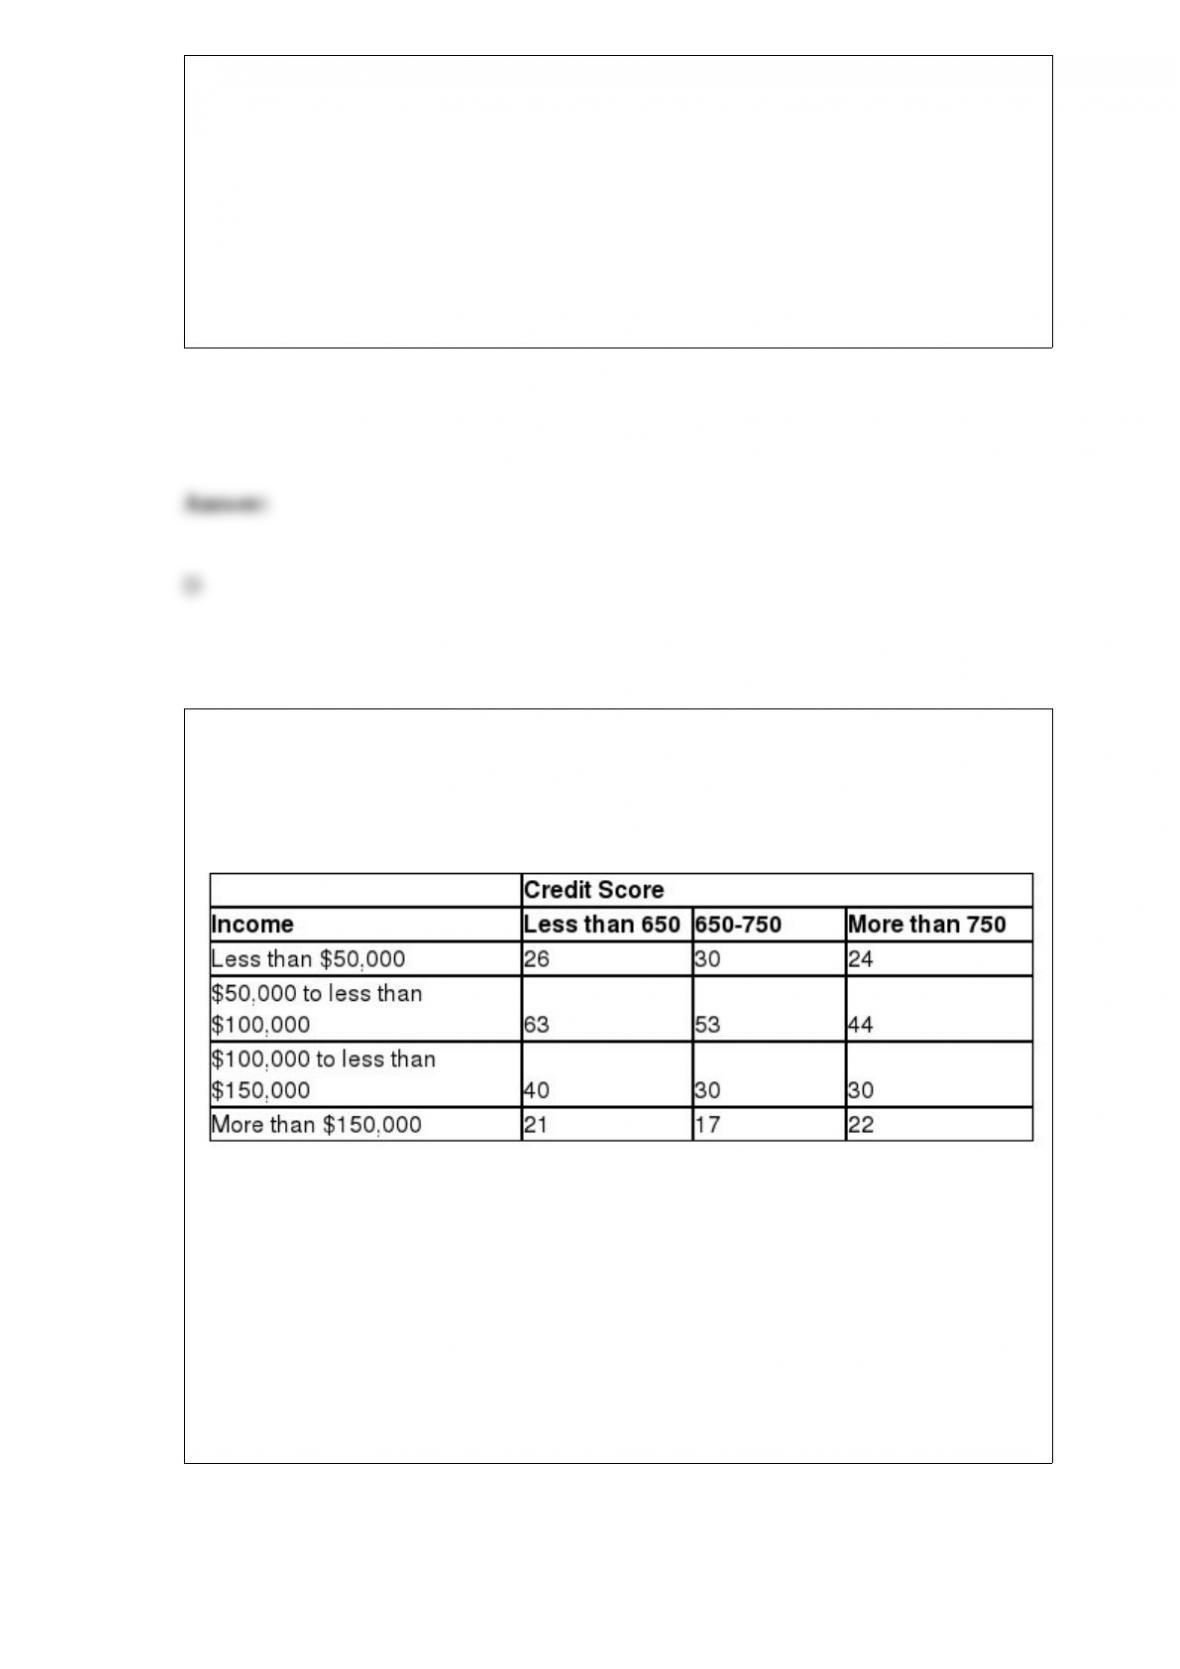
computer used the Internet Explorer browser is ________.
A) 0.037
B) 0.082
C) 0.112
D) 0.327
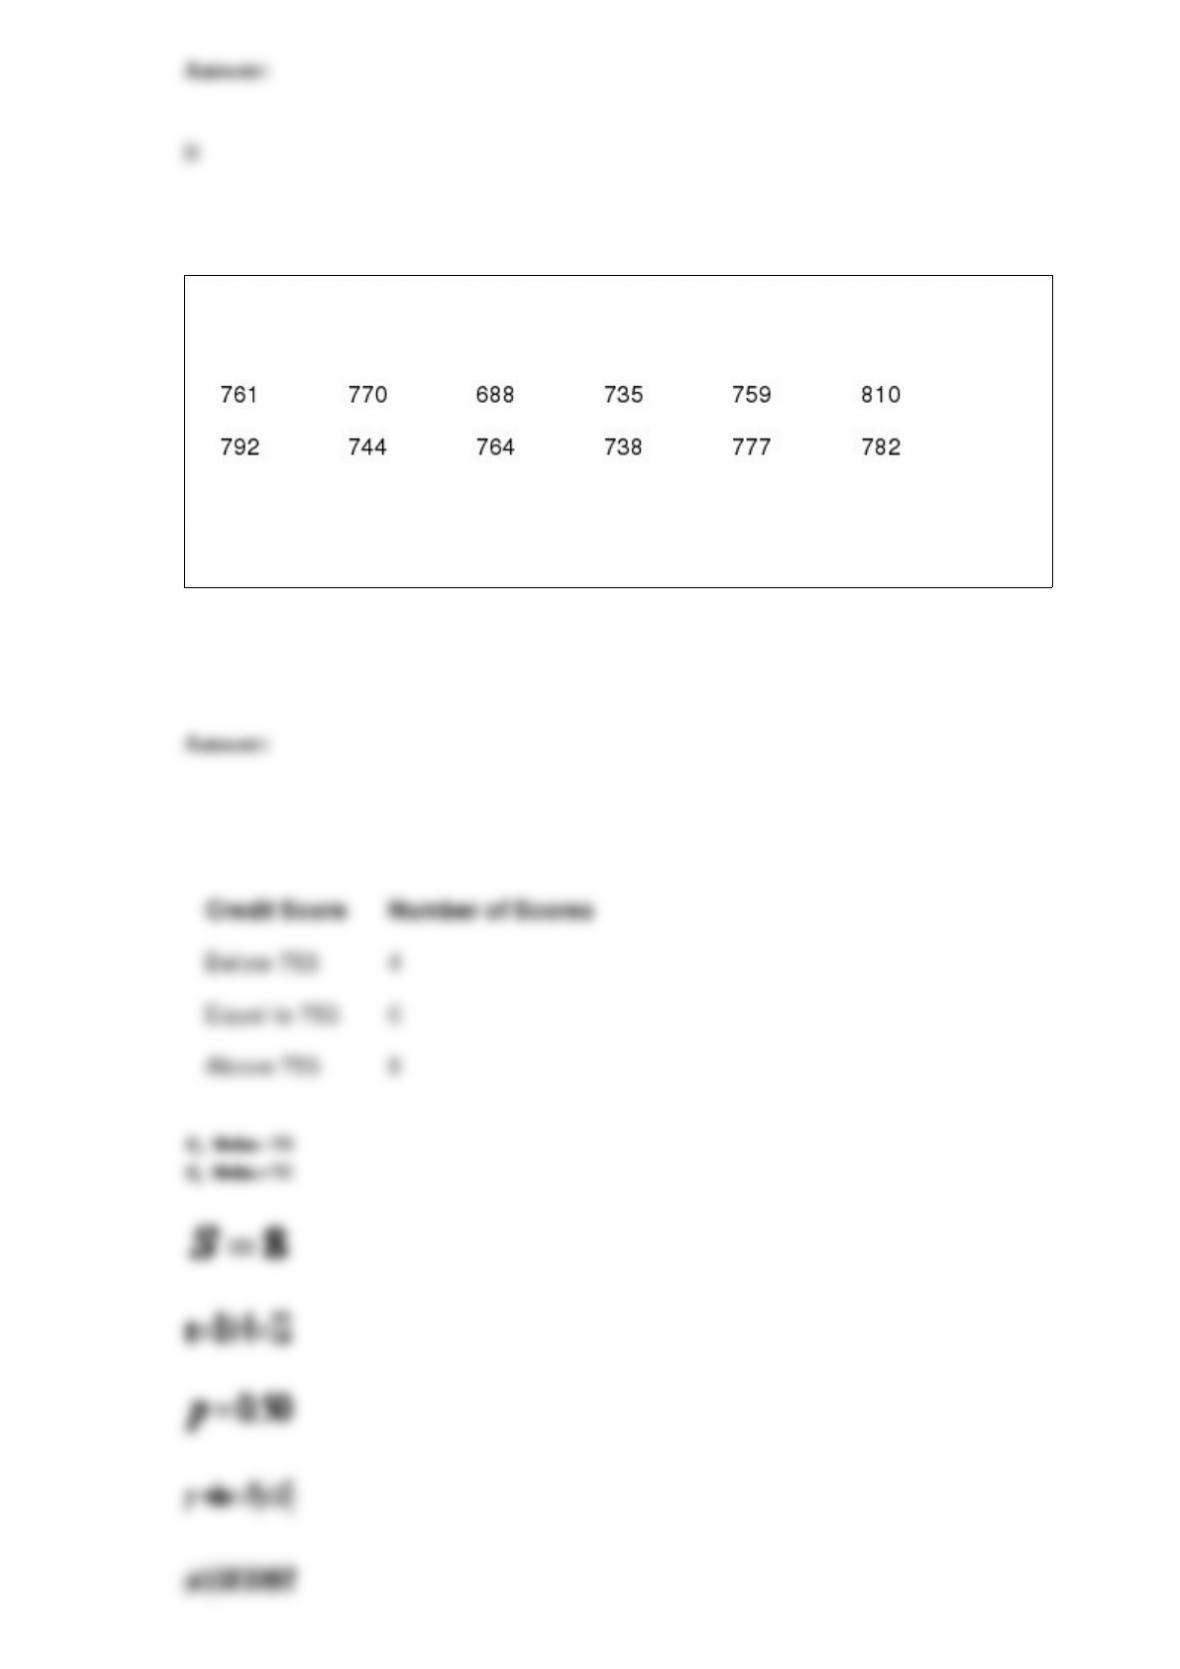
Suppose Bank of America (B of A) would like to investigate if credit score and income
level of an individual are independent of one another. B of A selected a random sample
of 400 adults and asked them to report their credit score range and their income range.
The following contingency table presents these results.
The test statistic for this sample is ________.
A) 1.766
B) 3.320
C) 7.051
D) 10.576
Recently, Experian reported that the median credit score for a new-car loan was 753.
The following table shows credit scores for randomly selected new-car loans.
Test the hypothesis that the median credit score for new-car loans equals 753 using α =
0.05.
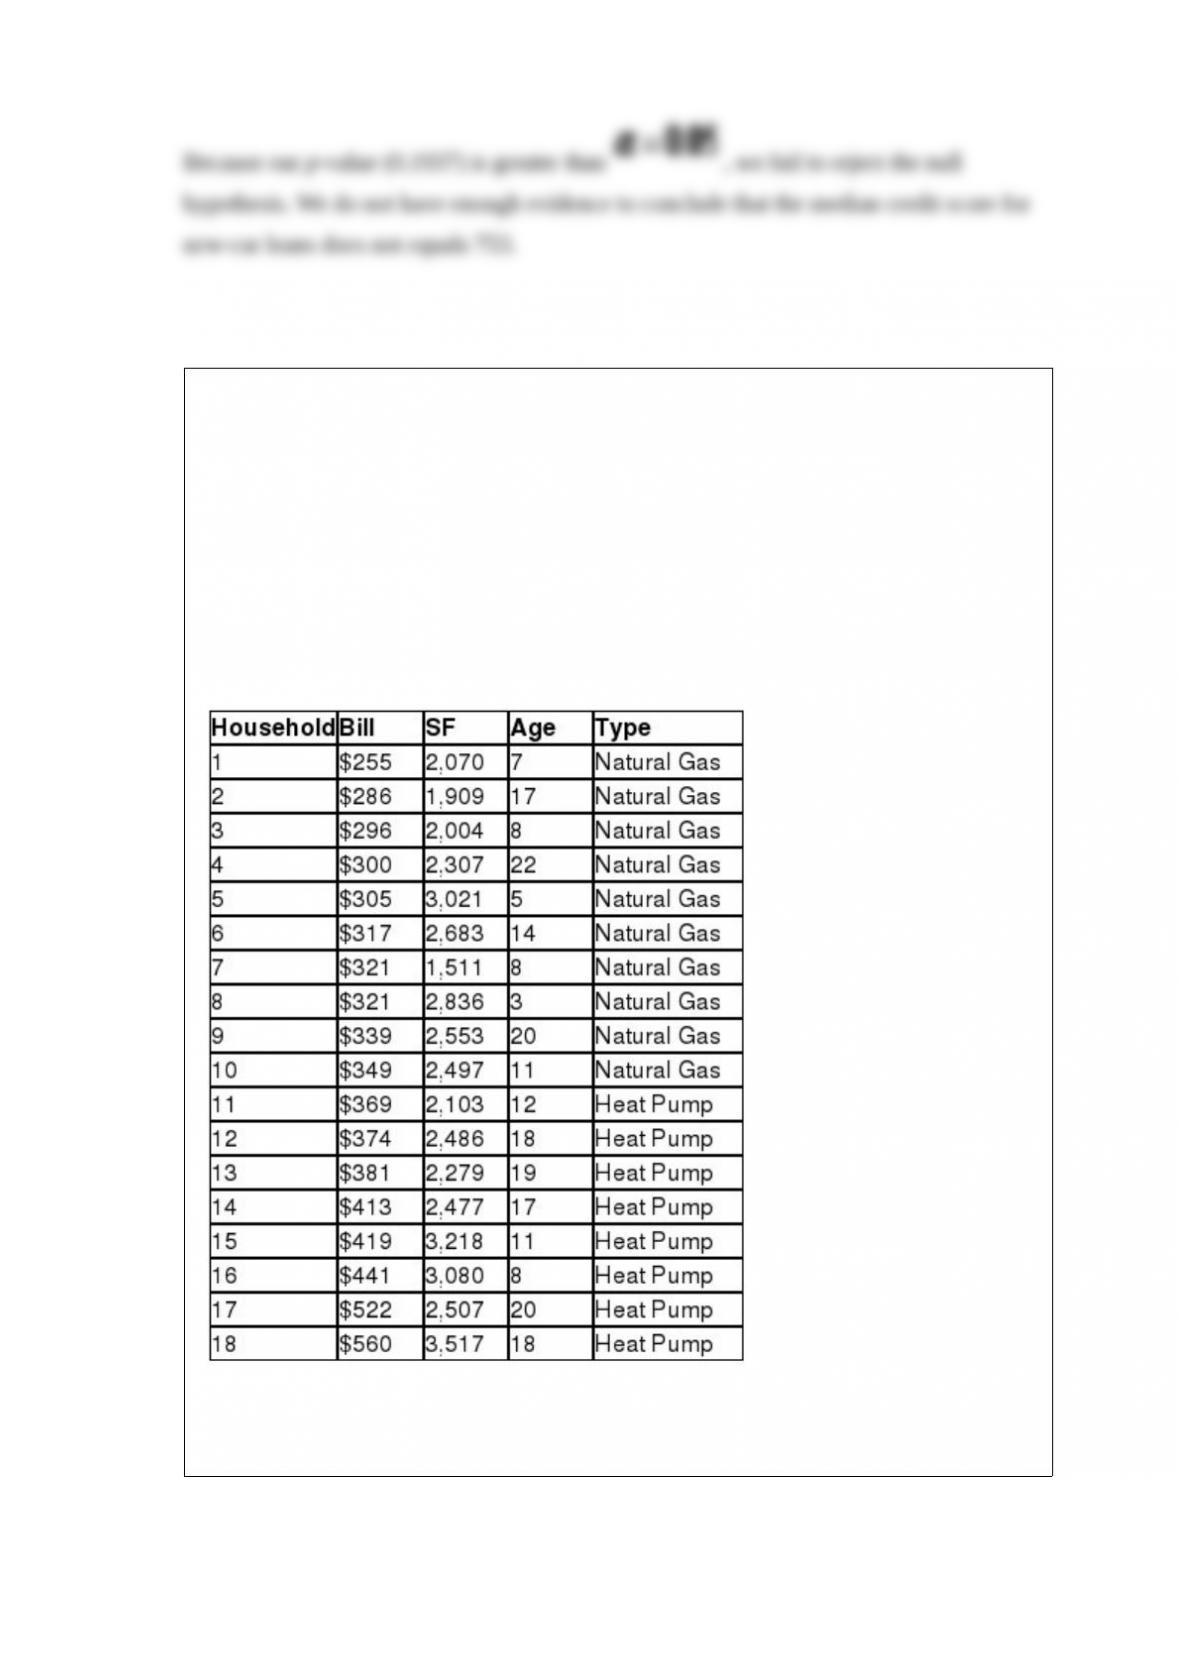
Use the following information to answer the question(s) below.
Delmarva Power is a utility company that would like to predict the monthly heating bill
for a household in Kent County during the month of January. A random sample of 18
households in the county were selected and their January heating bill recorded. This
data is shown in the table below along with the square footage of the house (SF), the
age of the heating system in years (Age,) and the type of heating system (heat pump = 1
or natural gas = 0).
Construct a 95% prediction interval to estimate the monthly heating bill for a specific
house that has 2,600 square feet and has a heat pump that is nine years old.
The Department of Labor would like to test the hypothesis that the average hourly wage
for recent college graduates is less than $20. A random sample of 24 recent college
graduates averaged $19.30 per hour with a standard deviation of $3.20 per hour. The
Department of Labor would like to set α = 0.10. Use the p-value approach to test this
hypothesis.
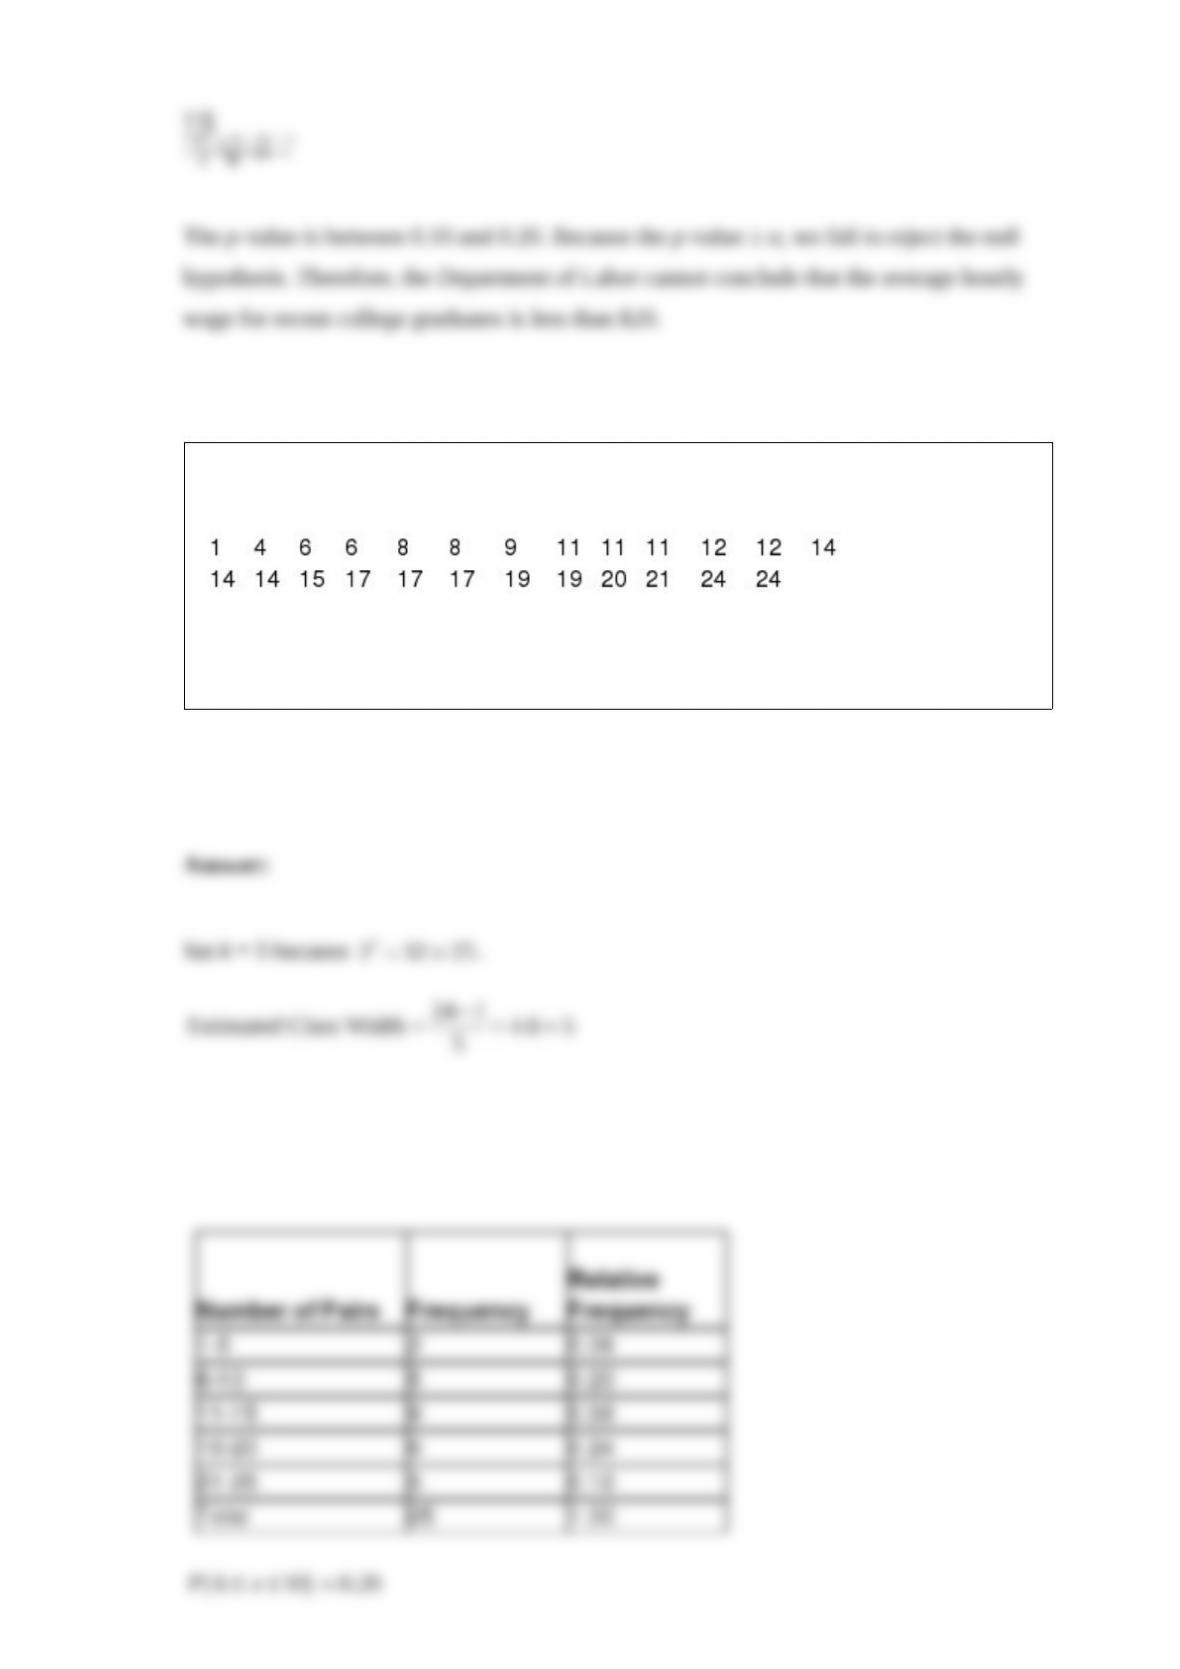
The following data show the number of pairs of men’s New Balance sneakers that were
sold over the last 25 weeks at a discount shoe store.
Construct a relative frequency distribution for this data and determine the probability
that between 6 to 10 pairs of New Balance shoes will be sold next week.
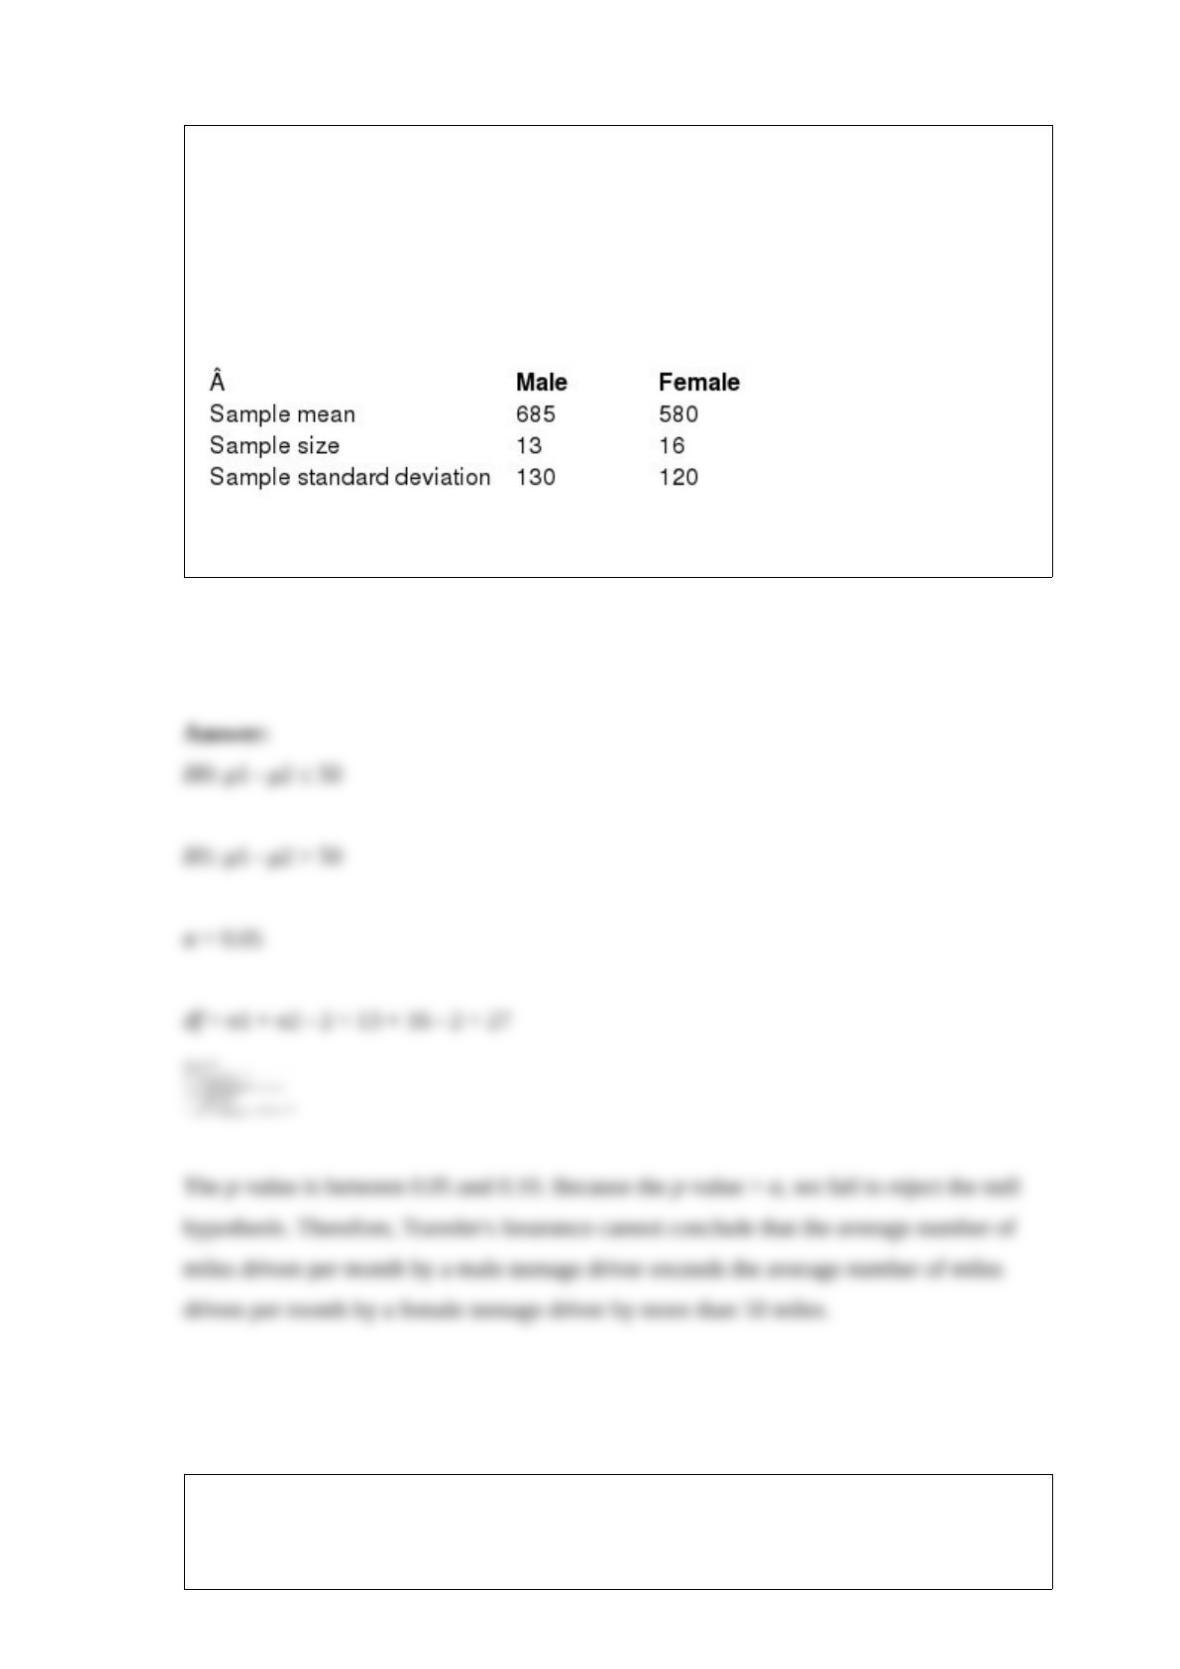
Traveler’s Insurance would like to test the hypothesis that the average number of miles
driven per month by a male teenage driver exceeds the average number of miles driven
per month by a female teenage driver by more than 50 miles. The following data
summarizes the sample statistics for the miles driven per month by each gender.
Assume that the population variances are equal.
Define Population 1 as male drivers and Population 2 as female drivers and use the
p-value approach to test this hypothesis with α = 0.05.
Brian plays golf regularly and would like to test the hypothesis that the number of golf
balls that he loses during a round follows the Poisson distribution with an average of
2.0 balls per round. To test this hypothesis, he has collected the following lost ball data
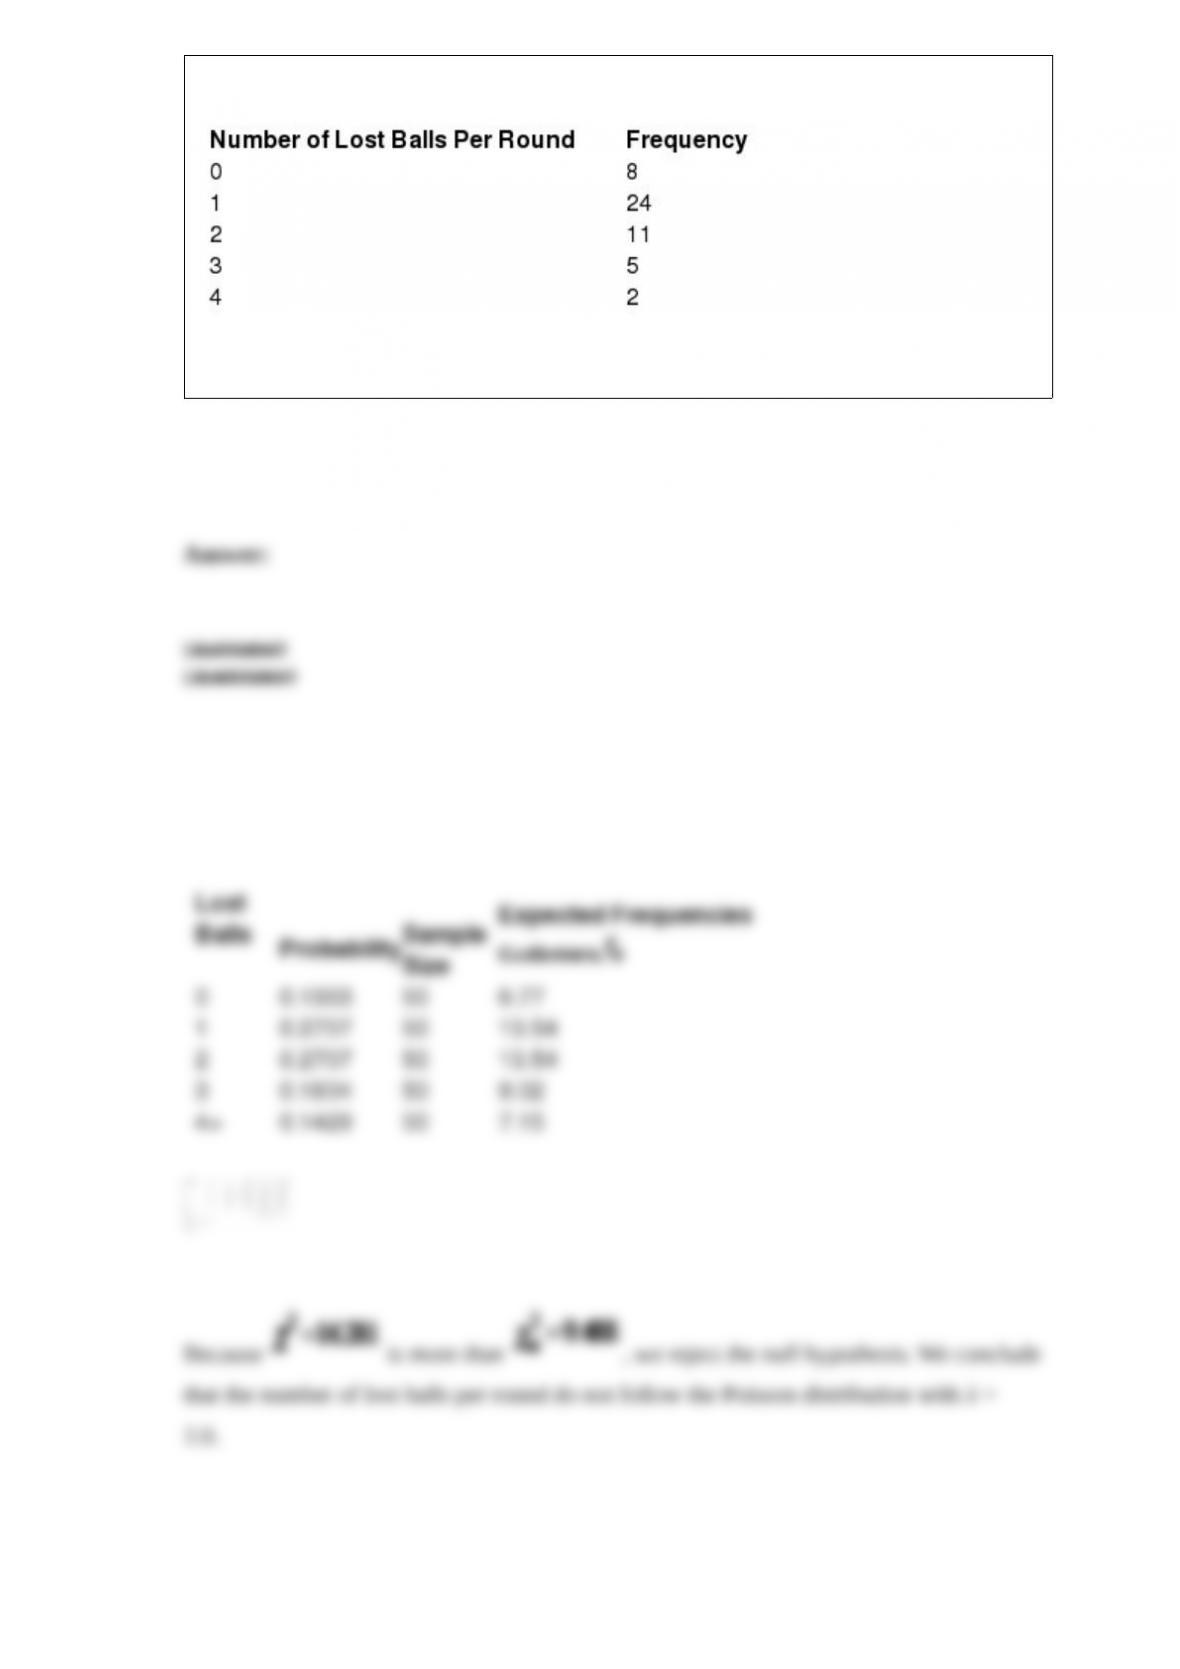
from a random sample of rounds.
Perform this hypothesis test usingα = 0.05.
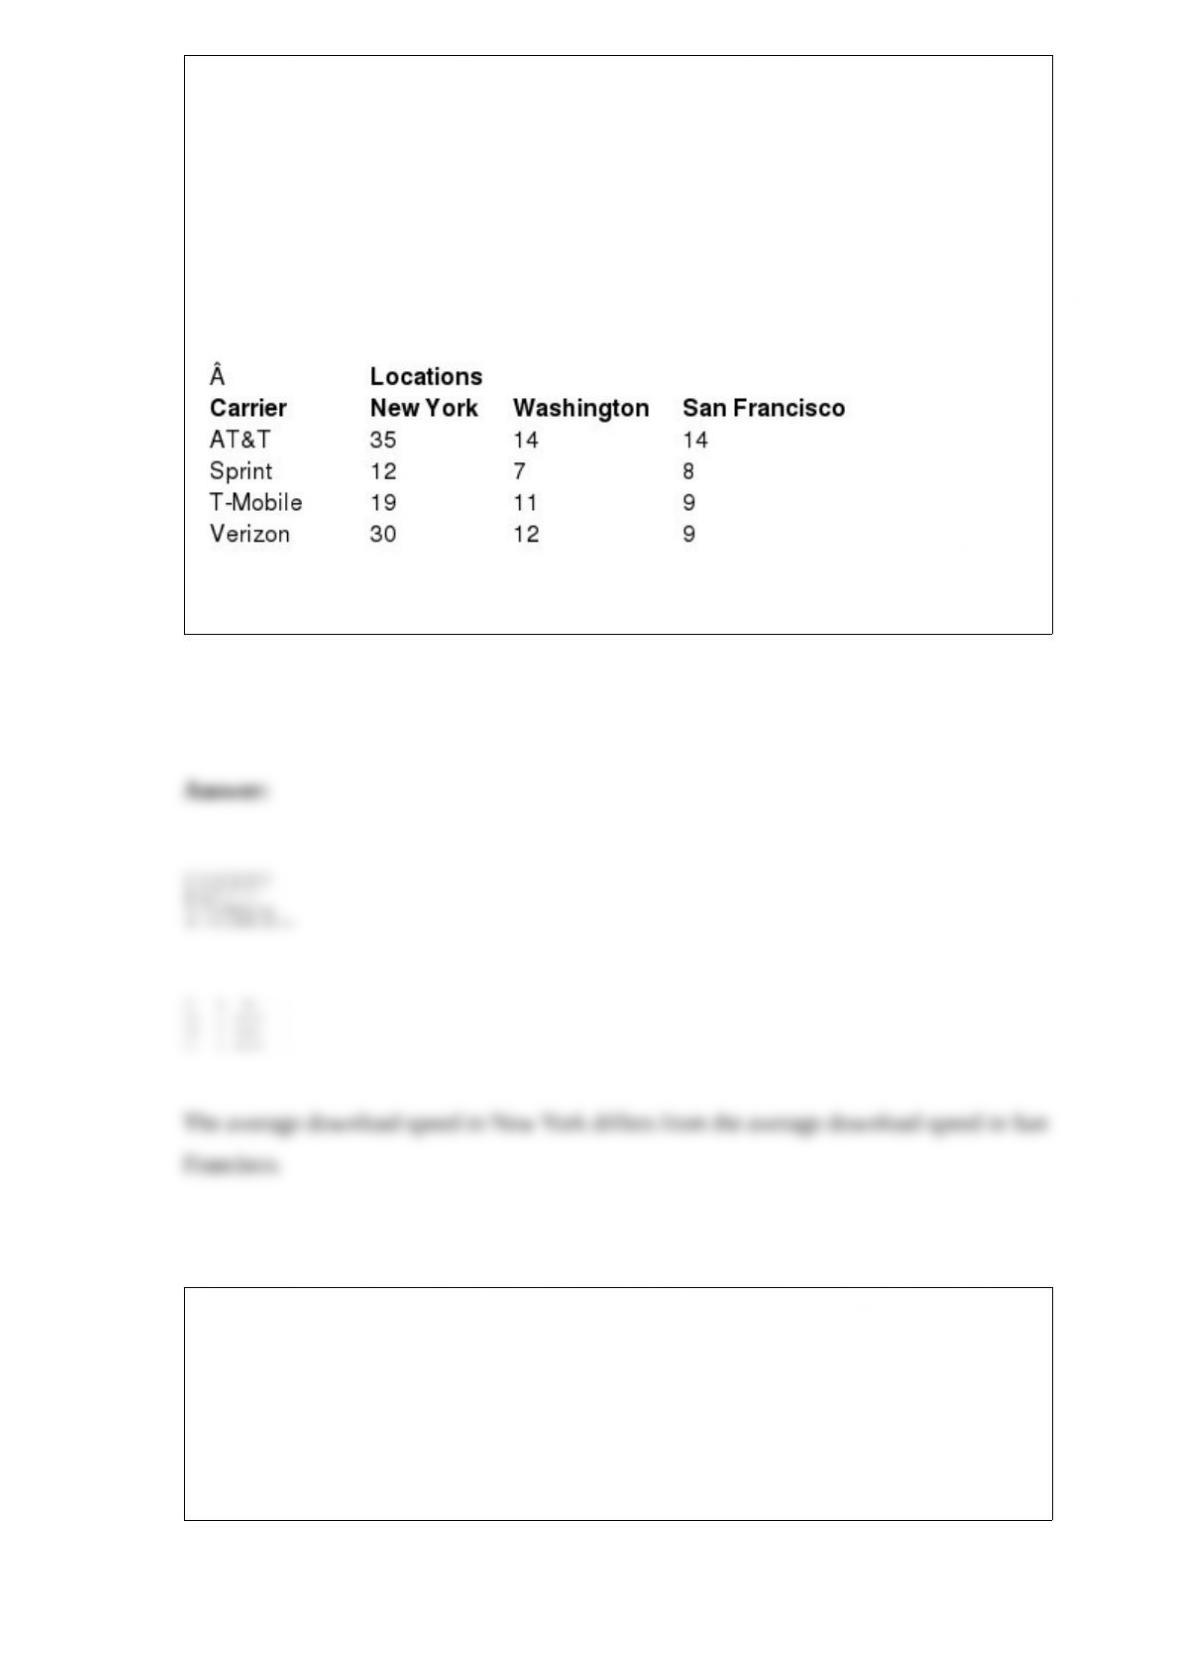
Note: The problems below are based on the following information:
The following data show the download speed in megabytes per second for a random
sample of smartphone users in three cities using four different networks.
If appropriate, perform a multiple comparisons test to determine which pairs are
different using α = 0.05.
A professor would like to test the hypothesis that the average grade for a student taking
a 10 am statistics class averages five points higher than the average grade from a
student in an 8 am statistics class. The following data shows the sample size and
average grades for students in the two class times along with the population standard
deviations.
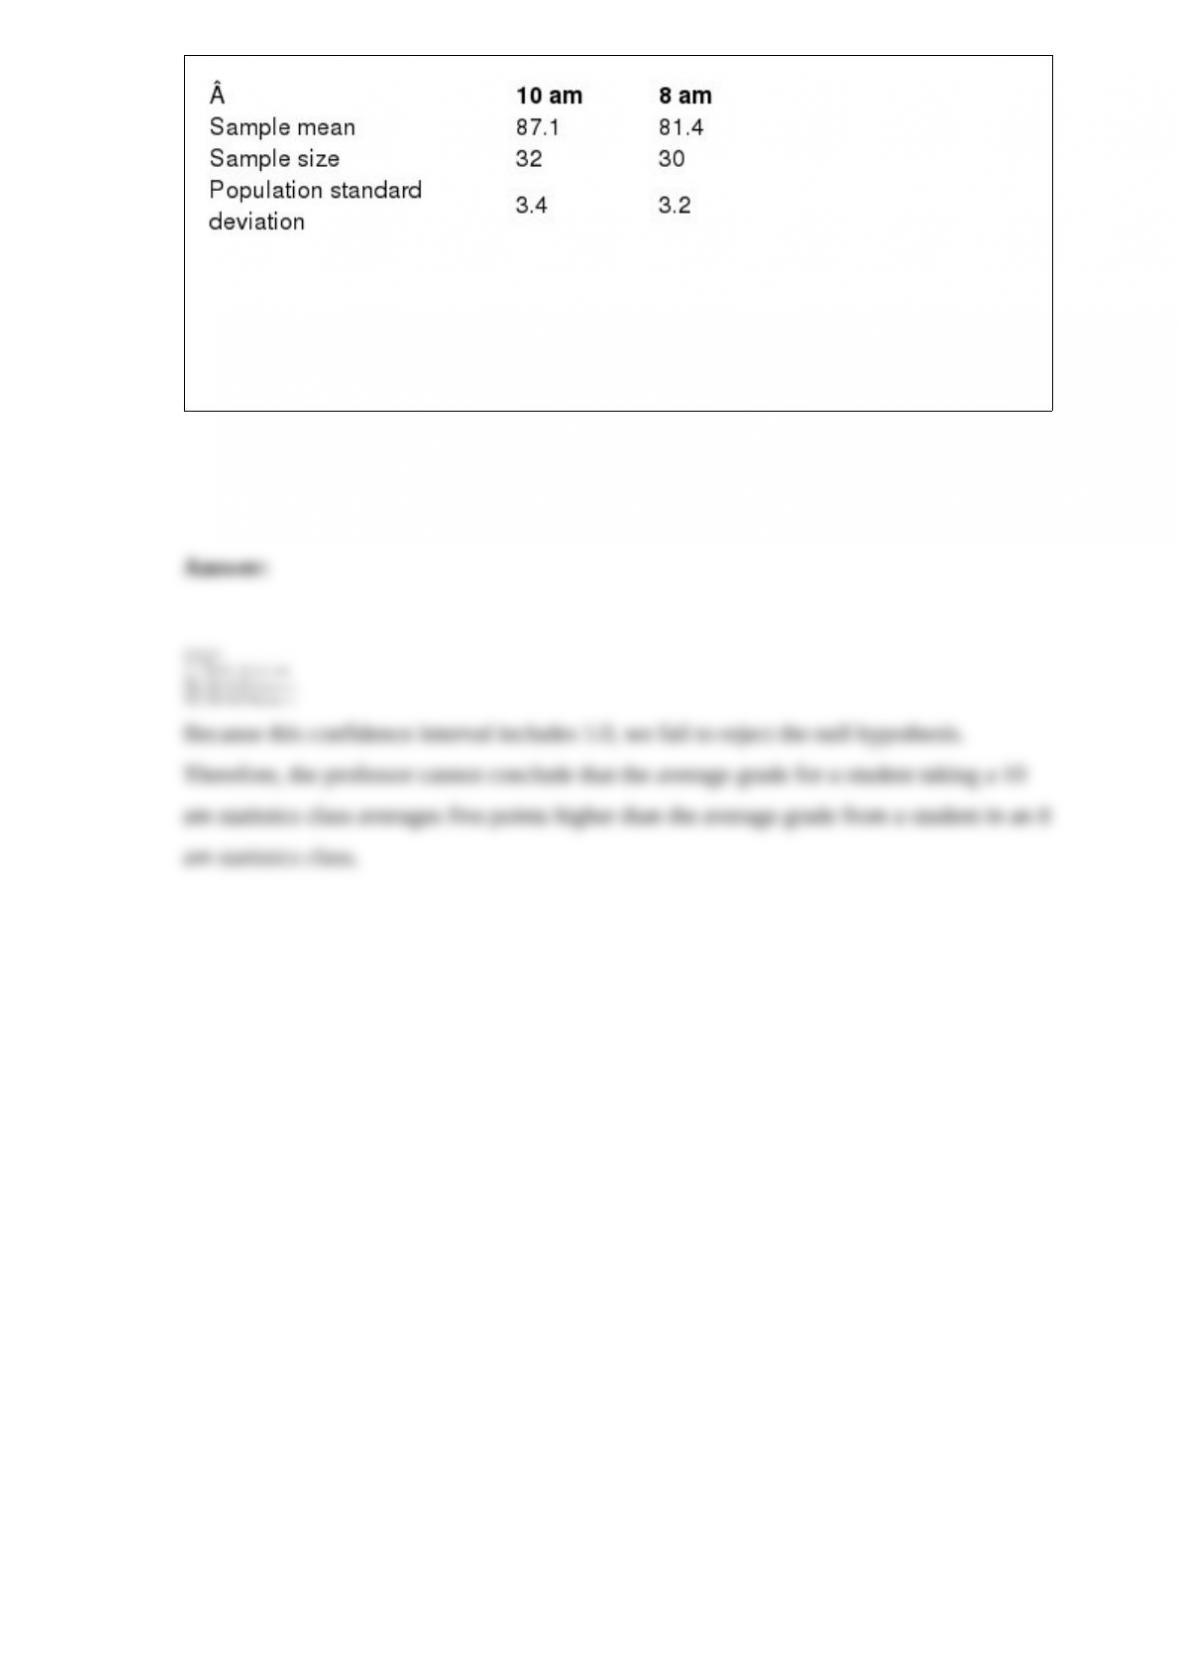
Define Population 1 is defined as the 10 am class and Population 2 the 8 am class.
Construct an 80% confidence interval for the difference in population mean and
interpret the results.