1) the period in the u.s. economy from 1995 to 2007 is characterized by:
a.a higher trend rate of saving.
b.a higher natural rate of unemployment.
c.a higher trend rate of productivity growth.
d.the end of the business cycle.
2) If the reserve requirement is 10 percent, how much excess reserves does a bank
acquire when a business deposits a $500 check drawn on another bank?
A.$450
B.$400
C.$5000
D.$550
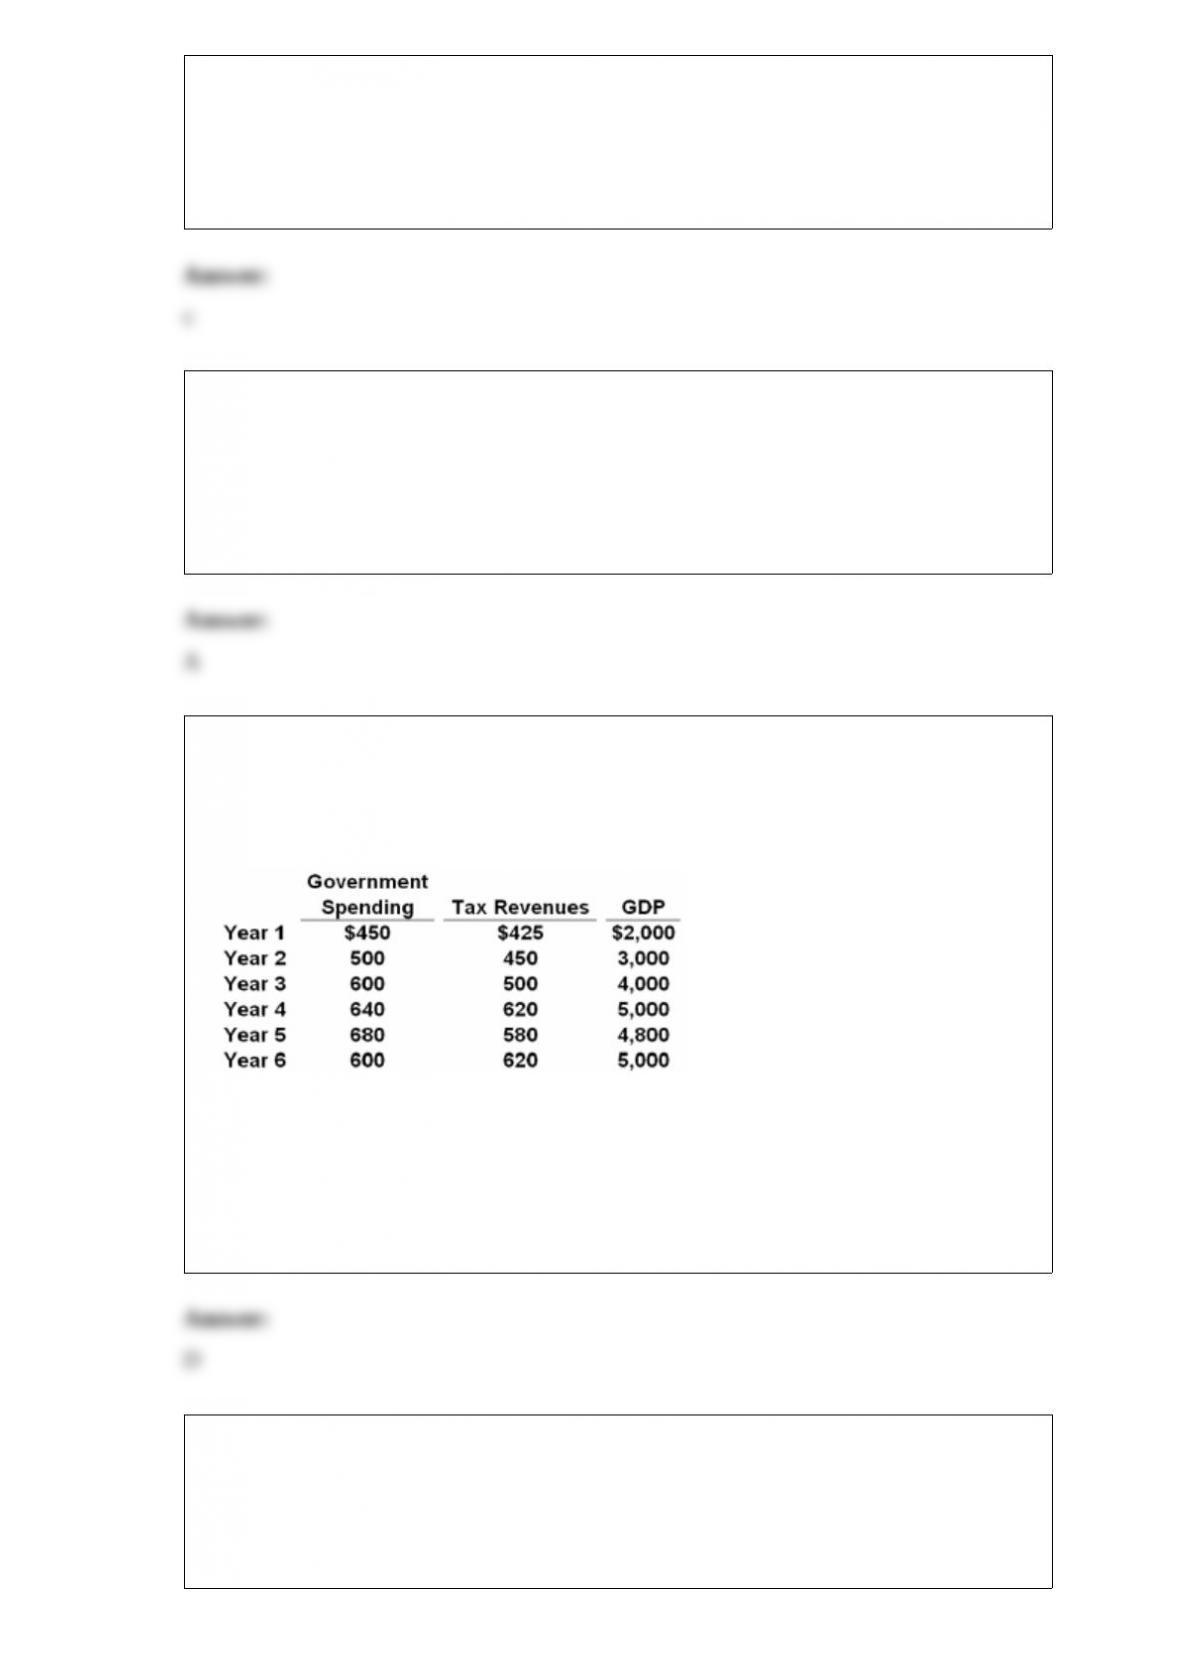
3) Answer the next question(s) using the following budget information for a
hypothetical economy. Assume that all budget surpluses are use to pay down the public
debt.
Refer to the above data. If year 1 is the first year of this nation’s existence and year 4 is
the present year, the public debt as a percentage of GDP in year 4 is:
A.7.5 percent.
B.1.39 percent.
C.2.5 percent.
D.3.9 percent.
4) If technology dictates that labor and capital must be used in fixed proportions, an
increase in the price of capital will cause a firm to use:
A.more labor as a consequence of the substitution effect.
B.more labor as a consequence of the output effect.
C.less labor as a consequence of the substitution effect.

D.less labor as a consequence of the output effect.
5) The equations for the demand and supply curves for a particular product are P = 10
.4Q and P = 2 + .4Q, where P is price and Q is quantity expressed in units of 100. After
an excise tax is imposed on the product the supply equation is P = 3 + .4Q.
Refer to the above information. The equilibrium quantity before the excise tax is
imposed is:
A.800 units.
B.1,000 units.
C.1,200 units.
D.1,400 units.
6) If the rate of exchange for a pound is $4, the rate of exchange for the dollar is:
A.1/4pound.
B.4 pounds.
C.$.25.
D.$1.00.
7) According to monetarists:
A.changes in the money supply are the primary cause of changes in the price level.
B.an expansionary fiscal policy will lower interest rates and overstimulate the economy.
C.changes in the velocity of money are more important than changes in the money
supply in causing the level of economic activity to change.
D.the supply of money changes in response to changes in the levels of real output and
prices.
8) Rational expectations theory is based on the assumption that:
A.wages and prices are flexible upward, but inflexible downward.
B.both product and resource markets are very competitive.
C.product markets are competitive, but resource markets are monopolistic.
D.both product and resource markets are monopolistic.
9) if yesterday $1 would buy 800 south korean won, but today $1 will only buy 790
won; the:
a.dollar has appreciated in value.
b.dollar has depreciated in value.
c.demand for dollars in the foreign exchange market has increased relative to the supply
of won.
d.won price of dollars has gone up.
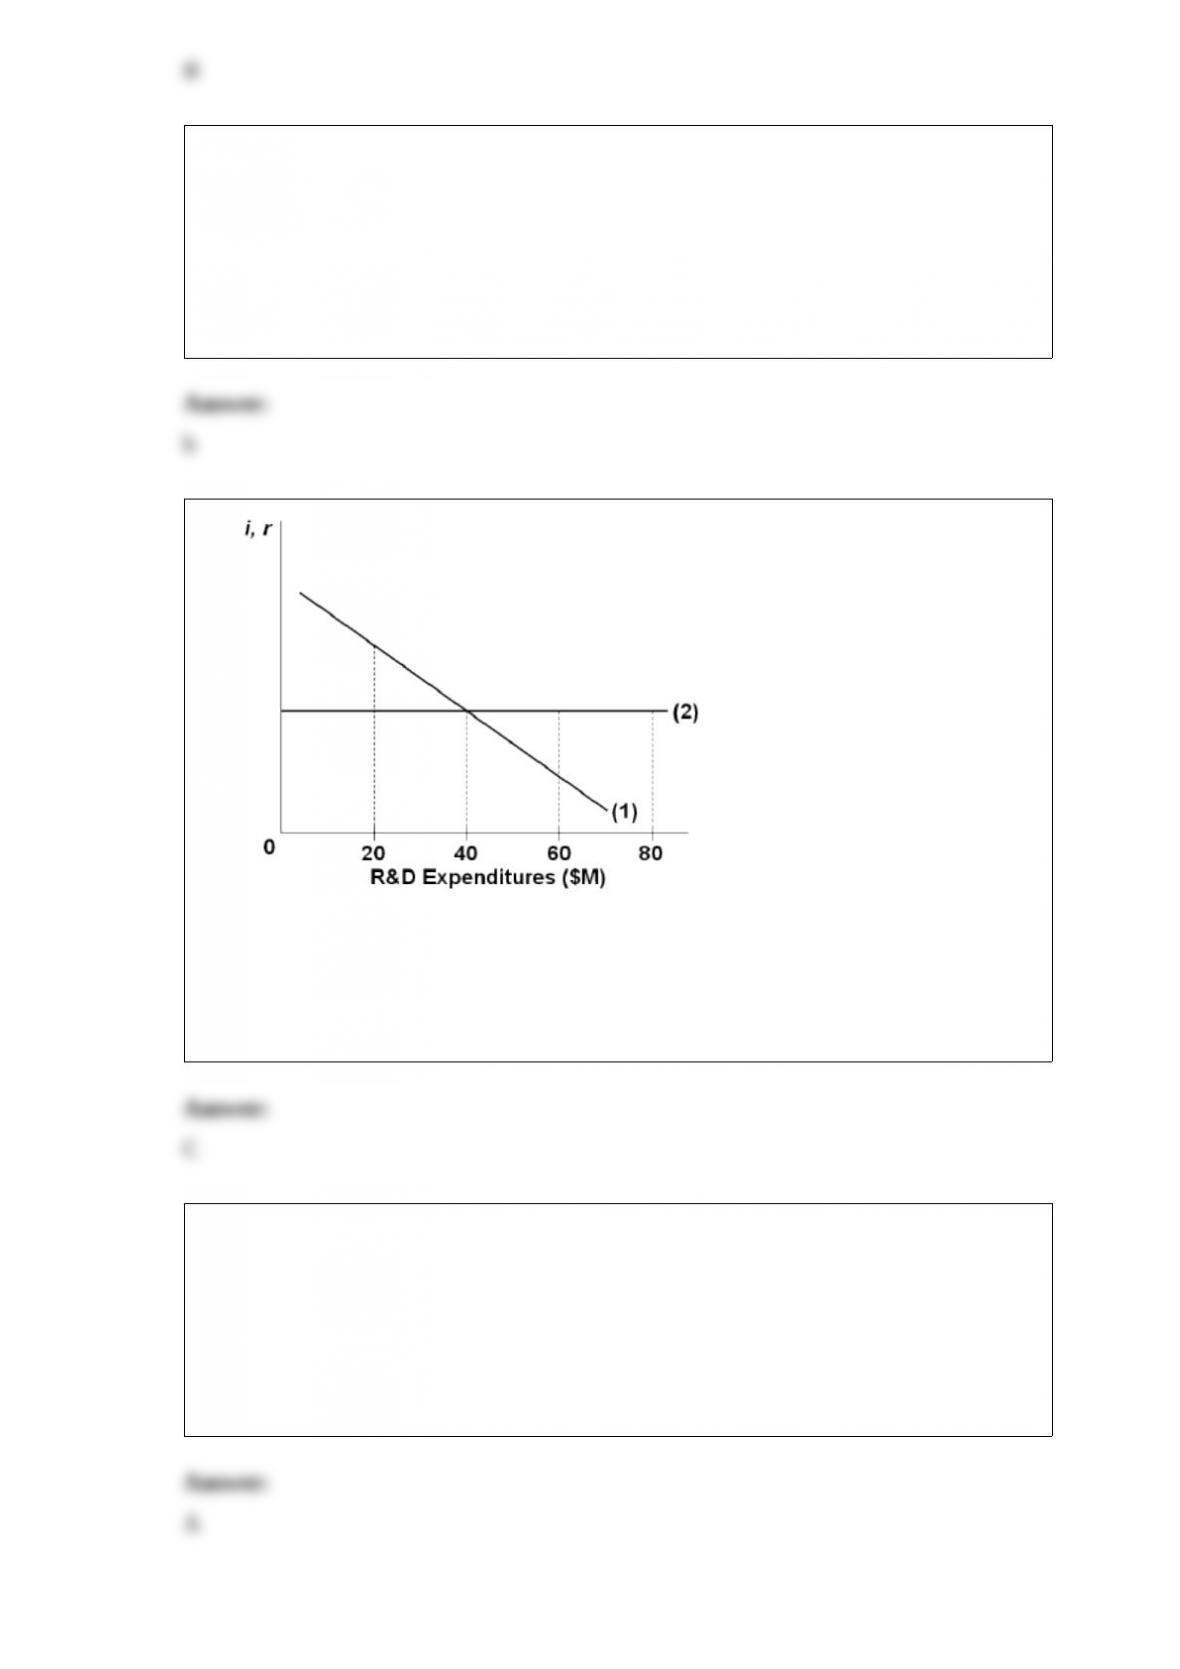
10)
In the above diagram, at $60 million of R&D expenditure the:
A.expected rate of return exceeds the interest rate cost of funds.
B.firm is spending an optimal amount on R&D.
C.interest rate cost of funds exceeds the expected rate of return.
D.expected rate of return on R&D is negative.
11) Income mobility:
A.makes lifetime income inequality among income receivers in the United States less
than income inequality in any single year.
B.is less in the United States than in most developing nations.
C.is the movement of wage earners from one job to another.
D.reduces the total percentage of households in the lowest quintile of the income
distribution over time.
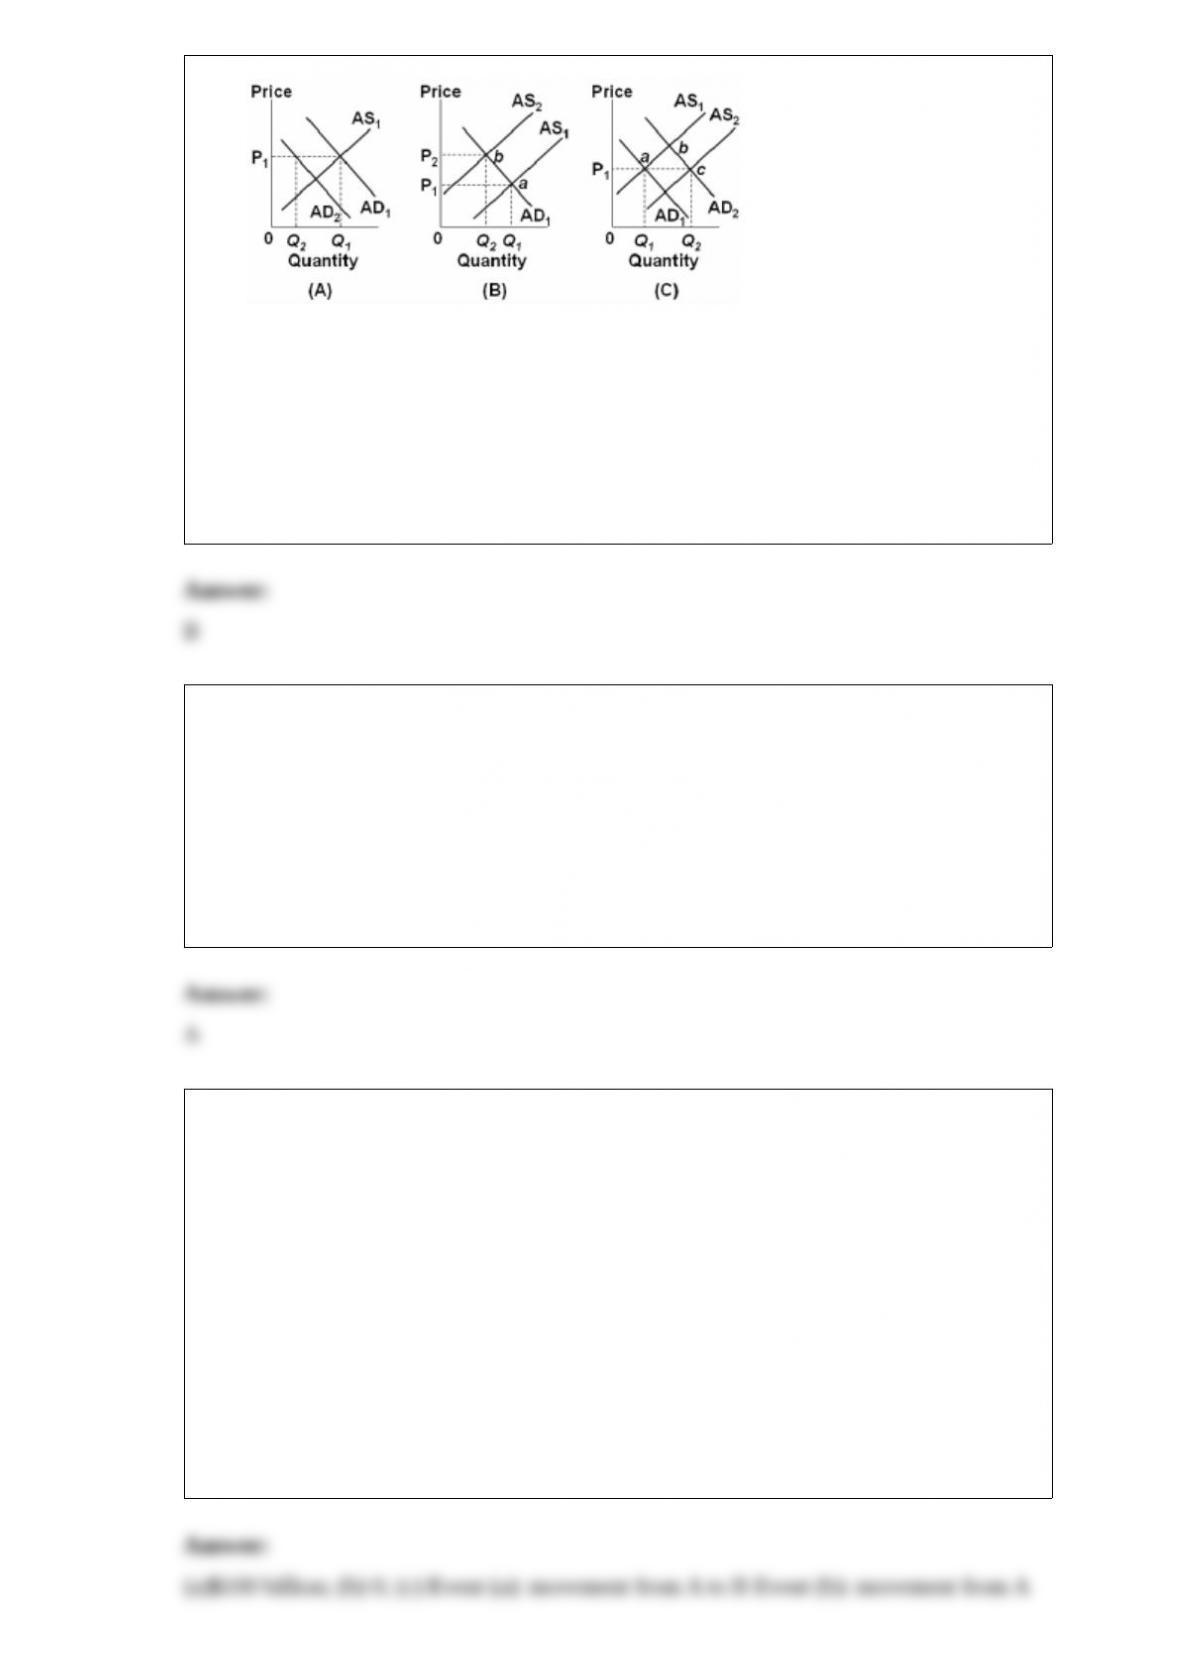
12)
Refer to the above diagrams, in which AD1 and AS1 are the “before” curves and AD2
and AS2 are the “after” curves. Other things equal, a decline in productivity is depicted
by:
A.panel (A) only.
B.panel (B) only.
C.panel (C) only.
D.panels (B) and (C).
13) A firm that is motivated by self interest should:
A.employ the combination of resources that will produce the profit-maximizing output
at the minimum cost.
B.hire each input so the productivity of each is equal at the margin.
C.always use large amounts of the most productive inputs and small amounts of the
least productive inputs in producing its output.
D.always use large amounts of cheap inputs and small amounts of expensive inputs in
producing its output.
14) The table below gives data on interest rates and investment demand in a
hypothetical economy. Figures are in billions.
(a)Use the Id1 schedule. Assume that the government needs to finance a budget deficit
and this public borrowing increases the interest rate from 5 percent to 6 percent. How
much crowding-out of private investment will occur?
(b)Now assume that the deficit is used to improve the performance of the economy, and
that as a consequence the investment-demand schedule changes from Id1 to Id2. At the
same time, the interest rate rises from 5 percent to 6 percent as the government borrows
money to finance the deficit. How much crowding-out of private investment will occur
in this case?
(c)Graph the two investment-demand schedules on the graph below and show the
difference between the two events. Put the interest rate on the vertical axis and the
quantity of investment demanded on the horizontal axis.