
Calculating the “ratios of actuals to moving average” is a common step in time series
decomposition. The results (the quotients) of this step estimate the ________.
a) trend and cyclical components
b) seasonal and irregular components
c) cyclical and irregular components
d) trend and seasonal components
e) irregular components
According to the central limit theorem, if a sample of size 100 is drawn from a
population with a standard deviation of 80, the standard deviation of sample means
would equal _______.
a) 0.80
b) 8
c) 80
d) 800
e) 0.080
In a regression analysis if SST = 200 and SSR = 200, r 2= _________.
a) 0.25
b) 0.75

c) 0.00
d) 1.00
e) -1.00
In a two-tailed hypothesis about a population mean with a sample size of 100, is
known, and alpha = 0.10, the rejection region would be _______.
a) z > 1.64
b) z > 1.28
c) z < -1.28 and z > 1.28
d) z < -1.64 and z > 1.64
e) z < -2.33 and z > 2.33
While reviewing staffing plans for a new pilot plant, Colin Chenaux, VP of Operations
at Clovis Chemicals, Inc., designed an experiment to test the effects of “supervisor’s
style” and “training method” on the productivity of operators. The treatment levels
were: (1) authoritarian, and participatory for supervisor’s style, and (2) technical
manuals, training films, and multimedia for training method. Three qualified applicants
were randomly selected and assigned to each of the six cells. In Colin’s experiment,
“training method” is _____________.
a) a treatment variable
b) a surrogate variable
c) the dependent variable
d) a blocking variable
e) a constant

A p Chart is to be developed for use in quality control. The value of p is calculated to be
0.54. The sample size is 249. What would the upper control limit be?
a) 0.5941
b) -0.6348
c) 0.4452
d) -0.5460
e) 0.5340
Jessica Salas, president of Salas Products, is reviewing the warranty policy for her
company’s new model of automobile batteries. Life tests performed on a sample of 100
batteries indicated: (1) an average life of 75 months, (2) a standard deviation of 5
months, and (3) a bell shaped battery life distribution. What percentage of the batteries
will fail within the first 65 months of use?
a) 0.5%
b) 1%
c) 2.5%
d) 5%
e) 7.5%

Given P (A) = 0.45, P (B) = 0.30, P (A B) = 0.05. Which of the following is
true?
a) A and B are independent
b) A and B are mutually exclusive
c) A and B are collectively exhaustive
d) A and B are not independent
e) A and B are complimentary
An automobile dealer wishes to investigate the relation between the gender of the buyer
and type of vehicle purchased. Based on the following joint probability table that was
developed from the dealer’s records for the previous year, P (Female) = __________.
a) 0.30

b) 0.40
c) 0.12
d) 0.10
e) 0.60
At a certain workstation in an assembly line, the time required to assemble a component
is exponentially distributed with a mean time of 10 minutes. Find the probability that a
component is assembled in 3 to 7 minutes?
a) 0.5034
b) 0.2592
c) 0.2442
d) 0.2942
e) 0.5084
What is the Spearman rank correlation coefficient for the following set of data?
a) -10.2
b) -2.35
c) 0.65
d) 0.50
e) 0.05
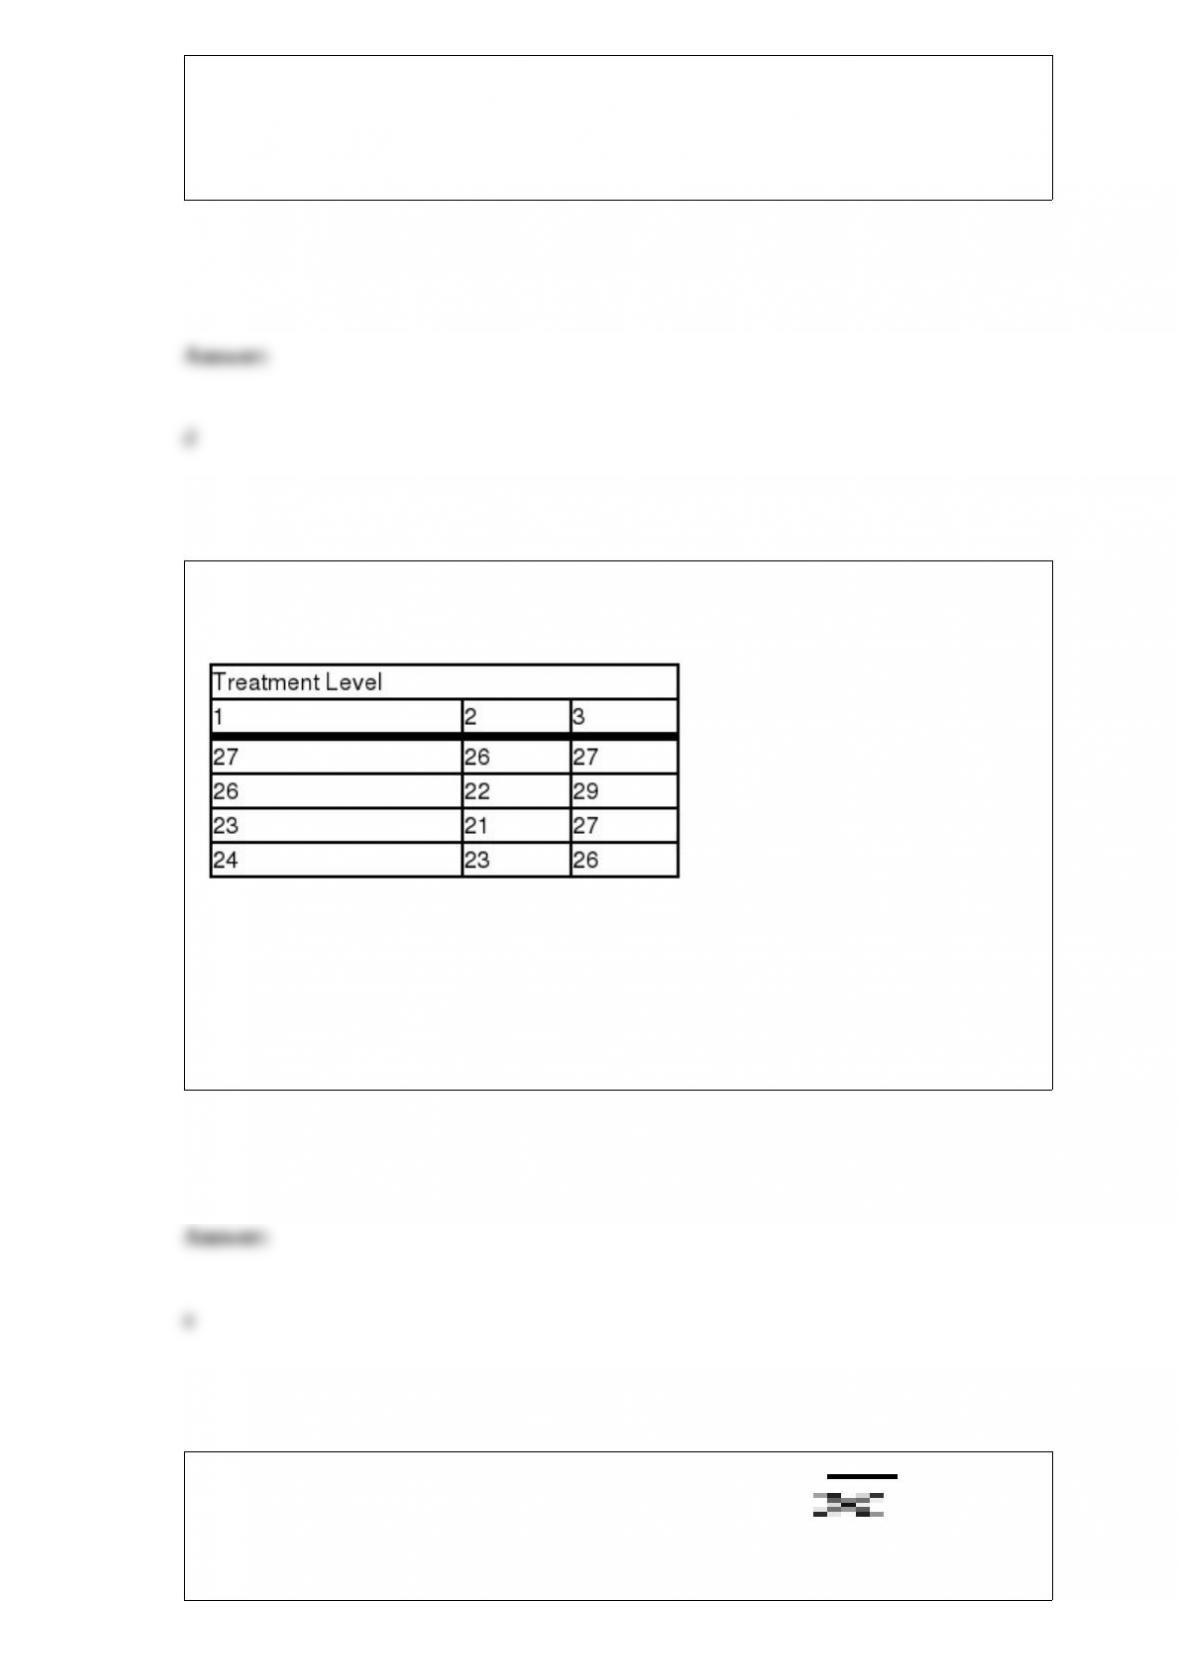
Data from a completely randomized design are shown in the following table.
For a one-way ANOVA, the Between Sum of Squares (SSC is ________.
a) 36.17
b) 28.75
c) 64.92
d) 18.03
e) 28.04
Decreasing the sample size causes the sampling distribution of to
________.

a) shift to the right
b) shift to the left
c) have more dispersion
d) have less dispersion
e) stay unchanged
A student makes an 82 on the first test in a statistics course. From this, she estimates
that her average at the end of the semester (after other tests) will be about 82. This is an
example of ___.
a) descriptive statistics
b) inferential statistics
c) population derivation
d) sample persuasion
e) relative level data
The following ANOVA table is from a multiple regression analysis.
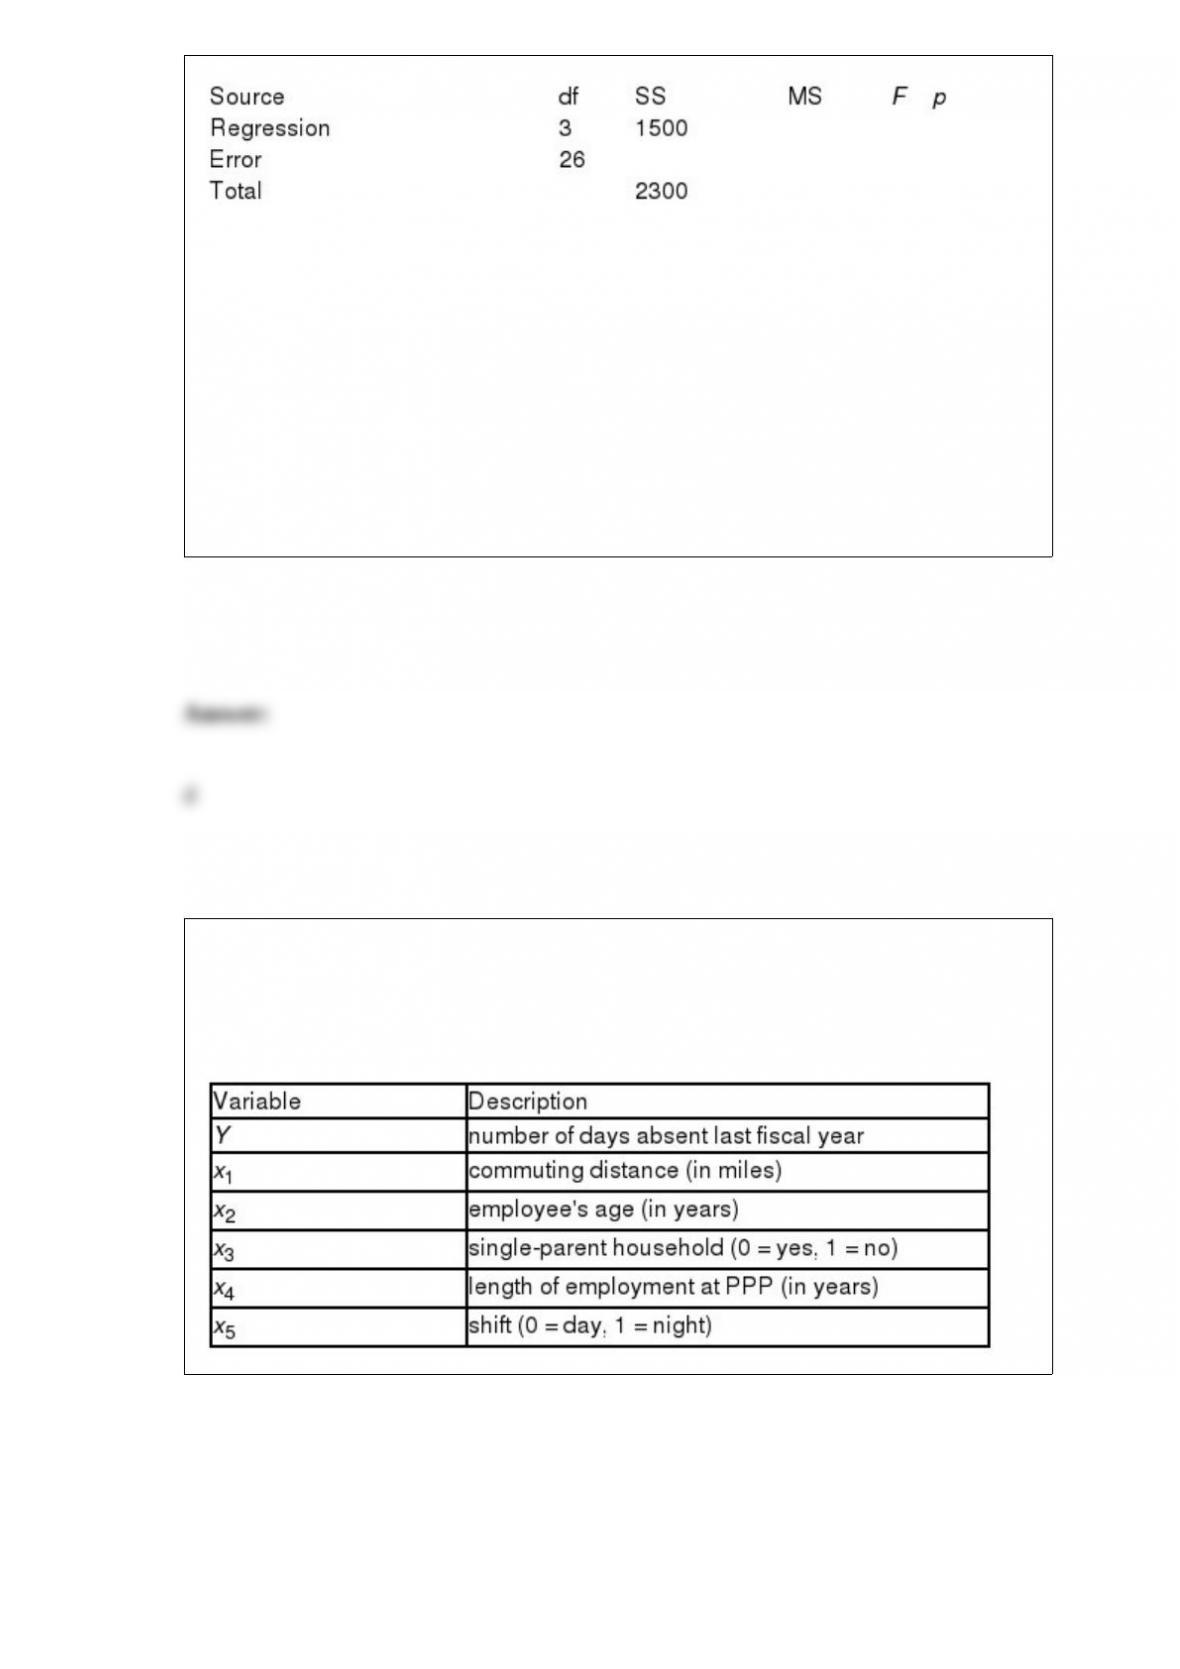
The number of independent variables in the analysis is __________.
a) 30
b) 26
c) 1
d) 3
e) 2
Carlos Cavazos, Director of Human Resources, is exploring employee absenteeism at
the Plano Piano Plant. A multiple regression analysis was performed using the
following variables. The results are presented below.
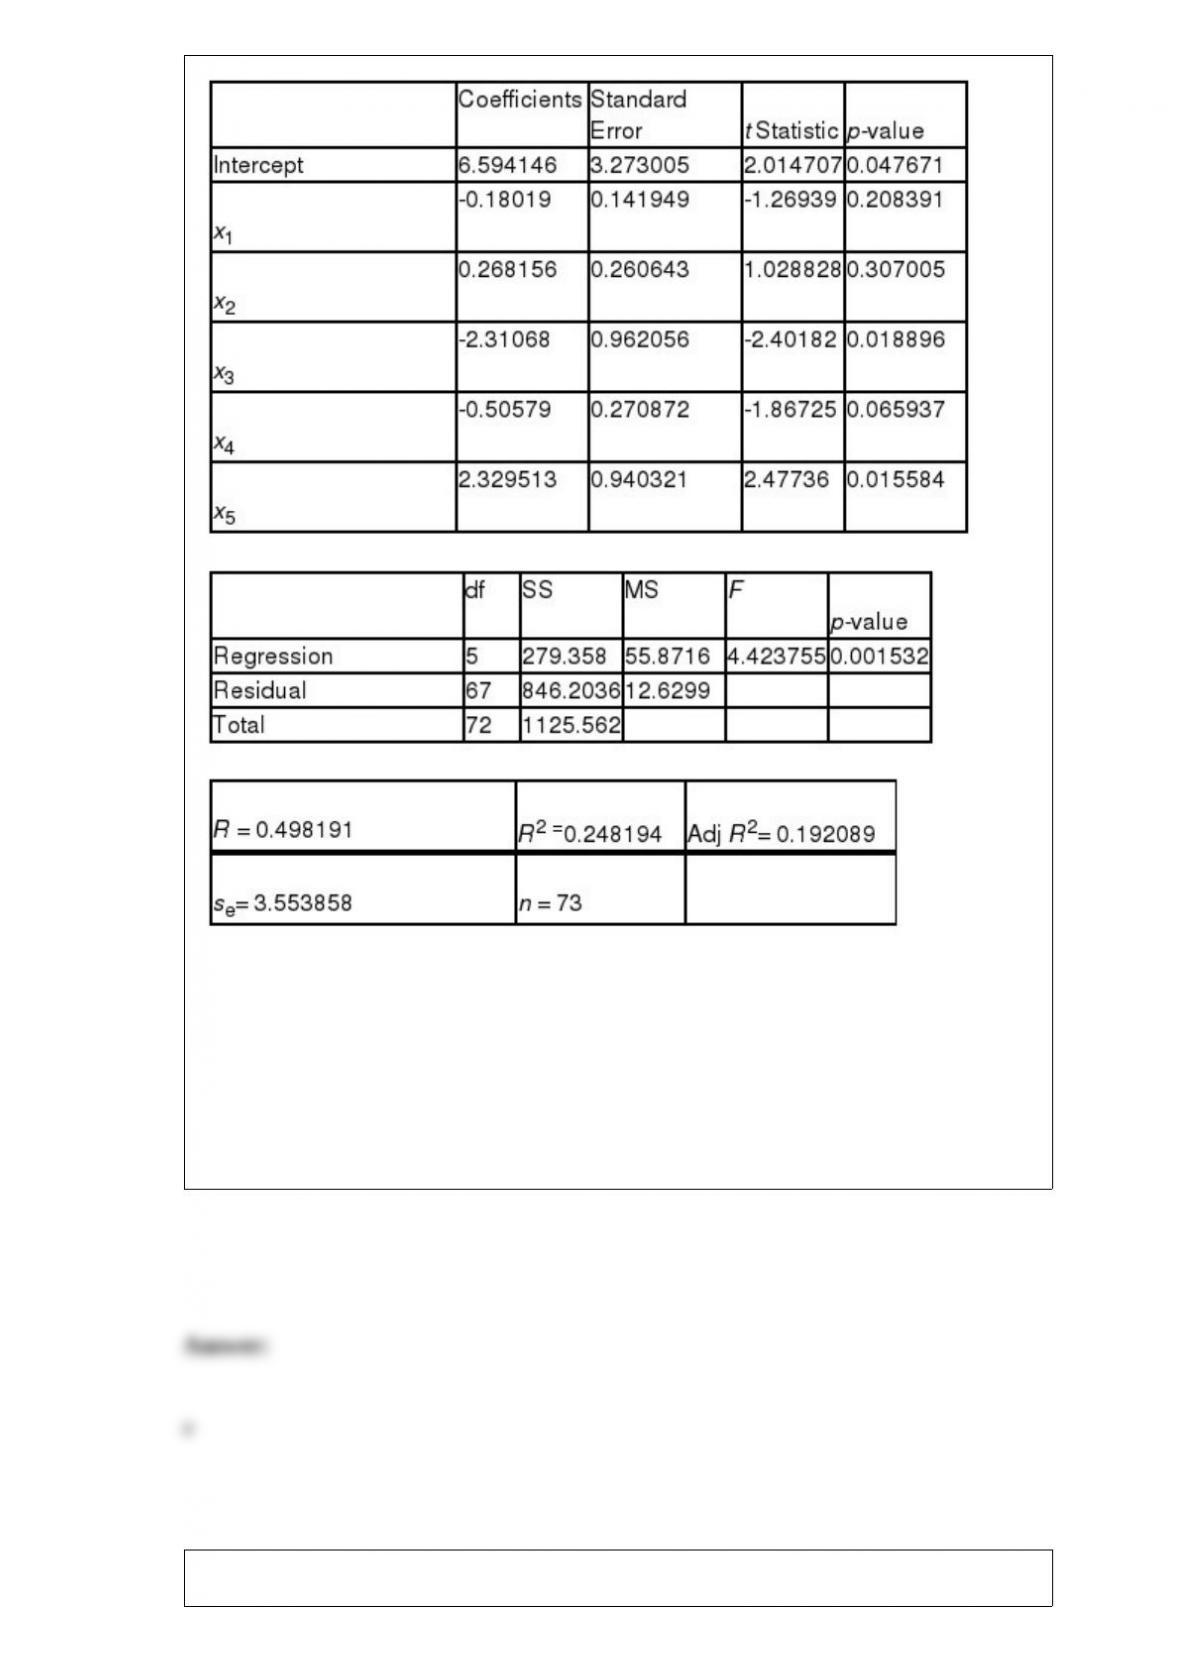
Which of the following conclusions can be drawn from the above results?
a) All the independent variables in the regression are significant at 5% level.
b) Commuting distance is a highly significant (<1%) variable in explaining
absenteeism.
c) Age of the employees tends to have a very significant (<1%) effect on absenteeism.
d) This model explains a little over 49% of the variability in absenteeism data.
e) A single-parent household employee is expected to be absent less number of days all
other variables held constant compared to one who is not a single-parent household.
Ray Crofford is evaluating investment alternatives for the $100,000 which he inherited
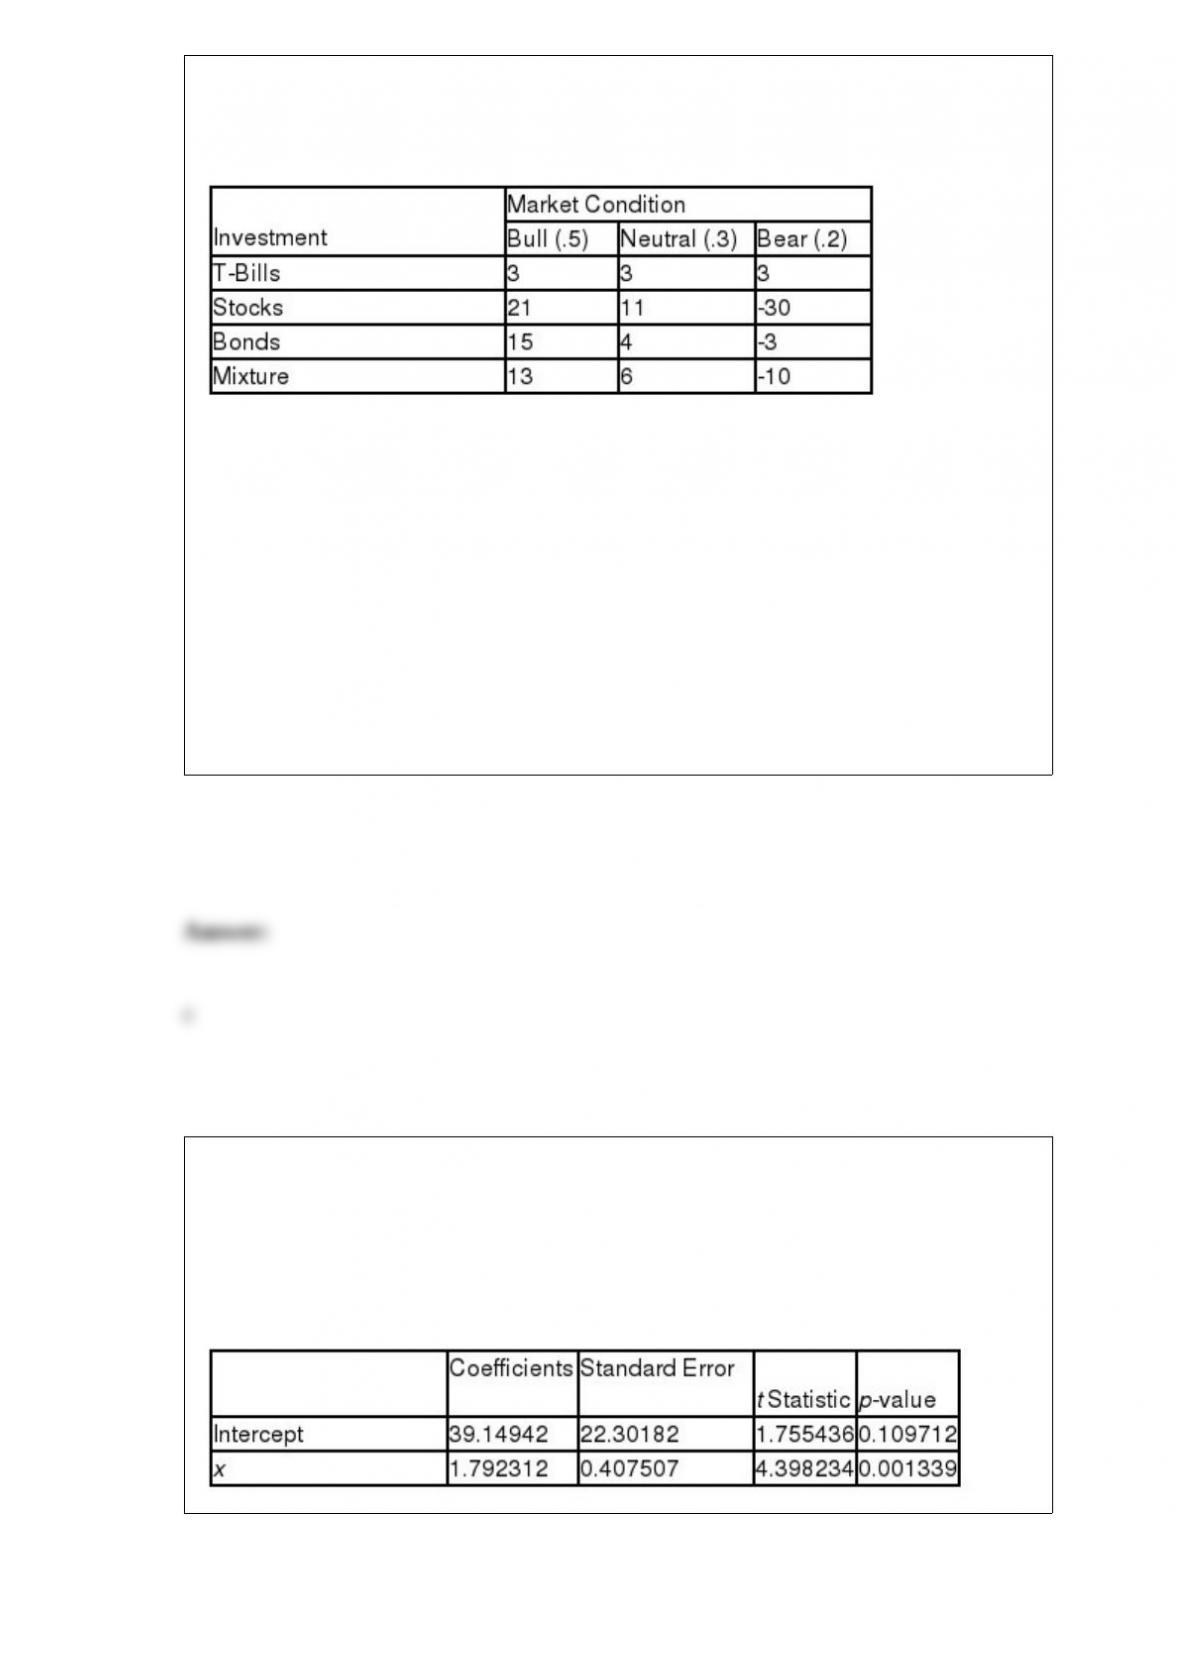
from his grandfather. His investment advisor has identified four alternatives and
constructed the following table which shows expected profits (in $10,000’s) for various
market conditions and their probabilities.
The EMV of investing in Stocks is ________.
a) $30,000
b) $63,000
c) $78,000
d) $81,000
e) $100,000
Abby Kratz, a market specialist at the market research firm of Saez, Sikes, and Spitz, is
analyzing household budget data collected by her firm. Abby’s dependent variable is
monthly household expenditures on groceries (in $’s), and her independent variable is
annual household income (in $1,000’s). Regression analysis of the data yielded the
following tables.

The correlation coefficient between the two variables in this regression is __________.
a) 0.682478
b) -0.83
c) 0.83
d) -0.68
e) 1.0008
Discrete Components, Inc. manufactures a line of electrical resistors. Presently, the
carbon composition line is producing 100 ohm resistors. The population variance of
these resistors “must not exceed 4” to conform to industry standards. Periodically, the
quality control inspectors check for conformity by randomly select 10 resistors from the
line, and calculating the sample variance. The last sample had a variance of 4.36.
Assume that the population is normally distributed. Using = 0.05, the appropriate
decision is _________________.
a) increase the sample size
b) reduce the sample size
c) reject the null hypothesis
d) fail to reject the null hypothesis
e) maintain status quo

Collinsville Construction Company purchases steel rods for its projects. Based on
previous tests, Claude Carter, Quality Assurance Manager, has recommended
purchasing rods from Redding Rods, Inc. (population 1), rather than Stockton Steel
(population 2), since Redding’s rods had less variability in length. Recently, Stockton
revised it rod shearing operation, and Claude has sampled the outputs from Redding’s
and Stockton’s rod manufacturing processes. The results for Redding were s1
2= 0.10
with n1= 8, and, for Stockton, the results were s2
2= 0.05 with n2= 10. Assume that rod
lengths are normally distributed in the population. Claude’s null hypothesis is
________________.
a)
b)
c)
d)
e) s s
Jessica Salas, president of Salas Products, is reviewing the warranty policy for her
company’s new model of automobile batteries. Life tests performed on a sample of 100
batteries indicated: (1) an average life of 75 months, (2) a standard deviation of 5
months, and (3) a bell shaped battery life distribution. Approximately 95% of the
batteries will last between ________________.
a) 70 and 80 months
b) 60 and 90 months
c) 65 and 85 months
d) 55 and 95 months
e) 60 and 100 months
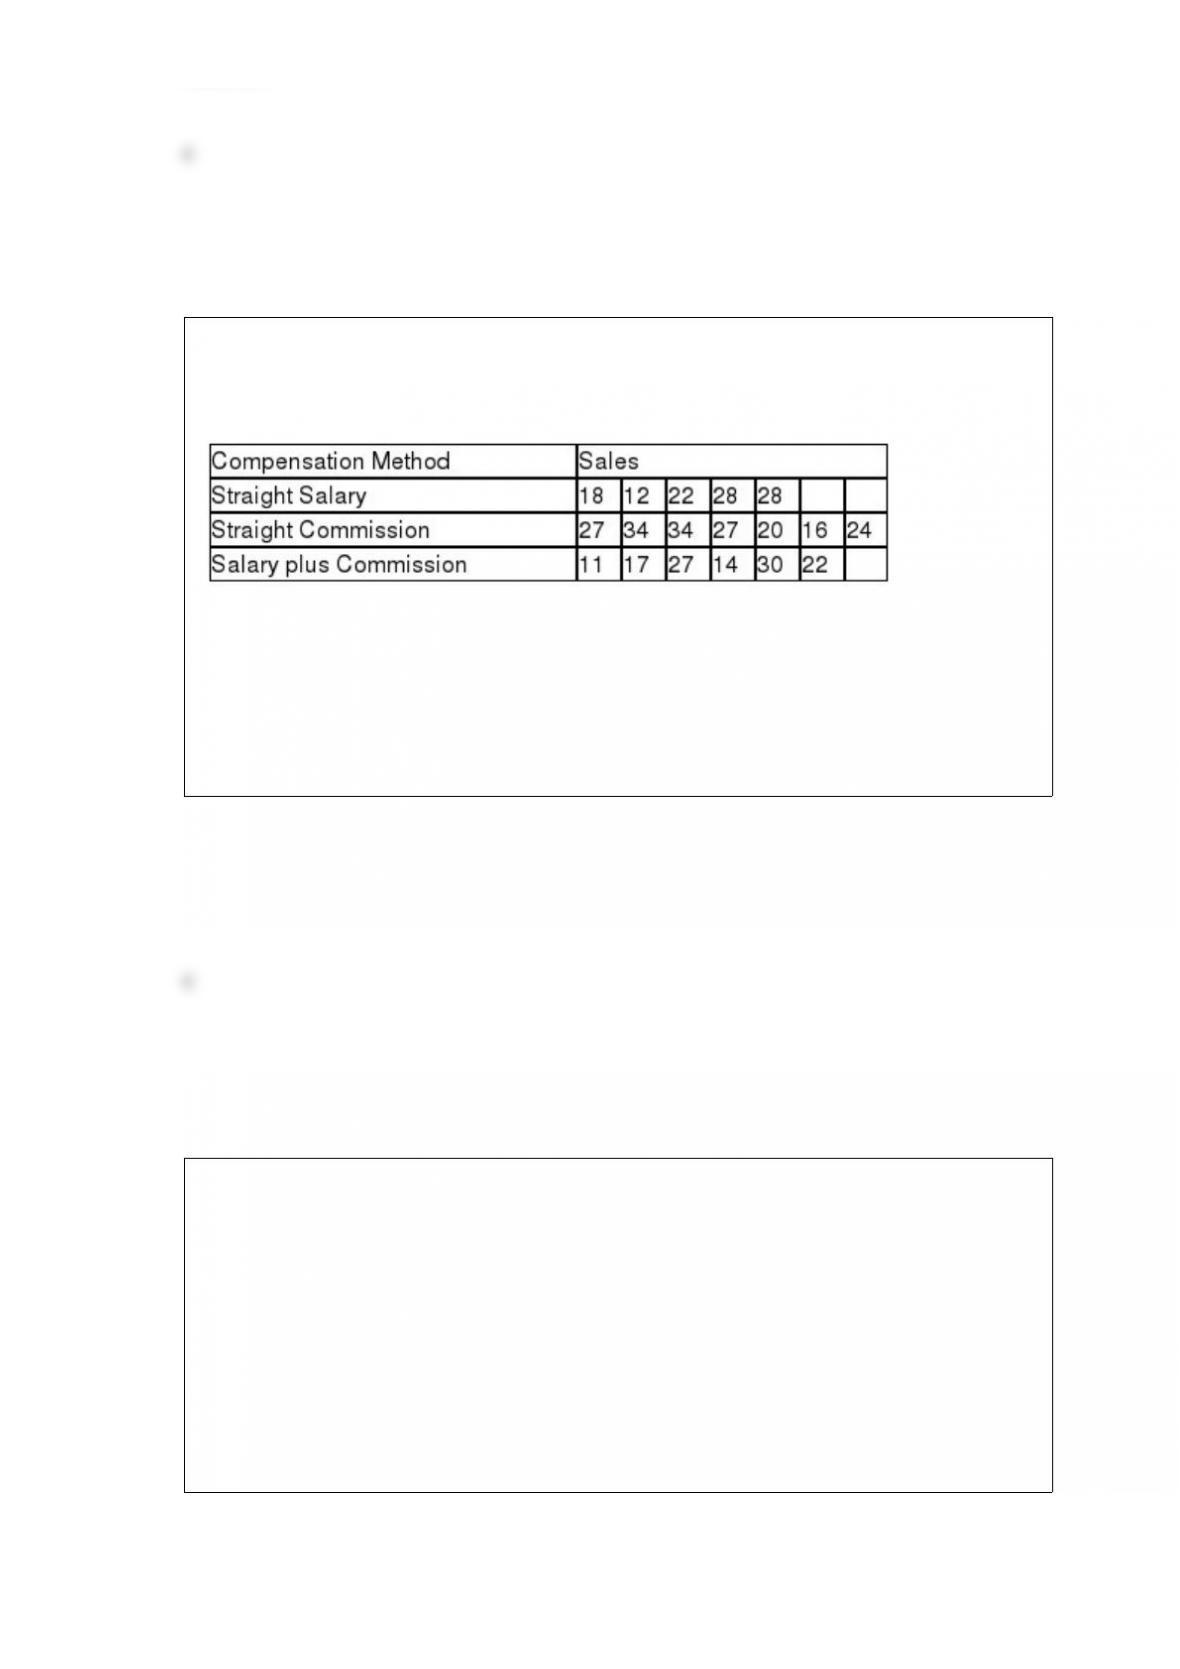
Performance records for 18 salespersons are selected to investigate whether
compensation methods are a significant motivational factor.
A Kruskal-Wallis test performed with
= 0.01 will result in a decision to _____.
a) reject the null hypothesis
b) reject the alternate hypothesis
c) do not reject the null hypothesis
d) do no reject the alternate hypothesis
e) do nothing
A political scientist wants to prove that a candidate is currently carrying more than 60%
of the vote in the state. She has her assistants randomly sample 200 eligible voters in
the state by telephone and only 90 declare that they support her candidate. The observed
zvalue for this problem is _______.
a) -4.33
b) 4.33
c) 0.45
d) -.31
e) 2.33

Pinky Bauer, Chief Financial Officer of Harrison Haulers, Inc., suspects irregularities in
the payroll system, and orders an inspection of “each and every payroll voucher issued
since January 1, 2013.” Pinky is ordering a __________________.
a) statistic from the payroll vouchers
b) census of the payroll vouchers
c) sample of the payroll vouchers
d) sorting of the payroll vouchers
e) parameter of the payroll vouchers
Charles Clayton monitors the daily performance of his investment portfolio by
recording a “+” or a “-“sign to indicate whether the portfolio’s value increased or
decreased from the previous day. His record for the last eighteen business days is “- + +
– – – + – – + + + – + + + + -“. The number of runs in this sample is _________.
a) uncertain
b) four
c) five
d) nine
e) one

A local manufacturing plant randomly selected 200 items from a production run and 9
of them are defective. The proportion of defective items in this sample is a ________
a) parameter
b) sample
c) population
d) statistic
e) frame
The nonparametric counterpart of the t test to compare the means of two related
samples is the _______.
a) chi-square goodness of fit test
b) chi-square test of independence
c) Mann-Whitney U test
d) Wilcoxon test
e) Friedman test
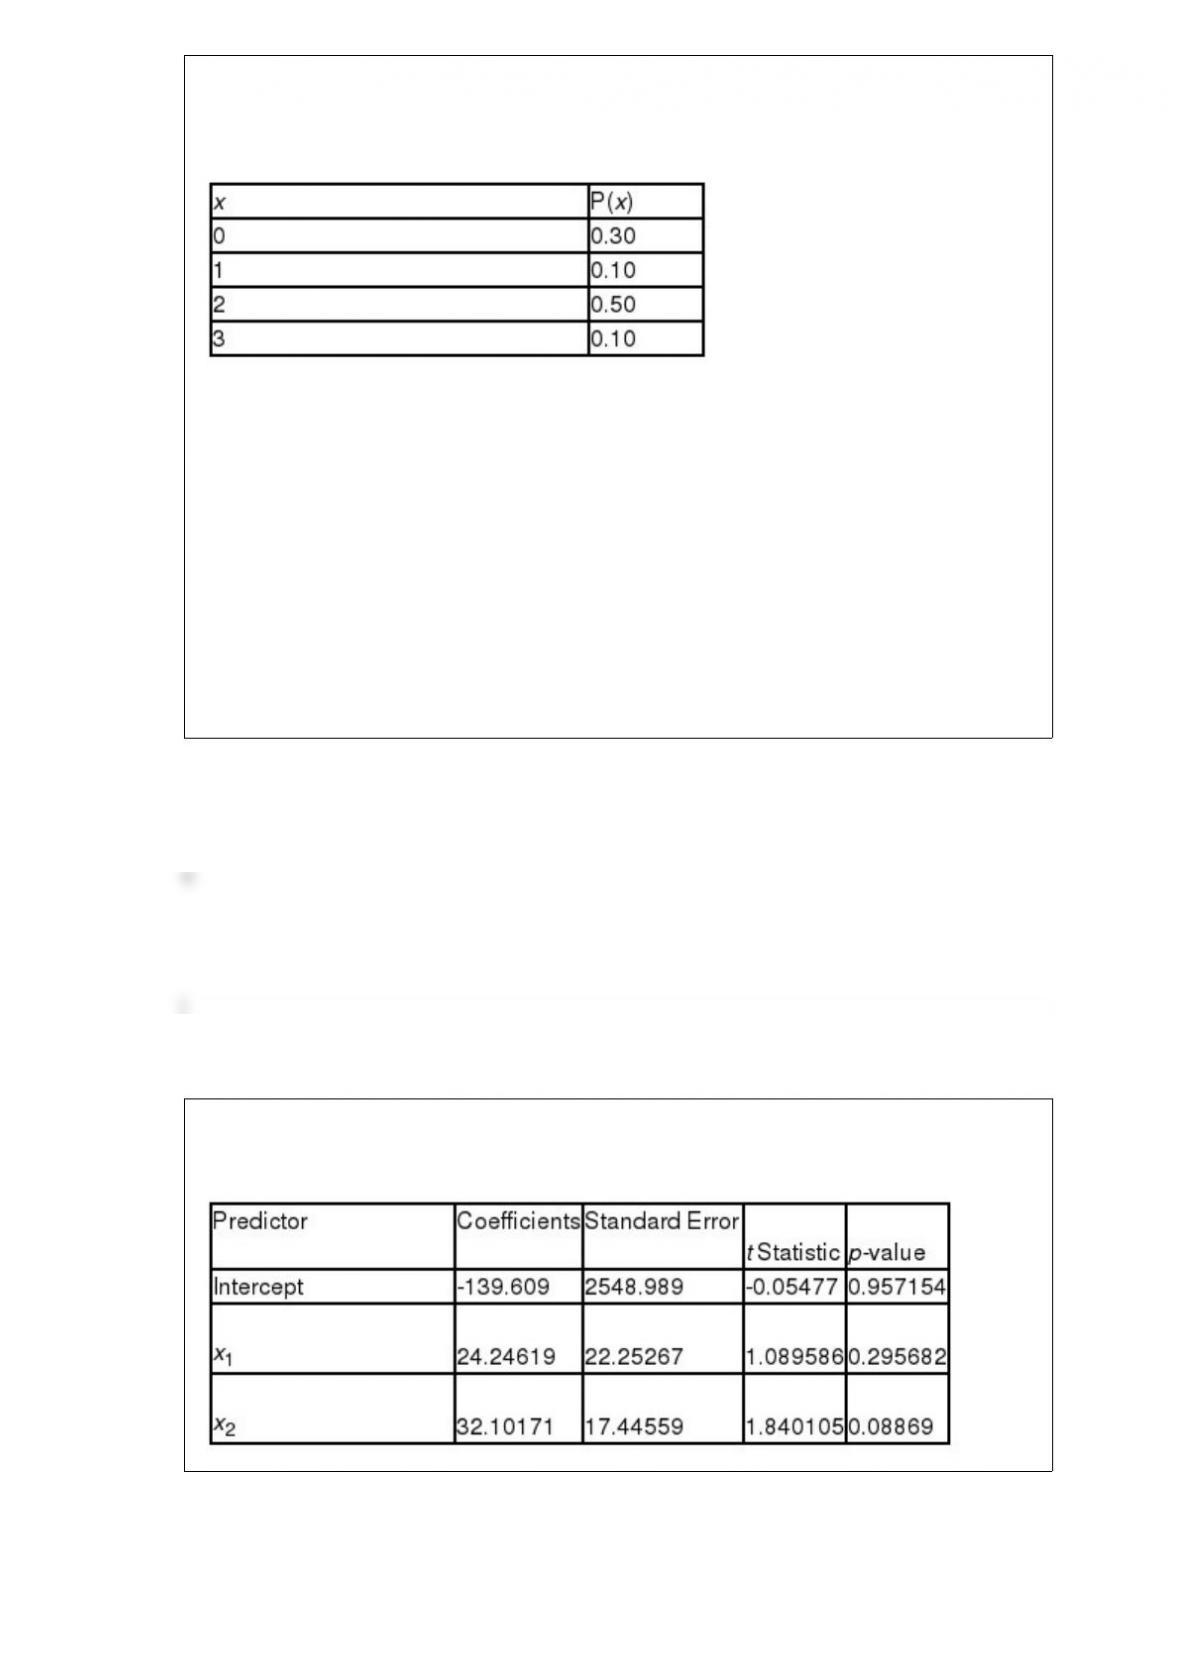
A market research team compiled the following discrete probability distribution on the
number of sodas the average adult drinks each day. In this distribution, x represents the
number of sodas which an adult drinks.
The mean (average) value of x is _______________.
a) 1.4
b) 1.75
c) 2.10
d) 2.55
e) 3.02
A multiple regression analysis produced the following tables.
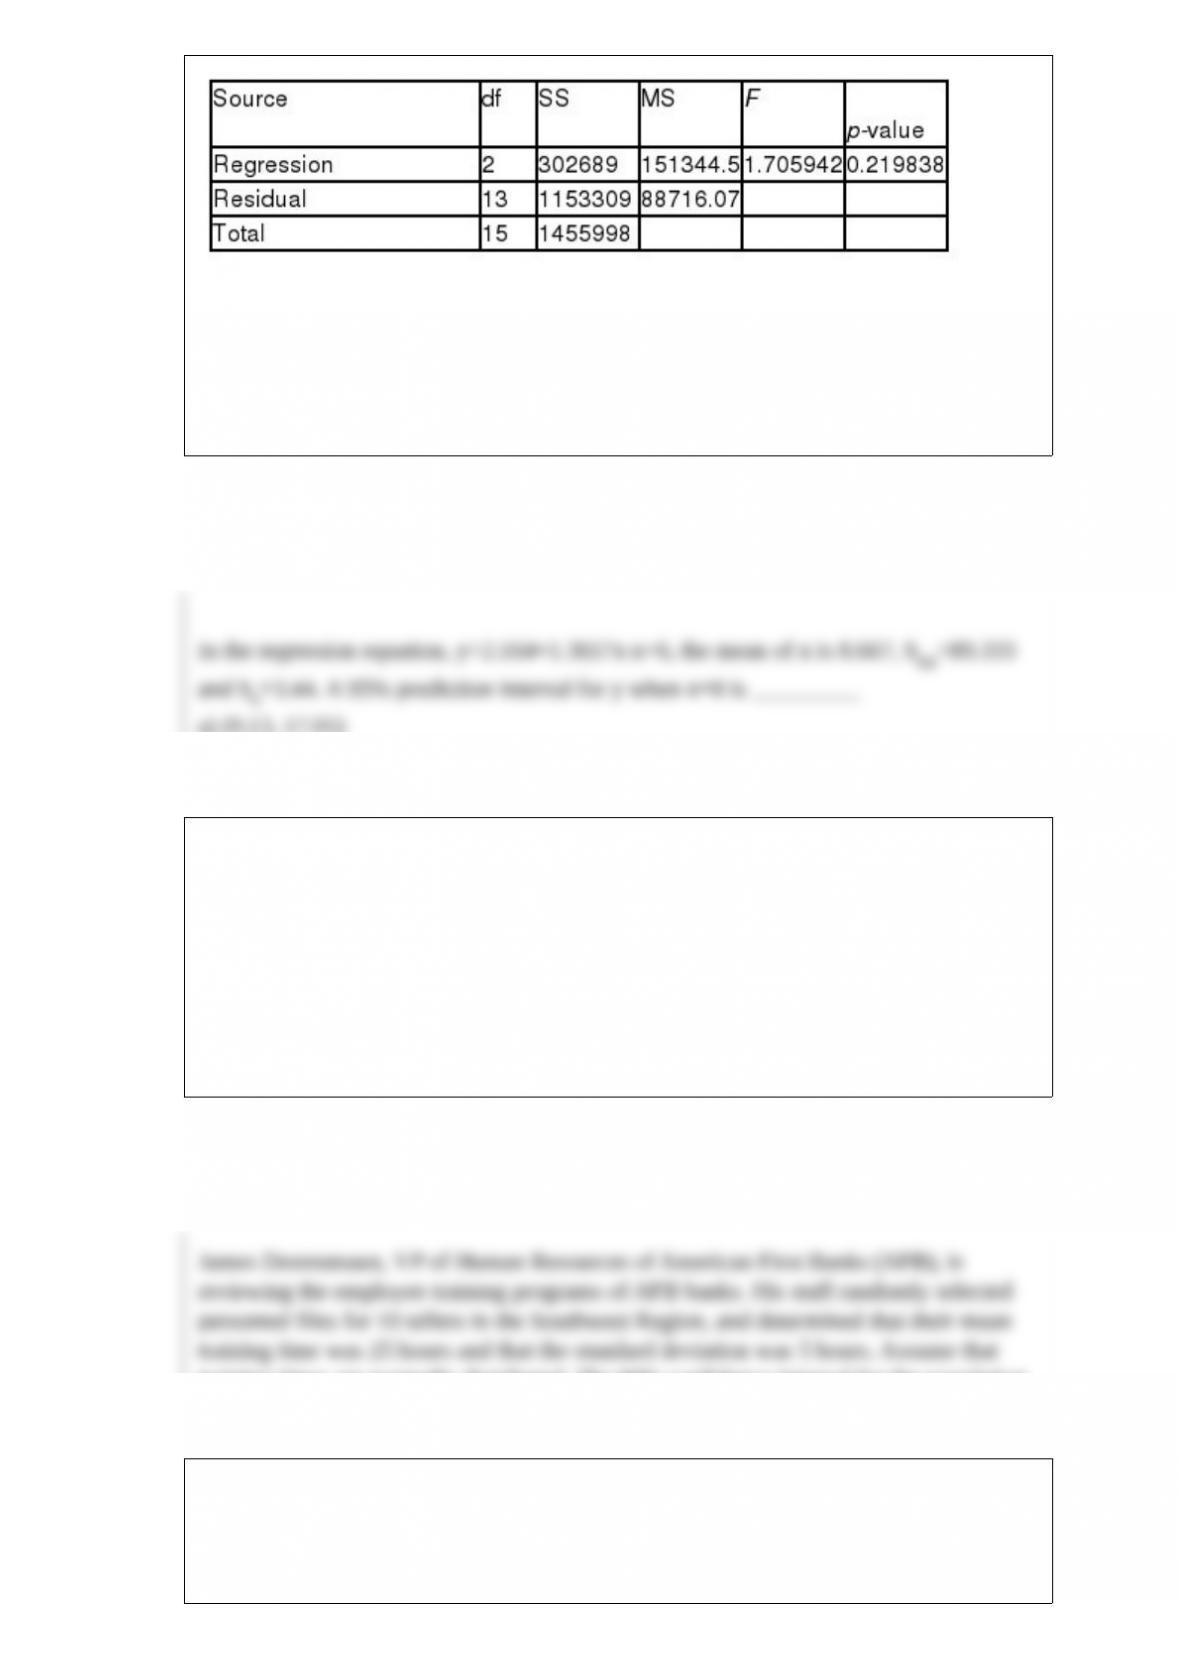
The coefficient of multiple determination is ____________.
a) 0.2079
b) 0. 0860
c) 0.5440
d) 0.7921
e) 0.5000
In the regression equation, y=2.164+1.3657x n=6, the mean of x is 8.667, Sxx=89.333
and Se=3.44. A 95% prediction interval for y when x=8 is _________
a) (9.13, 17.05)
b) (2.75, 23.43)
c) (10.31, 15.86)
d) (3.56, 22.62)
e) (12.09, 14.09)
James Desreumaux, VP of Human Resources of American First Banks (AFB), is
reviewing the employee training programs of AFB banks. His staff randomly selected
personnel files for 10 tellers in the Southwest Region, and determined that their mean
training time was 25 hours and that the standard deviation was 5 hours. Assume that

training times are normally distributed. The 90% confidence interval for the population
variance of training times is ________.
a) 11.83 to 83.33
b) 2.37 to 16.67
c) 2.66 to 13.51
d) 13.30 to 67.67
e) 15.00 to 68.00
Maureen McIlvoy, owner and CEO of a mail order business for wind surfing equipment
and supplies, is reviewing the order filling operations at her warehouses. Her goal is
100% of orders shipped within 24 hours. In previous years, neither warehouse has
achieved the goal, but the East Coast Warehouse has consistently out-performed the
West Coast Warehouse. Her staff randomly selected 200 orders from the West Coast
Warehouse (population 1) and 400 orders from the East Coast Warehouse (population
2), and reports that 190 of the West Coast Orders were shipped within 24 hours, and the
East Coast Warehouse shipped 356 orders within 24 hours. Assuming
= 0.05, the
observed zvalue is ___________________.
a) -3.15
b) 2.42
c) 1.53
d) 0.95
e) 1.05
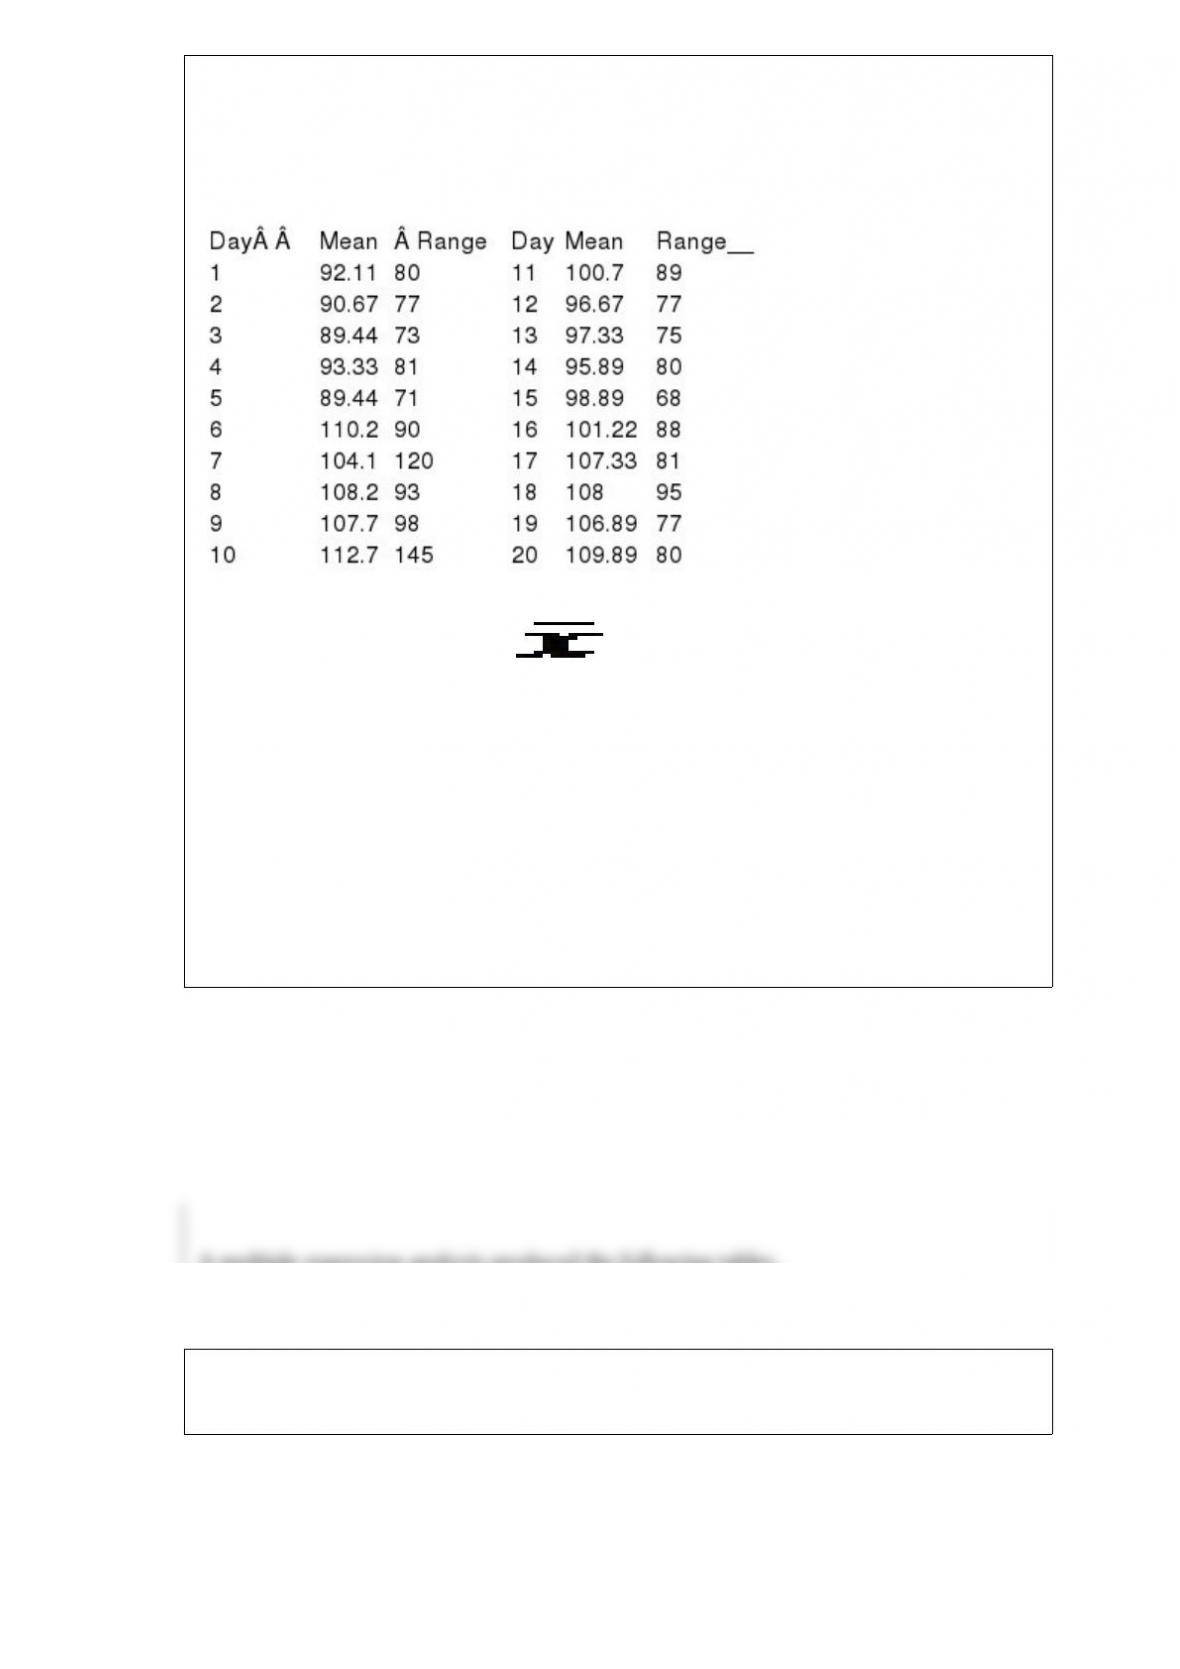
You are conducting a study on the blood glucose levels of 9 patients who are on strict
diets and exercise routines. To monitor the mean and range of the blood glucose levels
of your patients, you take a blood glucose reading every day for each patient for 20
days. The results are shown below.
The lower control limit for your chart is ________.
a) 89.44
b) 92.11
c) 73
d) 71.75
e) 60.5
A multiple regression analysis produced the following tables.
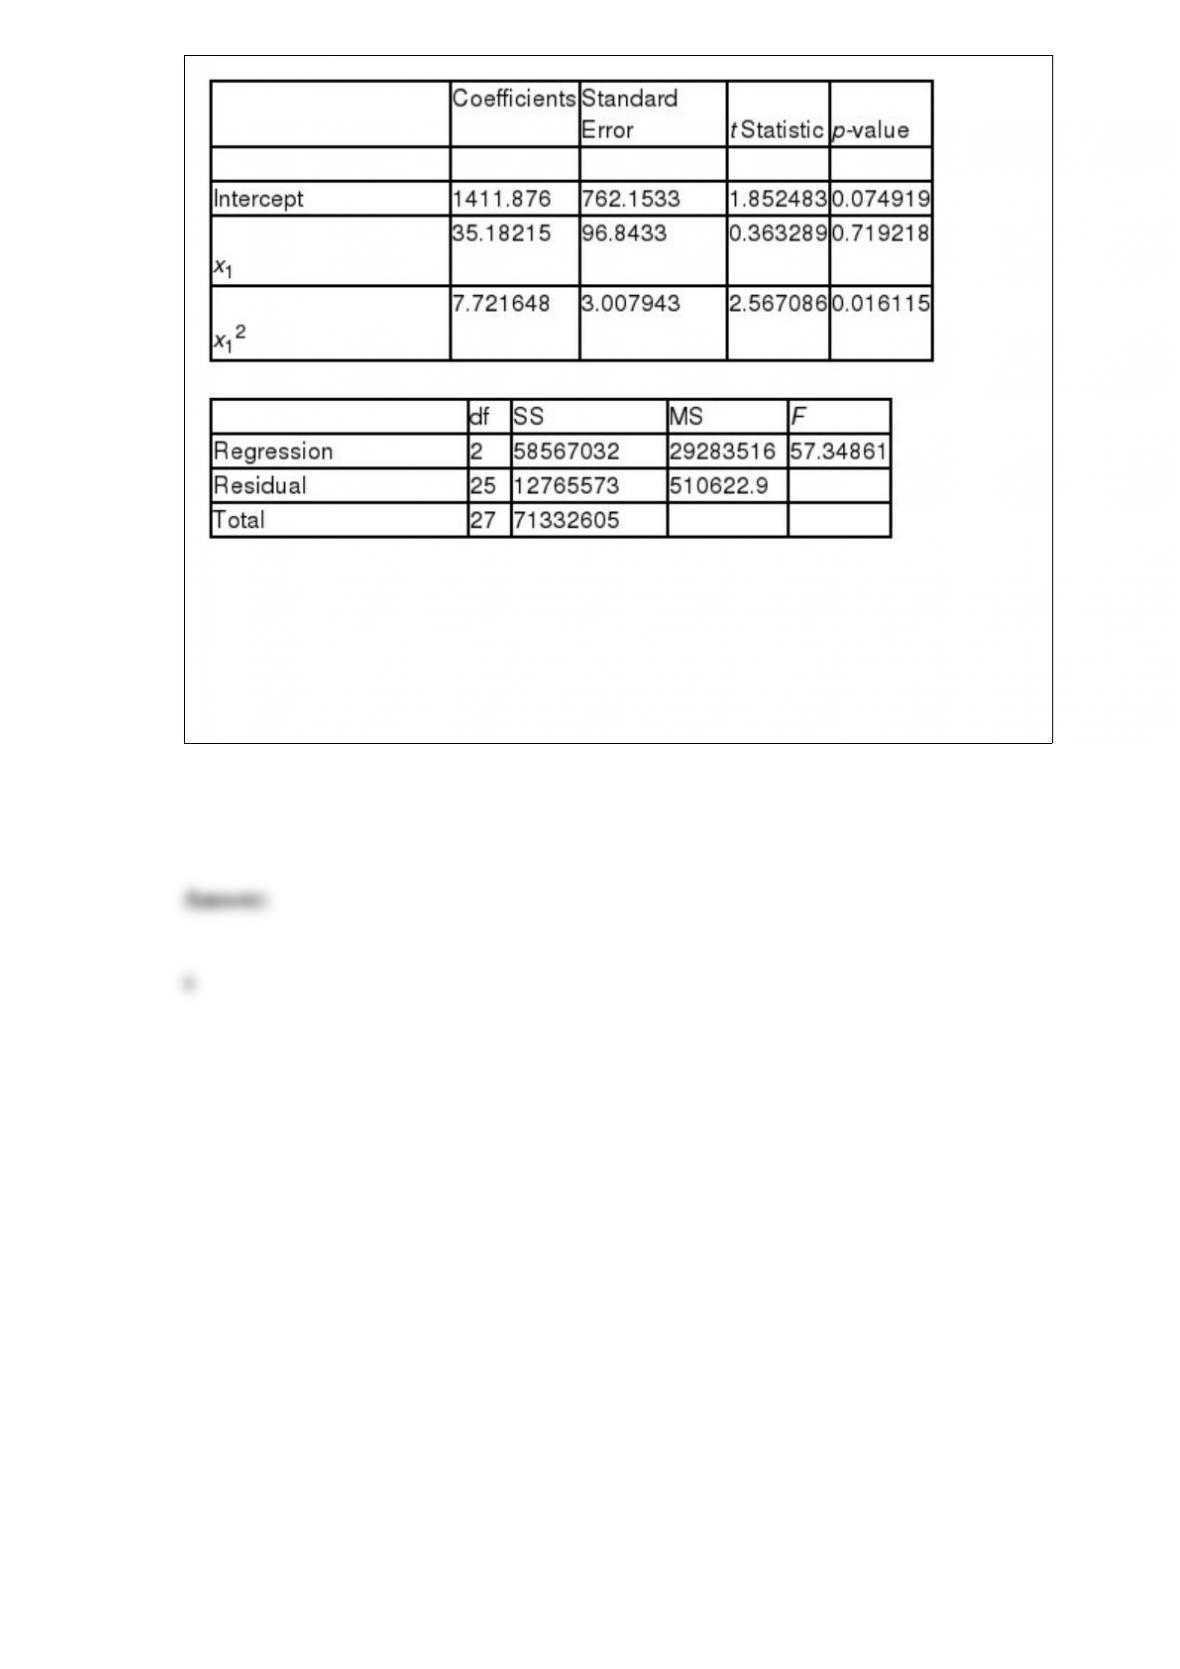
The sample size for this analysis is ____________.
a) 28
b) 25
c) 30
d) 27
e) 2