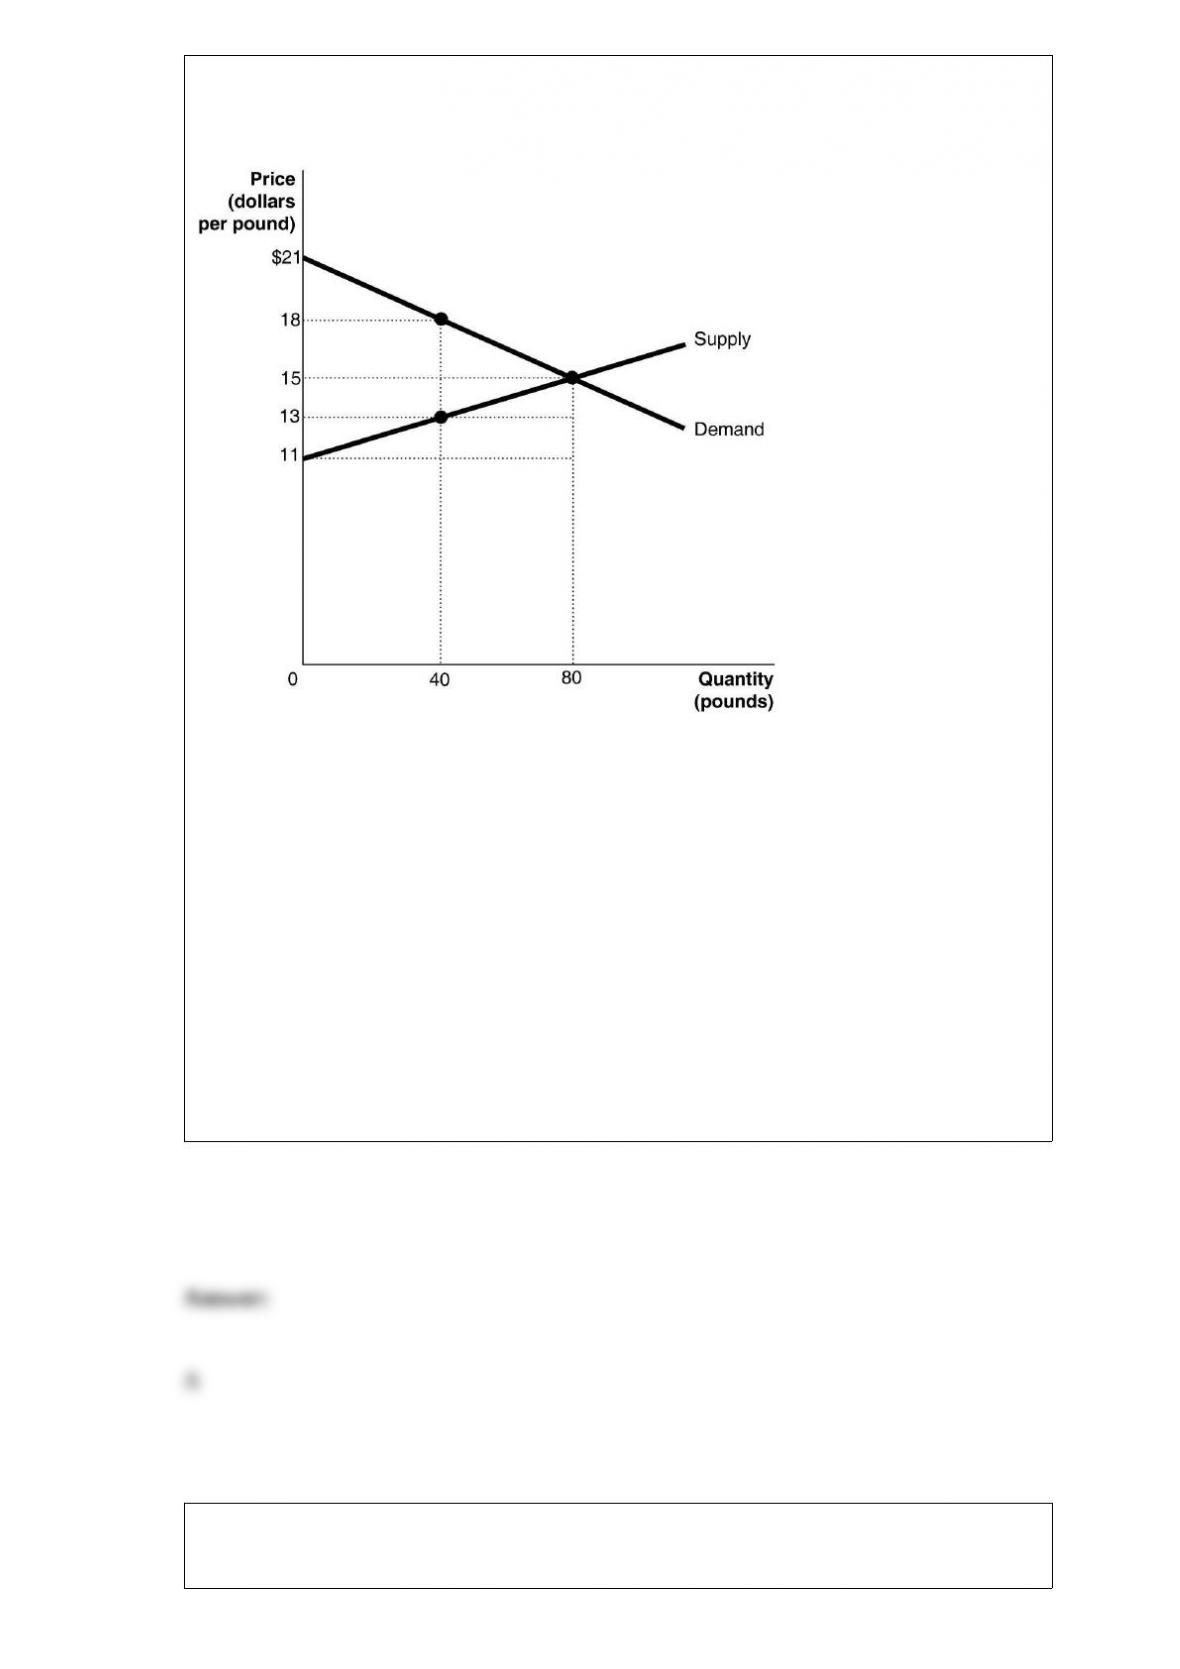
Figure 4-3
Figure 4-3 shows the market for tiger shrimp. The market is initially in equilibrium at a
price of $15 and a quantity of 80. Now suppose producers decide to cut output to 40in
order to raise the price to $18.
Refer to Figure 4-3. At a price of $18 consumers are willing to buy 40 pounds of tiger
shrimp. Is this an economically efficient quantity?
A) No, the marginal benefit of the 40th unit exceeds the marginal cost of that 40th unit.
B) Yes, otherwise consumers would not buy 40 units.
C) Yes, because $18 shows what consumers are willing to pay for the product.
D) No, the marginal cost of the 40th unit exceeds the marginal benefit of the 40th unit.
Table 15-3
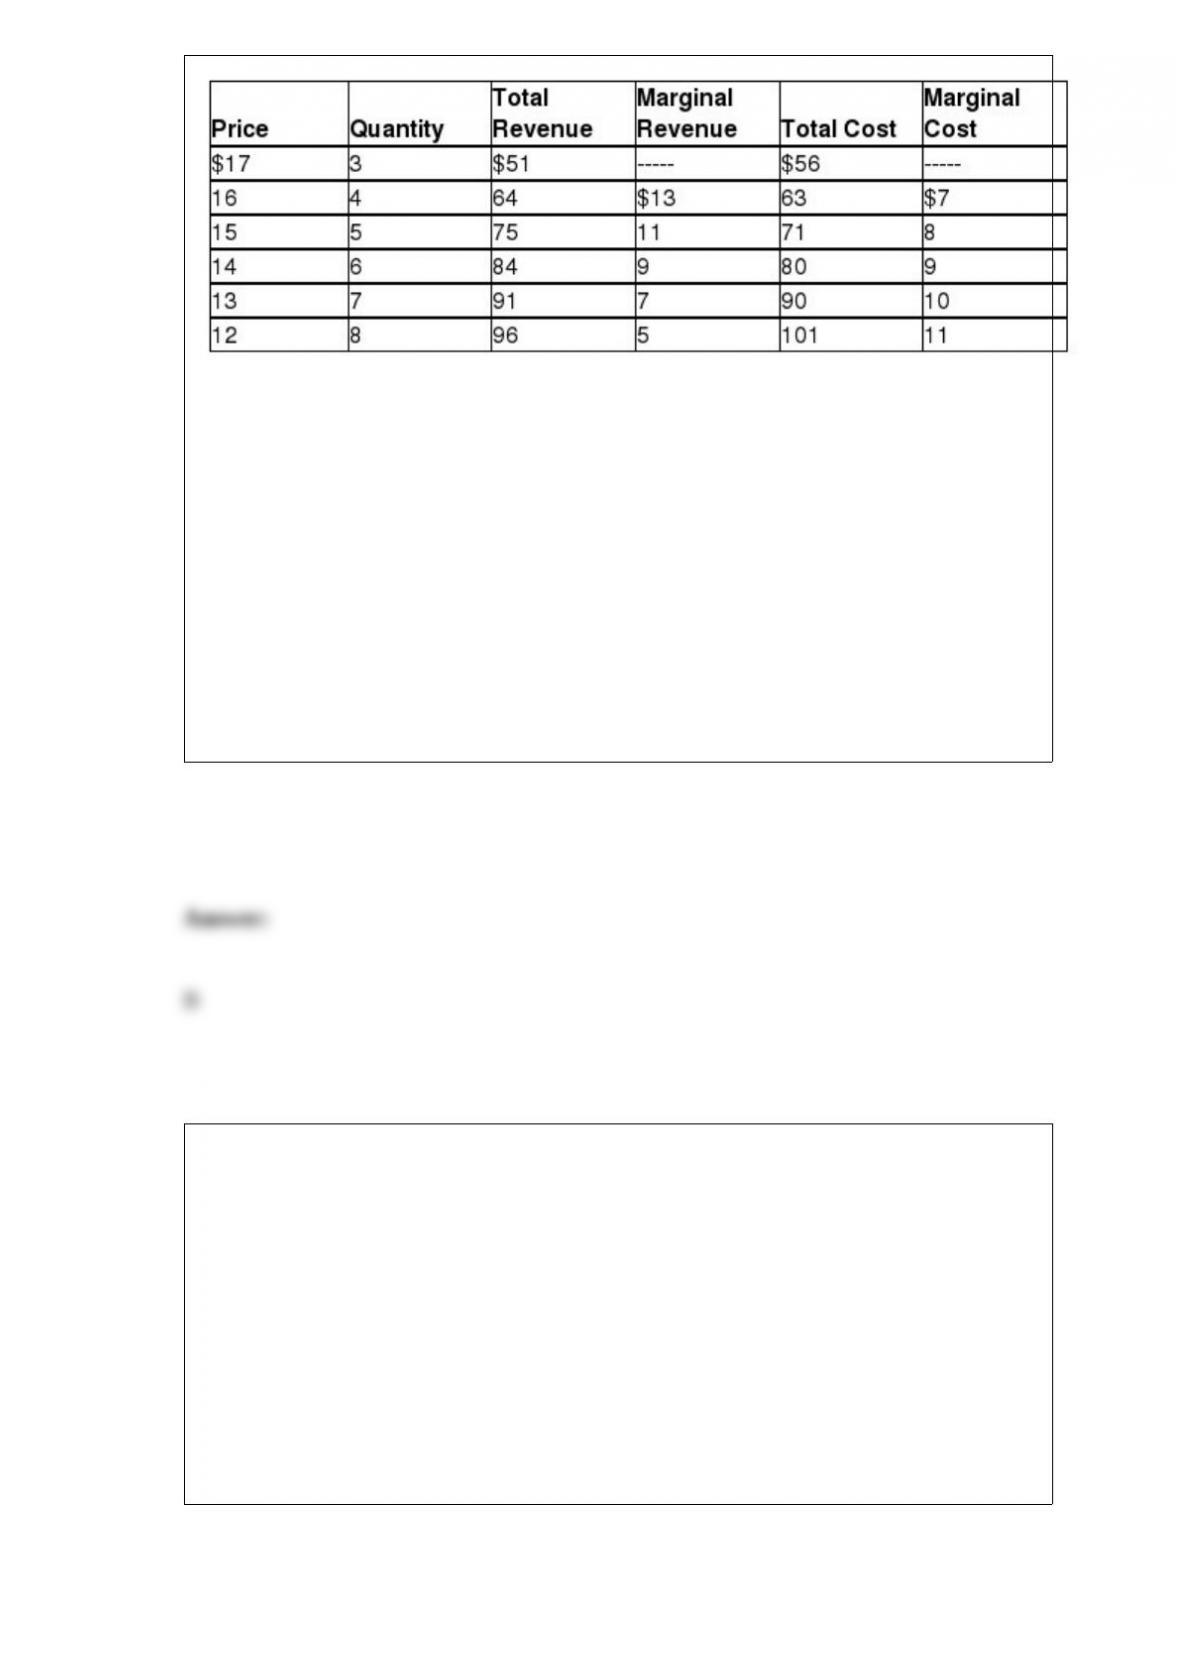
Assume Table 15-3 gives the monthly demand and costs for subscriptions to basic cable
for Comcast, a cable television monopoly in Philadelphia.
Refer to Table 15-3. If Comcast wants to maximize its profits, what price (P) should it
charge and how many cable subscriptions per month (Q) should it sell?
A) P = $12; Q = 8
B) P = $14; Q = 6
C) P = $16; Q = 4
D) P = $15: Q = 5
Suppose the value of the price elasticity of demand is -3. What does this mean?
A) A 1 percent increase in the price of the good causes quantity demanded to increase
by 3 percent.
B) A 1 percent increase in the price of the good causes quantity demanded to decrease
by 3 percent.
C) A 3 percent increase in the price of the good causes quantity demanded to decrease
by 1 percent.
D) A $1 increase in price causes quantity demanded to fall by 3 units.

If a stock’s dividend is expected to grow at a constant rate of 6 percent in the future and
it has just paid a dividend of $3.00 per share, and you have an alternative investment of
equal risk that will earn a 9 percent rate of return, what would you be willing to pay per
share for this stock?
A) $9
B) $20
C) $45
D) $100
Assume that the tuna fishing industry is perfectly competitive. Which of the following
best characterizes the industry if, as demand for tuna increases, fishing boats have to go
farther into the ocean to harvest tuna?
A) a constant-cost industry
B) an increasing-cost industry
C) a decreasing-cost industry
D) a fixed-cost industry

To maintain a monopoly, a firm must have
A) a perfectly inelastic demand.
B) an insurmountable barrier to entry.
C) marginal revenue equal to demand.
D) few competitors.
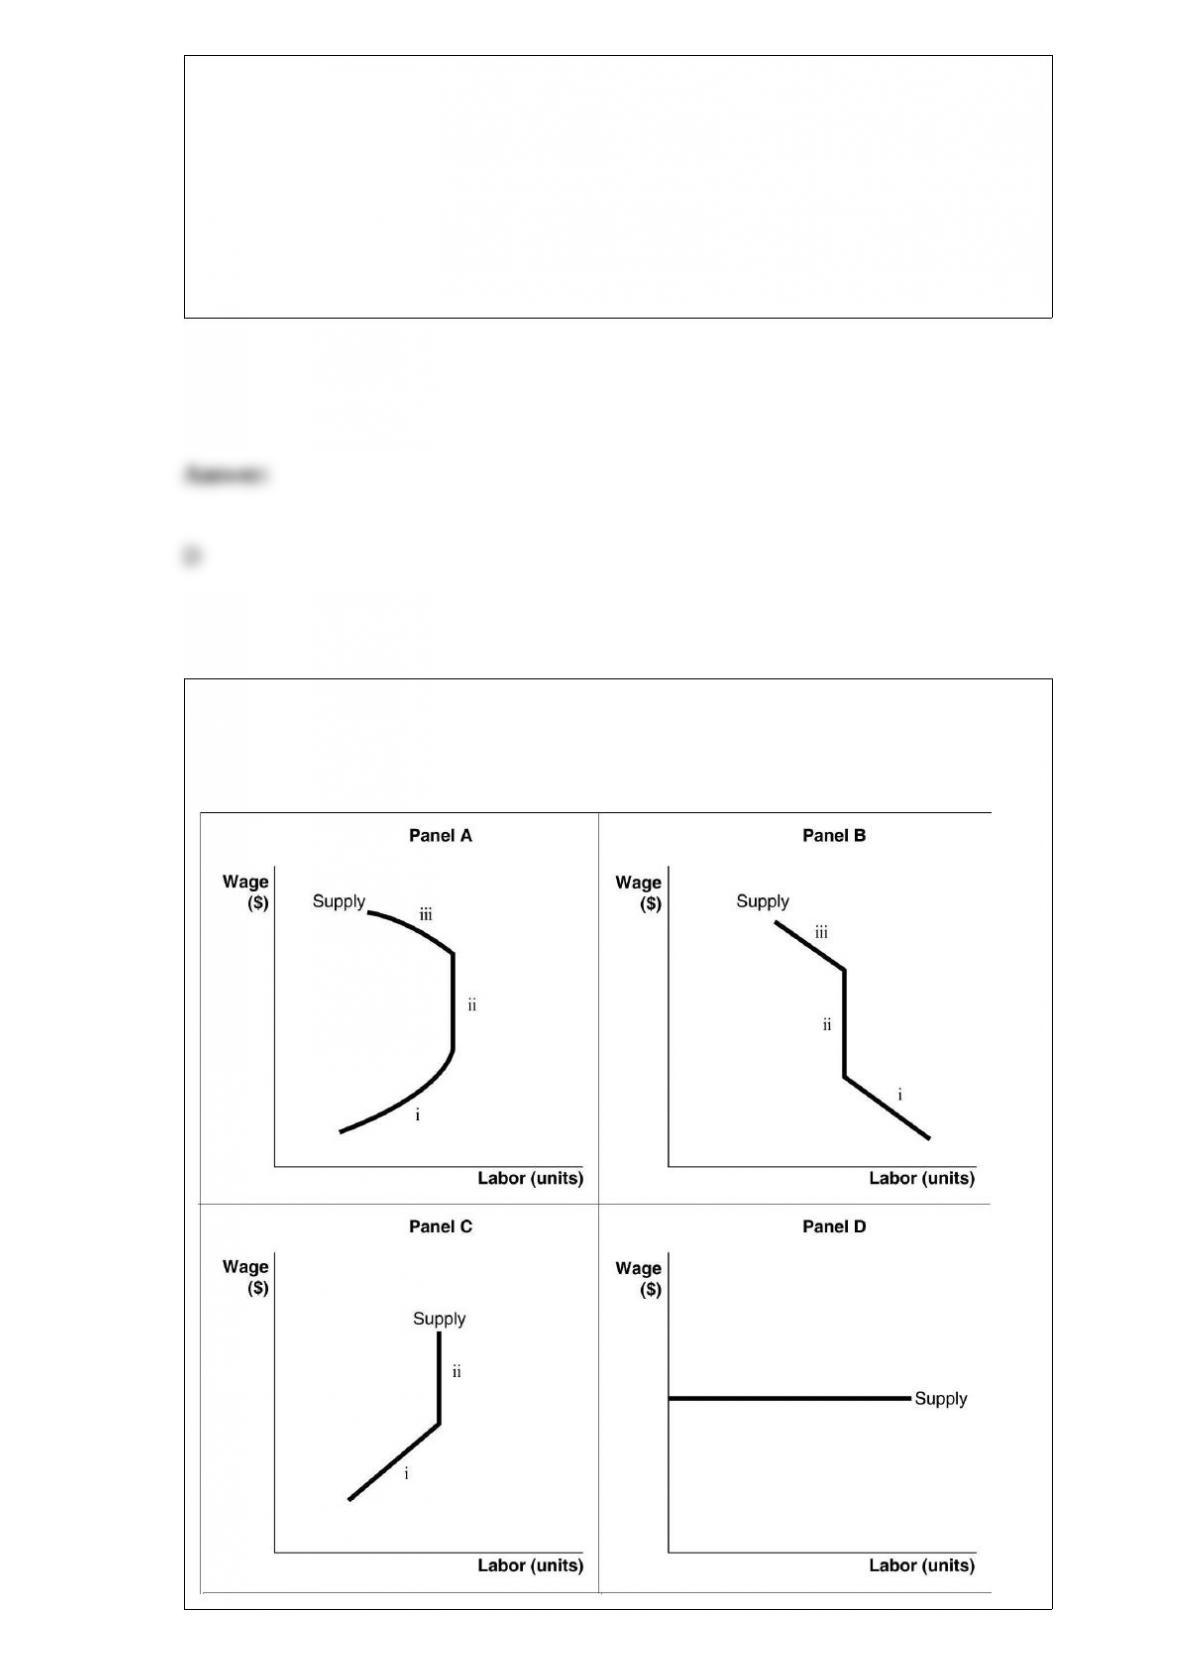
Figure 17-3
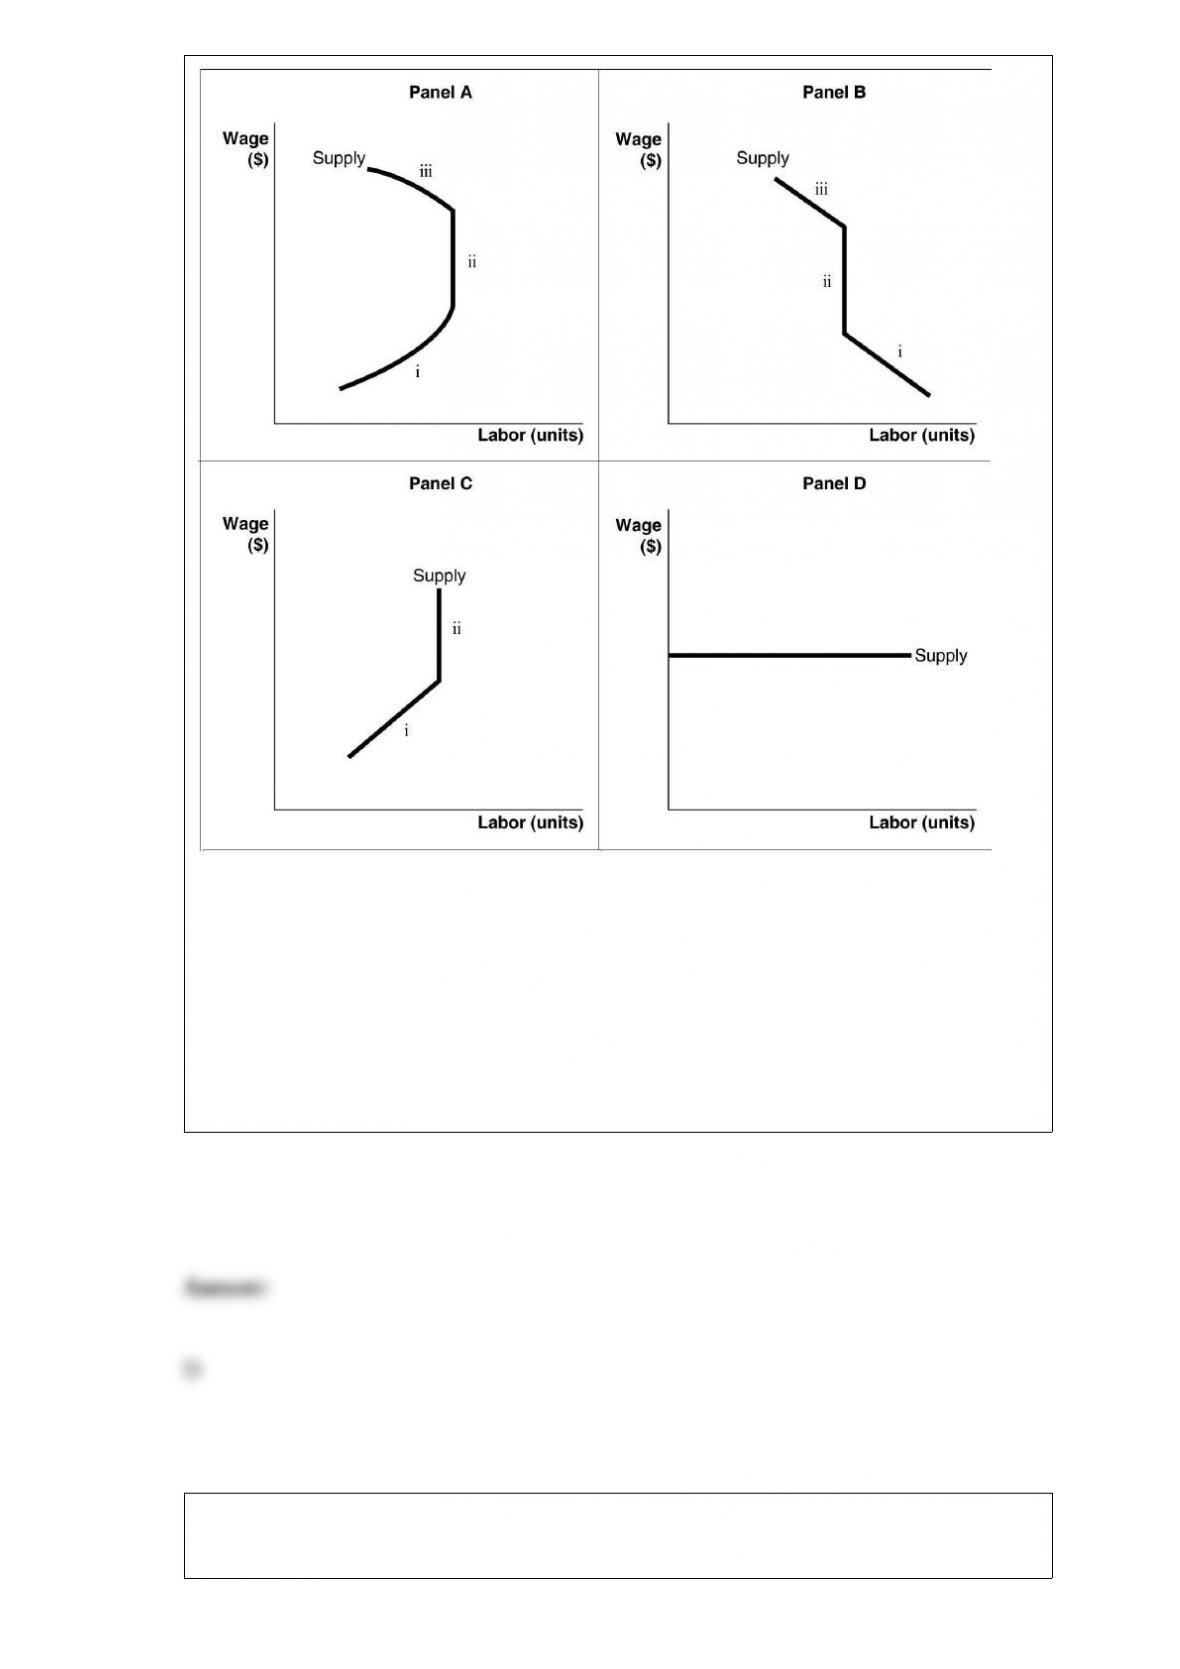
Refer to Figure 17-3. In Panel A, at high wages (segment iii)
A) the price of leisure is rising relative to the price of labor.
B) the price of leisure is falling relative to the price of labor.
C) laborers work more as wages increase.
D) labor suppliers take more leisure as wages increase.
Figure 5-15
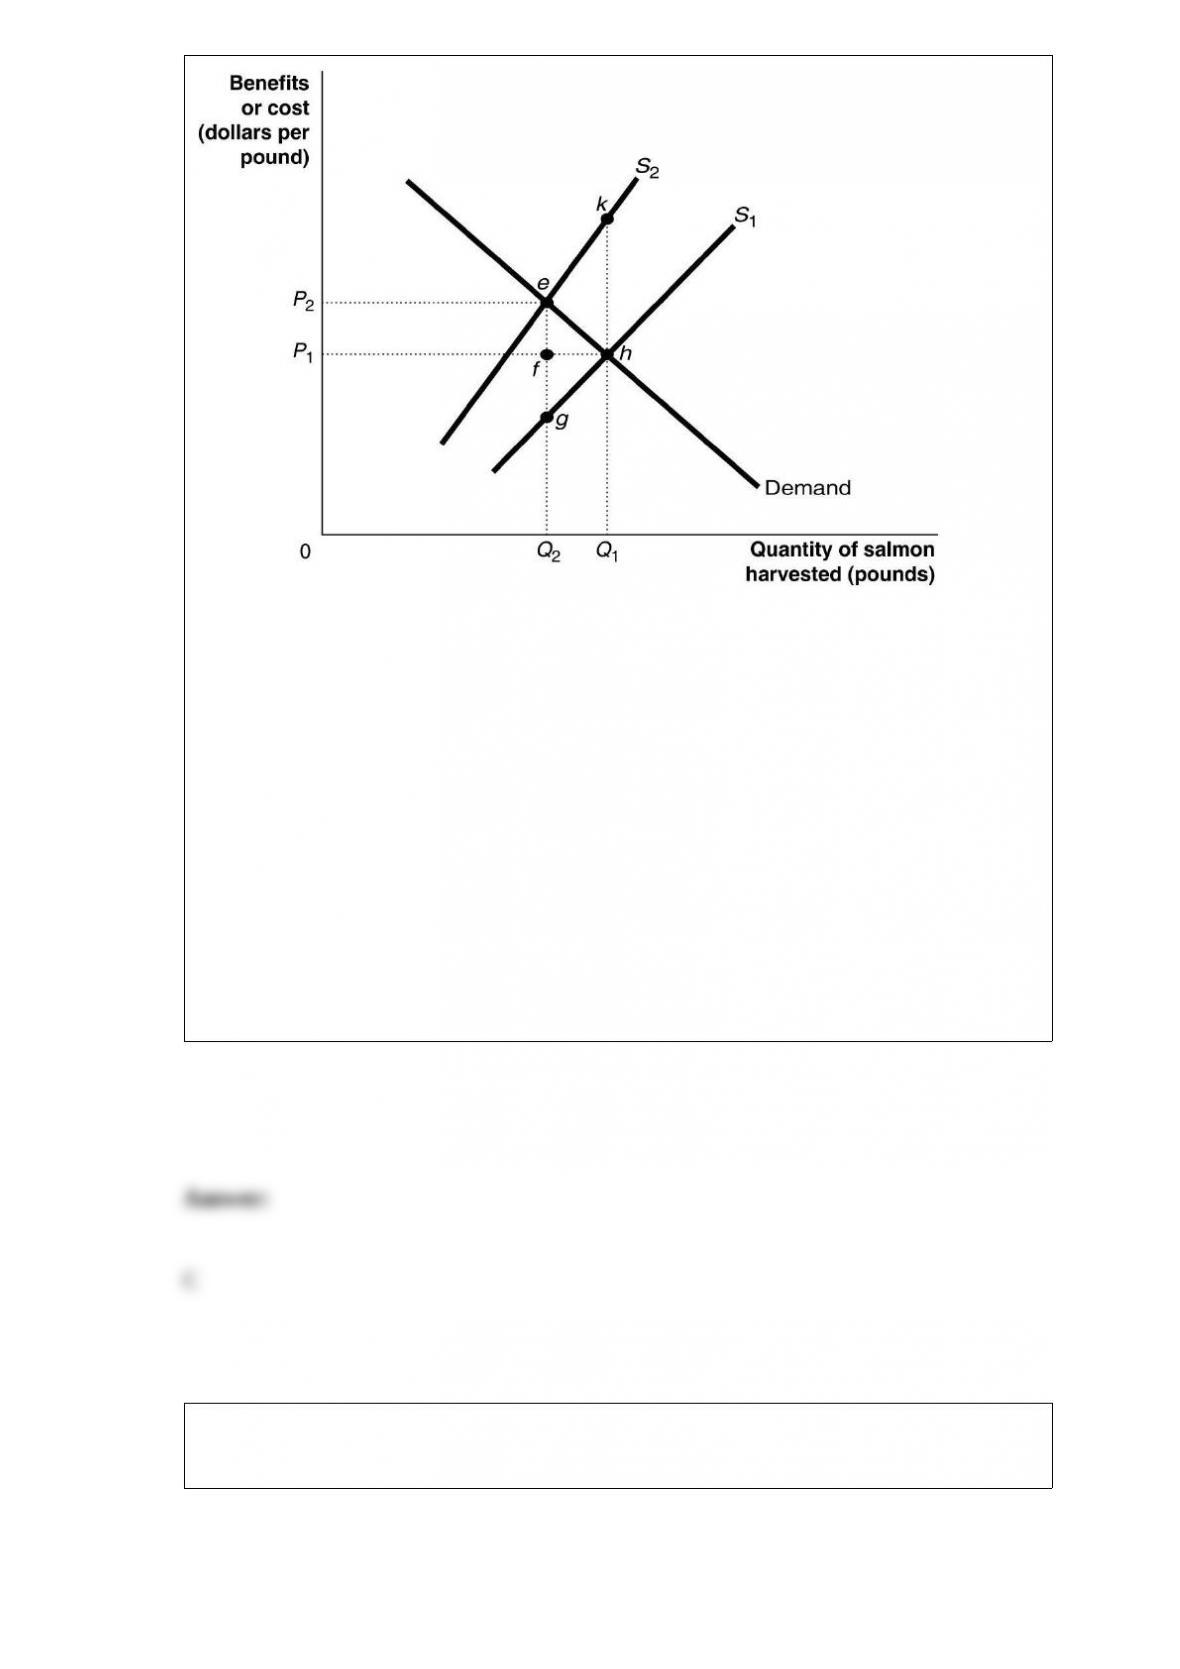
Figure 5-15 shows the market for Atlantic salmon, a common resource. The current
market equilibrium output of Q1 is not the economically efficient output. The
economically efficient output is Q2.
Refer to Figure 5-15. The current market equilibrium output is partly the result of
overfishing. In that case, what does S1 represent?
A) the private marginal benefit of harvesting salmon
B) the social marginal benefit of harvesting salmon
C) the private marginal cost of harvesting salmon
D) the social marginal cost of harvesting salmon
Figure 15-2
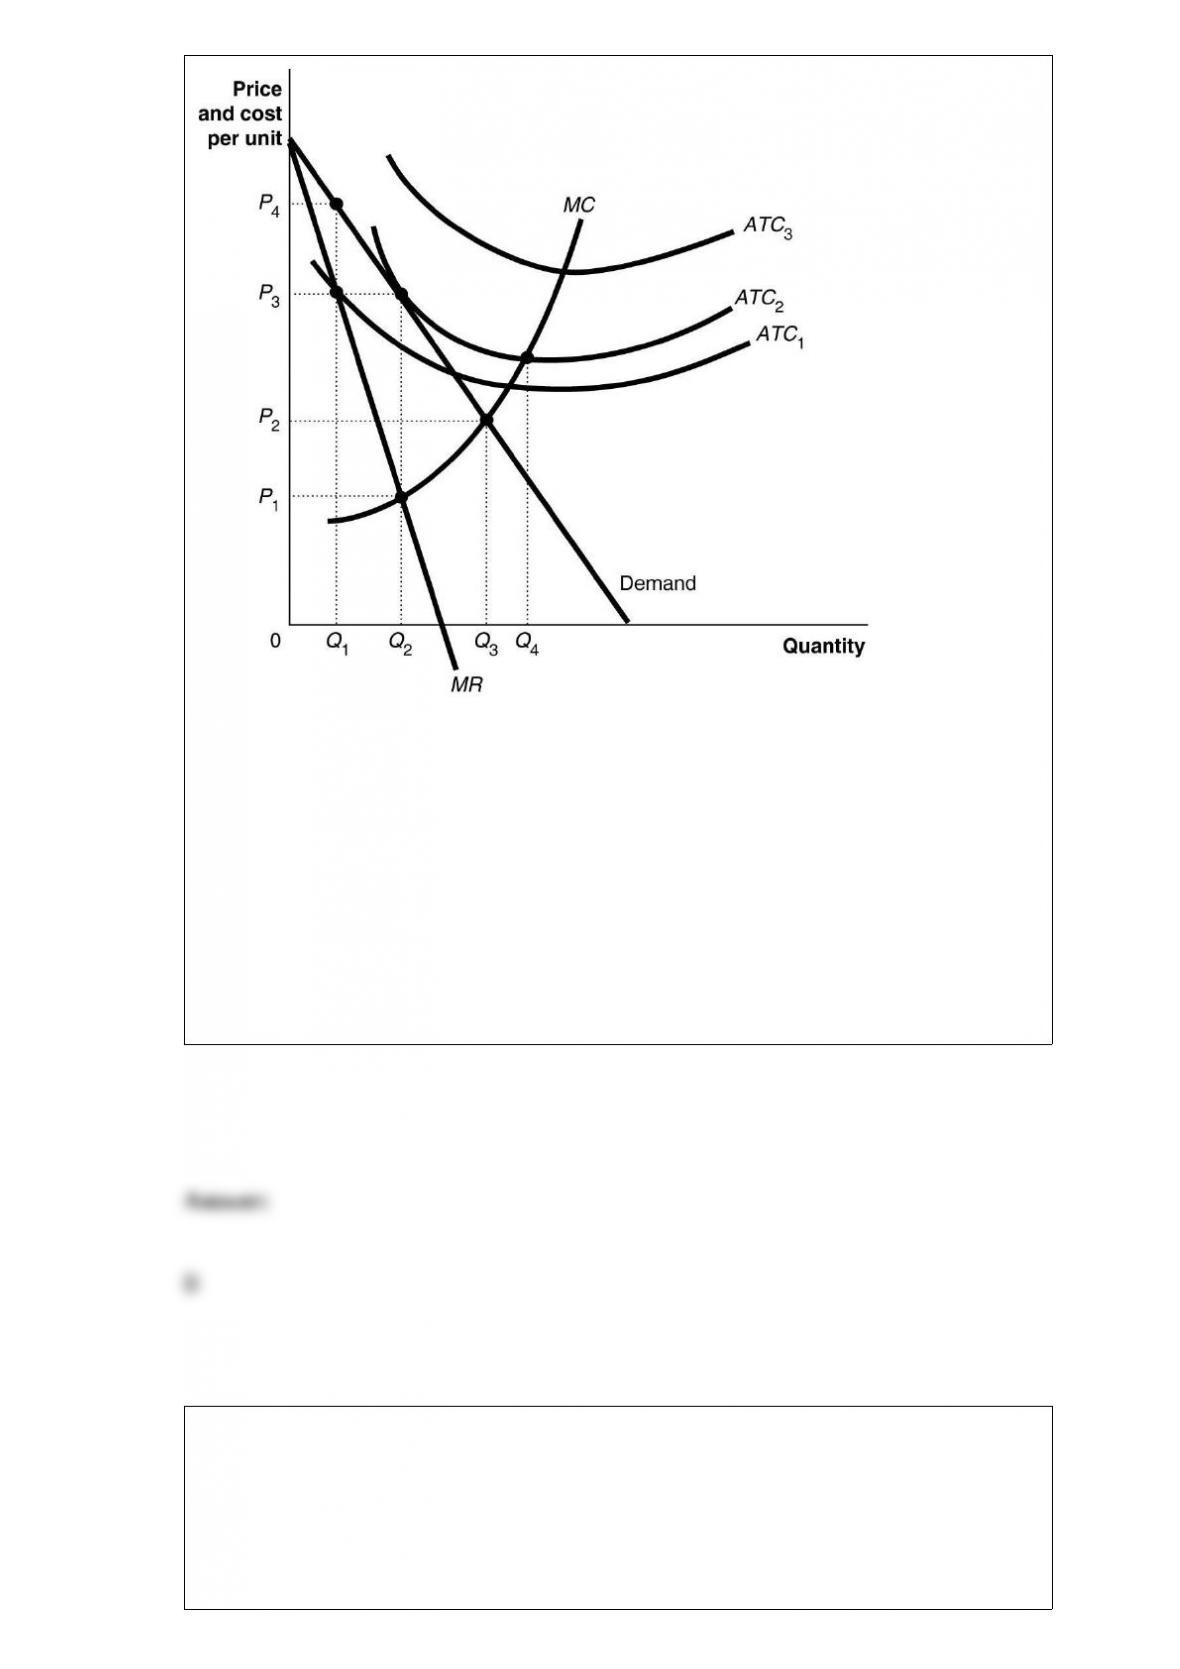
Figure 15-2 above shows the demand and cost curves facing a monopolist.
Refer to Figure 15-2. If the firm’s average total cost curve is ATC2, the firm will
A) suffer a loss.
B) break even.
C) make a profit.
D) face competition.
Which of the following would cause both the equilibrium price and equilibrium
quantity of cotton (assume that cotton is a normal good) to increase?
A) an increase in consumer income
B) a drought that sharply reduces cotton output

C) a decrease in consumer income
D) unusually good weather that results in a bumper crop of cotton
How would the elimination of a sales tax affect the market for a product that had been
subject to the tax?
A) The demand for the product would rise and the equilibrium price would fall by the
amount of the tax.
B) The equilibrium price for the product would fall by less than the amount of the tax.
C) The reduction in government revenue from the tax would be made up by an increase
in property taxes.
D) The supply of the product would become more elastic.
Which of the following describes the difference between the market demand curve for a
perfectly competitive industry and the demand curve for a firm in this industry?
A) The market demand curve is a horizontal line; the firm’s demand curve is downward
sloping.
B) The market demand curve is downward sloping; the firm’s demand curve is a
vertical line.

C) The market demand curve can not have a constant slope; the firm’s demand curve
has a slope equal to zero.
D) The market demand curve is downward sloping; the firm’s demand curve is a
horizontal line.
If, as a perfectly competitive industry expands, it can supply larger quantities only at a
higher long-run equilibrium price, it is
A) a constant-cost industry.
B) an increasing-cost industry.
C) a decreasing-cost industry.
D) a fixed-cost industry.
Figure 12-2

Refer to Figure 12-2. The firm breaks even at an output level of
A) Q1 units.
B) Q2 units.
C) Q3 units.
D) Q4 units.
The costs in time and other resources that parties incur in the process of facilitating an
exchange of goods and services are called
A) enforcement costs.
B) implicit costs.
C) explicit costs.
D) transactions costs.

Assume that the four-firm concentration ratio in an industry is 85 percent. Which of the
following statements uses one of the five competitive forces to argue that this industry
may be more competitive than its concentration ratio suggests?
A) The high concentration may be due to patents owned by the largest firms but
competition will increase when patent rights expire.
B) If high concentration is the result of large firms owning much of the available supply
of a key input, the industry will become more competitive when new sources of the
input are discovered by other firms.
C) Even though concentration is high, large firms in the industry may act competitively
by spending large sums on advertising.
D) The threat of entry into this industry can cause firms in the industry to lower their
prices and profits in order to deter entry.
Which of the following would shift the supply curve for MP3 players to the left?
A) an increase in the price of an input used to produce MP3 players
B) a decrease in consumer tastes for MP3 players
C) an increase in the number of firms that produce MP3 players
D) an increase in the productivity of the workers who produce MP3 players
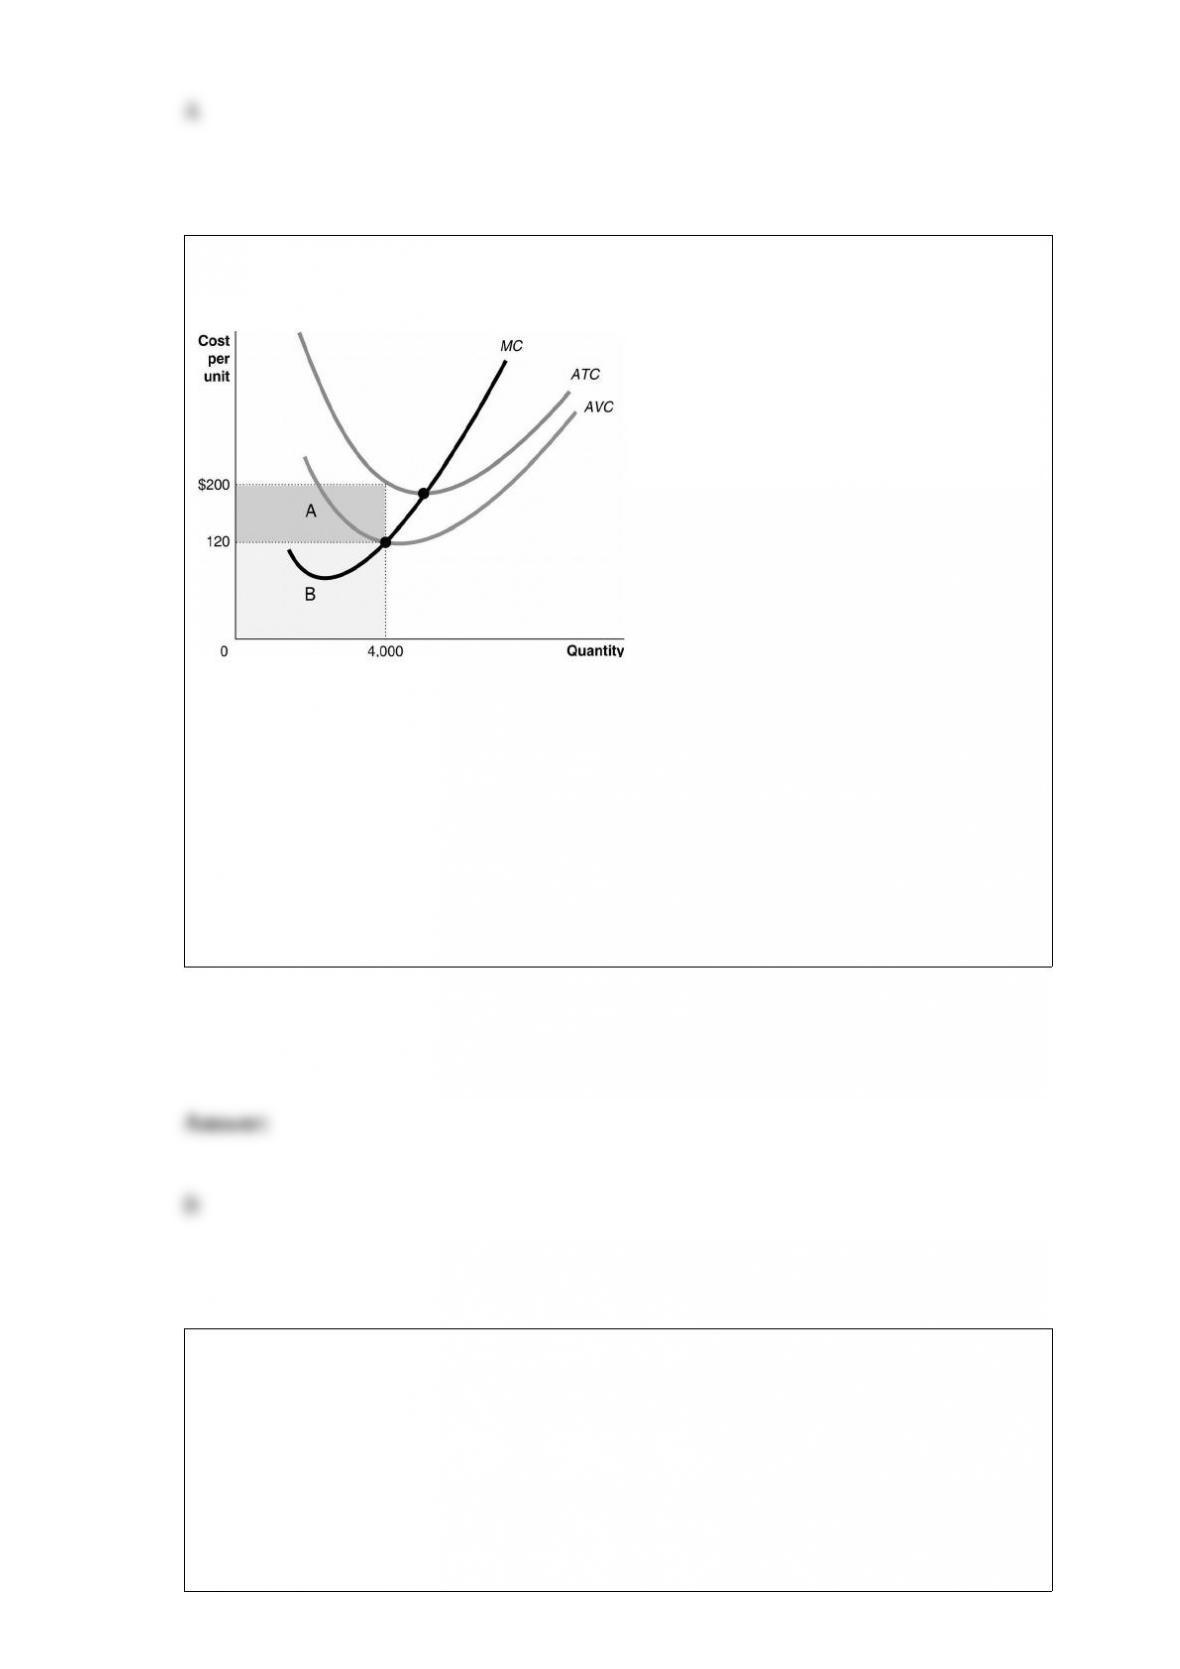
Figure 12-8
Refer to Figure 12-8. Suppose the firm produces 4,000 units. What does the shaded
area labeled B represent?
A) the firm’s economic loss
B) total variable cost
C) average variable cost
D) total fixed cost
Reporters from the Wall Street Journal found that the office supply store Staples
charged different prices for the same product to different online customers based
primarily on
A) the age of the customer.
B) how close the customer’s zip code was to competitors’ stores.

C) the gender of the customer.
D) how many times the customer had looked up the product on its Website.
Experience with patents in the pharmaceutical industry shows that when patents on
drugs expire
A) most patients will continue to buy the drugs from the same firms because their
doctors recommend they buy brand-name drugs.
B) prices remain high without patent protection because of a lack of competition. Firms
that are not granted patents cannot compete with firms that are granted patents.
C) other firms are free to produce chemically identical drugs. Competition reduces the
profits that had been earned by the firms that received patents.
D) firms will find ways to obtain additional patent protection – often by making
cosmetic changes in drugs that were patented – so that they can continue charging high
prices.
Figure 18-3
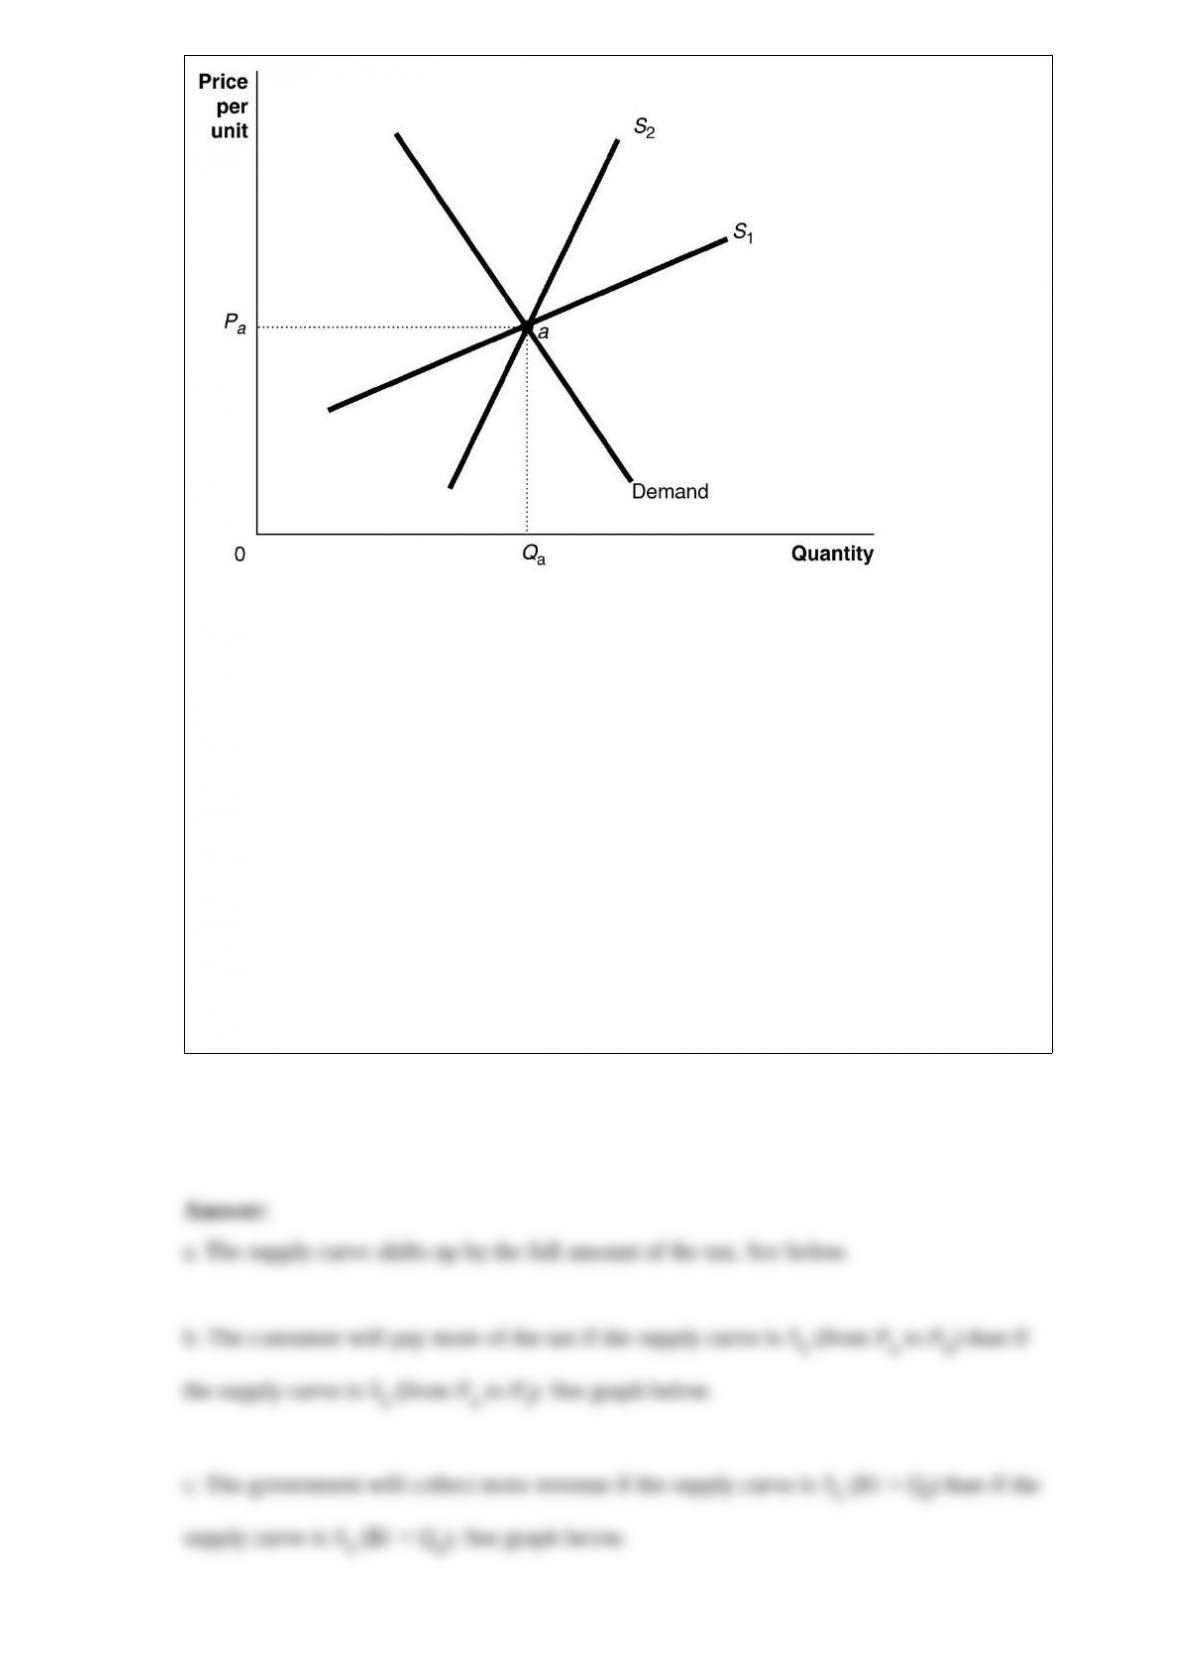
Refer to Figure 18-3. The figure above shows a demand curve and two supply curves,
one more elastic than the other. Use Figure 18-3 to answer the following questions.
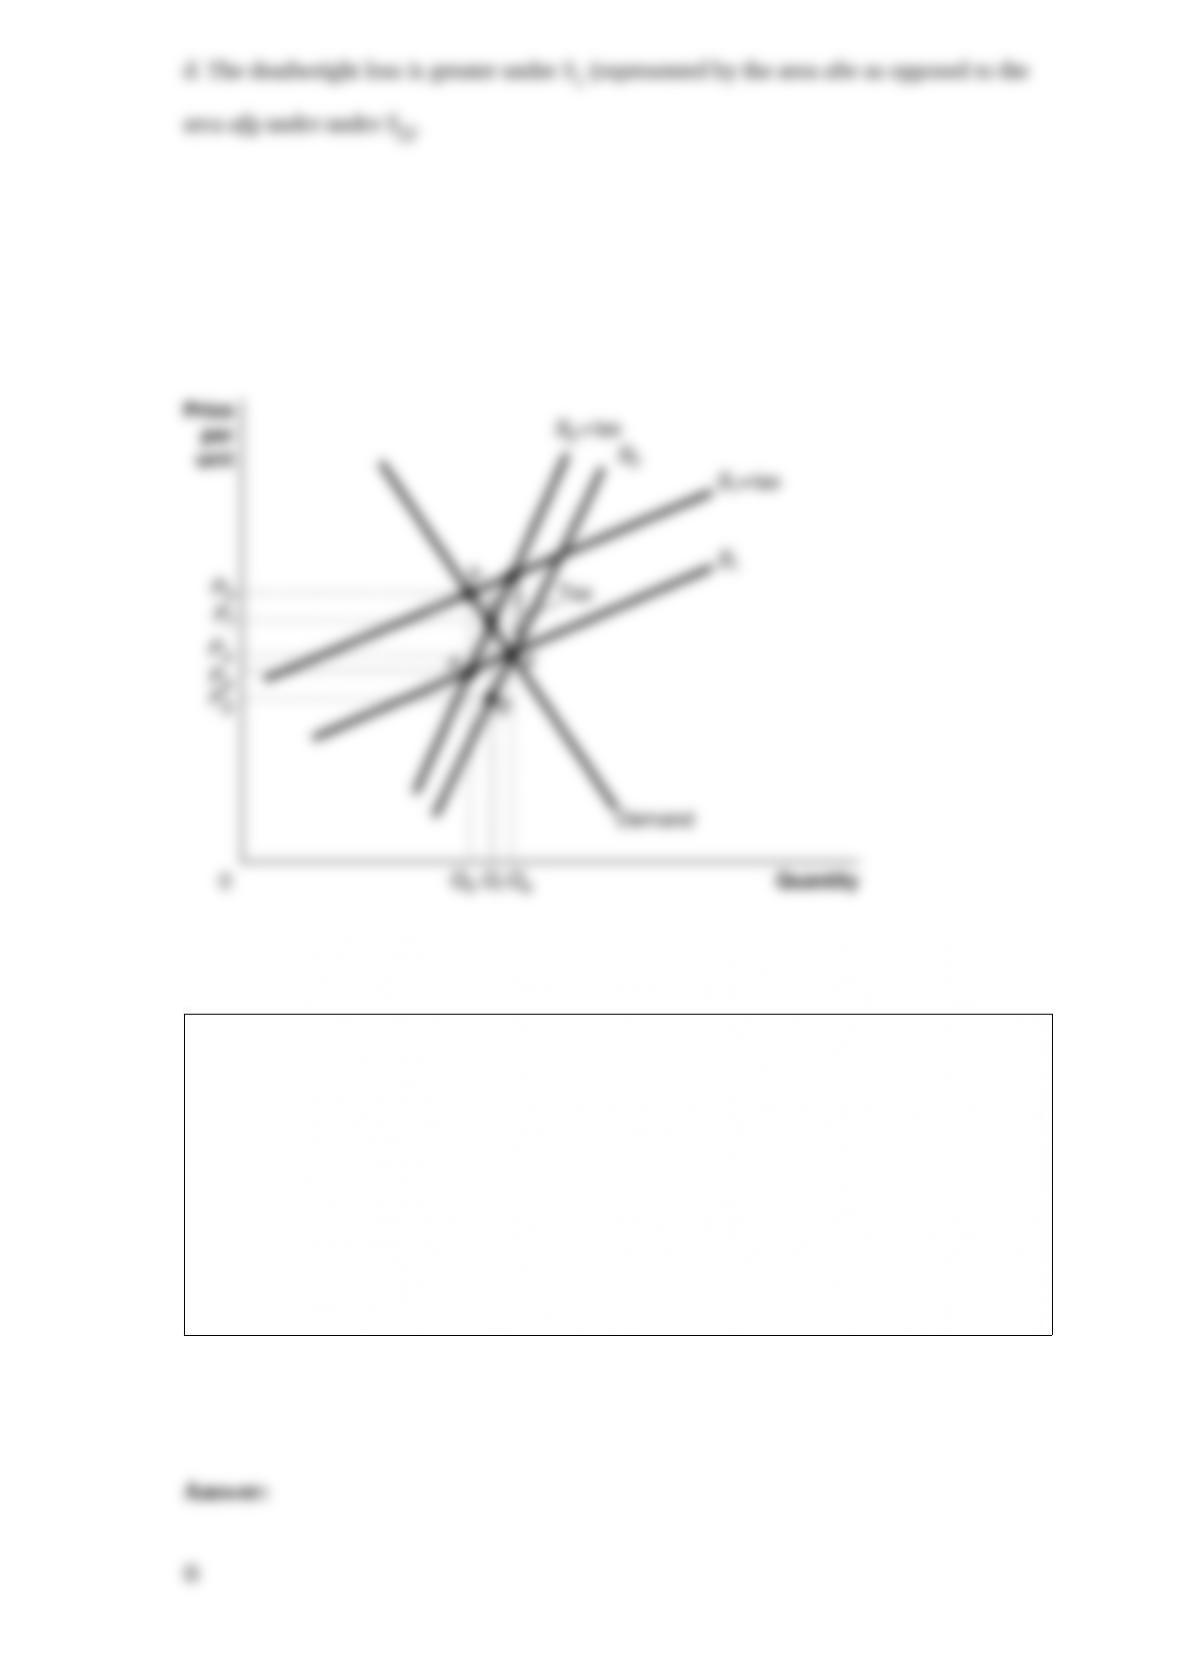
a. Suppose the government imposes an excise tax of $1.00 on every unit sold. Use the
graph to illustrate the impact of this tax.
b. If the government imposes an excise tax of $1.00 on every unit sold, will the
consumer pay more of the tax if the supply curve is S1 or S2? Refer to the graphs in
your answer.
c. If an excise tax of $1.00 on every unit sold is imposed, will the revenue collected by
the government be greater if the supply curve is S1 or S2?
d. If the government imposes an excise tax of $1.00 on every unit sold, will the
deadweight loss be greater if the supply curve is S1 or S2?
An investor is more likely to buy a firm’s stock if the firm’s income statement shows
________ and if its balance sheet shows ________.
A) a large net worth; a large price-earnings ratio
B) a large after-tax profit; a large net worth
C) a large price-earnings ratio; a large dividend yield
D) low opportunity costs; large liabilities

Hotspur Incorporated, a manufacturer of microwaves, is a price taker in both the input
and output markets. To maximize its profit, Hotspur will hire labor up to the point
where
A) the marginal product of labor is no longer positive.
B) all economies of scale have been exhausted.
C) the marginal revenue product of labor equals the wage rate.
D) the marginal revenue product of labor equals the output price.
Cost-plus pricing would be consistent with selecting the profit-maximizing price when
A) it results in a price that causes quantity sold to be where marginal revenue equals
marginal cost.
B) a firm has no difficulty estimating its demand curve.
C) consumers value the product beyond its marginal cost.
D) the demand for the firm’s product is unit elastic.
Figure 3-7

Refer to Figure 3-7. Assume that the graphs in this figure represent the demand and
supply curves for used clothing, an inferior good. Which panel describes what happens
in this market as a result of a decrease in income?
A) Panel (a)
B) Panel (b)
C) Panel (c)
D) Panel (d)
Marginal productivity theory implies that in a perfectly competitive market economy, a
worker will receive income
A) equal to the value of her marginal contribution to the production process.
B) that is greater than the value of her marginal contribution to the production process.

C) that is less than the value of her marginal contribution to the production process.
D) greater than, less than, or equal to the value of her marginal contribution to the
production process, depending on her ability to negotiate with employers.
Productive efficiency is achieved when
A) firms add a low profit margin to the goods and services they produce.
B) firms produce the goods and services that consumers value most.
C) firms produce goods and services at the lowest cost.
D) there are no shortages or surpluses in the market.
Suppose favorable weather resulted in a bumper crop of oranges in Florida. In the
market for oranges
A) the supply curve shifted to the right resulting in a decrease in the equilibrium price.
B) the supply curve shifted to the right resulting in an increase in the equilibrium price.
C) the demand curve shifted to the left resulting in a decrease in the equilibrium price.
D) the demand curve shifted to the right resulting in an increase in the equilibrium
price.
In economics, choices must be made because we live in a world of
A) unemployment.
B) scarcity.
C) greed.
D) unlimited resources.
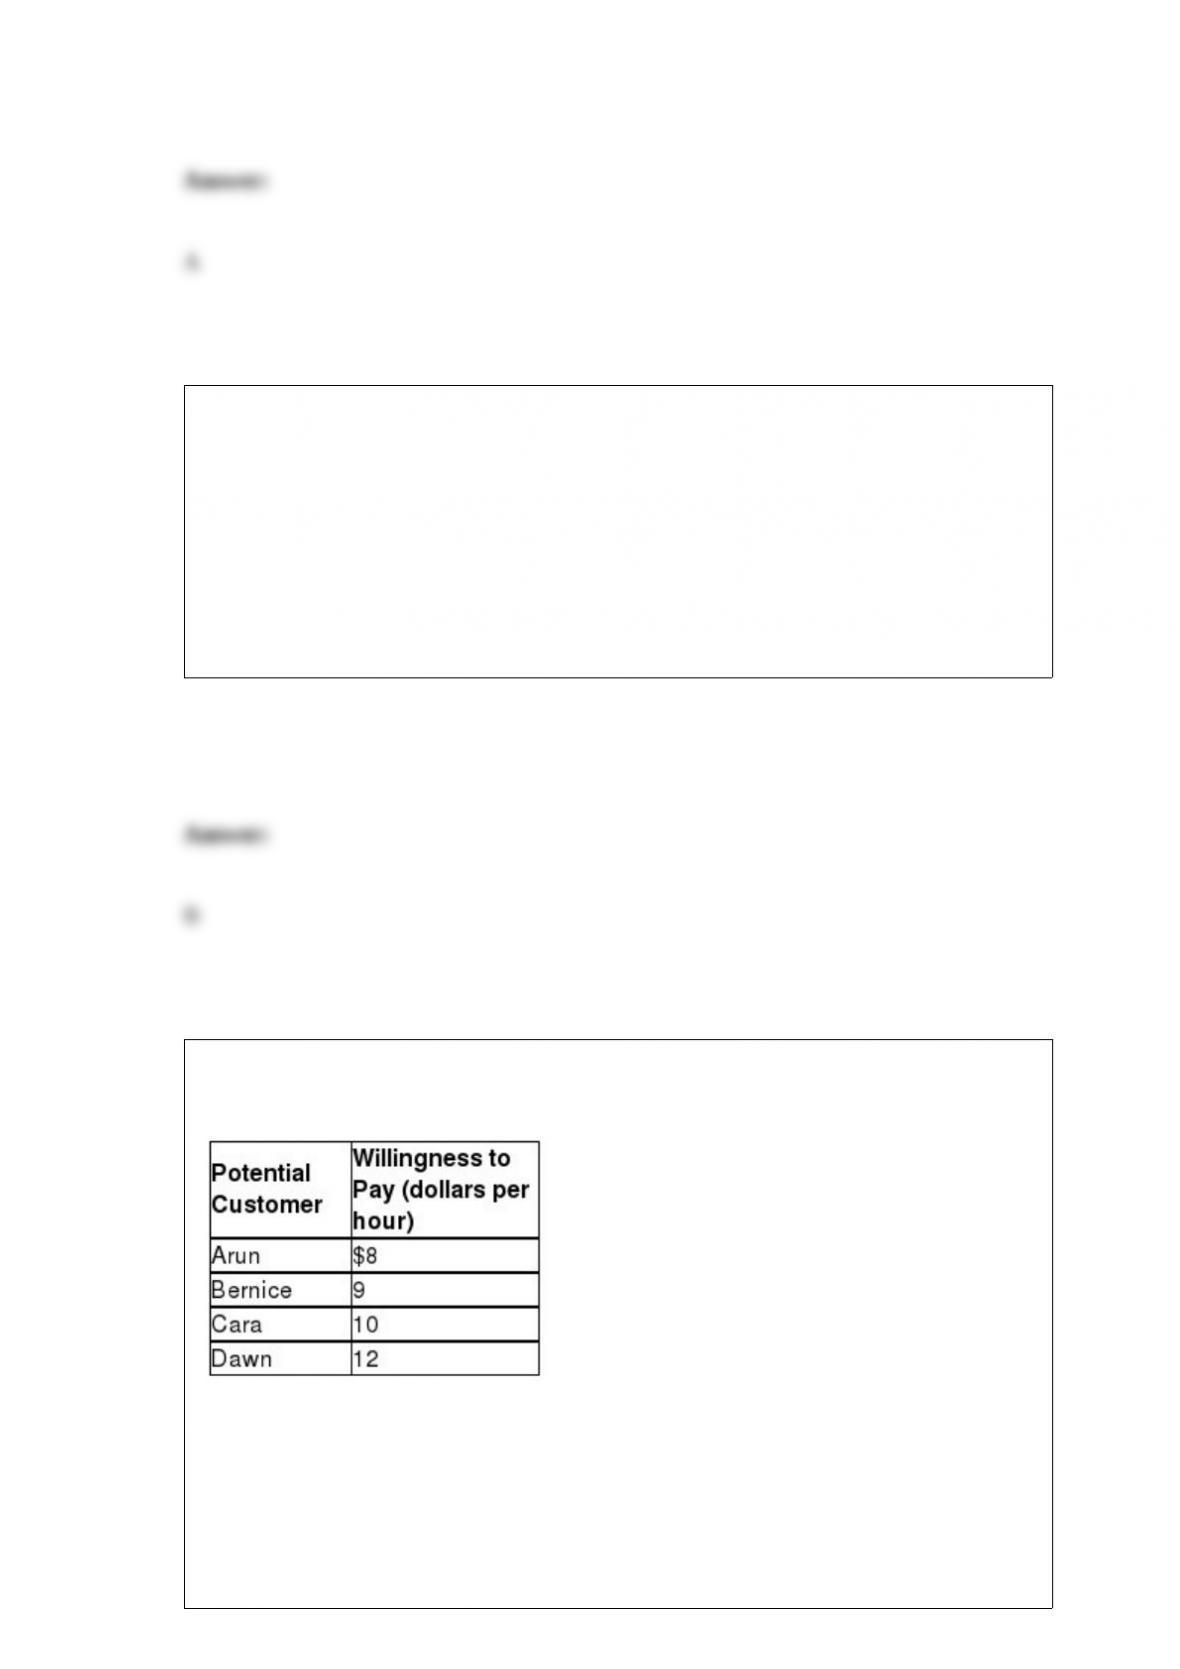
Table 16-3
Julie plans to start a pet-sitting service. She surveyed her neighborhood to determine the
demand for this service. Assume that each person surveyed demands only one hour of
pet sitting services per period. Table 16-3 above shows a portion of her survey results.
Refer to Table 16-3. Suppose Julie’s marginal cost of providing this service is constant
at $7 and she decides to charge each customer according to his or her willingness to
pay. What is the value of consumer surplus by her customers?
A) $39
B) $28
C) $11
D) $0
Figure 17-3

Refer to Figure 17-3. Assume Panel B represents the labor supply curve. Which of the
following statements about Panel B is true?
A) Panel B describes a situation in which the income effect dominates the substitution
effect at low wages (segment i) and again at very high wages (segment iii).
B) Panel B describes a situation in which the income effect dominates the substitution
effect at low wages (segment i) and a situation in which the substitution effect
dominates the income effect at very high wages (segment iii).
C) Panel B describes a situation in which the substitution effect dominates the income
effect at low wages (segment i).
D) Panel B describes a situation in which the income effect dominates the substitution
effect at every level of wages (segments i, ii, and iii).
The way in which a corporation is structured and the impact a corporation’s structure
has on the firm’s behavior is referred to as
A) corporate taxation.
B) structure composition theory.
C) structural behavior.
D) corporate governance.

Figure 12-10
Refer to Figure 12-10. Total revenue at the profit-maximizing level of output is
A) $1,200.
B) $2,500.
C) $4,800.
D) $6,000.
How does the construction of a market demand curve for a private good differ from that
for a public good?
A) There is no difference; in both cases the demand curve is determined by adding up
the price each consumer is willing to pay for each quantity of the good.
B) There is no difference; in both cases the demand curve is determined by adding up
the quantities demanded by each consumer at each price.
C) The market demand curve for a private good is determined by adding up the
quantities demanded by each consumer at each price but the market demand curve for a
public good is determined by adding up the price each consumer is willing to pay for
each quantity of the good.
D) The market demand curve for a private good is determined by adding up the price
each consumer is willing to pay for each quantity of the good but the market demand

curve for a public good is determined by adding up the quantities demanded by each
consumer at each price.