
Aceco has a contract with a supplier to ship parts that contain no more than three
percent defects. When a large shipment of parts comes in, Aceco samples n = 150.
Based on the results of the sample, they either accept the shipment or reject it. If Aceco
wants no more than a 0.10 chance of rejecting a good shipment, the cut-off between
accepting and rejecting should be 0.0478 or 4.78 percent of the sample.
In a chi-square contingency analysis application, the expected cell frequencies will be
equal in all cells if the null hypothesis is true.
A statistic is just another name for a parameter.
A survey was recently conducted in which males and females were asked whether they
owned a laptop personal computer. The following data were observed:
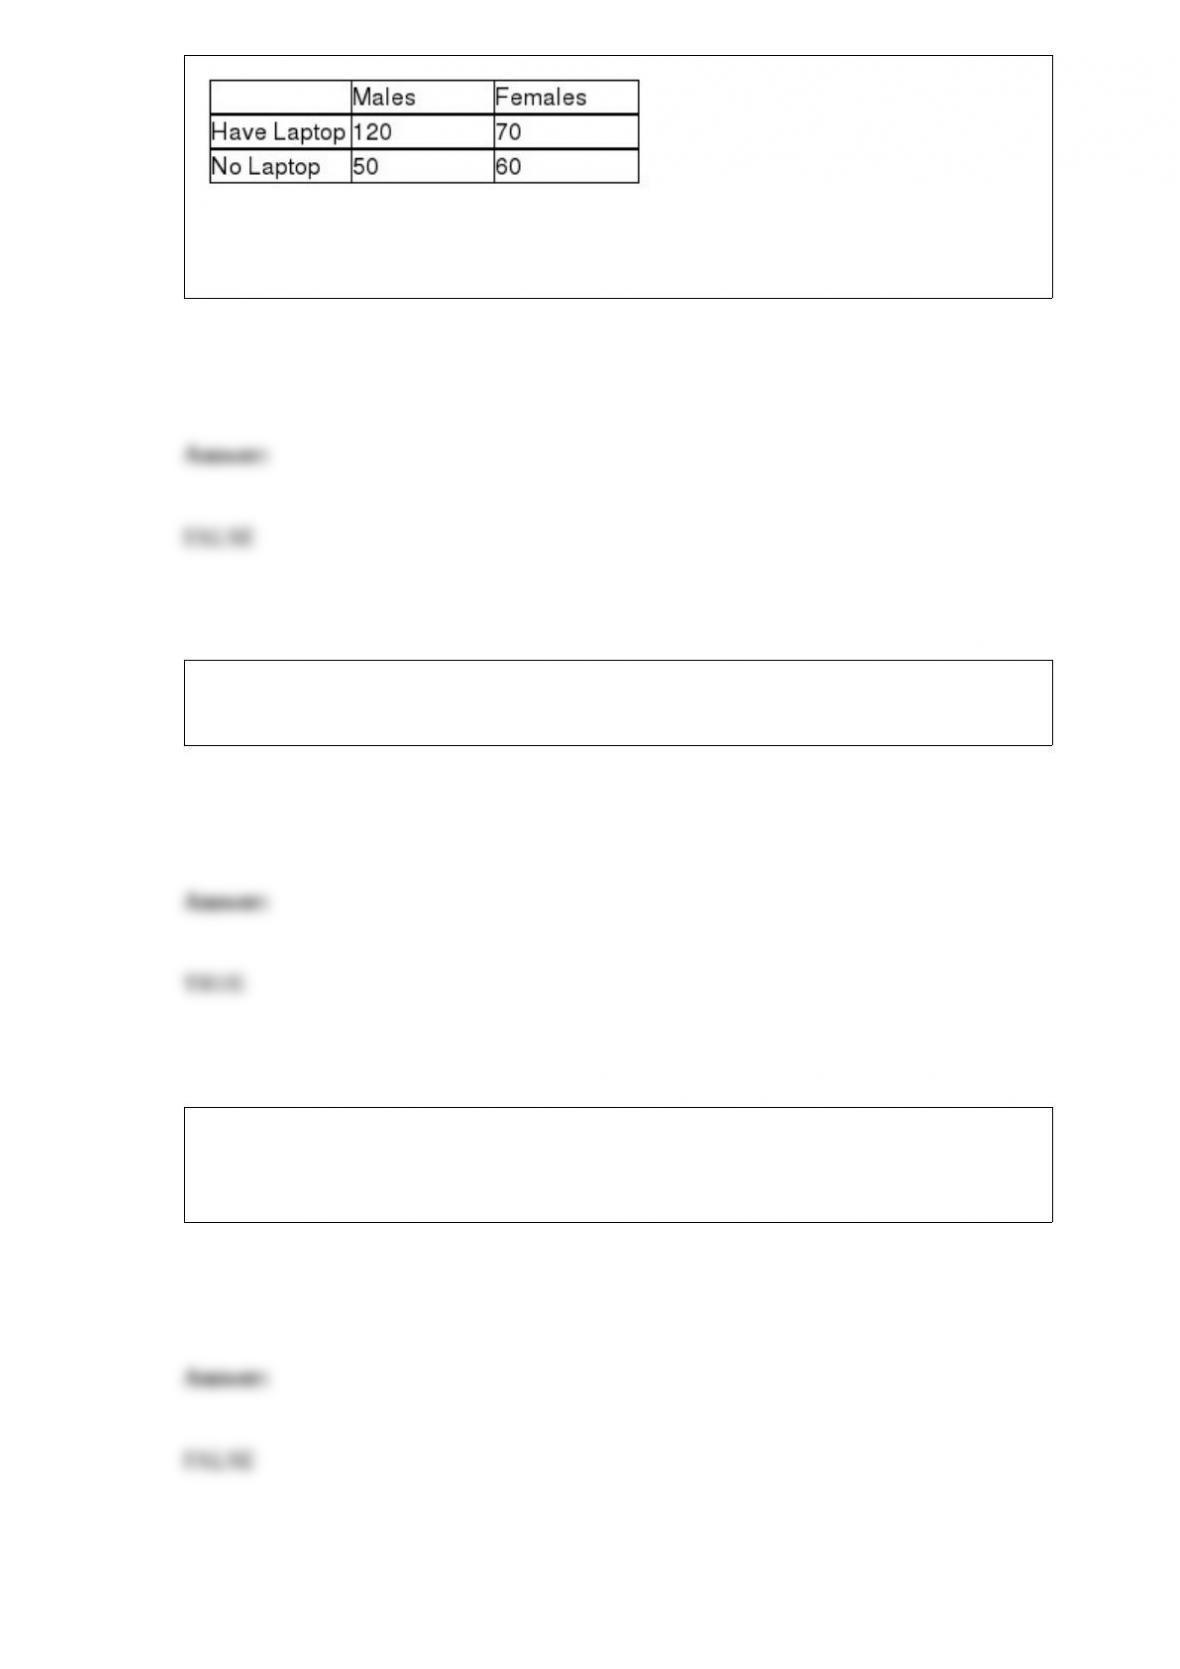
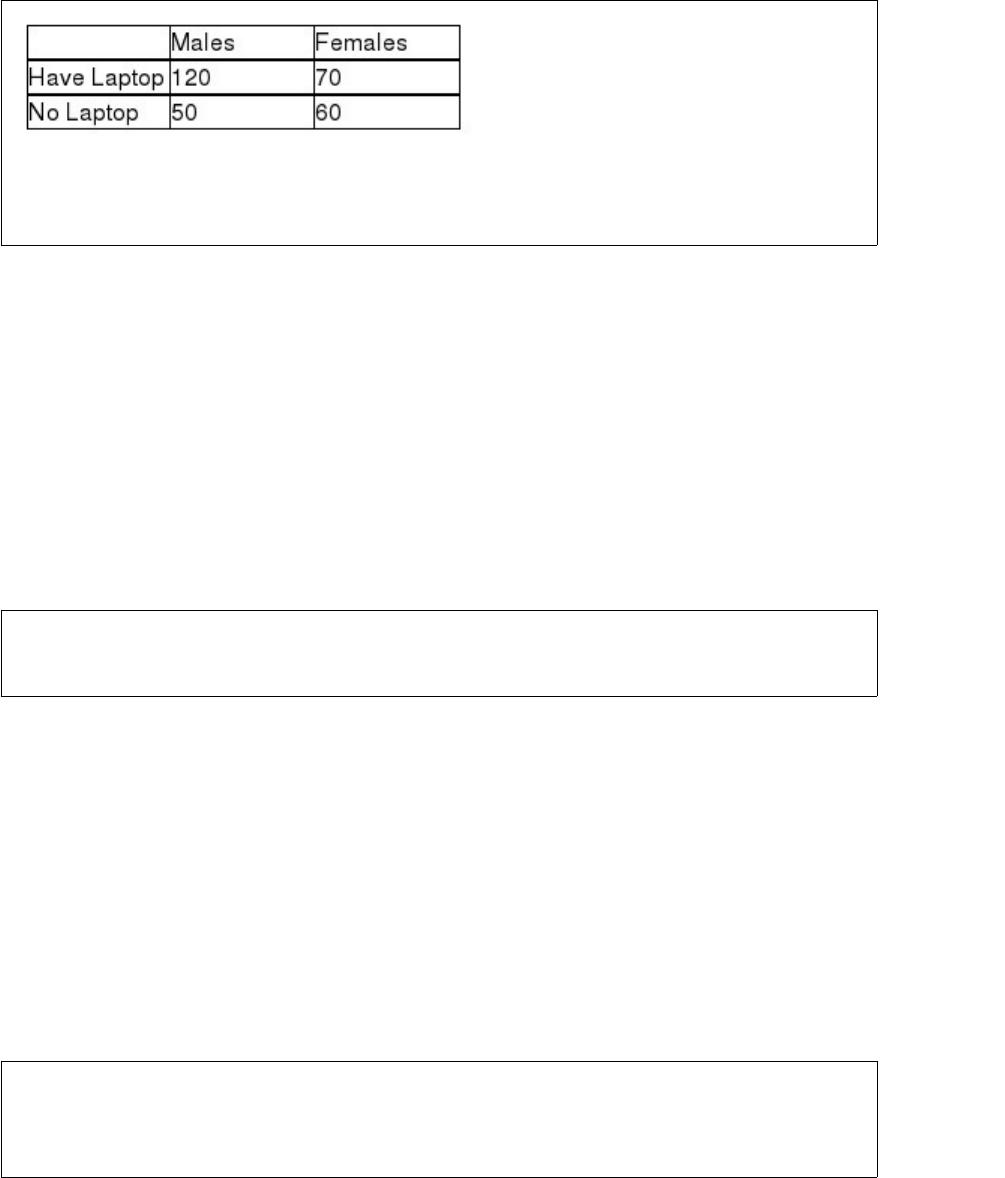
Given this information, if having a laptop is independent of gender, the expected
number of males with laptops in this survey is 150.
In a double smoothing model, the second smoothing constant is introduced to account
for the trend in the data if one exists.
In a recent meeting, a manager indicated that sales tend to be higher during October,
November, and December and lower in the spring. In making this statement, she is
indicating that sales for the company are cyclical.

When developing a bar chart, it is usually preferable to organize the bars in order from
high to low.
A manufacturing manager has developed a table that shows the average production
volume each day for the past three weeks. The average production level is an example
of a numerical measure.
A sample is used to obtain a 95 percent confidence interval for the mean of a
population. The confidence interval goes from 15 to 19. If the same sample had been
used to test the null hypothesis that the mean of the population is equal to 20 versus the
alternative hypothesis that the mean of the population differs from 20, the null
hypothesis could be rejected at a level of significance of 0.05.
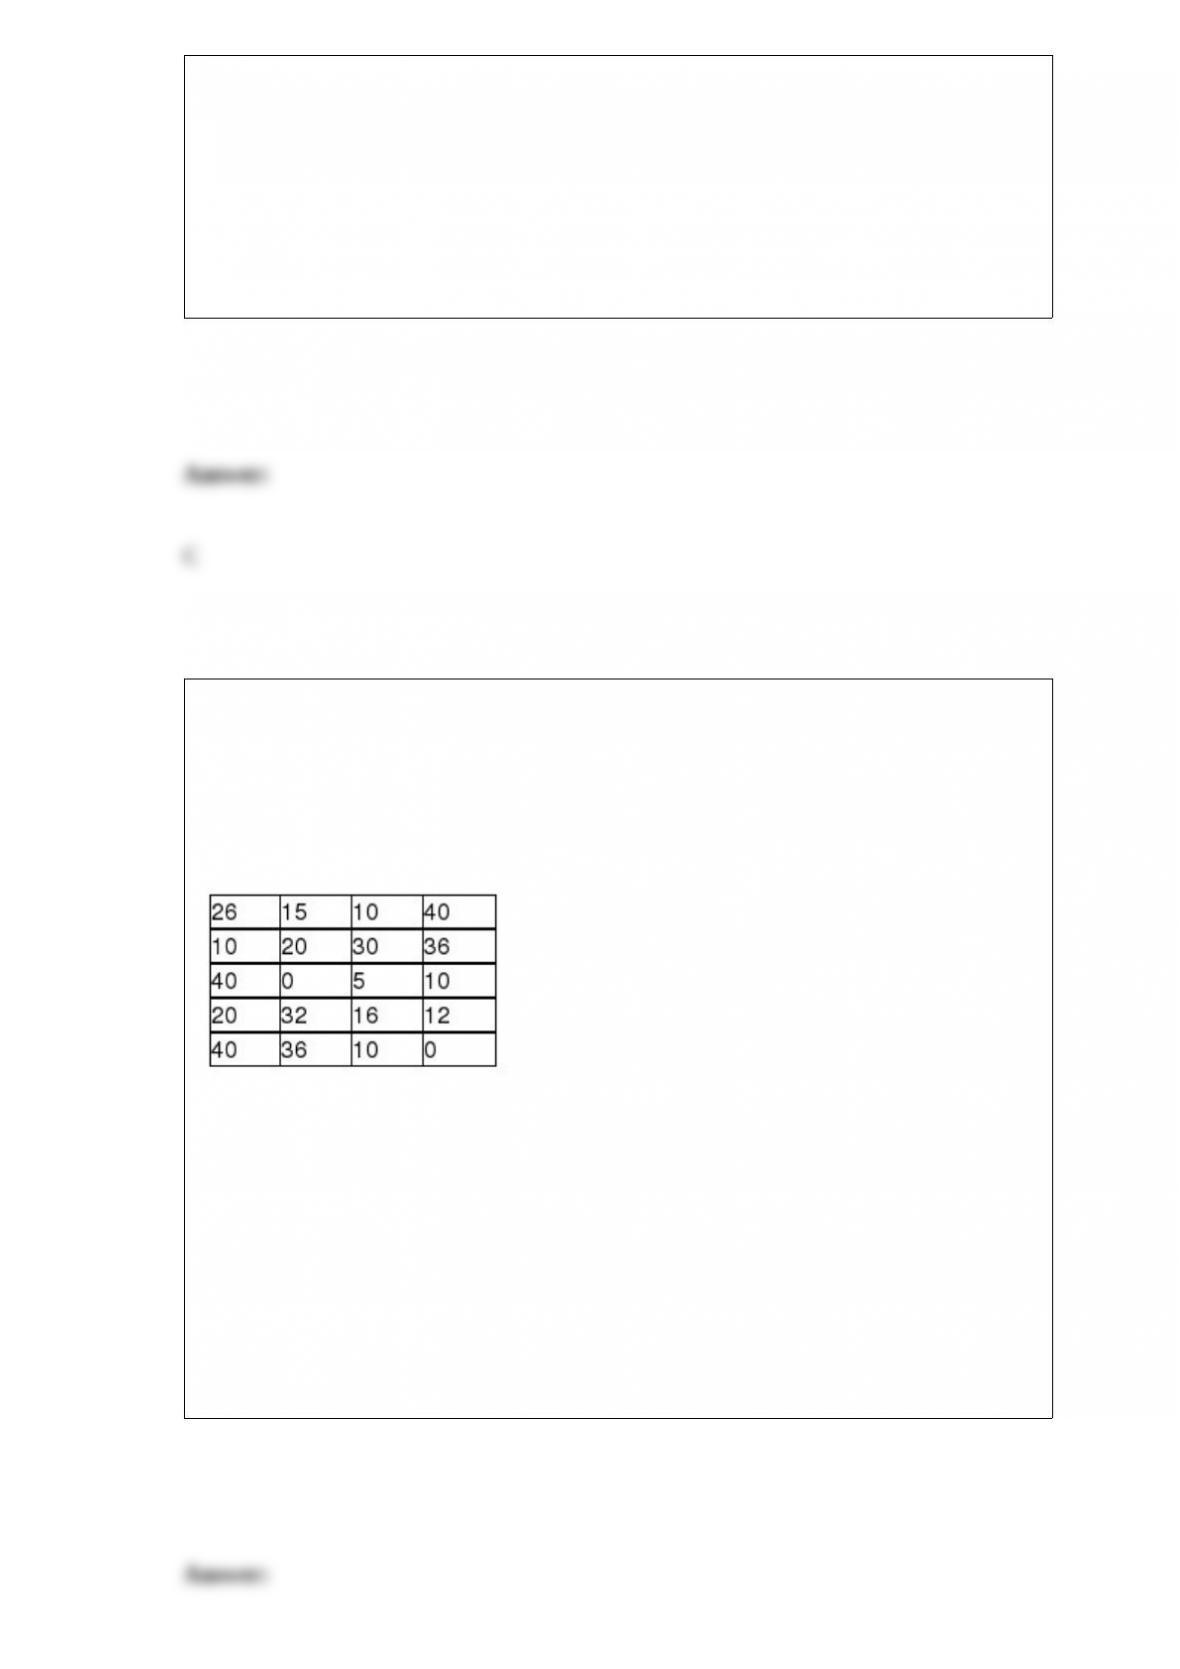
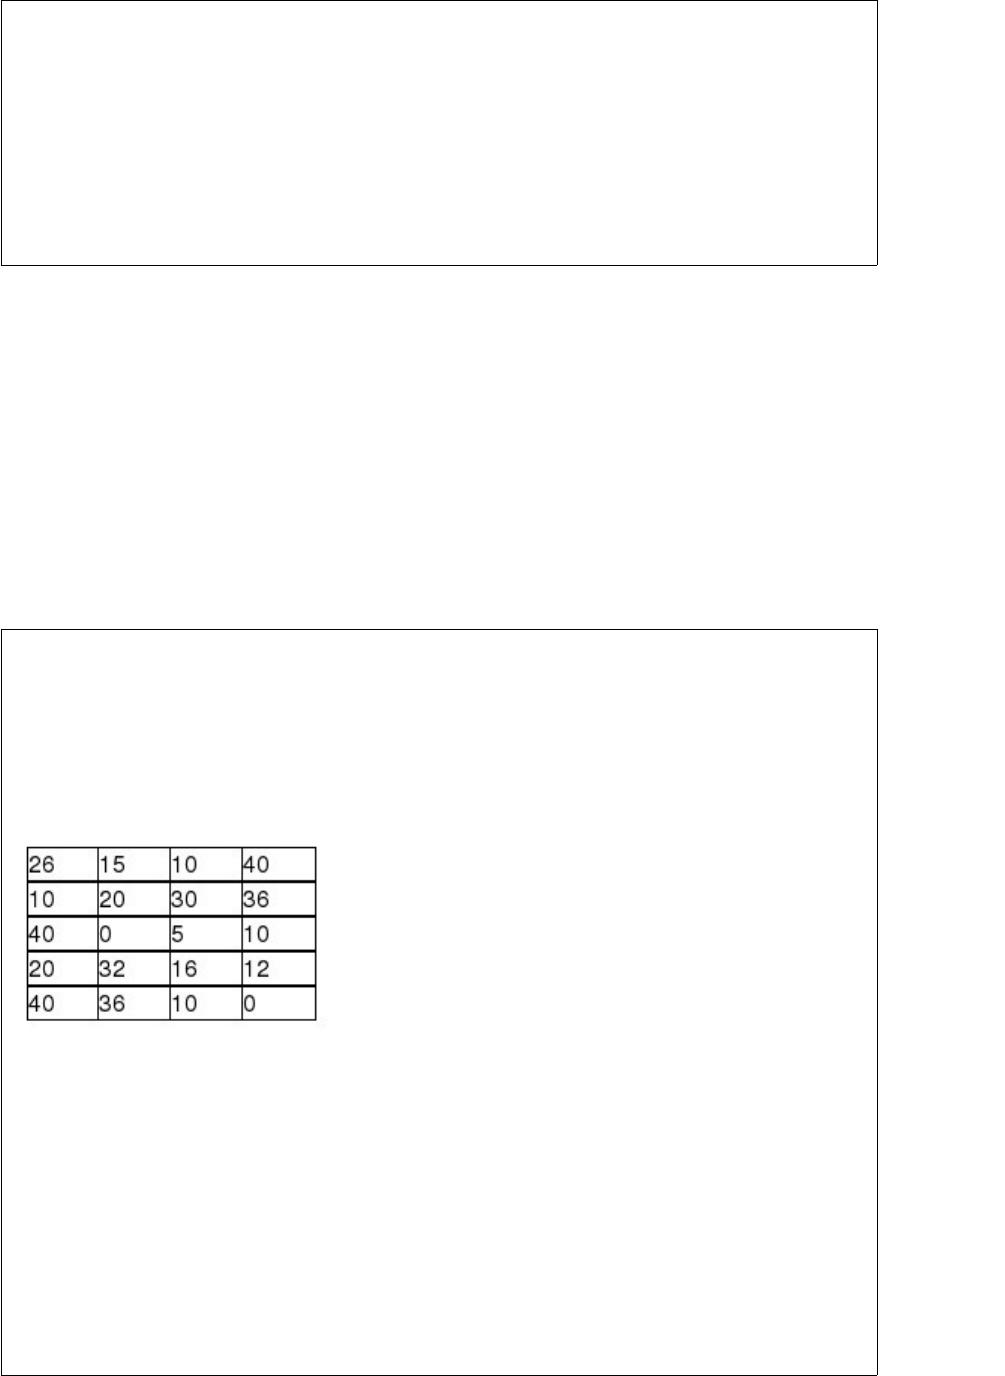
A major car magazine has recently collected data on 30 leading cars in the U.S. market.
It is interested in building a multiple regression model to explain the variation in
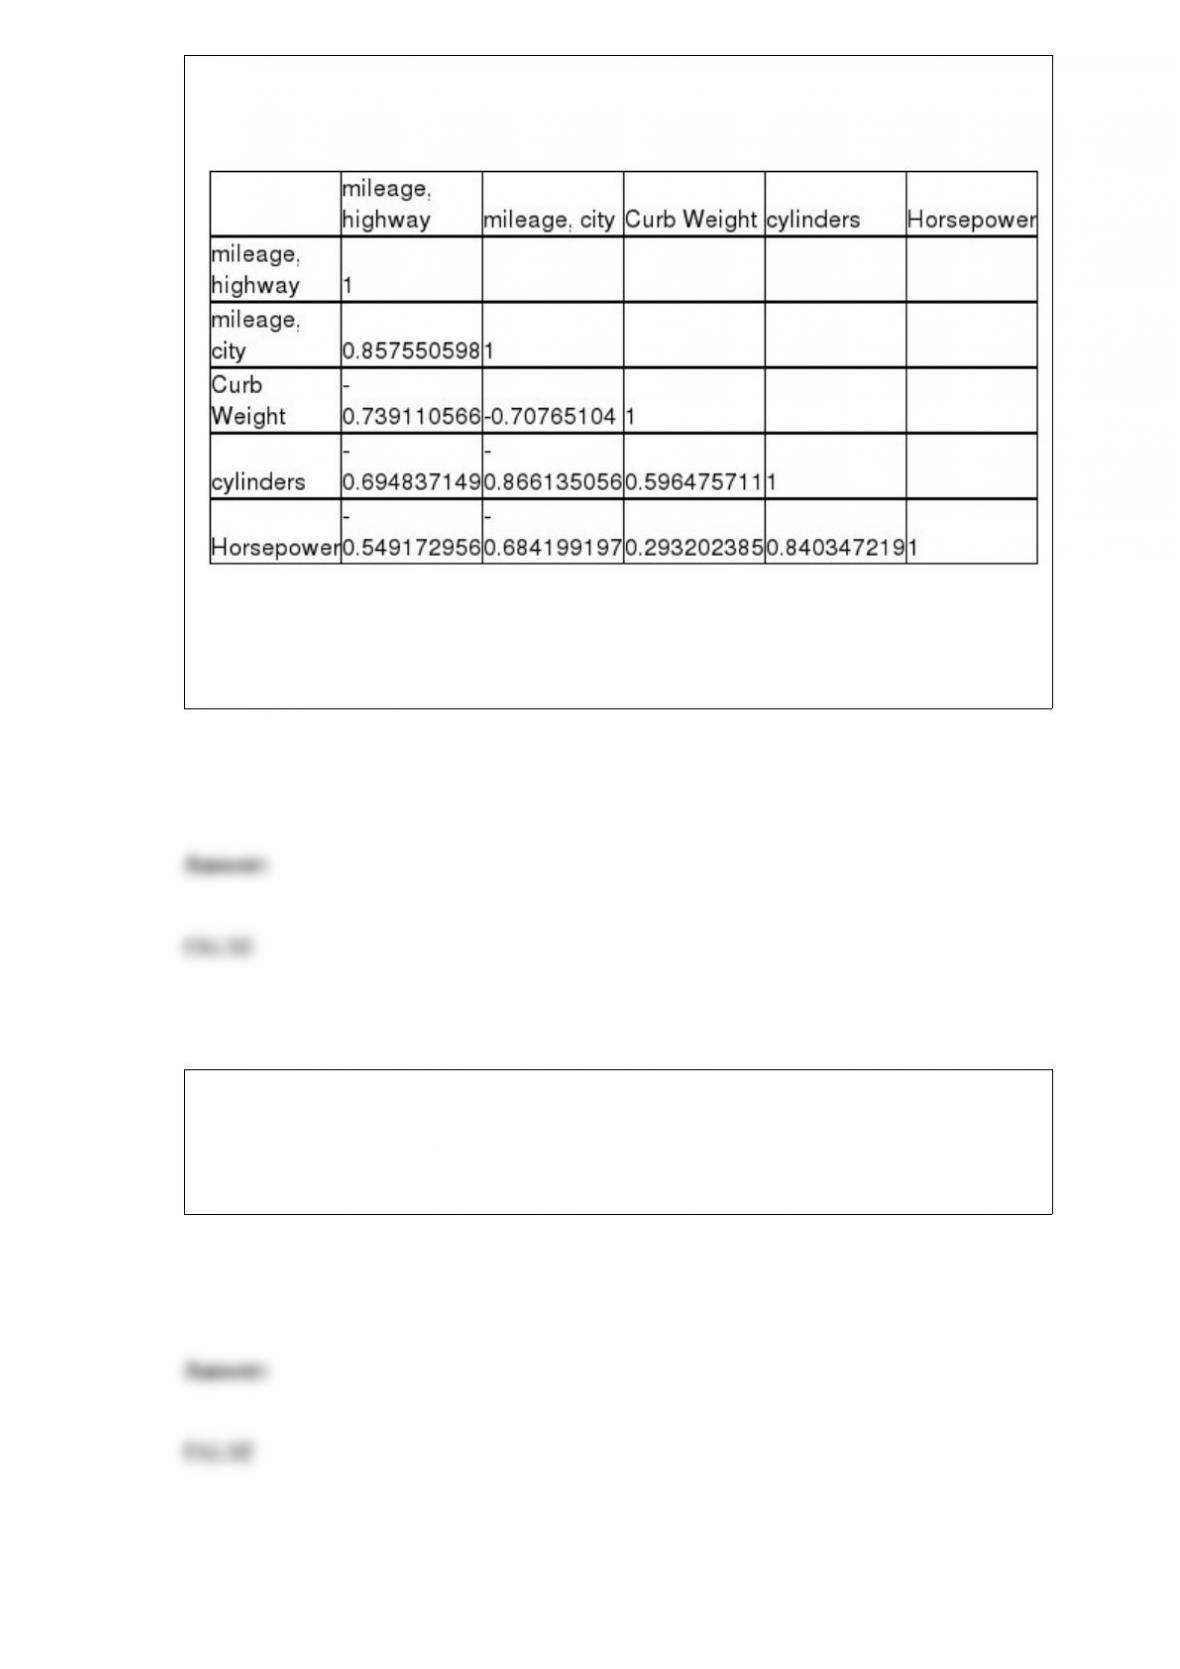
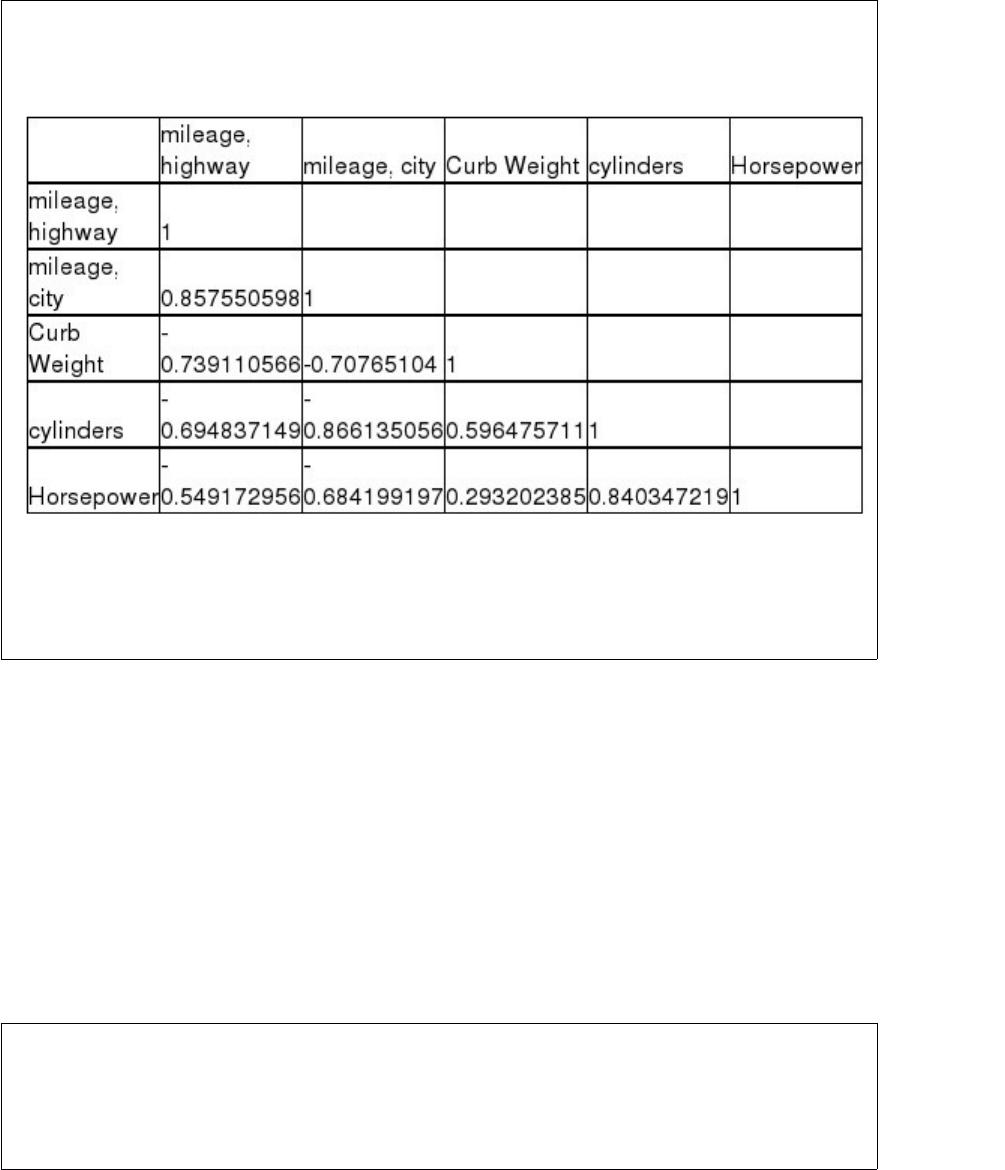
highway miles. The following correlation matrix has been computed from the data
collected:
If only one independent variable (ignoring city mileage) is to be used in explaining the
dependent variable in a regression model, the percentage of variation that will be
explained will be nearly 74 percent.
Suppose it is known that 93 percent of all parts in an inventory of 18,900 parts are in
workable order. If a sample of n = 100 parts were selected from the inventory, based on
the concept of sampling distributions of proportions, it can be assumed that the sample
proportion of workable parts will also be 0.93.


If a pilot sample of n = 40 items has been used as a first step in determining a required
sample size of n = 360, the decision maker can go ahead and use these 40 and take a
sample of only 320 more items.
The owners of Greg’s Department Store have reason to believe that one of their
employees has been stealing from the store. In an interview with the police, the owner
says that she is 75 percent sure that the employee is stealing. This probability is an
example of one that was assessed using classical probability.
The Wilcoxon signed rank test is always a one-tail test with the rejection region in the
upper tail.
One of the major automobile makers has developed two new engines. At question is
whether the two engines have the same variability with respect to miles per gallon. To
test this, the following information is available:

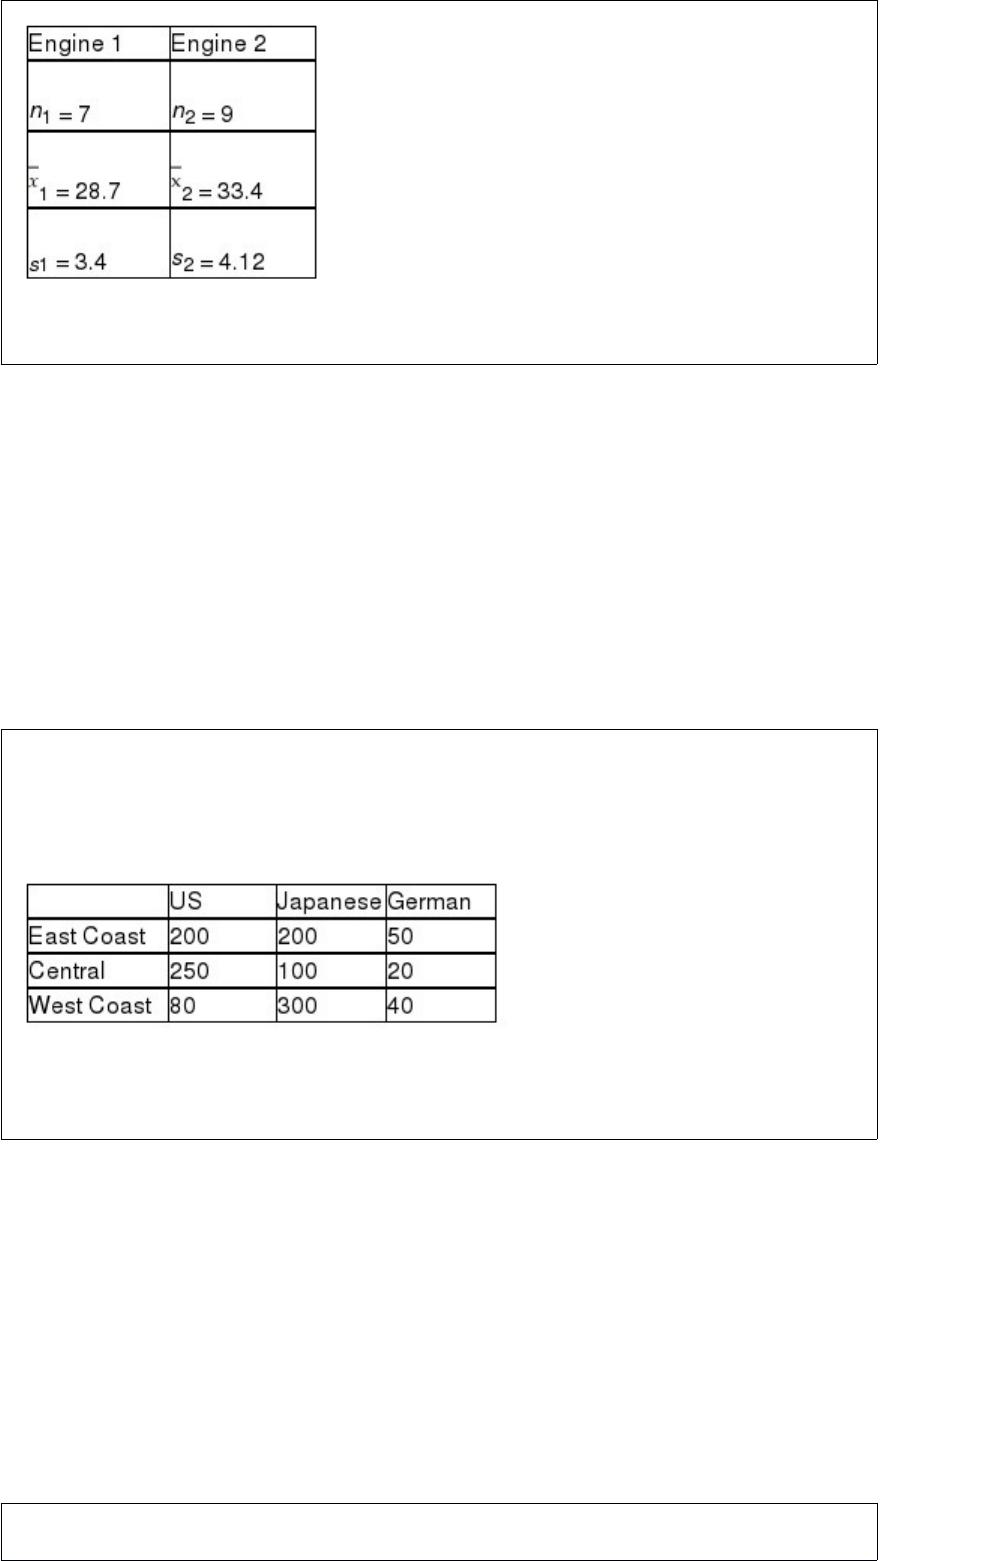
Based on this situation and the information provided, the test statistic is 1.2118.
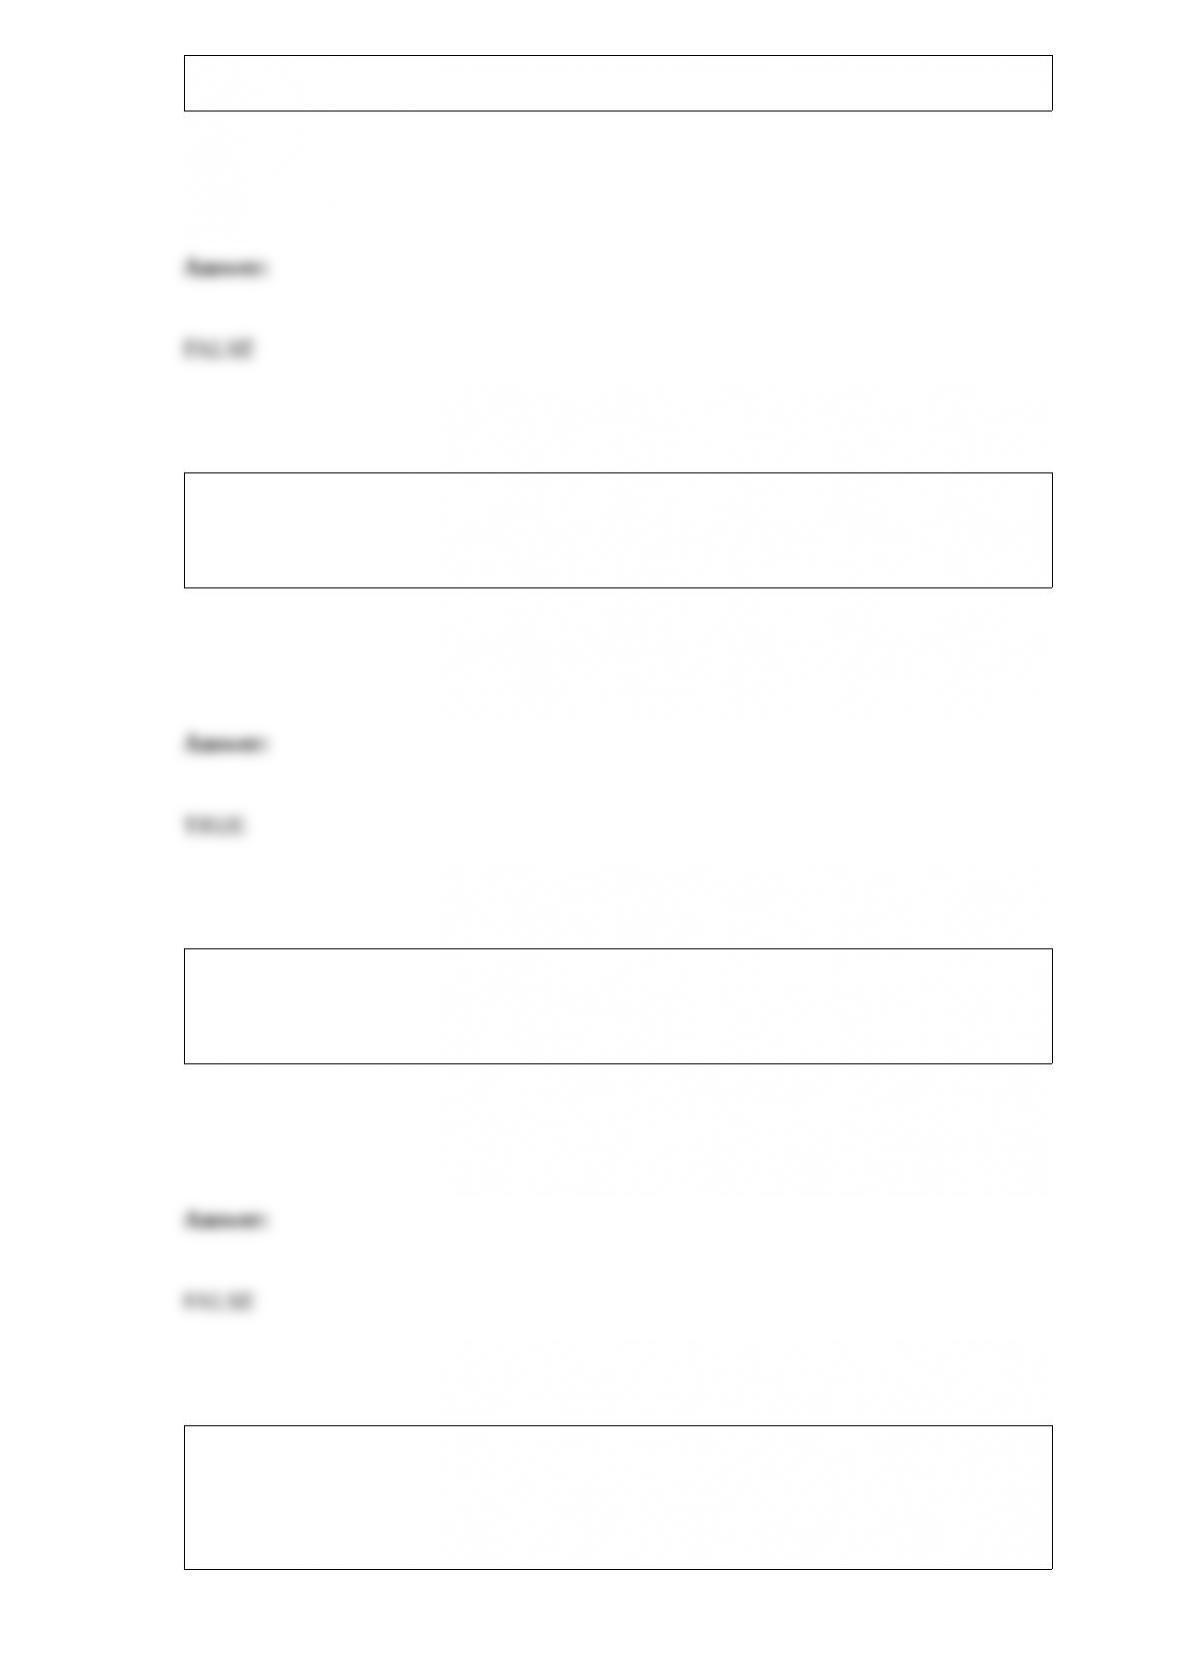
A study was recently done in the United States in which car owners were asked to
indicate whether their most recent car purchase was a U.S. car, a German car, or a
Japanese car. The people in the survey were divided by geographic region in the United
States. The following data were recorded.
Given this situation, the null hypothesis to be tested is that the car origin is dependent
on the geographical location of the buyer.
When a histogram is constructed for discrete numerical data, there should be spaces

between the bars of the histogram.
The experiment-wide error rate will be higher than the 0.05 significance level if the
multiple comparison tests for the mean difference between any two populations use the
0.05 level.
In analyzing a single quantitative variable, you will generally choose to use a scatter
diagram if the variable is measured over time and a histogram if the variable is
cross-sectional.
A company has established an experiment with its production process in which three
temperature settings are used and five elapsed times are used for each setting. The
company then produces one product under each and measures the resulting strength of
the product. This experimental design is called a randomized complete block design.
A first step in testing whether two populations have the same mean value using the
t-distribution is to use the chi-square distribution to test whether the populations have
equal variances.
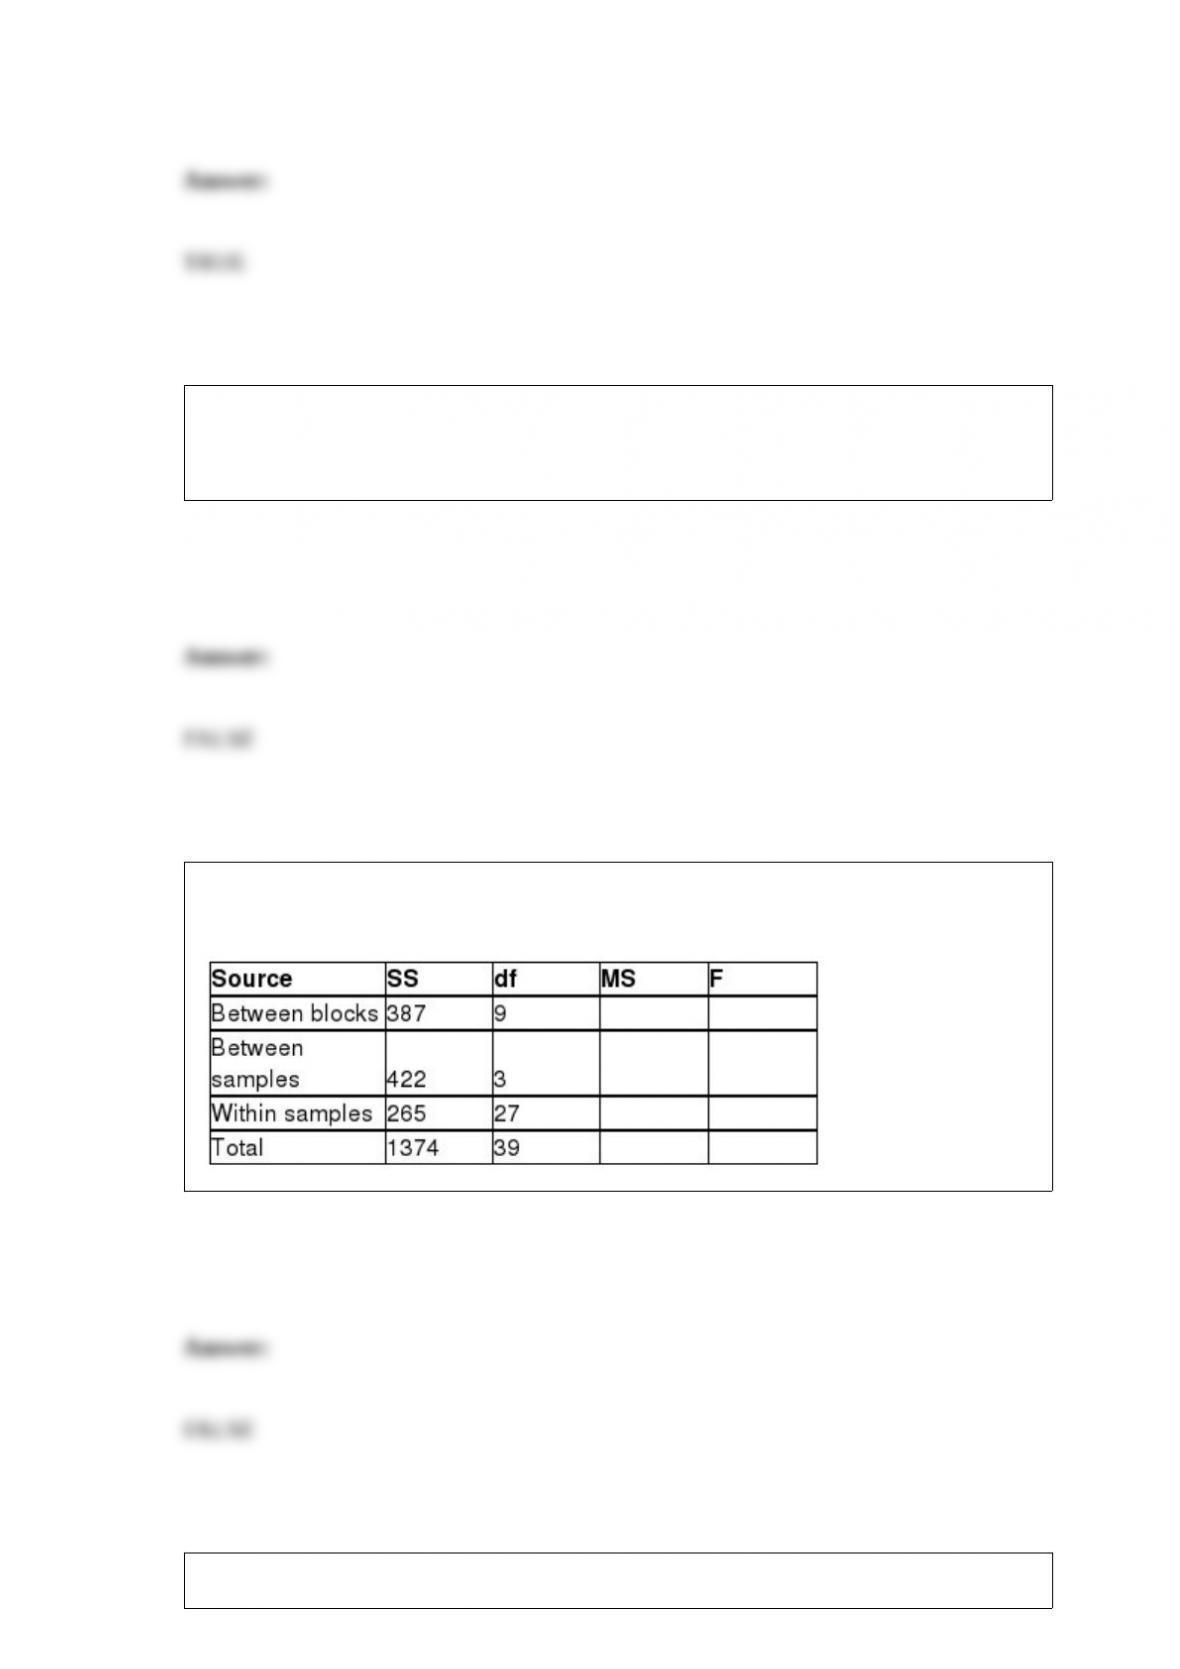
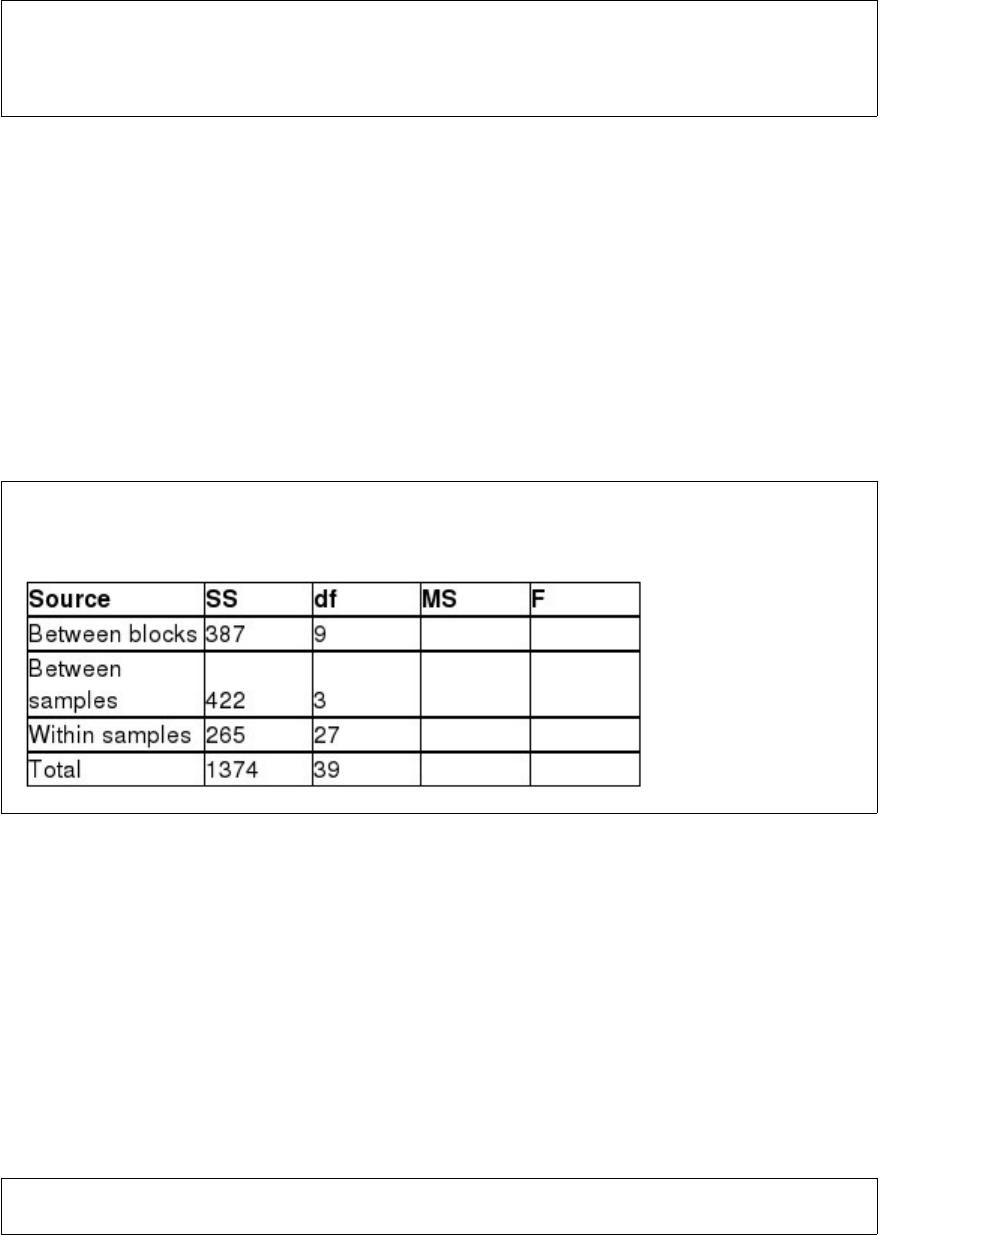
Based on the partially completed ANOVA table below, we know that 3 samples are
being compared using 9 blocks.
In a hypothesis test, increasing the sample size will generally result in a smaller chance

of making a Type I error since sampling error is likely to be reduced.
When the variables of interest are both categorical and the decision maker is interested
in determining whether a relationship exists between the two, a statistical technique
known as contingency analysis is useful.
A study has recently been conducted by a major computer magazine publisher in which
the objective was to develop a multiple regression model to explain the variation in
price of personal computers. Three quantitative independent variables were used along
with one qualitative variable. The qualitative variable was coded 1 if the computer
included a monitor, 0 otherwise. The following computer printout shows the final
output.
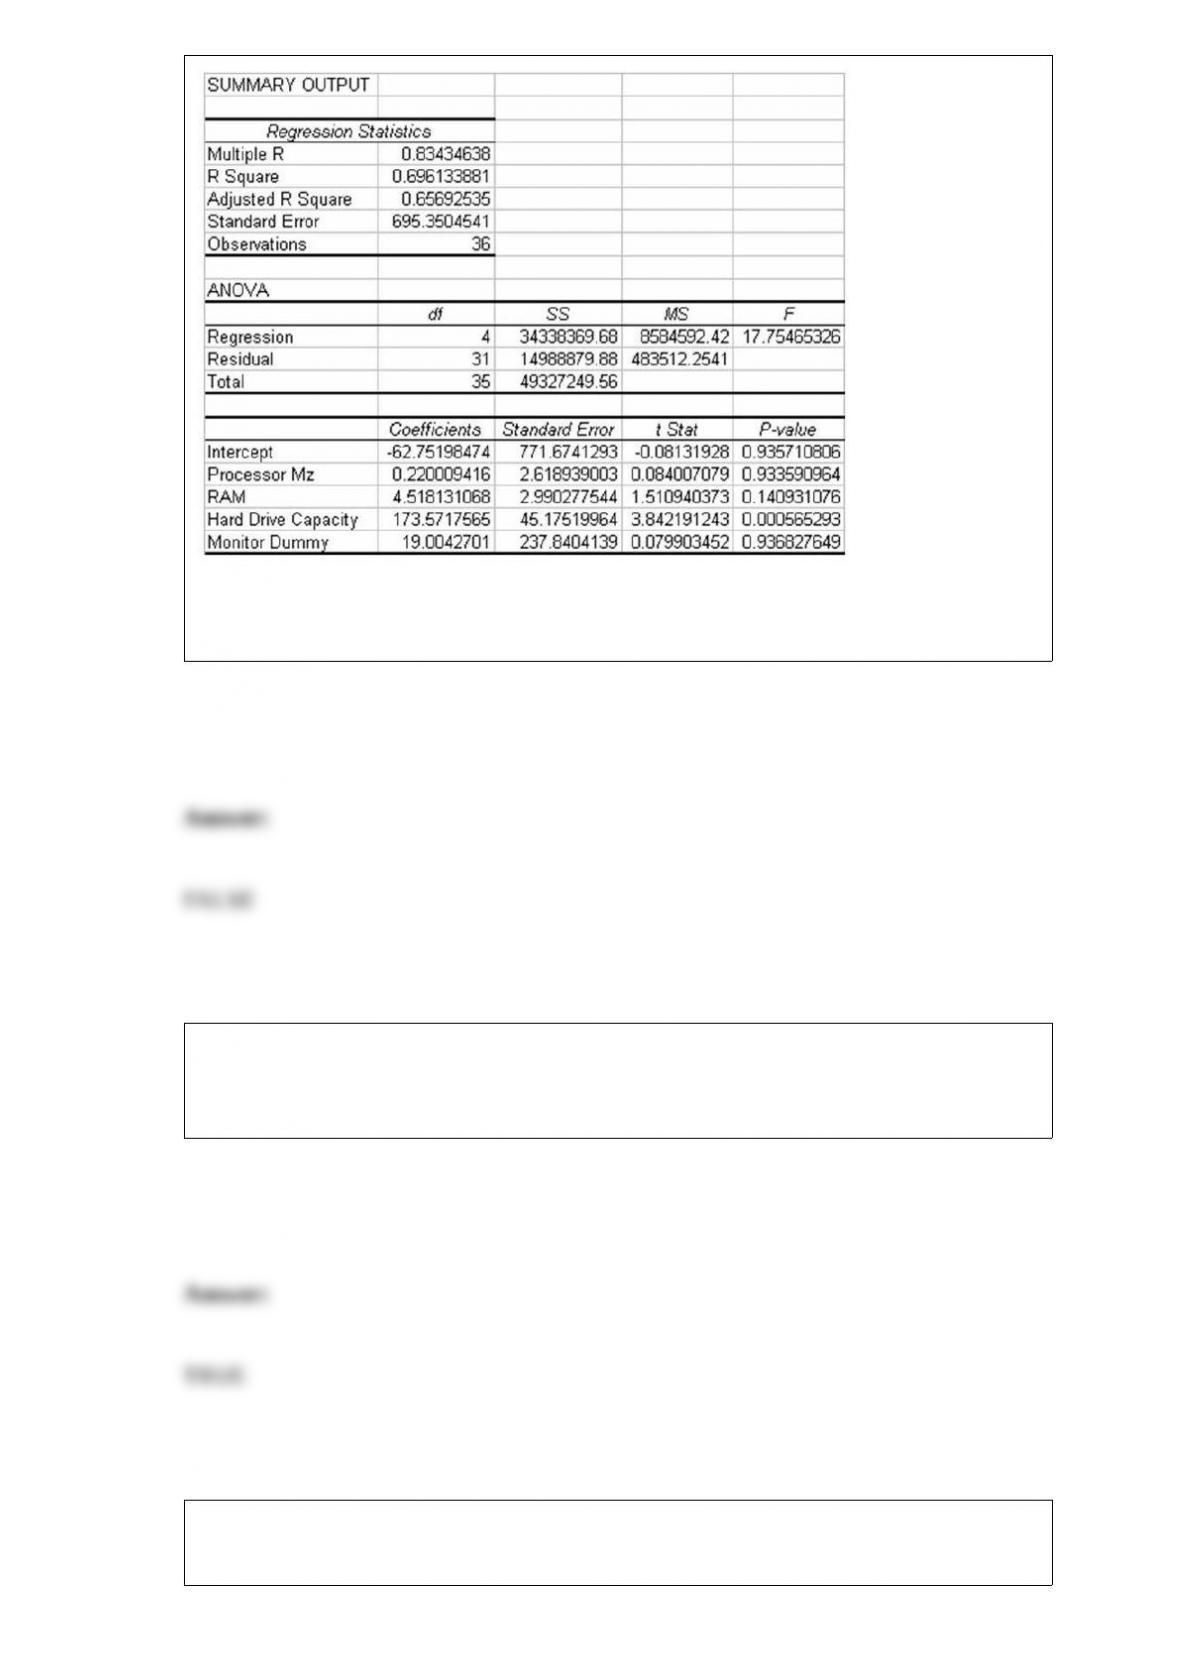
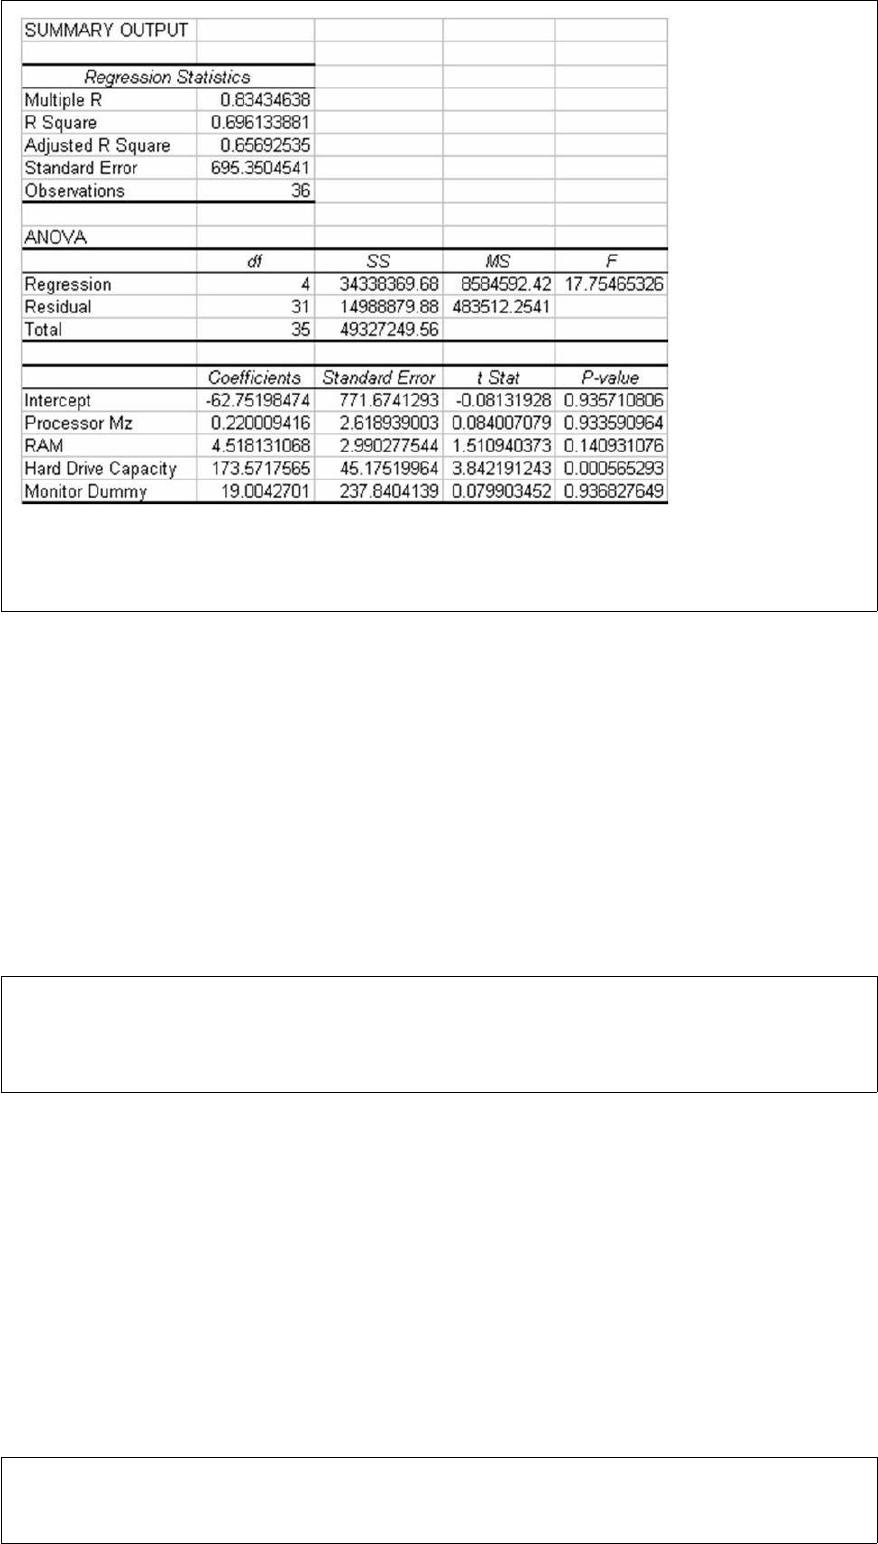
Based on this information, given the other variables in the model, whether or not a
monitor is included has a significant impact on the price of the personal computer.
When the salesperson makes a sale, there are three possible sales levels: large, medium,
and small. The probability of a large sale is 0.20 and the chance of a medium sale is
0.60. If a salesperson makes two sales, the probability that at least one is large is 0.36.
Questions on a written survey dealing with the characteristics of the respondent (age,
income, etc.) are referred to as categorical questions.
If a manager is planning for an expansion of the factory, a forecast model with a
long-term planning horizon would probably be used. ”
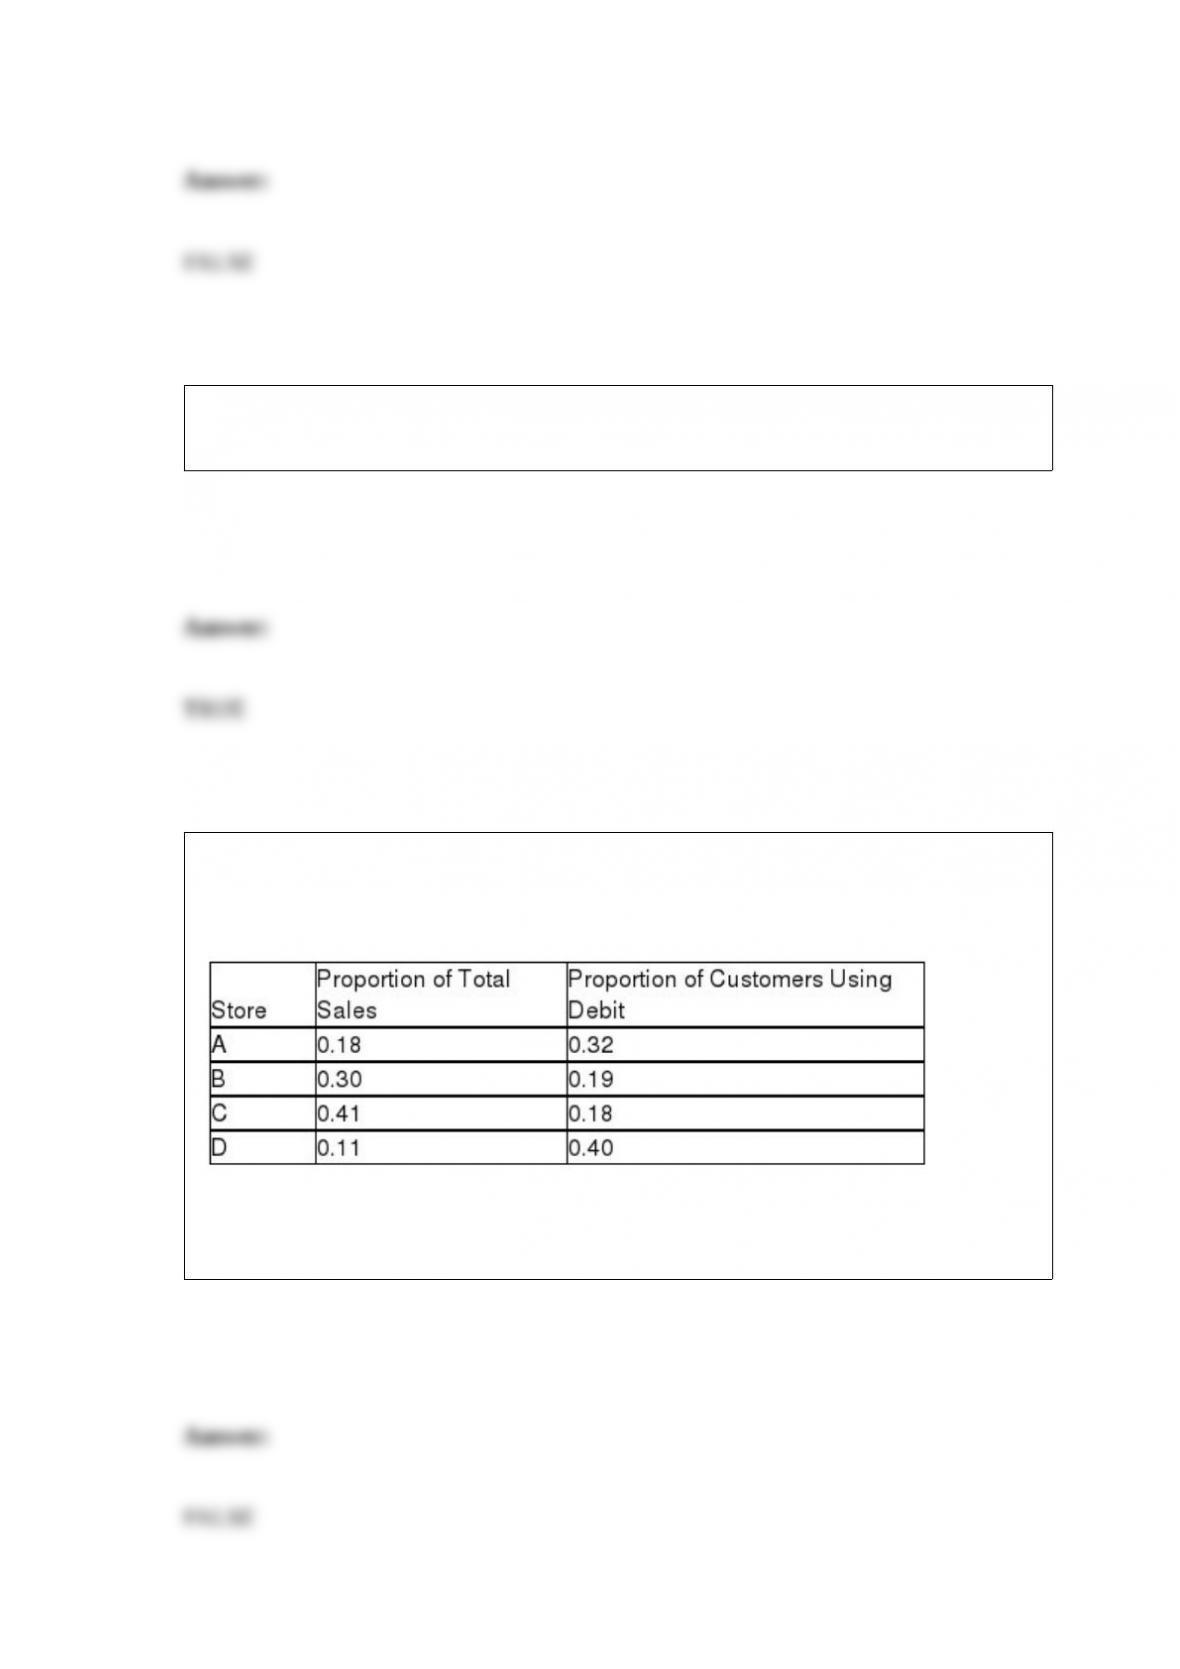
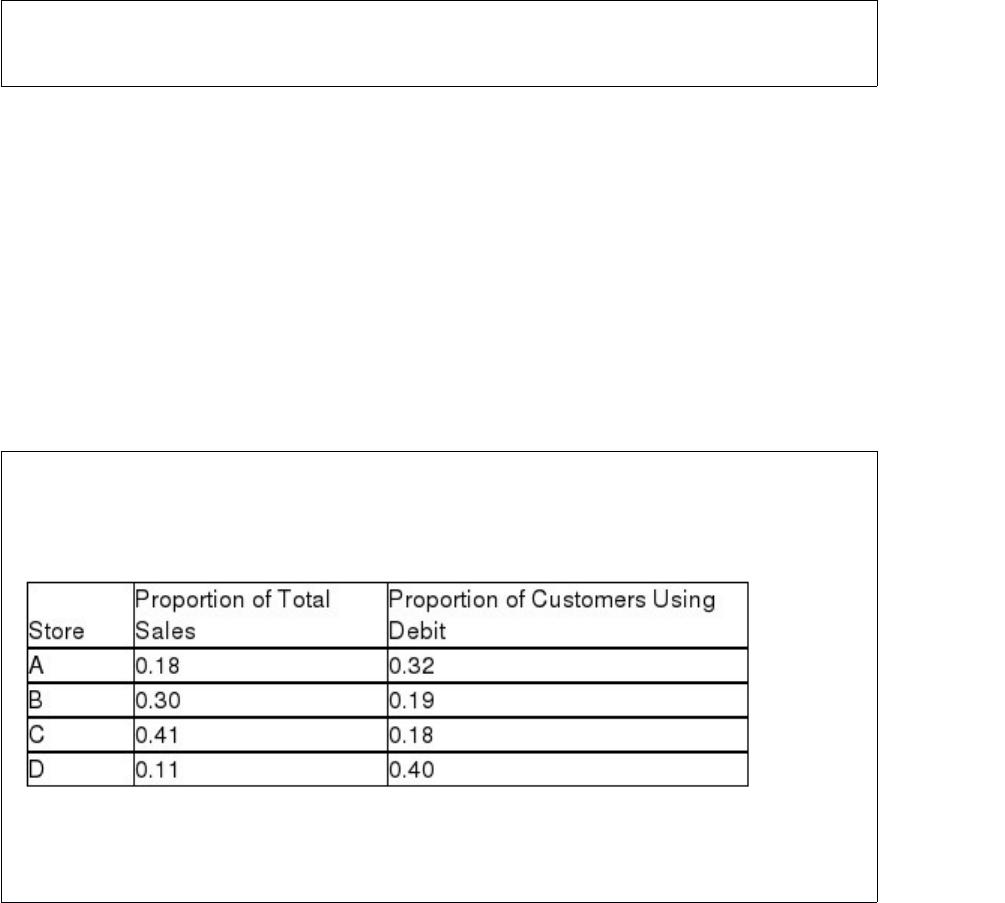
The Baker Oil and Gas Company has four retail locations, code-named A, B, C, and D.
The following table illustrates the percentage of total company sales at each store and
also the percentage of customers at that store who make purchases with debit cards:
Based on this information, given that a customer has used a debit card to make the
purchase, the sale was most likely made at store D.

In the Wilcoxon signed rank test for testing about a single population median, if the
sample size is large (n > 20), the test statistic can be approximated by the standard
normal distribution.
The logic behind the Mann-Whitney U test is that if the hypothesis is true that the
populations have equal central locations, then the sum of the ranks from each
population will be approximately equal.
A p-chart would potentially be used to monitor the diameters of bolts made by a bolt
manufacturing plant.
In a simple linear regression analysis, if the test statistic for testing the significance of
the regression slope coefficient is 3.6, the F ratio from the analysis of variance table is
known to be 12.96


On a survey, the questions pertaining to the background of the respondent (age, gender,
etc.) are referred to as demographic questions.
The number of weeds that remain living after a specific chemical has been applied
averages 1.3 per square yard and follows a Poisson distribution. Based on this, what is
the probability that a 3-square yard section will contain less than 4 weeds?
A) 0.4532
B) 0.2001
C) 0.6482
D) 0.1951
As a step in establishing its rates, an automobile insurance company is interested in
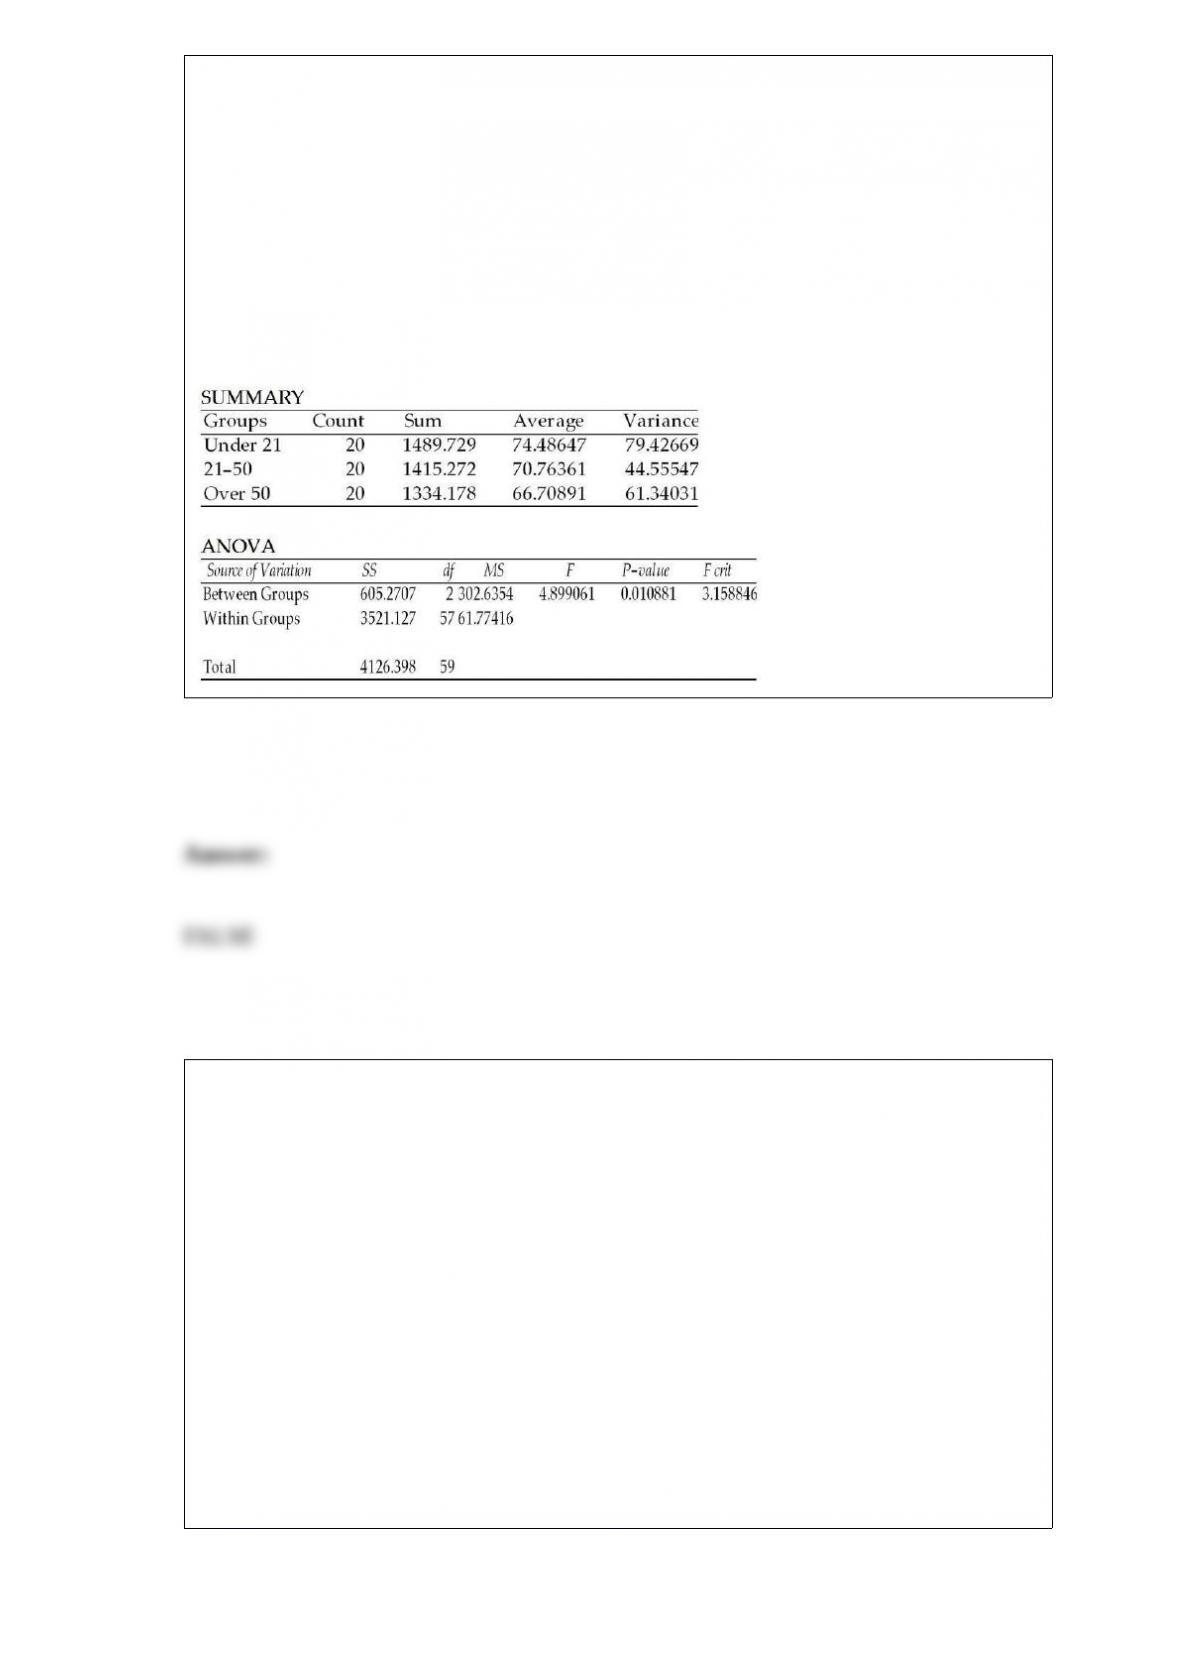
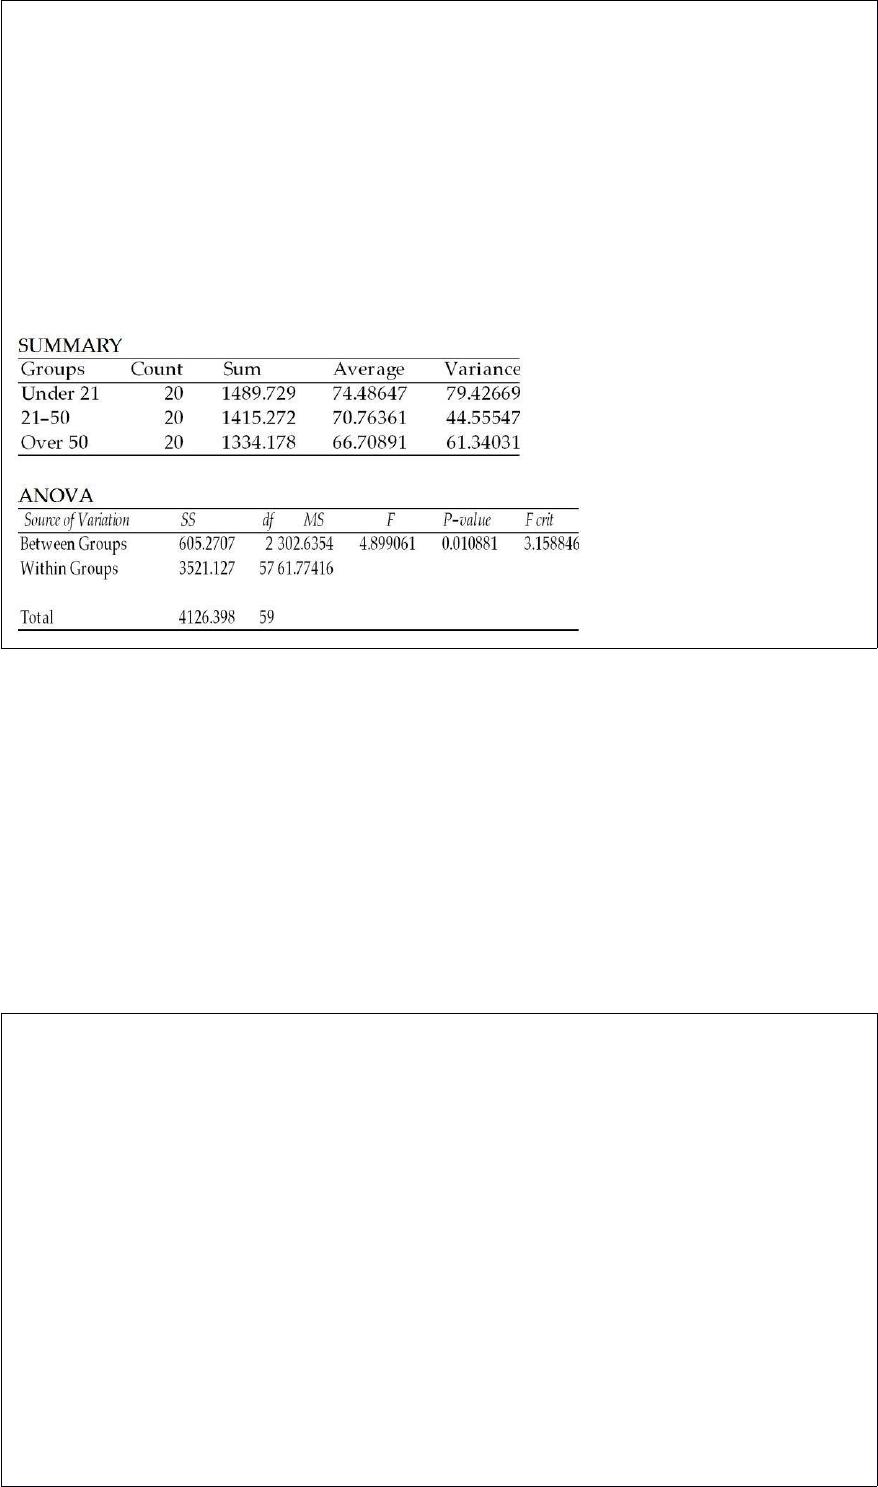
determining whether there is a difference in the mean highway speeds that drivers of
different age groups drive. To help answer this question, it has selected a random
sample of drivers in three age categories: under 21, 21-50, and over 50. The engineers
then recorded the drivers’ speeds at a designated point on a highway in the state. The
subjects were unaware that their speed was being recorded. The following one-way
ANOVA output was generated from the sample data. Based upon this output, it is
possible that a Type II statistical error has been committed if the null hypothesis is
tested at the alpha equal 0.05 level.
ANOVA: Single Factor
A golf course in California has determined that the mean time it takes for a foursome to
complete an 18 hole round of golf is 4 hours 35 minutes (275 minutes) with a standard
deviation of 14 minutes. The time distribution is also thought to be approximately
normal. Every month, the head pro at the course randomly selects a sample of 8
foursomes and monitors the time it takes them to play. Suppose the mean time that was
observed for the sample last month was 4 hours 44 minutes (284 minutes). What is the
probability of seeing a sample mean this high or higher?
A) Approximately 0.4649
B) About 0.9649
C) Approximately 0.0351
D) About 0.9298
A company that fills soft drinks into bottles has established an -chart and an R-chart to
monitor the average fill level in the bottles. To do this, the company has taken a series
of samples of size n = 4 bottles. The overall average fill is 12.03 ounces. The average
range for the subgroups has been .06 ounces. Suppose, after developing the control
chart, a subgroup of size 4 yields a sample mean of 12.09 ounces and a range of .08,
which of the following statements is true?
A) The process is in control on both the -chart and the R-chart.
B) The process is out of control on the R-chart but in control on the -chart.
C) The process is out of control on the -chart but in control on the R-chart.
D) The process is out of control on both the -chart and the R-chart.
A professor hands out survey forms during her classes, where the population is all
students attending the college. This is an example of:
A) a convenience sample.
B) a simple random sample.
C) a stratified sample.
D) a cluster sample.
Contingency analysis is used only for numerical data.
When σ is unknown, the margin of error is computed by using:
A) normal distribution.
B) t-distribution.
C) the mean of the sample.
D) The margin of error is also unknown.
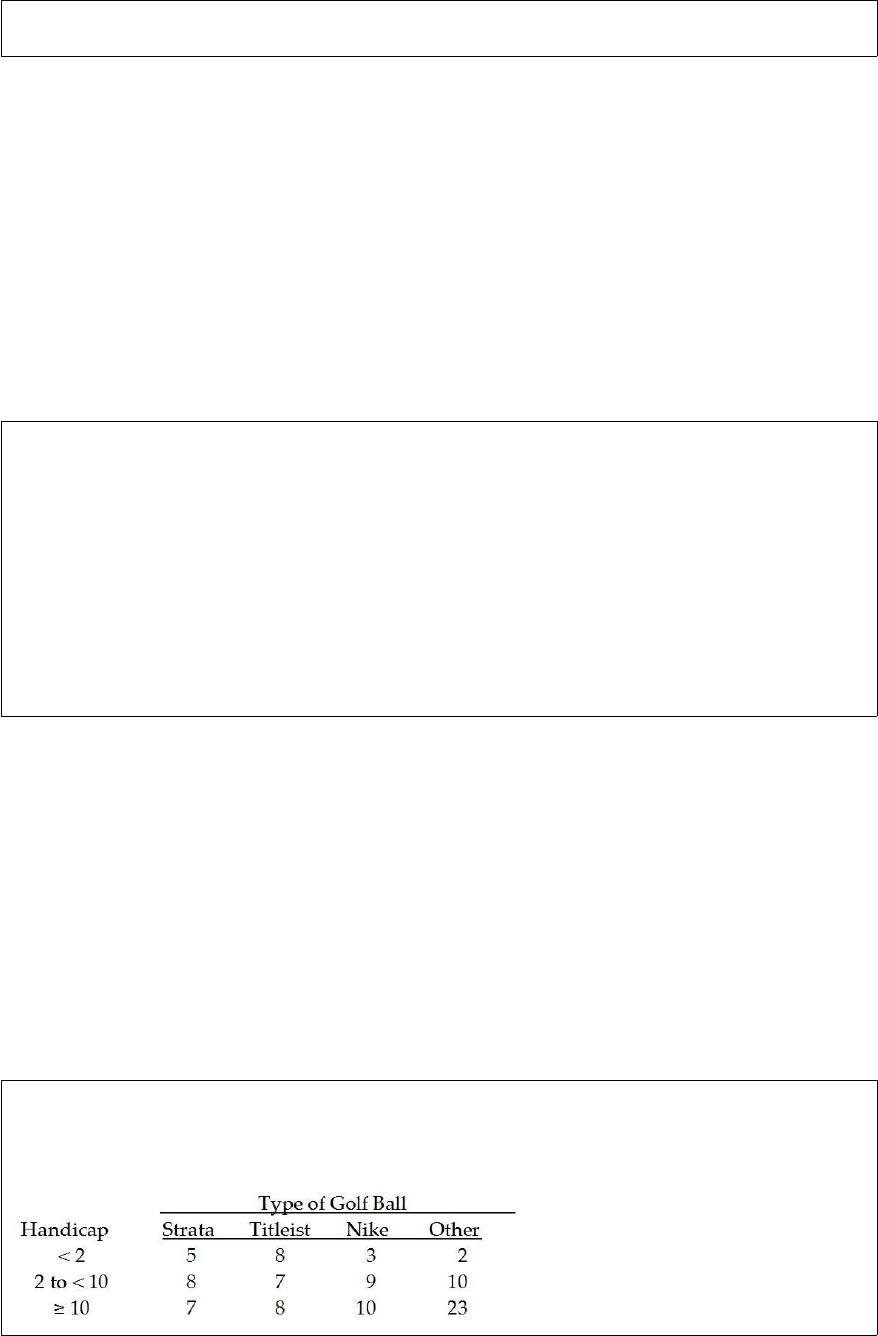
The managers of a local golf course have recently conducted a study of the types of golf
balls used by golfers based on handicap. A joint frequency table for the 100 golfers
covered in the survey is shown below:
Based on these data, the probability that a player will use a Strata golf ball is:
A) 0.15
B) 0.20
C) 0.18
D) None of the above
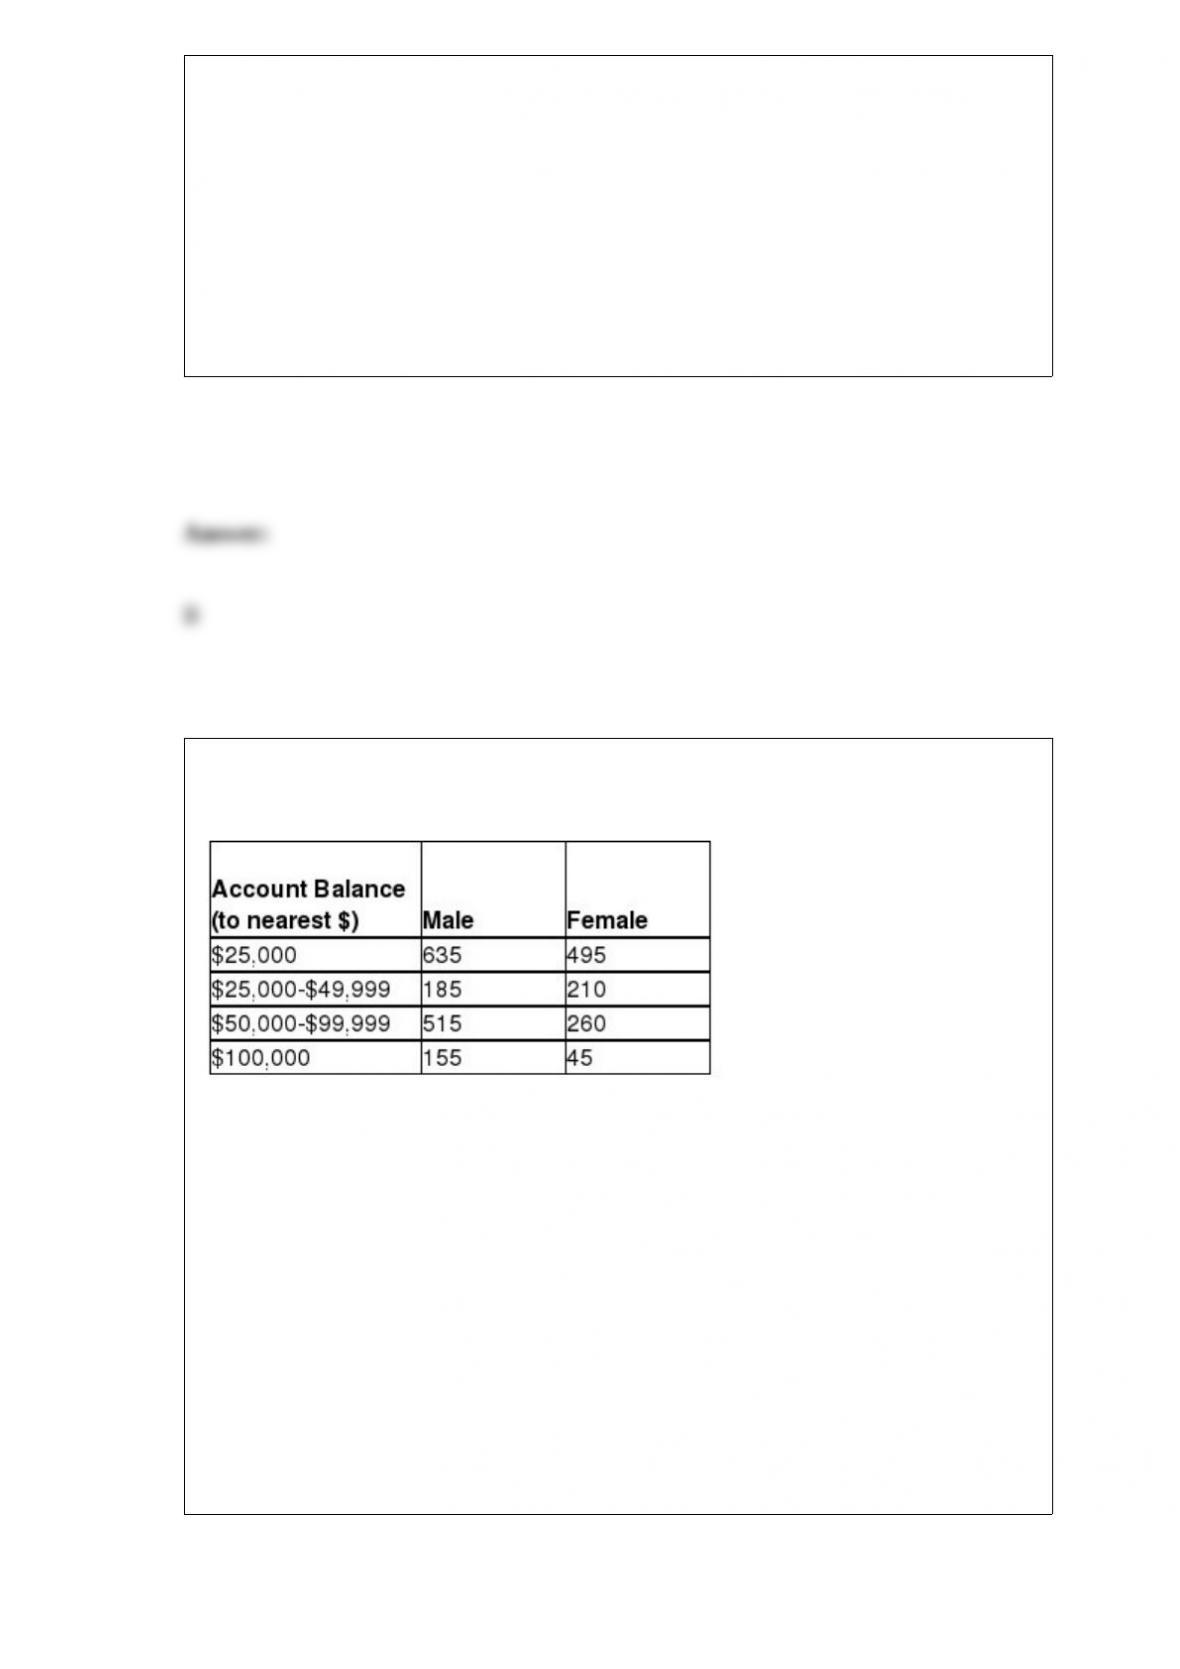
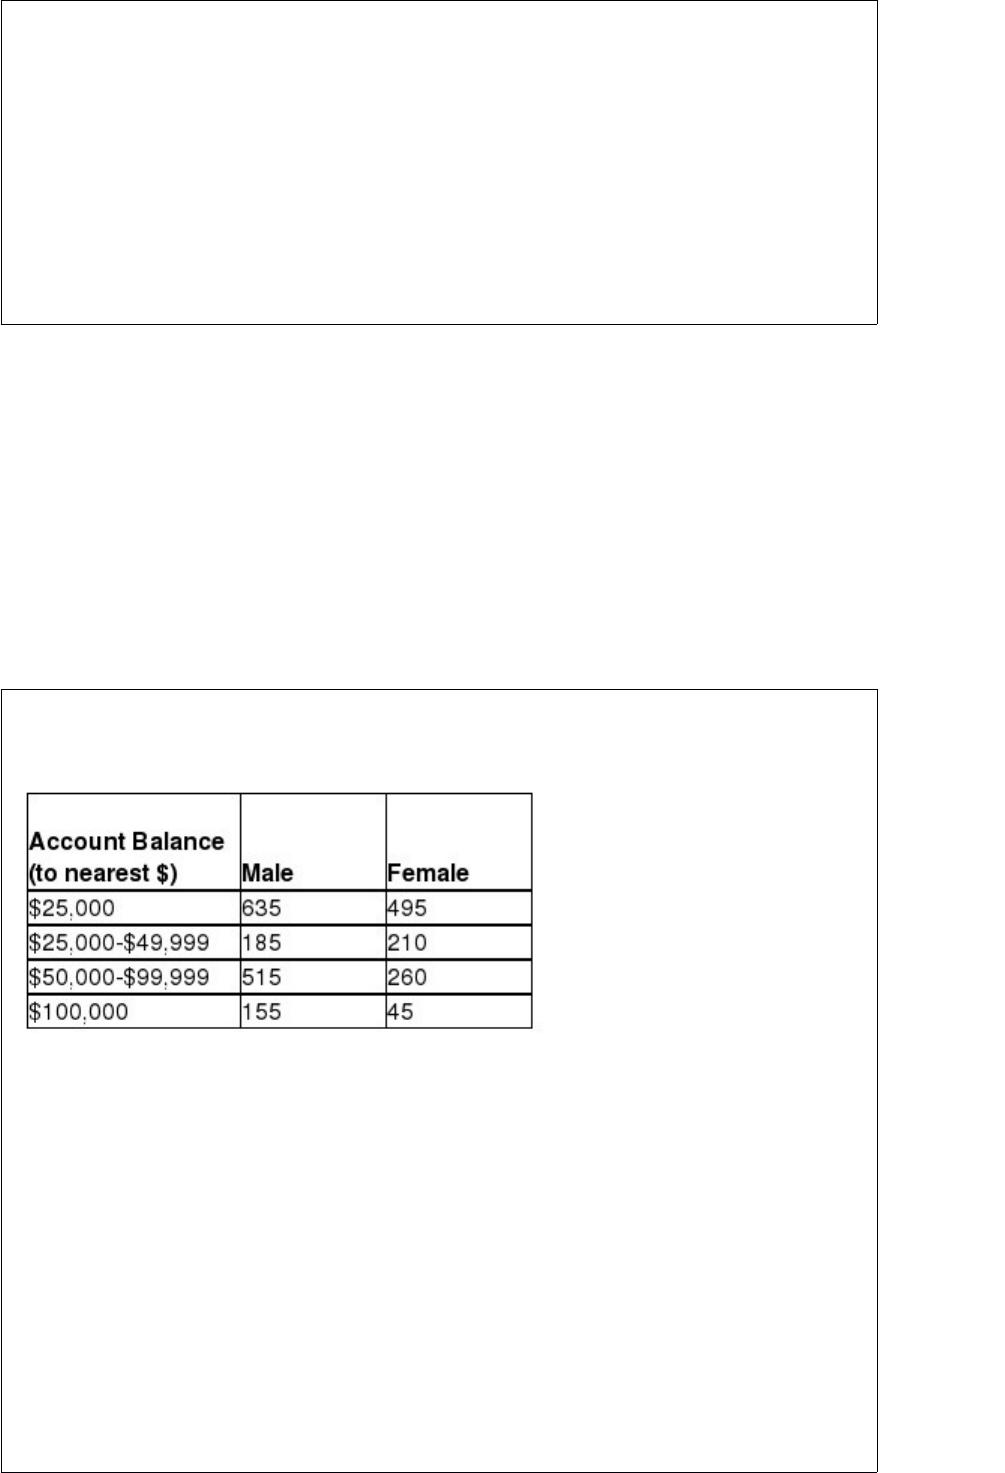
The results of a census of 2,500 employees of a mid-sized company with 401(k)
retirement accounts are as follows:
Suppose researchers are going to sample employees from the company for further
study.
Based on the relative frequency assessment method, what is the probability that a
randomly selected employee will be a female?
A) 0.1580
B) 0.1040
C) 0.6160
D) 0.4040


Suppose that a group of 10 people join a weight loss program for 3 months. Each
person’s weight is recorded at the beginning and at the end of the 3-month program. To
test whether the weight loss program is effective, the data should be treated as:
A) independent samples using the normal distribution.
B) paired samples using the t-distribution.
C) independent samples using the t-distribution.
D) independent proportions.
Employees at a large computer company earn sick leave in one-minute increments
depending on how many hours per month they work. They can then use the sick leave
time any time throughout the year. Any unused time goes into a sick bank account that
they or other employees can use in the case of emergencies. The human resources
department has determined that the amount of unused sick time for individual
employees is uniformly distributed between 0 and 480 minutes. Based on this
information, what is the probability that an employee will have less than 20 minutes of
unused sick time?
A) 0.002
B) 0.966
C) 0.063
D) 0.042


A large retail company gives an employment screening test to all prospective
employees. If a prospective employee receives a report saying that she scored at the
40th percentile:
A) she scored above the median.
B) she scored better than 40 percent of people who took the test.
C) she scored in the top 40 percent of people who took the test.
D) her z-score was a 40.
Which of the following in not an out of control signal for an x-bar chart?
A) One or more points outside the control limits
B) Seven or more consecutive points that all fall on the same side of the center line
C) Six or more consecutive points moving in the same direction (an upward or
downward trend)
D) Fourteen points in a row, alternating up and down


Recently, an automobile insurance company performed a study of a random sample of
15 of its customers to determine if there is a positive relationship between the number
of miles driven and the age of the driver. The sample correlation coefficient is r = .38.
Given this information, and assuming that the test is to be performed at the .05 level of
significance, which of the following is the correct test statistic?
A) t = 1.4812
B) t = 1.7709
C) z = 2.114
D) t = 1.74
A potato chip manufacturer has found that in the past the standard deviation of bag
weight has been 0.2 ounce. They want to test whether the standard deviation has
changed. The null hypothesis is:
A) H0 : σ2 = 0.2
B) H0 : σ = 0.2
C) H0 : σ = 0.04
D) H0 : σ2 = 0.04

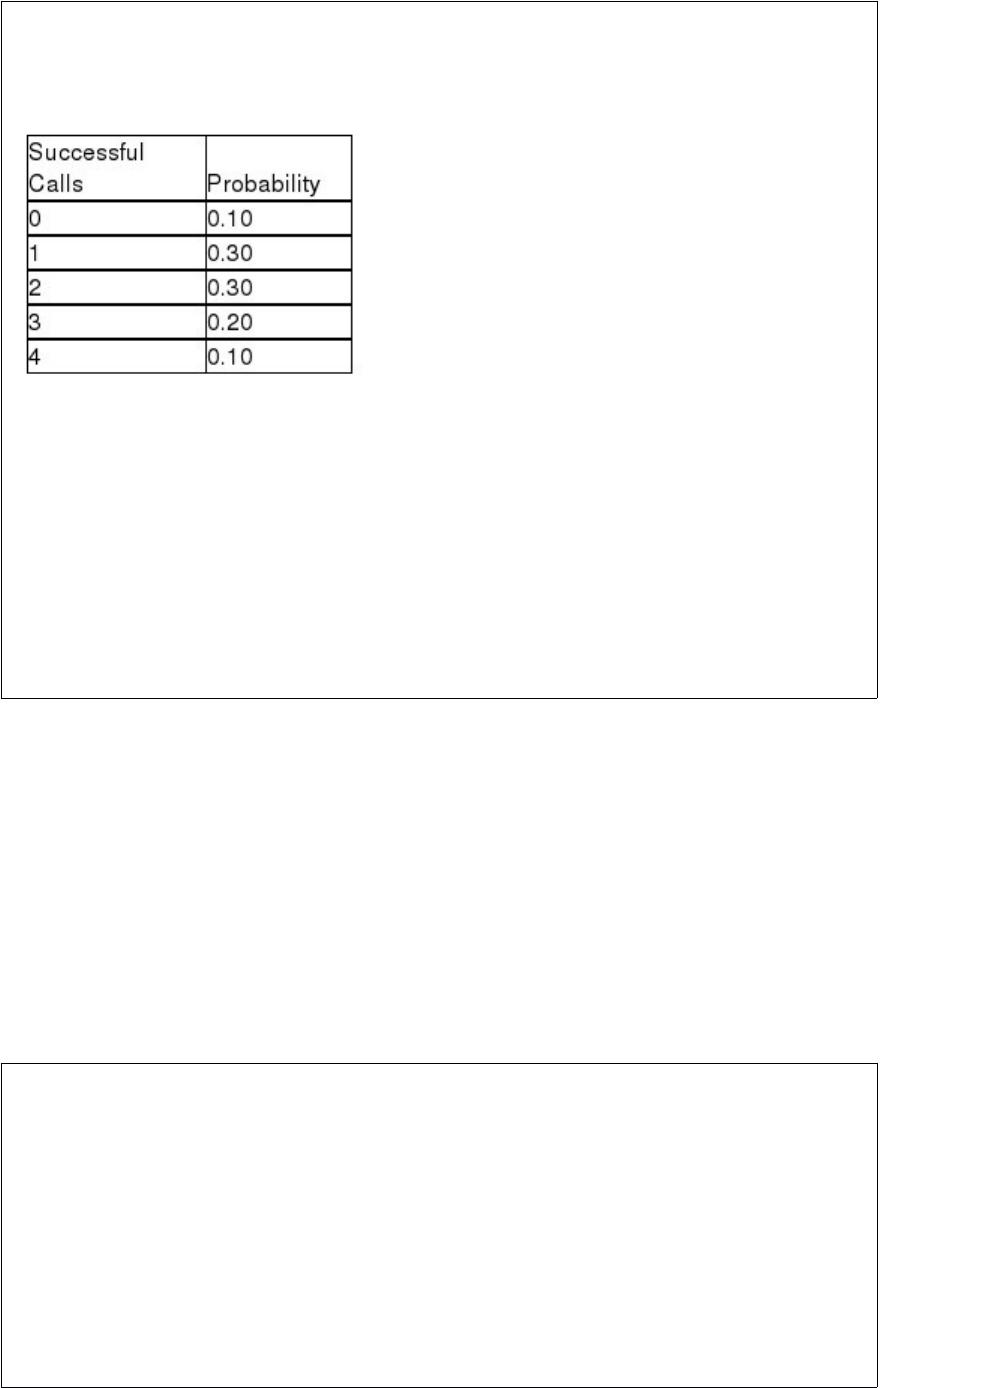
A sales rep for a national clothing company makes 4 calls per day. Based on historical
records, the following probability distribution describes the number of successful calls
each day:
The expected number of successful sales calls per day is:
A) 2.00
B) 1.15
C) 1.90
D) 2.50
Which of the following is not a required step in finding beta?
A) Assuming a true value of the population parameter where the null is false
B) Finding the critical value based on the null hypothesis
C) Converting the critical value from the standard normal distribution to the units of the
data
D) Finding the power of the test
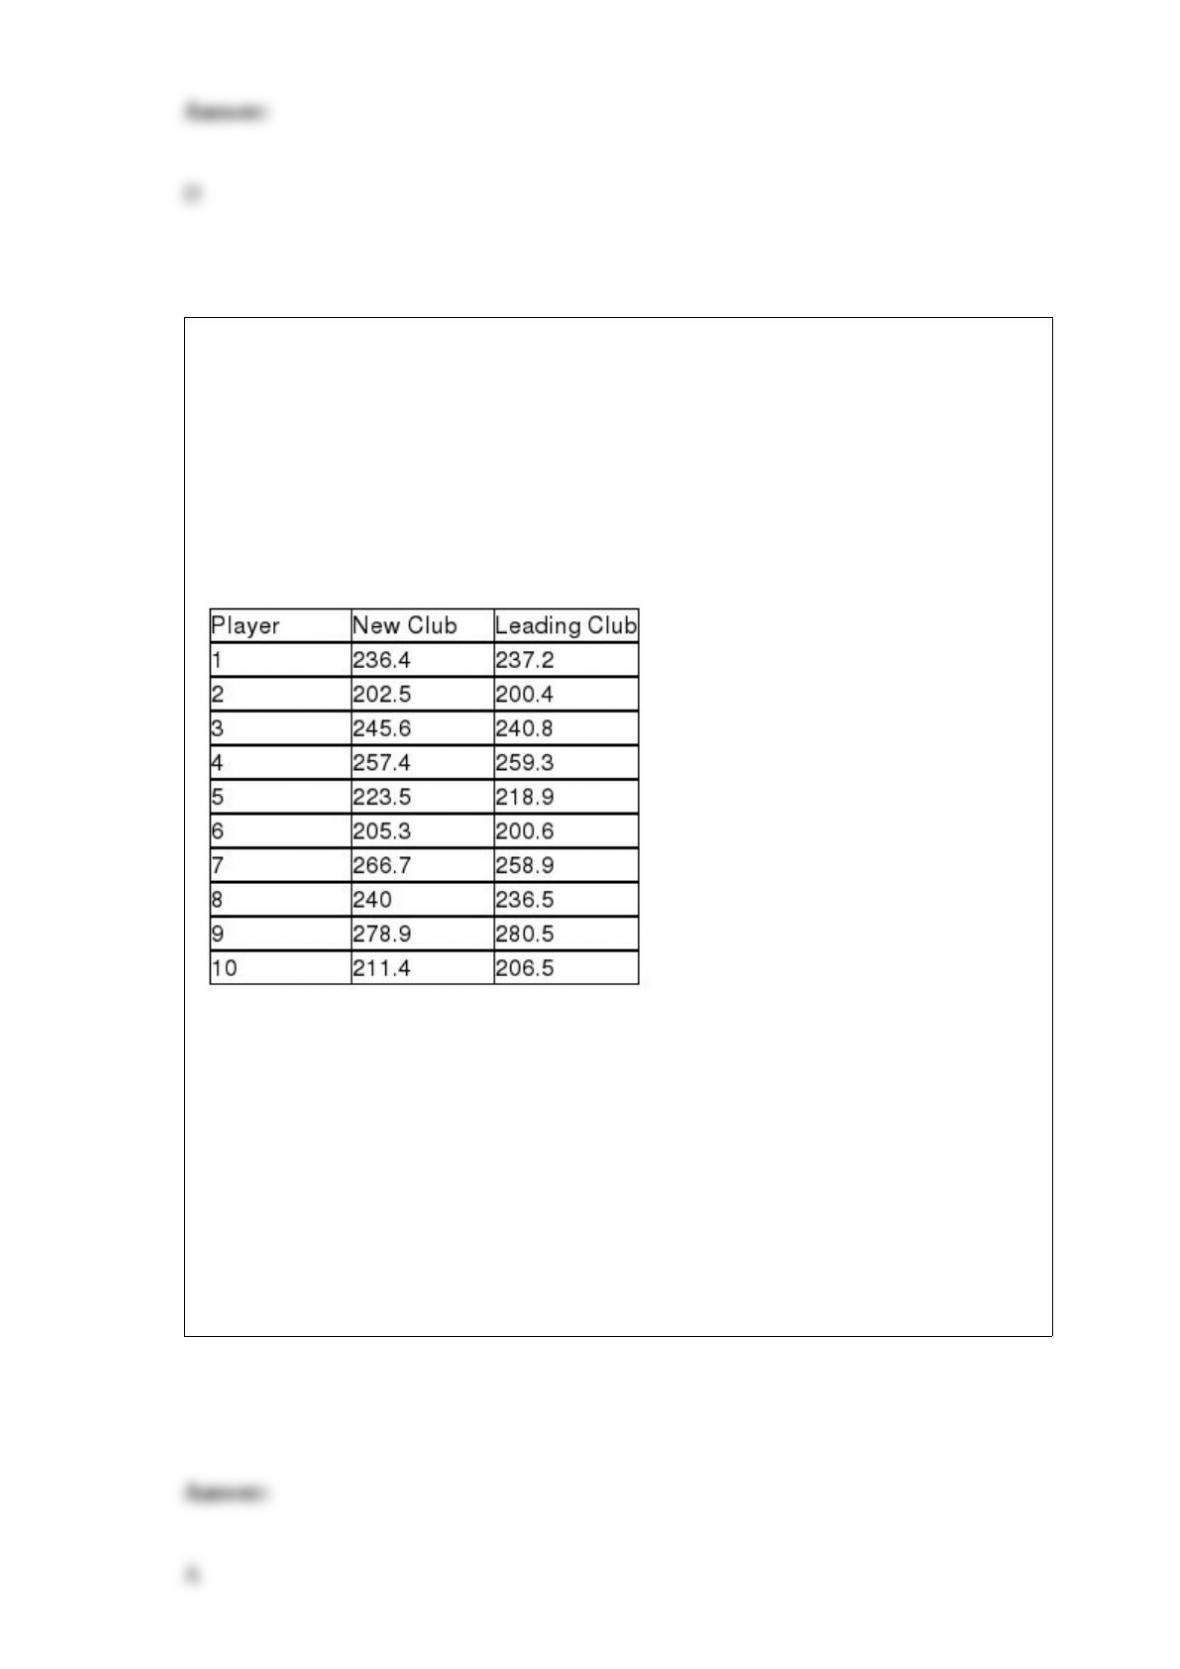
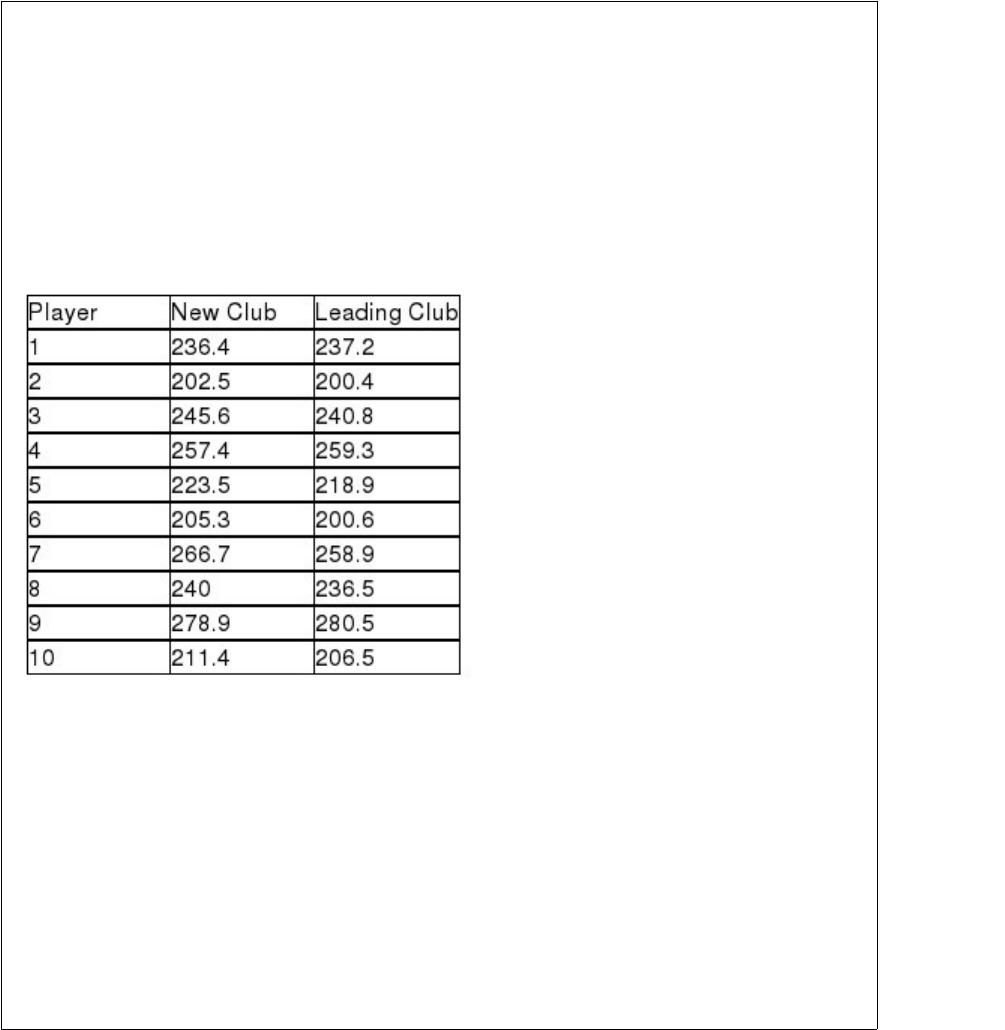
Most companies that make golf balls and golf clubs use a one-armed robot named “Iron
Byron” to test their balls for length and accuracy, but because of swing variations by
real golfers, these test robots don’t always indicate how the clubs will perform in actual
use. One company in the golfing industry is interested in testing its new driver to see if
has greater length off the tee than the best-selling driver. To do this, it has selected a
group of golfers of differing abilities and ages. Its plan is to have each player use each
of the two clubs and hit five balls. It will record the average length of the drives with
each club for each player. The resulting data for a sample of 10 players is:
Based on these sample data, what is the point estimate for the difference between the
mean distance for the new driver versus the leading driver?
A) 2.81
B) 1.55
C) -3.45
D) 233.4


At the end of the school term, students are asked to rate the course and instructor by
indicating on a scale of 1-5 how well they liked the course. The data generated from
this question are examples of ordinal data.
What sample size is needed to estimate a population mean within 50 of the true mean
value using a confidence level of 95%, if the true population variance is known to be
122,500?
A) 211
B) 155
C) 214
D) 189
A chi-square test for goodness-of-fit is used to test whether or not there are any
preferences among 3 brands of peas. If the study uses a sample of n = 60 subjects, then
the expected frequency for each category would be:
A) 20
B) 30
C) 60


D) 33
Assume P(A) = 0.4 and P(B) = 0.2 and P(A and B) = 0.1, then the probability of P(A or
B) = 0.7.
A randomly selected value from a normal distribution is found to be 2.1 standard
deviations above its mean. What is the probability that a randomly selected value from
the distribution will be less than 2.1 standard deviations from the mean?
A) 0.9488
B) 0.9821
C) 0.9976
D) 0.9712
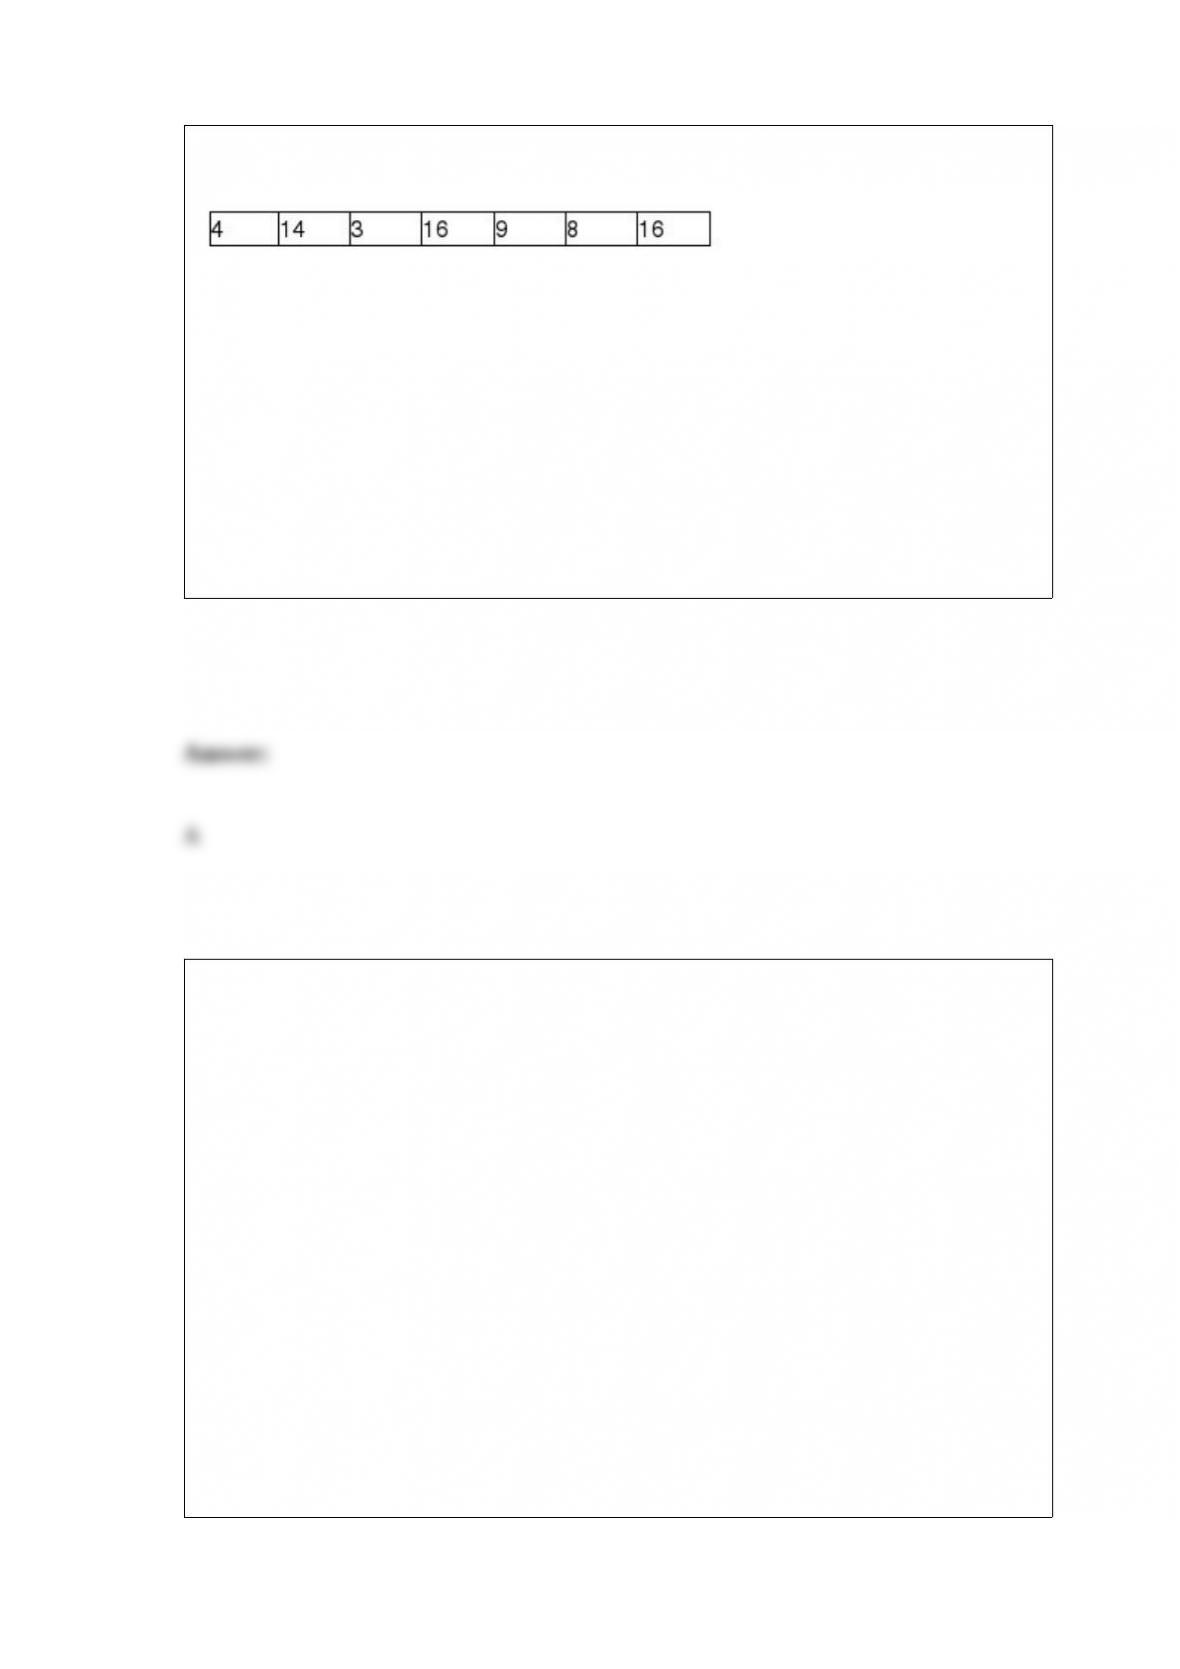
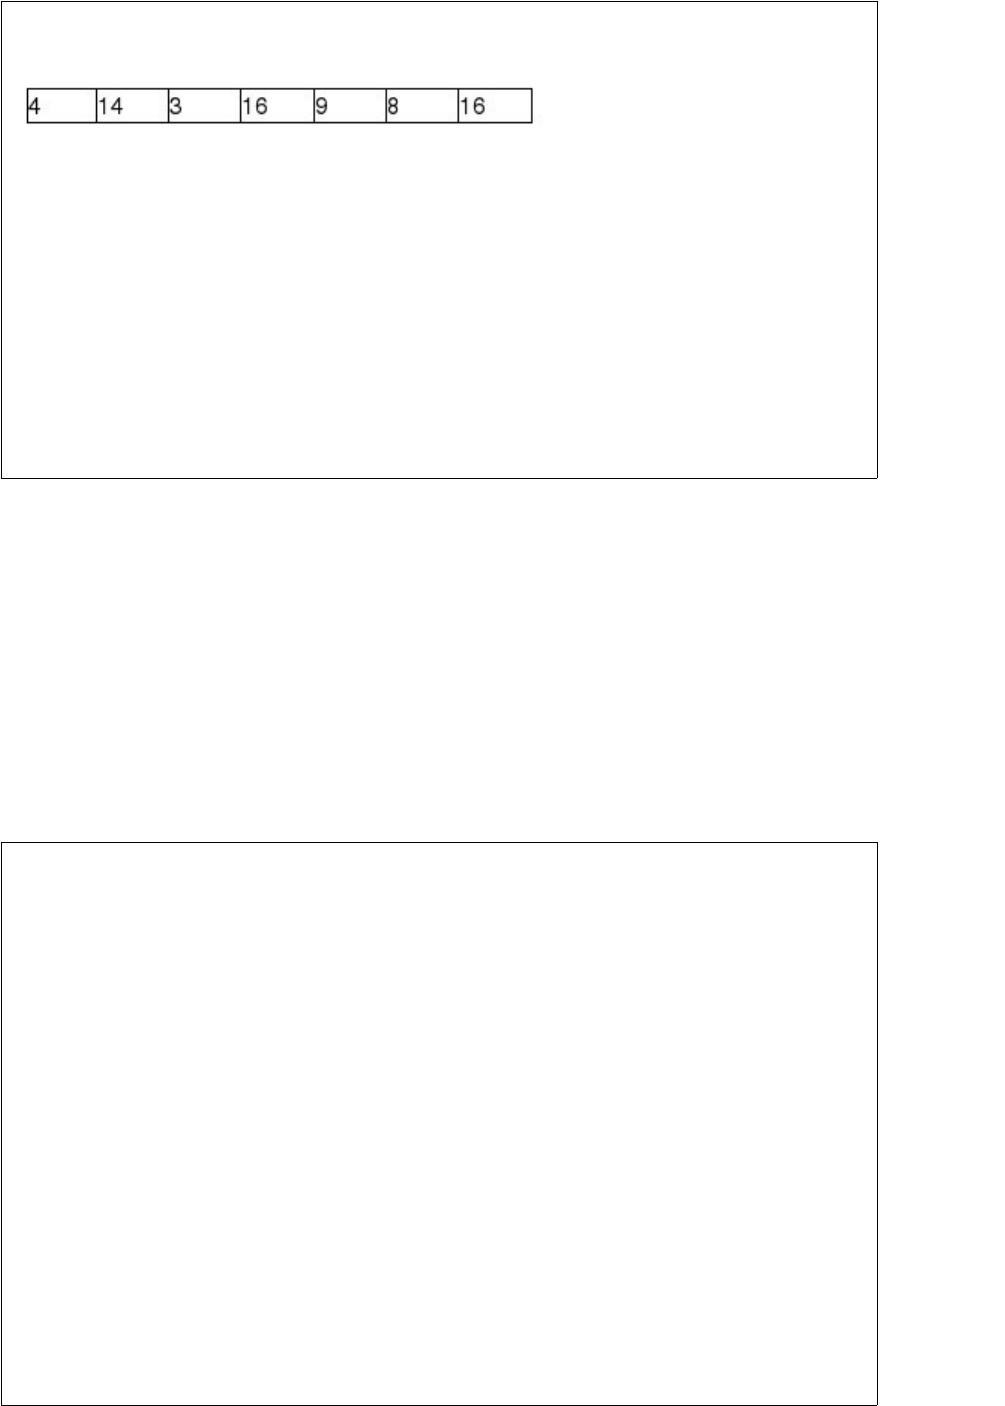
A small company has 7 employees. The numbers of years these employees have worked
for this company are shown as follows:
Based upon this information, the median number of years that employees have been
with this company is:
A) 9 years.
B) 16 years.
C) 10 years.
D) 14 years.
Many people believe that they can tell the difference between Coke and Pepsi. Other
people say that the two brands can’t be distinguished. To test this, a random sample of
20 adults was selected to participate in a test. After being blindfolded, each person was
given a small taste of either Coke or Pepsi and asked to indicate which brand soft drink
it was. Suppose 14 people correctly identified the soft drink brand. Which of the
following conclusions would be warranted under the circumstance?
A) Since the chance of getting 14 correct is 0.0370, which is quite small, the study
shows that people are not able to identify brands effectively.
B) Since the probability of getting 14 or more correct is 0.0577, which is quite low, this
means that people are not effective in identifying the soft drink brand.
C) Since the probability of getting 14 or more correct is 0.0577, which is quite low, the
conclusion could be that people are effective at identifying soft drink brands.
D) The expected value for this binomial distribution is very close to 14 so this supports
that people cannot tell the difference.


The monthly electrical utility bills of all customers for the Far East Power and Light
Company are known to be distributed as a normal distribution with mean equal to
$87.00 a month and standard deviation of $36.00. If a statistical sample of n = 100
customers is selected at random, what is the probability that the mean bill for those
sampled will exceed $75.00?
A) -0.33
B) Approximately 0.63
C) About 1.00
D) 3.33
If you were going to develop a scatter plot for the purpose of determining whether one
of the assumptions of the regression model is being satisfied, which of the following is
true?
A) The plot should illustrate a bell-shaped distribution to show that the residuals are
normally distributed.
B) The horizontal axis should show the fitted values for the dependent variable.
C) The plot should illustrate a cone shaped look.
D) The points should fall in a straight line.


Suppose a study of 196 randomly sampled privately insured adults with incomes over
200% of the current poverty level is to be used to measure out-of-pocket medical
expenses for prescription drugs for this income class. The sample data are in the file
Drug Expenses.
Based on the sample data, construct a 95% confidence interval estimate for the mean
annual out-of-pocket expenditures on prescription drugs for this income class. Interpret
this interval.
A) (162.08, 172.96)
B) (163.50, 171.54)
C) (164.19, 170.85)
D) (161.97, 173.07)
United Manufacturing and Supply makes sprinkler valves for use in residential
sprinkler systems. United supplies these valves to major companies such as Rain Bird
and Nelson, who in turn sell sprinkler products to retailers. United recently entered into
a contract to supply 40,000 sprinkler valves. The contract called for at least 97% of the
valves to be free of defects. Before shipping the valves, United managers tested 200
randomly selected valves and found 190 defect-free valves in the sample. The managers
wish to know the probability of finding 190 or fewer defect-free valves if in fact the
population of 40,000 valves is 97% defect-free. The probability is:
A) 0.0111
B) 0.0612
C) 0.0475


D) 0.0212
Dynamic random-access memory (DRAM) memory chips are made from silicon wafers
in manufacturing facilities through a very complex process called wafer fabs. The
wafers are routed through the fab machines in an order that is referred to as a recipe.
The wafers may go through the same machine several times as the chip is created. The
data file DRAM Chips contains a sample of processing times, measured in fractions of
hours, at a particular machine center for one chip recipe.
Compute the median processing time.
A) 0.31 minutes
B) 0.24 minutes
C) 0.21 minutes
D) 0.44 minutes
Men have a reputation for not wanting to ask for directions. A Harris study conducted
for Lincoln Mercury indicated that 42% of men and 61% of women would stop and ask
for directions. The U.S. Census Bureau’s 2012 population estimate was that for
individuals 18 or over, 48.2% were men and 51.8% were women. This exercise
addresses this age group.
A randomly chosen driver gets lost on a road trip. Determine the probability that the
driver is a woman and stops to ask for directions.
A) 0.518
B) 0.420
C) 0.316
D) 0.390
The cost of a college education has increased at a much faster rate than costs in general
over the past twenty years. In order to compensate for this, many students work part- or
full-time in addition to attending classes. At one university, it is believed that the
average hours students work per week exceeds 20. To test this at a significance level of
0.05, a random sample of n = 20 students was selected and the following values were
observed:
Based on these sample data, which of the following statements is true?
A) The standard error of the sampling distribution is approximately 3.04.
B) The test statistic is approximately t = 0.13.
C) The research hypothesis that the mean hours worked exceeds 20 is not supported by
these sample data.
D) All of the above are true.
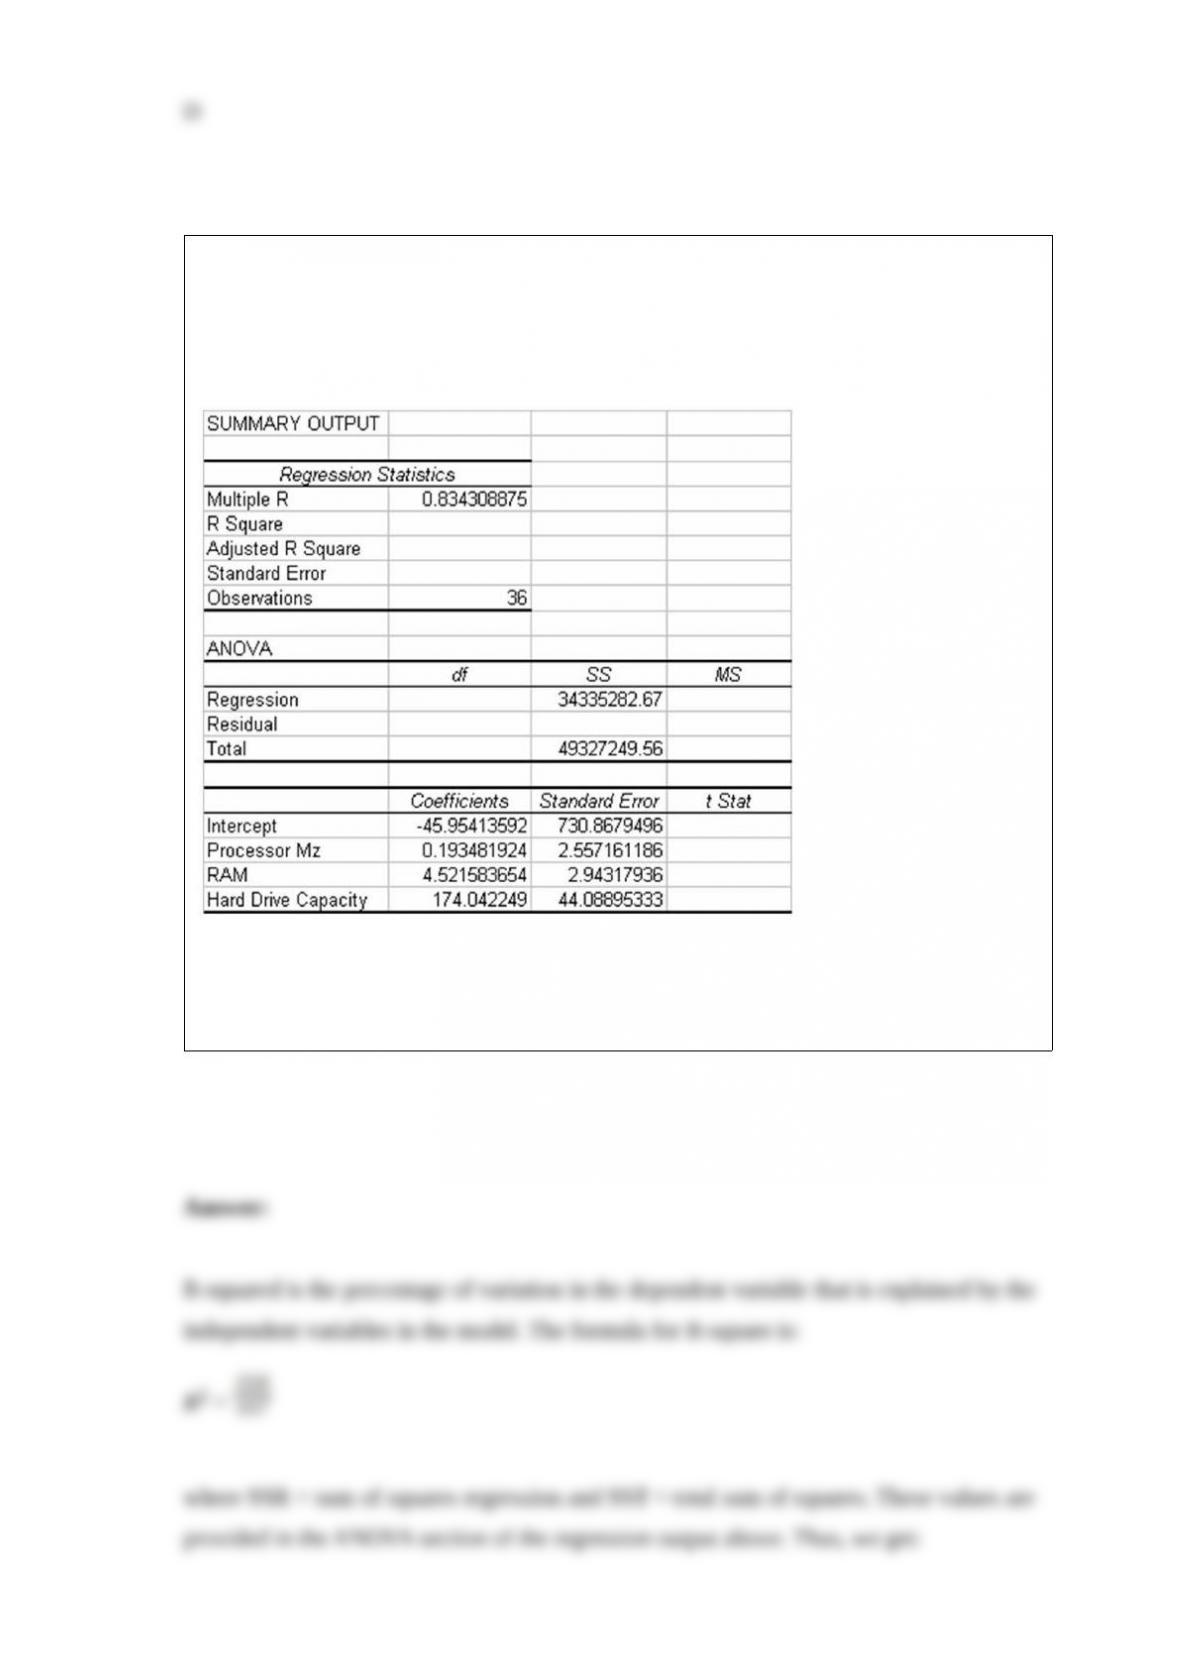
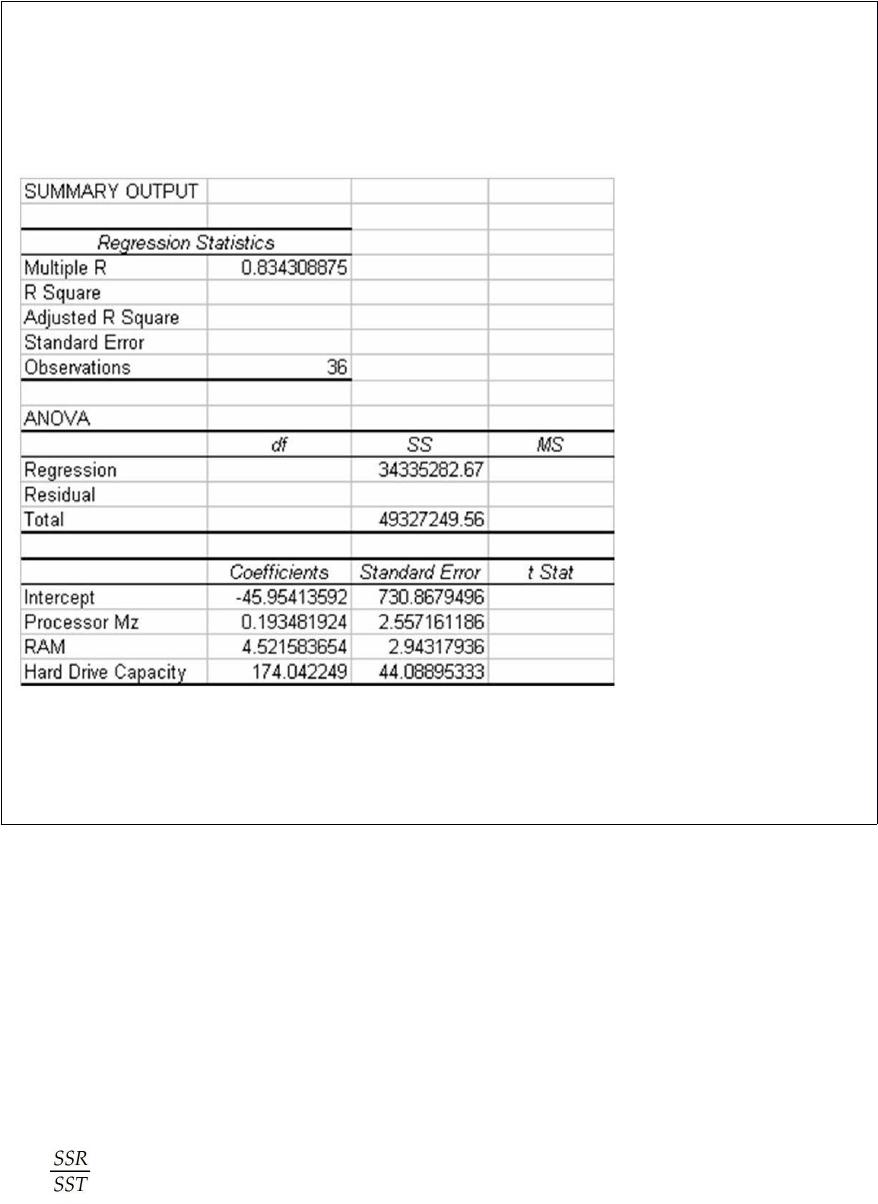
The following regression output is the result of a multiple regression application in
which we are interested in explaining the variation in retail price of personal computers
based on three independent variables, CPU speed, RAM, and hard drive capacity.
However, some of the regression output has been omitted.
Given this information and your knowledge of multiple regression, what percentage of
variation in the dependent variable is explained by the three independent variables in
the model?

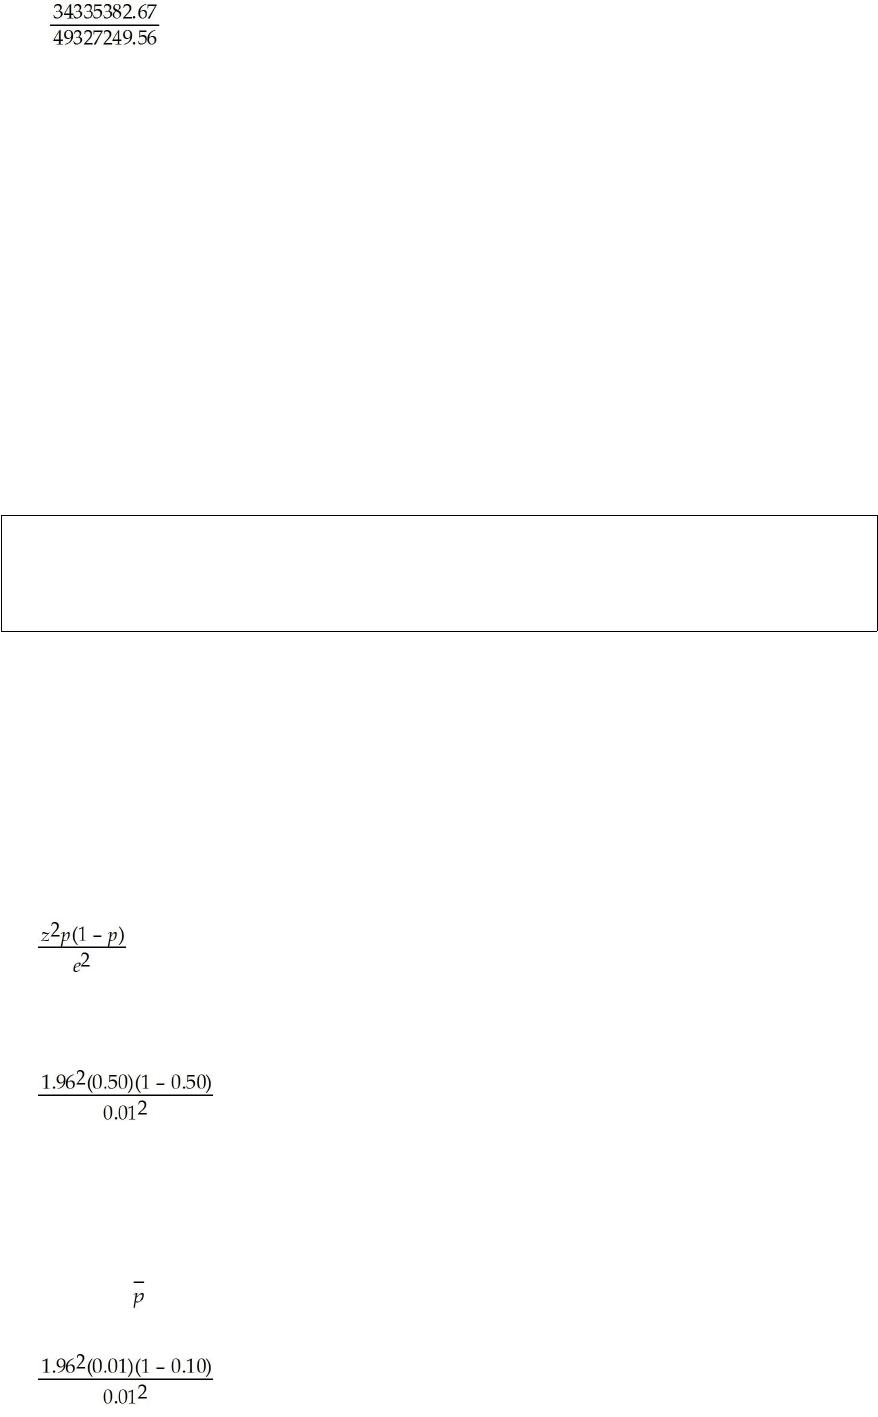
A human resources manager wishes to estimate the proportion of employees in her large
company who have supplemental health insurance. What is the largest size sample she
should select if she wants 95 percent confidence and a margin of error of 0.01?

Indicate why the Central Limit Theorem is so important in the application of statistical
analysis.
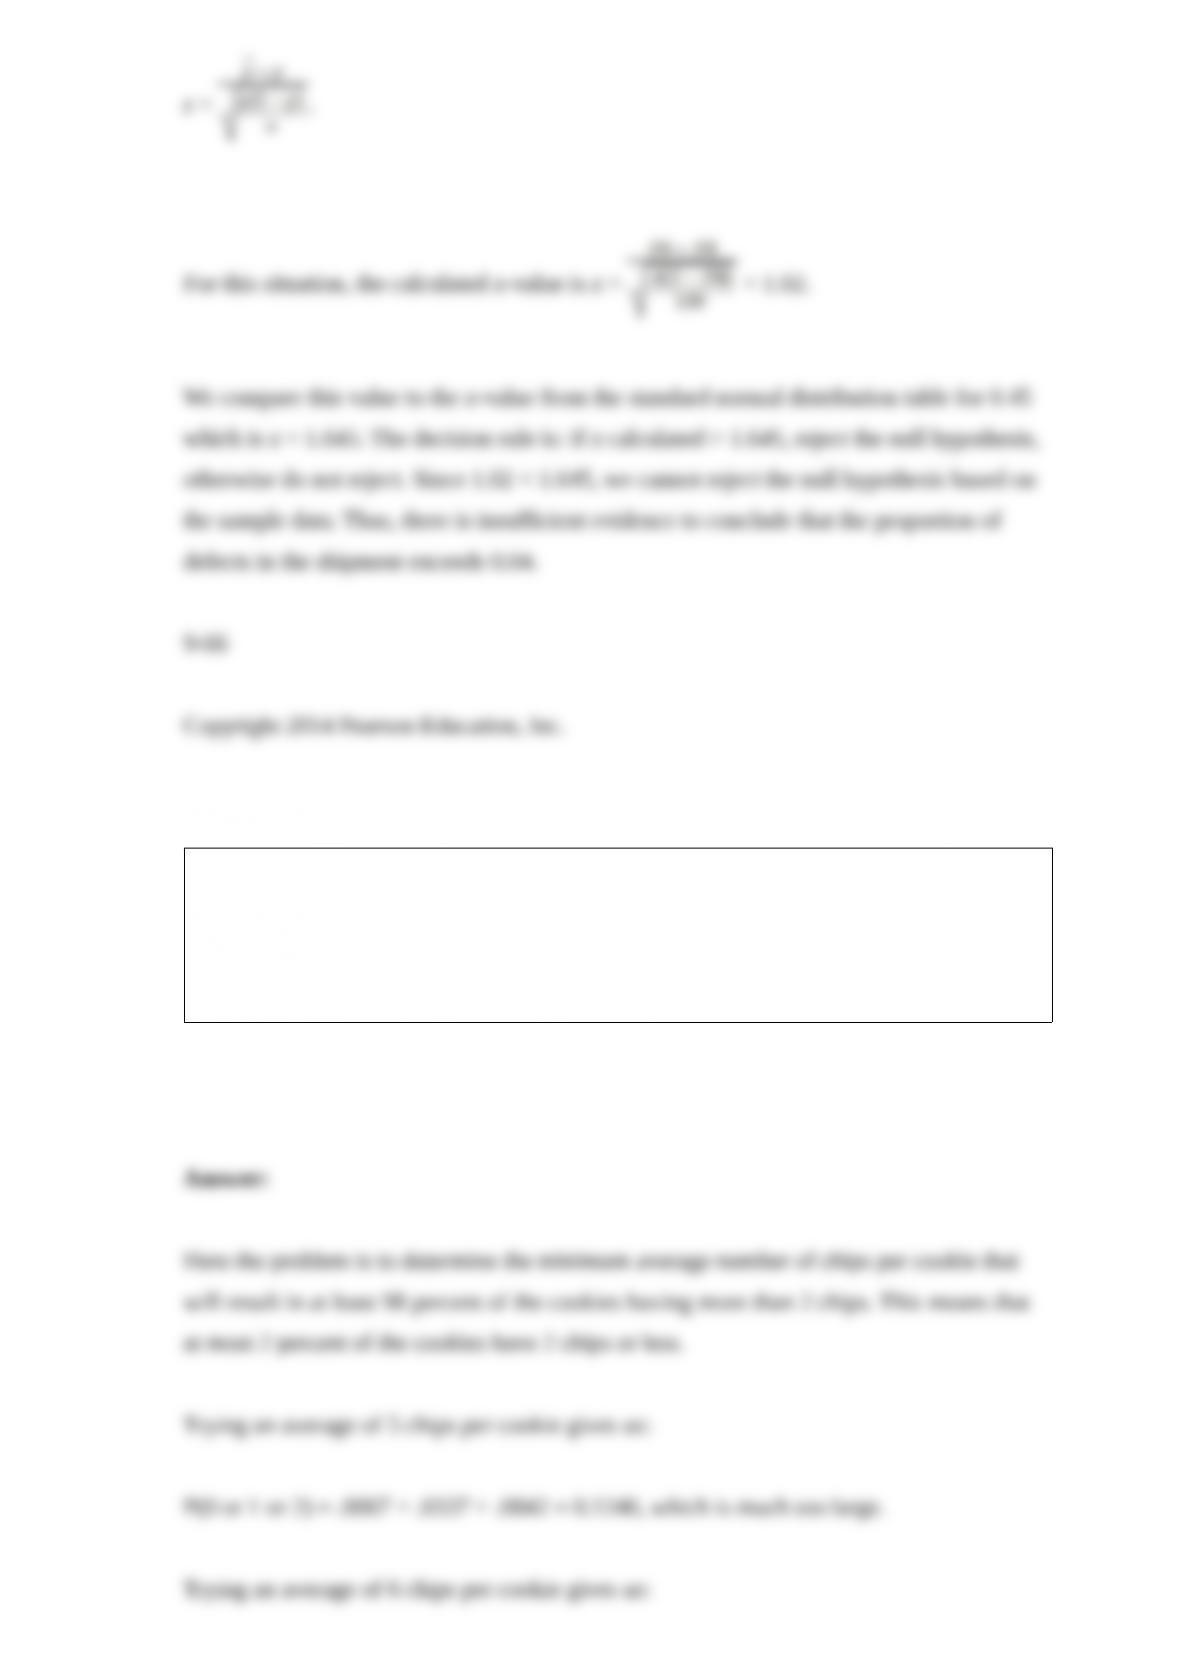
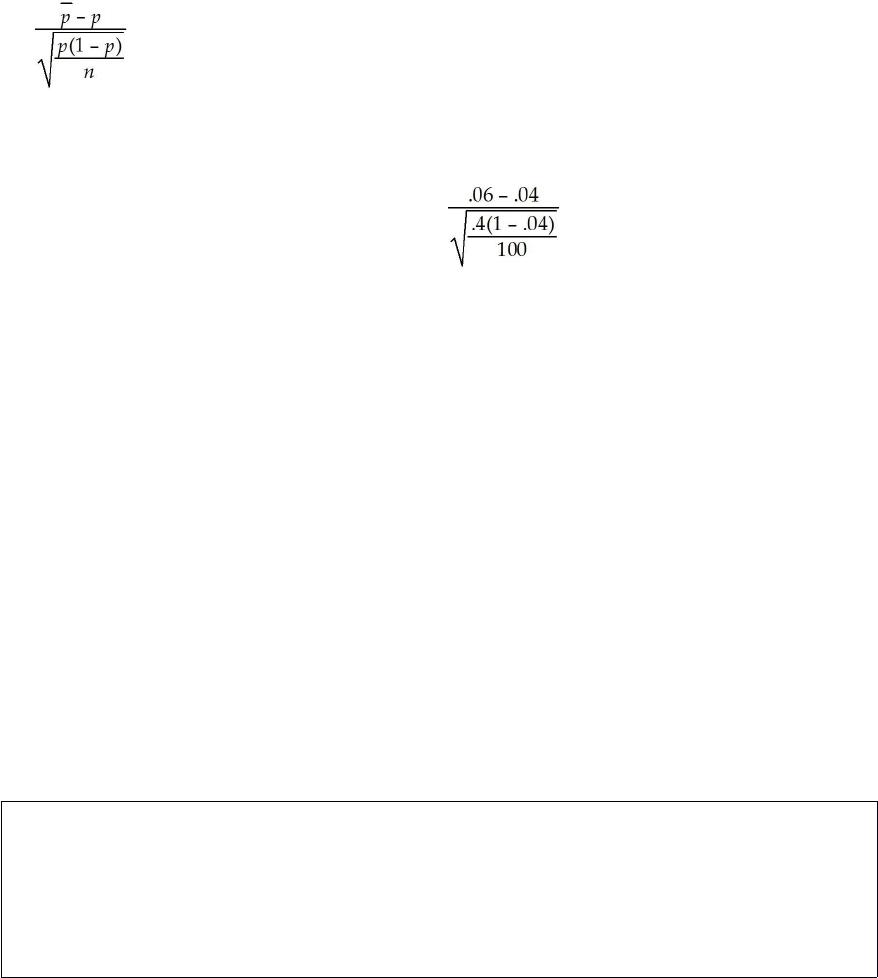
A contract with a parts supplier calls for no more than .04 defects in the large shipment
of parts. To test whether the shipment meets the contract, the receiving company has
selected a random sample of n = 100 parts and found 6 defects. If the hypothesis test is
to be conducted using a significance level equal to 0.05, what is the test statistic and
what conclusion should the company reach based on the sample data?
A company that makes chocolate chip cookies has found that the number of chips per
cookie follows a Poisson distribution. What should the minimum average number of
chips be to result in at least 98 percent of the cookies having more than 2 chips? Find
the minimum average to nearest whole chip (i.e. choose an average that is a whole
number).
The Good Food chain has a contract to receive eggs from a large egg producer. The
eggs come in lots of 4,000 dozen each week. The contract specifies that the rate of
broken or defective eggs should not exceed 8 percent. Each time a load comes in, Good
Food warehouse employees select a random sample of n = 100 eggs and check to see if
they are broken or defective. If Good Food wants no more than a 0.05 chance of
rejecting the shipment, what should the cut-off be in terms of proportion of broken or
defective eggs so that if the proportion is that value or more, the shipment will be
rejected?


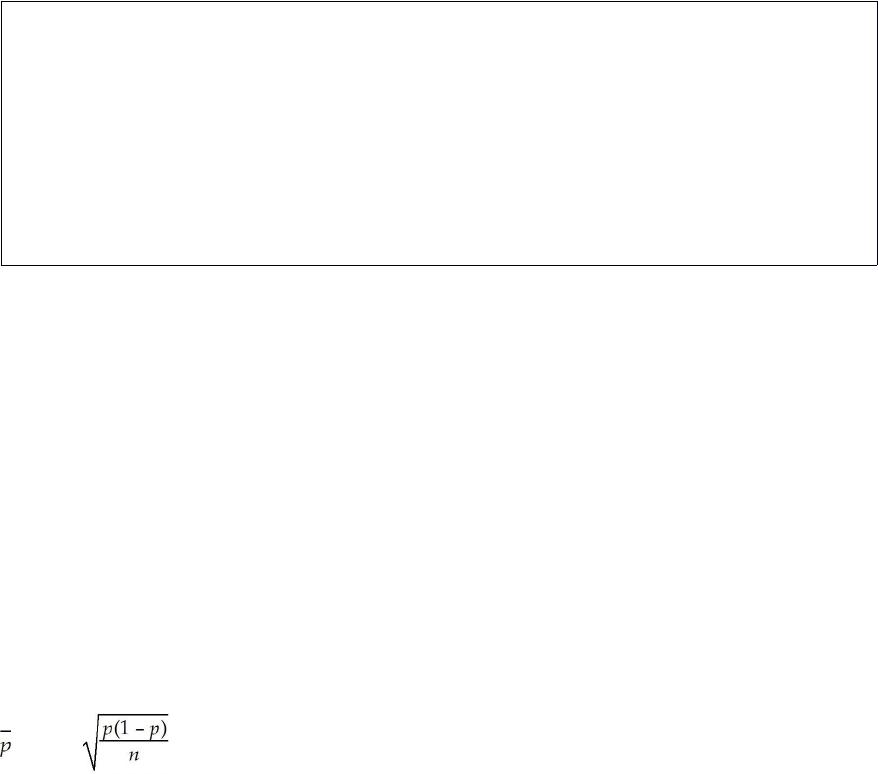
The Gordon Beverage Company bottles soft drinks using an automatic filling machine.
When the process is running properly, the mean fill is 12 ounces per can. The machine
has a known standard deviation of 0.20 ounces. Each day, the company selects a
random sample of 36 cans and measures the volume in each can. They then test to
determine whether the filling process is working properly. The test is conducted using a
0.05 significance level. Using the test statistic approach, what conclusion should the
company reach if the sample mean is 12.02 ounces? What type of statistical error may
have been committed?

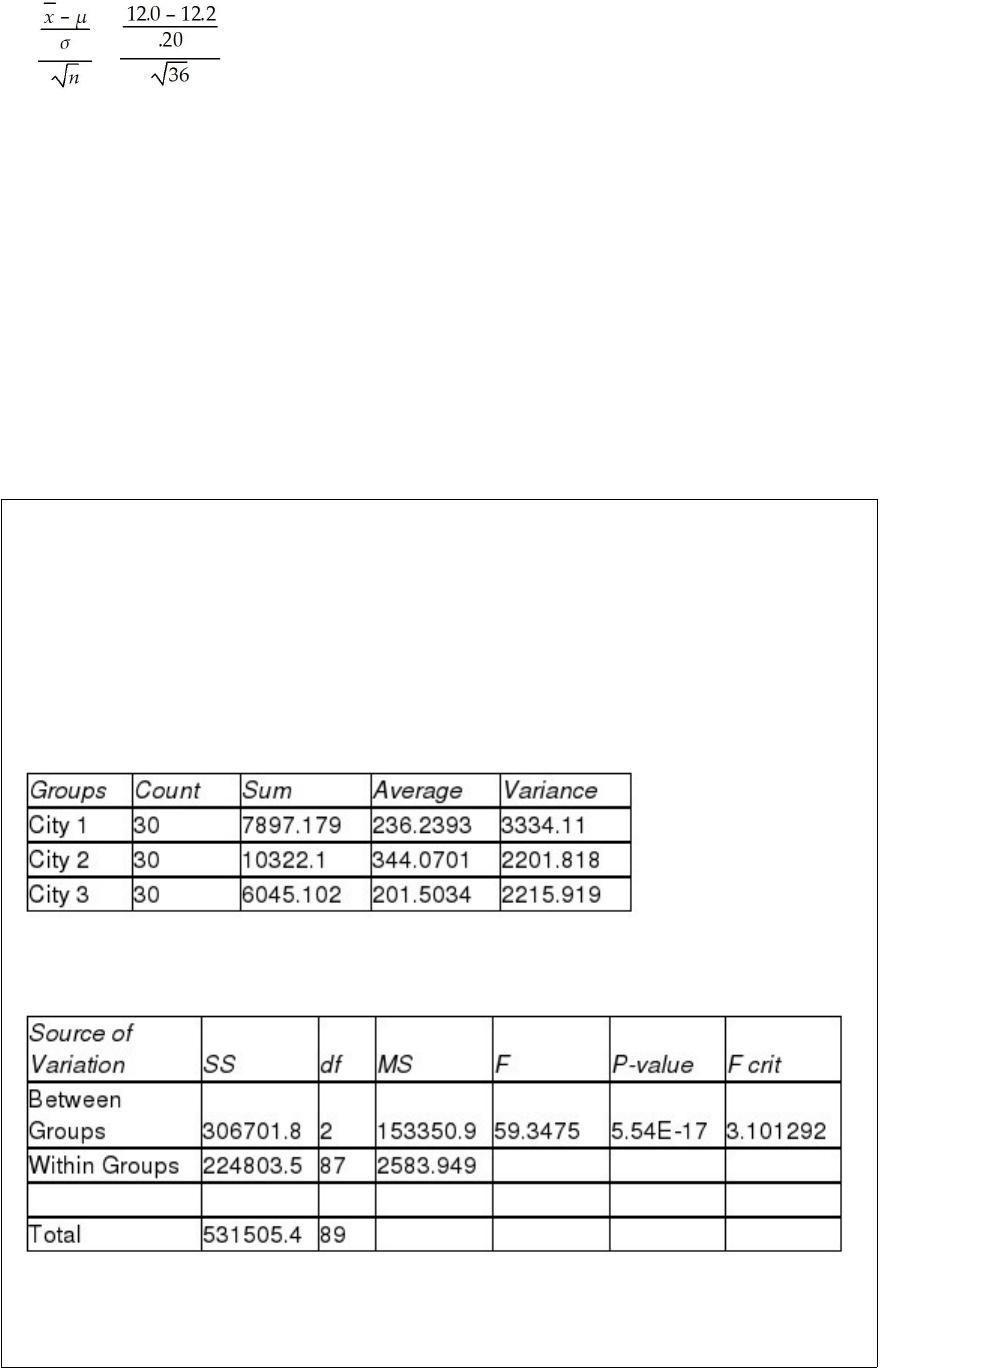
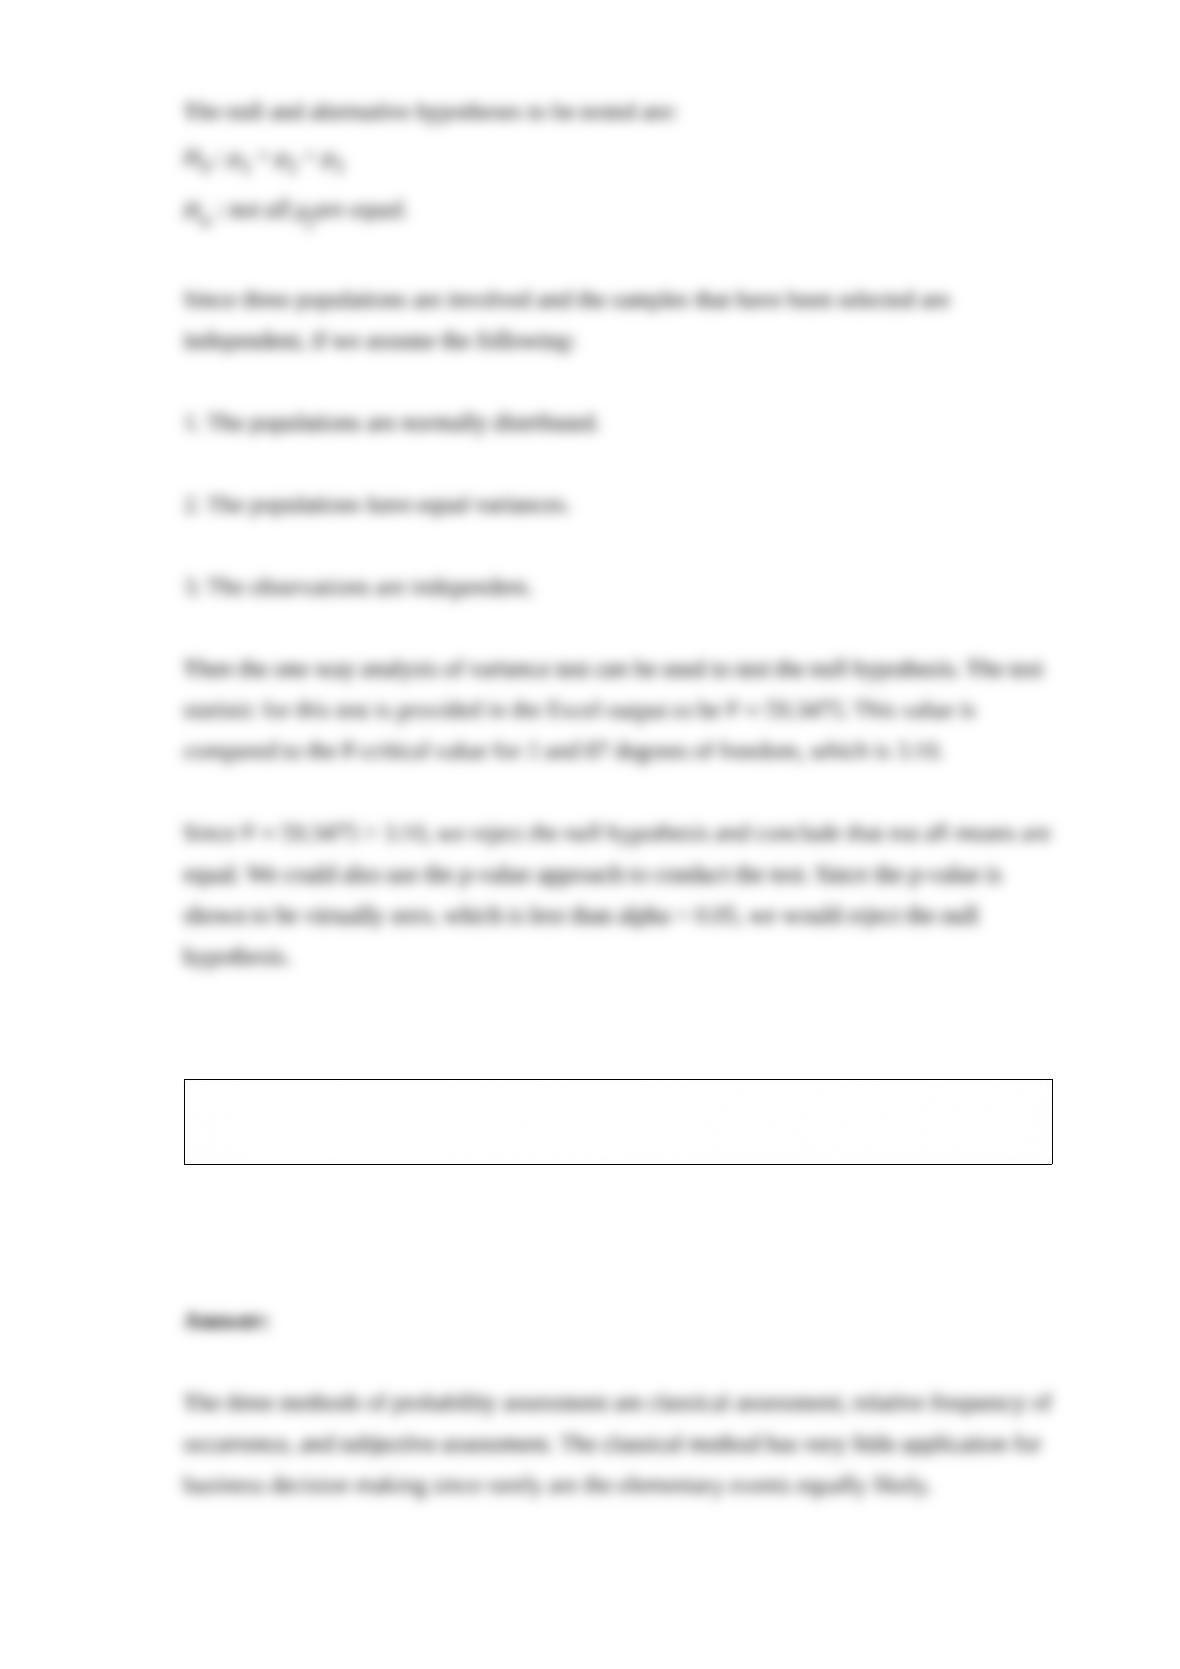
A study has been conducted to determine whether the mean spending for recreational
activities during the month of August differs for residents of three cities. Random
samples of 30 people were selected from each city and their spending on recreation was
recorded during August. The following output was generated using Excel:
ANOVA: Single Factor
SUMMARY
ANOVA
Based on the information provided, should we conclude that the three populations
(cities) have equal mean spending during August? Test at the 0.05 level of significance.

List three methods of assessing probabilities and indicate which is least likely to be
used in business decision making.


Suppose that you have a data set of 512 observations and the data values range from 36
to 187. What classes would you choose for this data set? Explain why you would
choose these values.
Is there ever a reason why we might prefer to work with a sample rather than with an
entire population? Discuss.

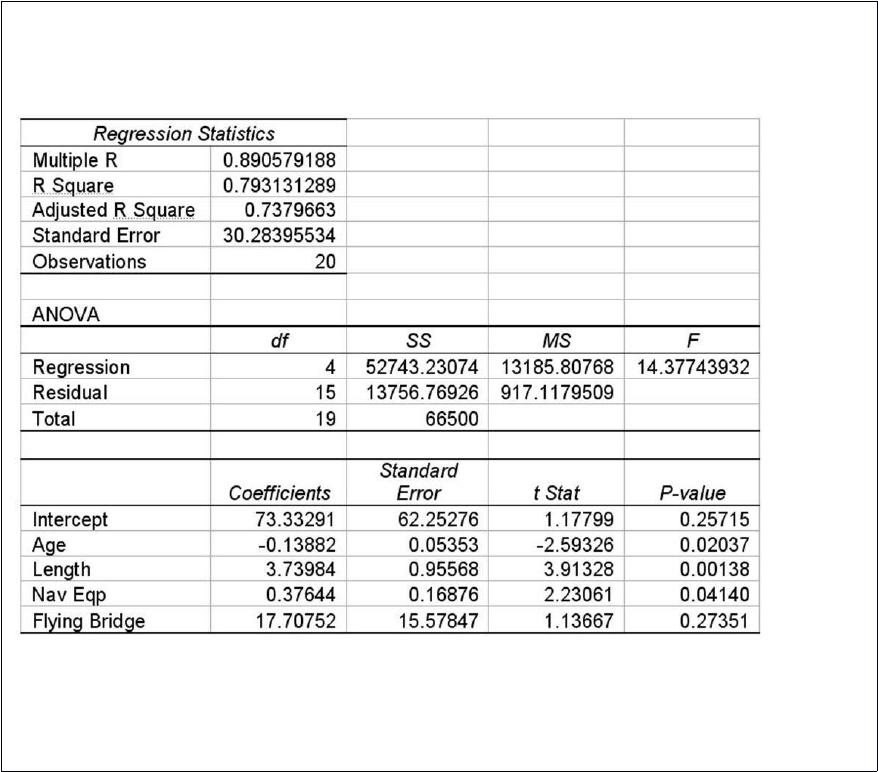
The following multiple regression was conducted to attempt to predict the price of
yachts based on the independent variables shown.
Given this information and your knowledge of multiple regression, conduct the
appropriate test to determine whether the overall regression model is statistically
significant at the 0.05 level of significance using the critical value method.

Explain what is meant by interaction between two factors in a two-way analysis of
variance study.
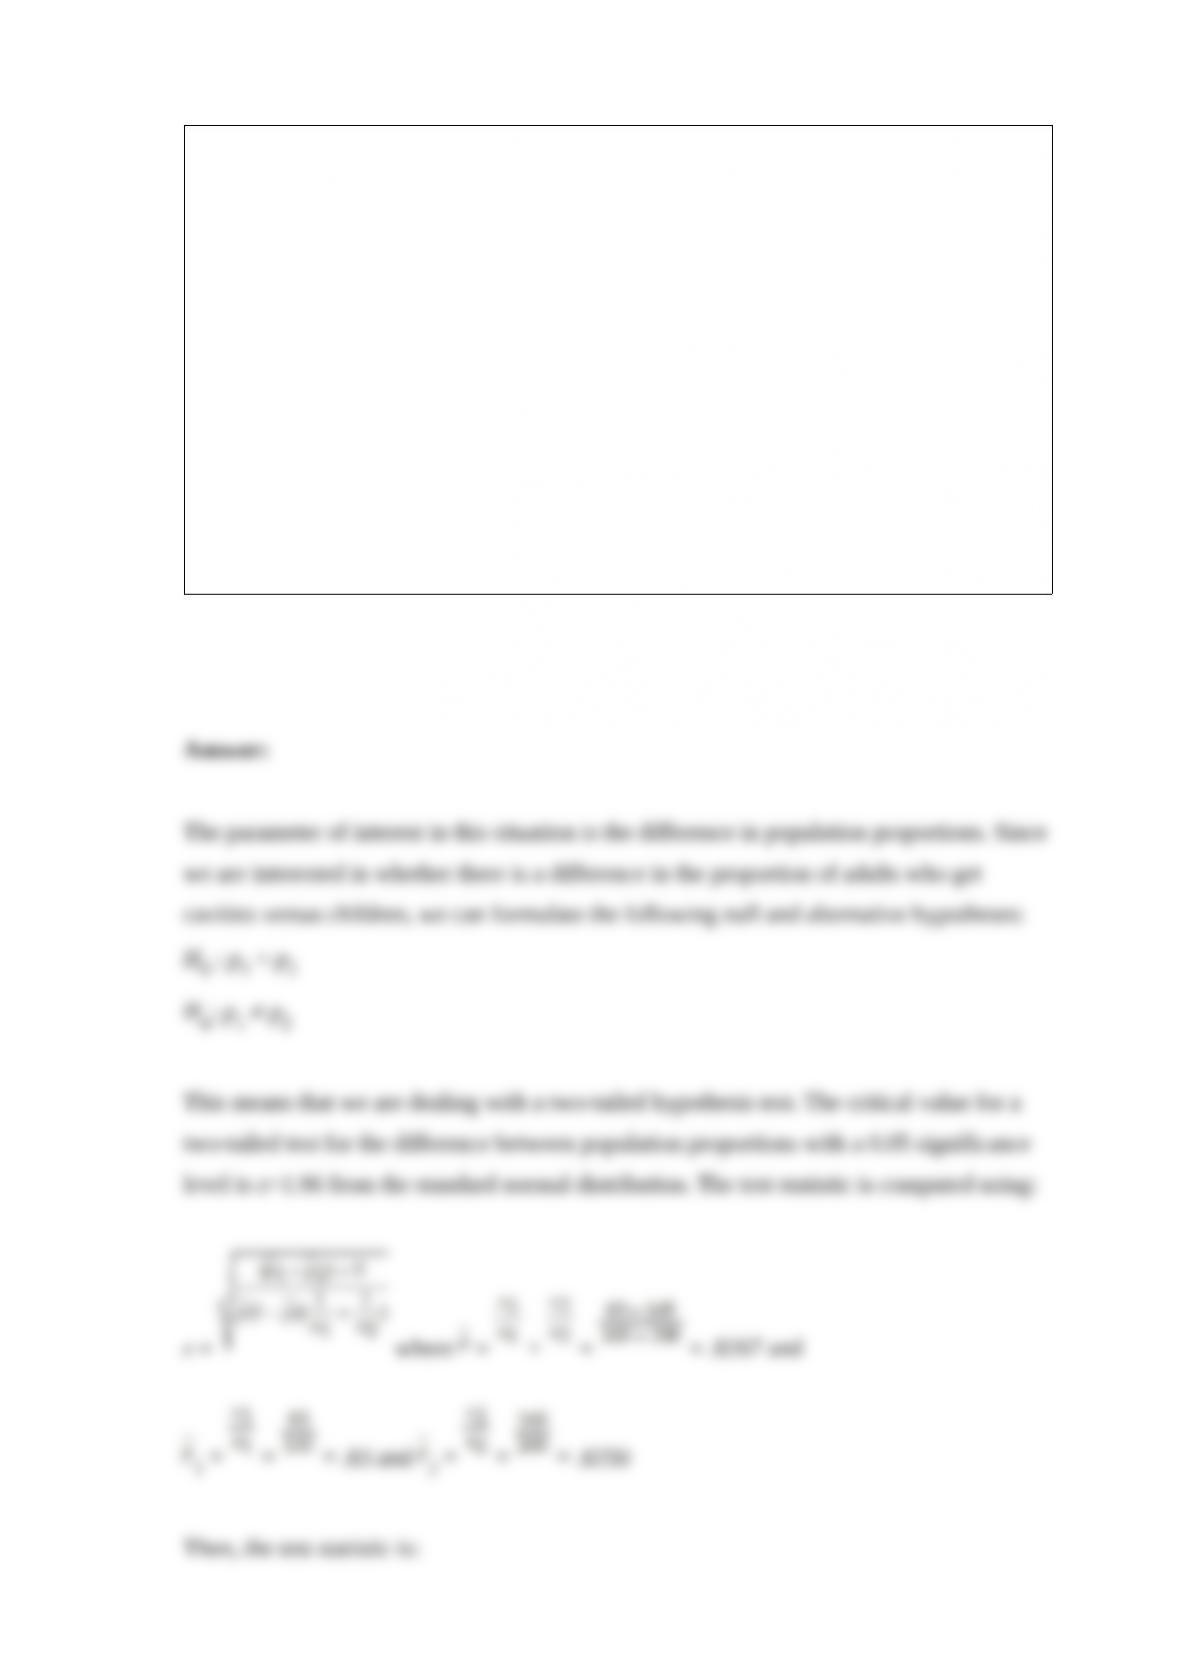
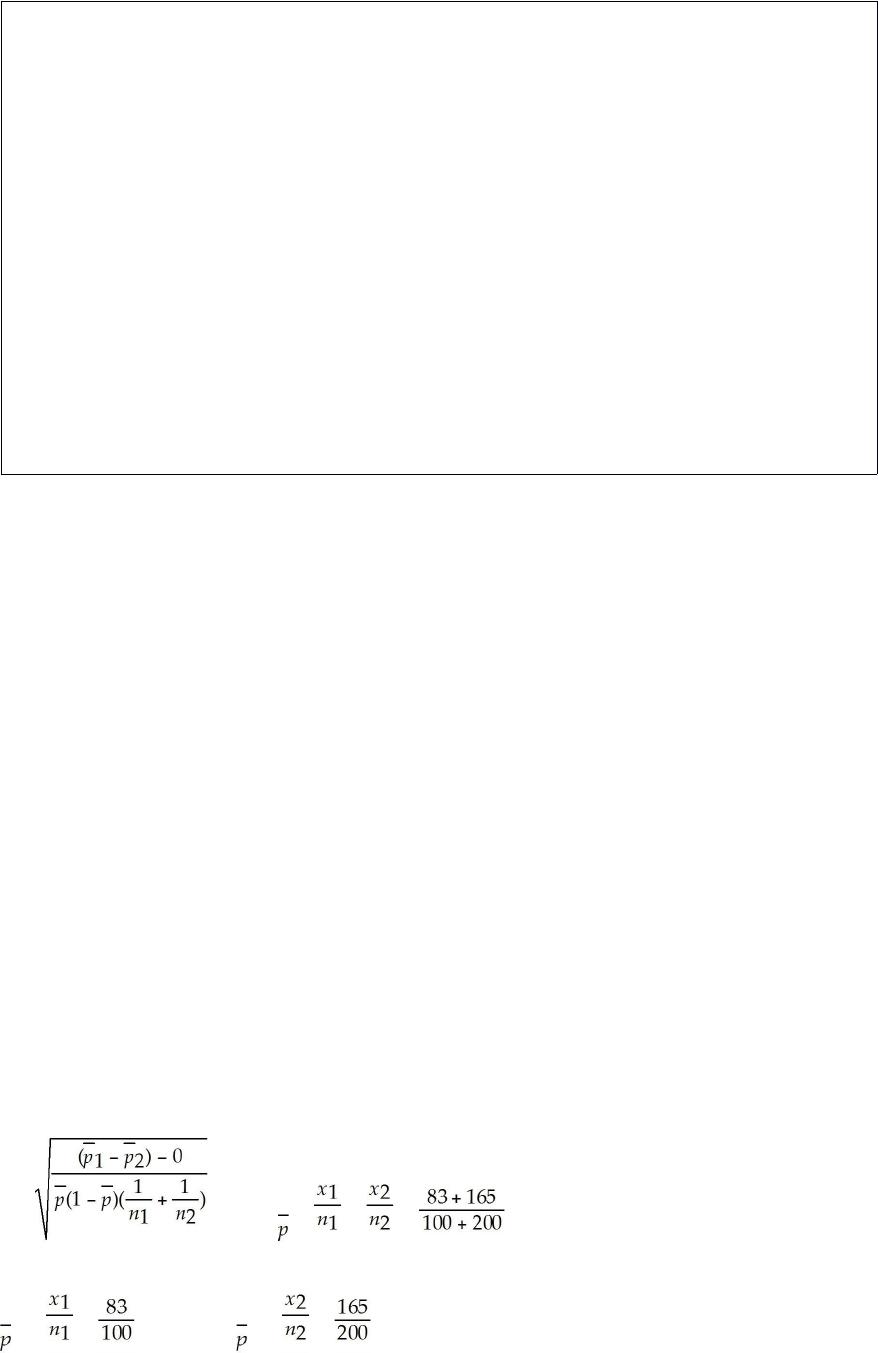
A maker of toothpaste is interested in testing whether the proportion of adults (over age
18) who use its toothpaste and have no cavities within a six-month period is any
different from the proportion of children (18 and under) who use the toothpaste and
have no cavities within a six-month period. To test this, it has selected a sample of
adults and a sample of children randomly from the population of those customers who
use their toothpaste. The following results were observed.
Adults Children
Sample size 100 200
Number with 0 cavities 83 165
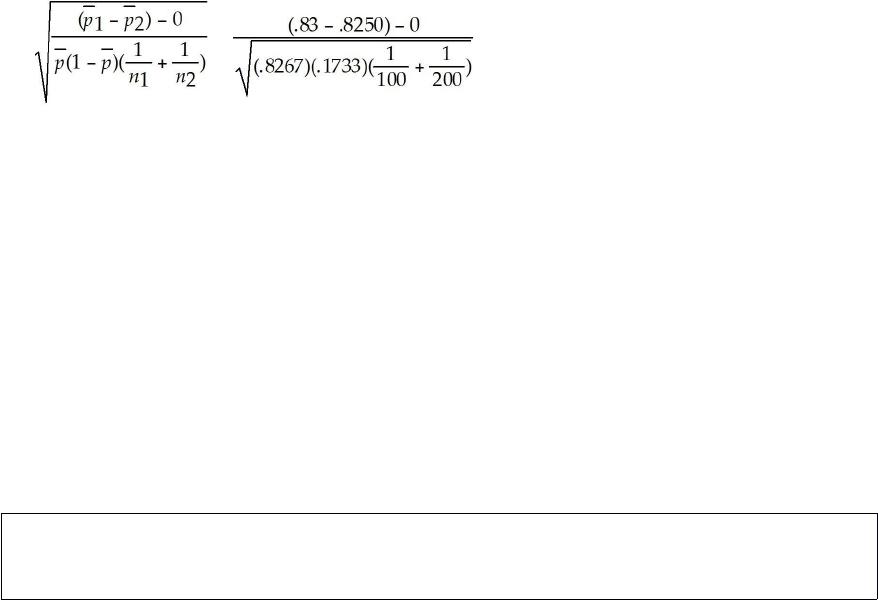
Based on these sample data and using a significance level of 0.05, what conclusion
should be reached? Use the p-value approach to conduct the test.
Referring to the SPC chart signals that a process is out of control, what type of problem
does each signal indicate? List the signals.

In estimating a population mean, under what conditions would the t-distribution be
used?