An Internet-based or emailed survey is not an alternative method of data collection.
When estimating sample size, a 90 percent confidence level will result in a smaller
sample size than a 95 percent confidence level.
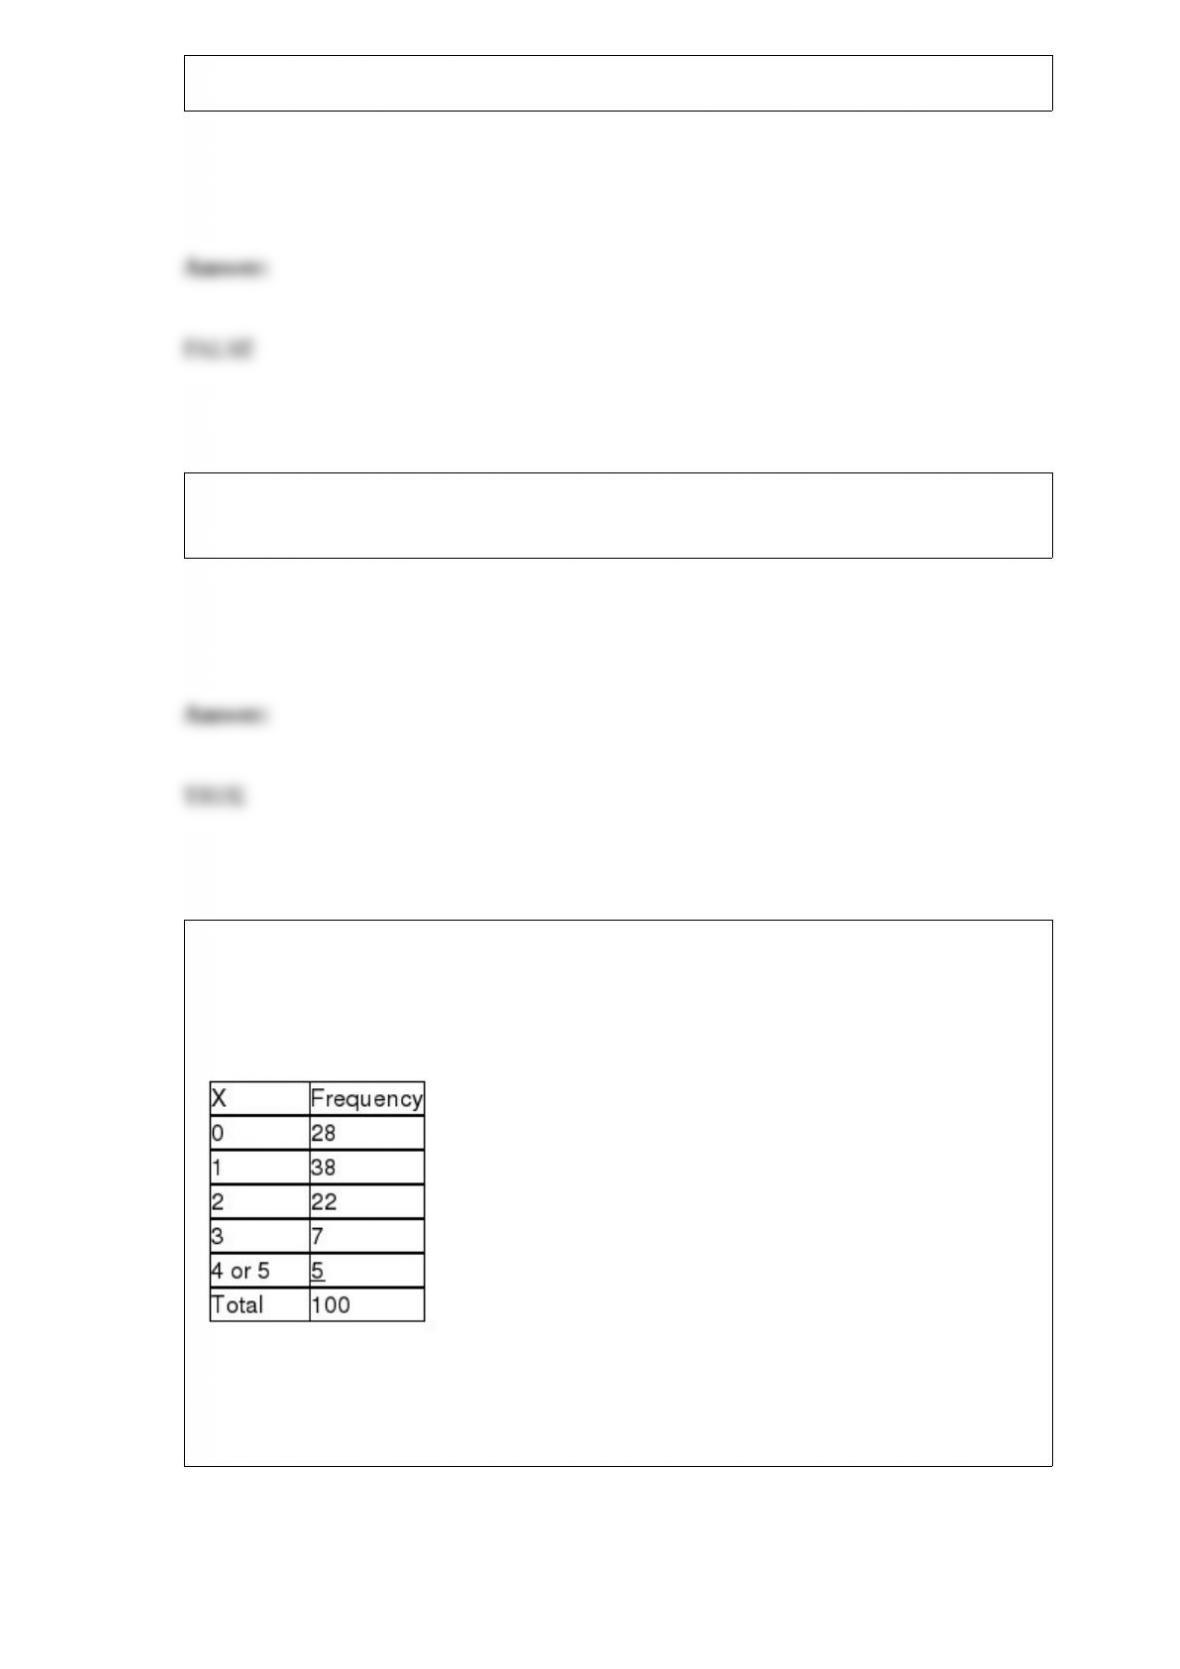
A business with 5 copy machines keeps track of how many copy machines need service
on a given day. It believes this is binomially distributed with a probability of p = 0.2 of
each machine needing service on any given day. It has collected the following based on
a random sample of 100 days.
Given this information, assuming that all expected values are sufficiently large to use
the classes as shown above, the critical value for testing the hypothesis will be based on
5 degrees of freedom.

A bank is interested in determining whether its customers’ checking balances are
linearly related to their savings balances. A sample of n = 20 customers was selected
and the correlation was calculated to be +0.40. If the bank is interested in testing to see
whether there is a significant linear relationship between the two variables using a
significance level of 0.05, the value of the test statistic is approximately t = 1.8516.
Recently, a study was done to determine whether the median speed on a section of
highway is the same for cars versus trucks. A sample of 12 cars (n1 = 12) and 15 trucks
(n2 = 15) was collected. If the Mann-Whitney U test is to be performed using an alpha =
.05, the test critical U value is 49.
The Baker Oil and Gas Company has four retail locations, code-named A, B, C, and D.
The following table illustrates the percentage of total company sales at each store and
also the percentage of customers at that store who make purchases with debit cards:
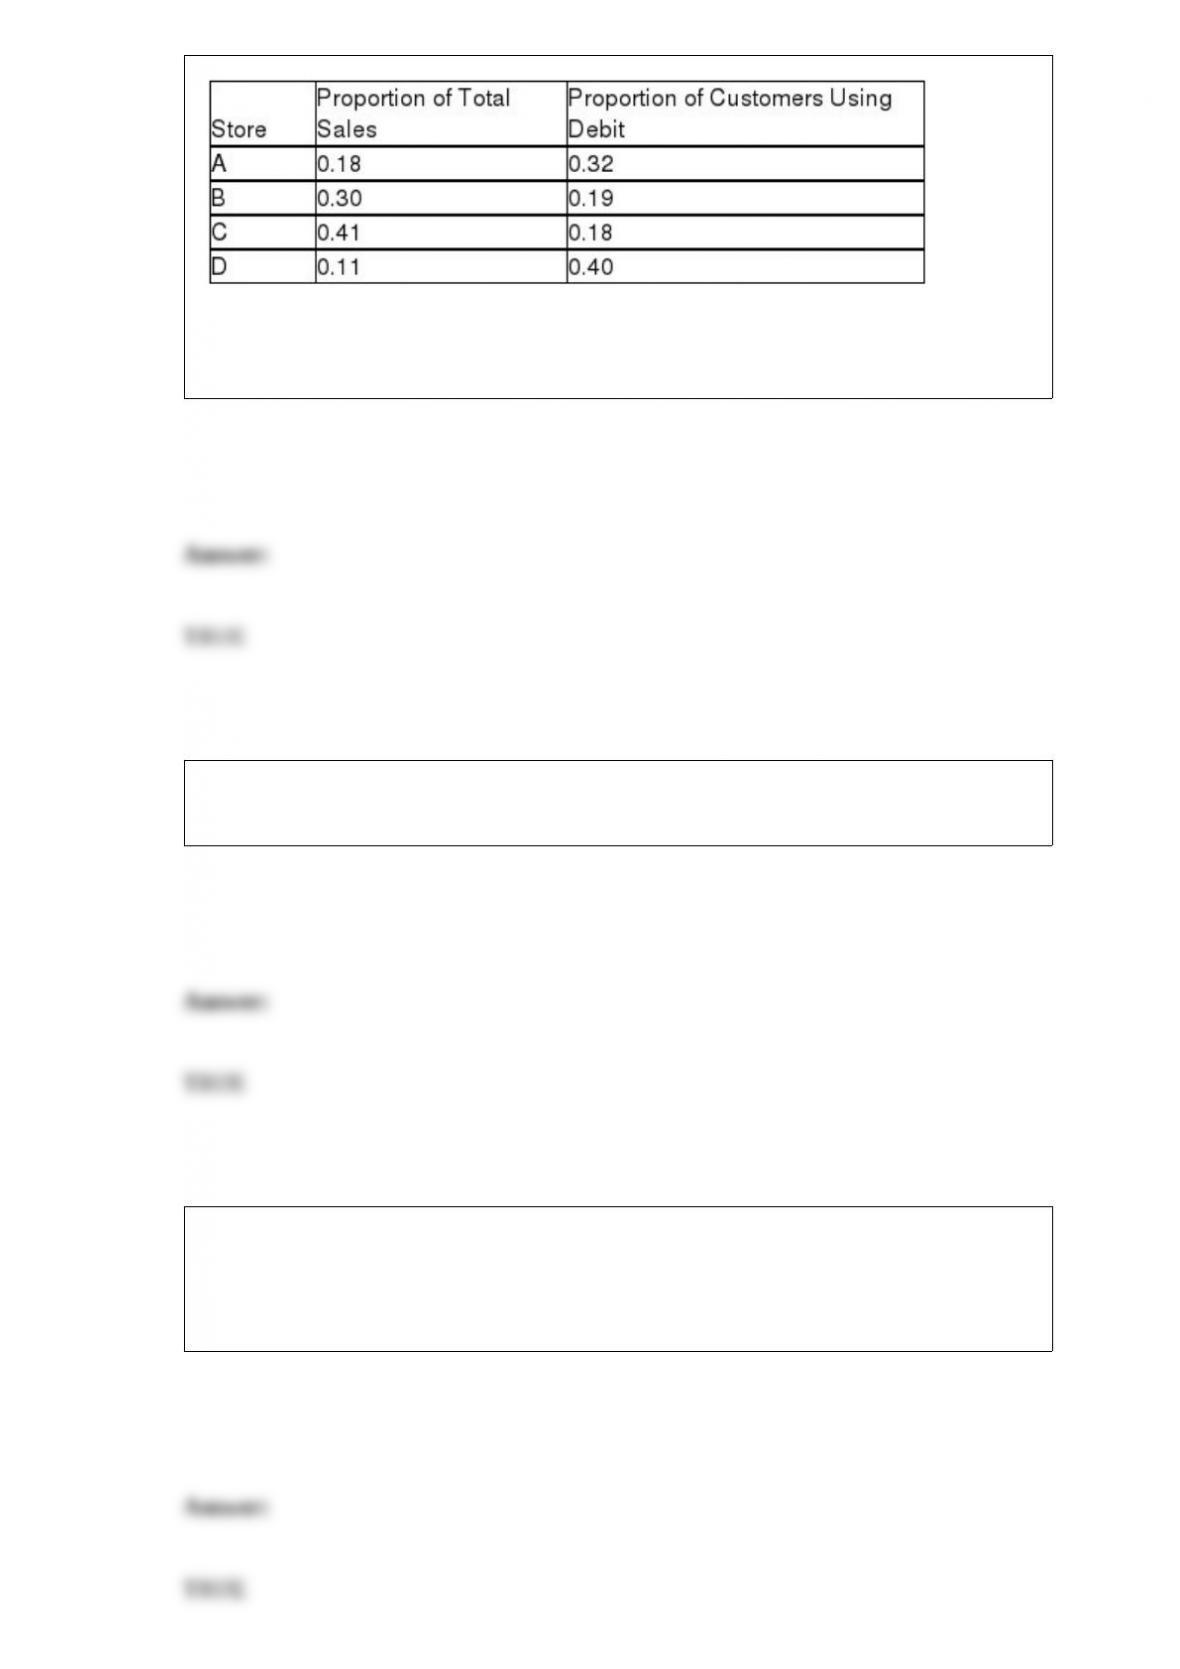
Based on this information, the probability that a customer will use a debit card is just
slightly greater than 0.23.
To compare one value measured at one point in time with other values measured at
different points in time, index numbers must be used.
A major insurance company believes that for drivers between 16 years of age and 60
years of age, the number of accidents per year tends to decrease as age increases. If this
is the case, a scatter diagram should show a negative relationship between the two
variables.
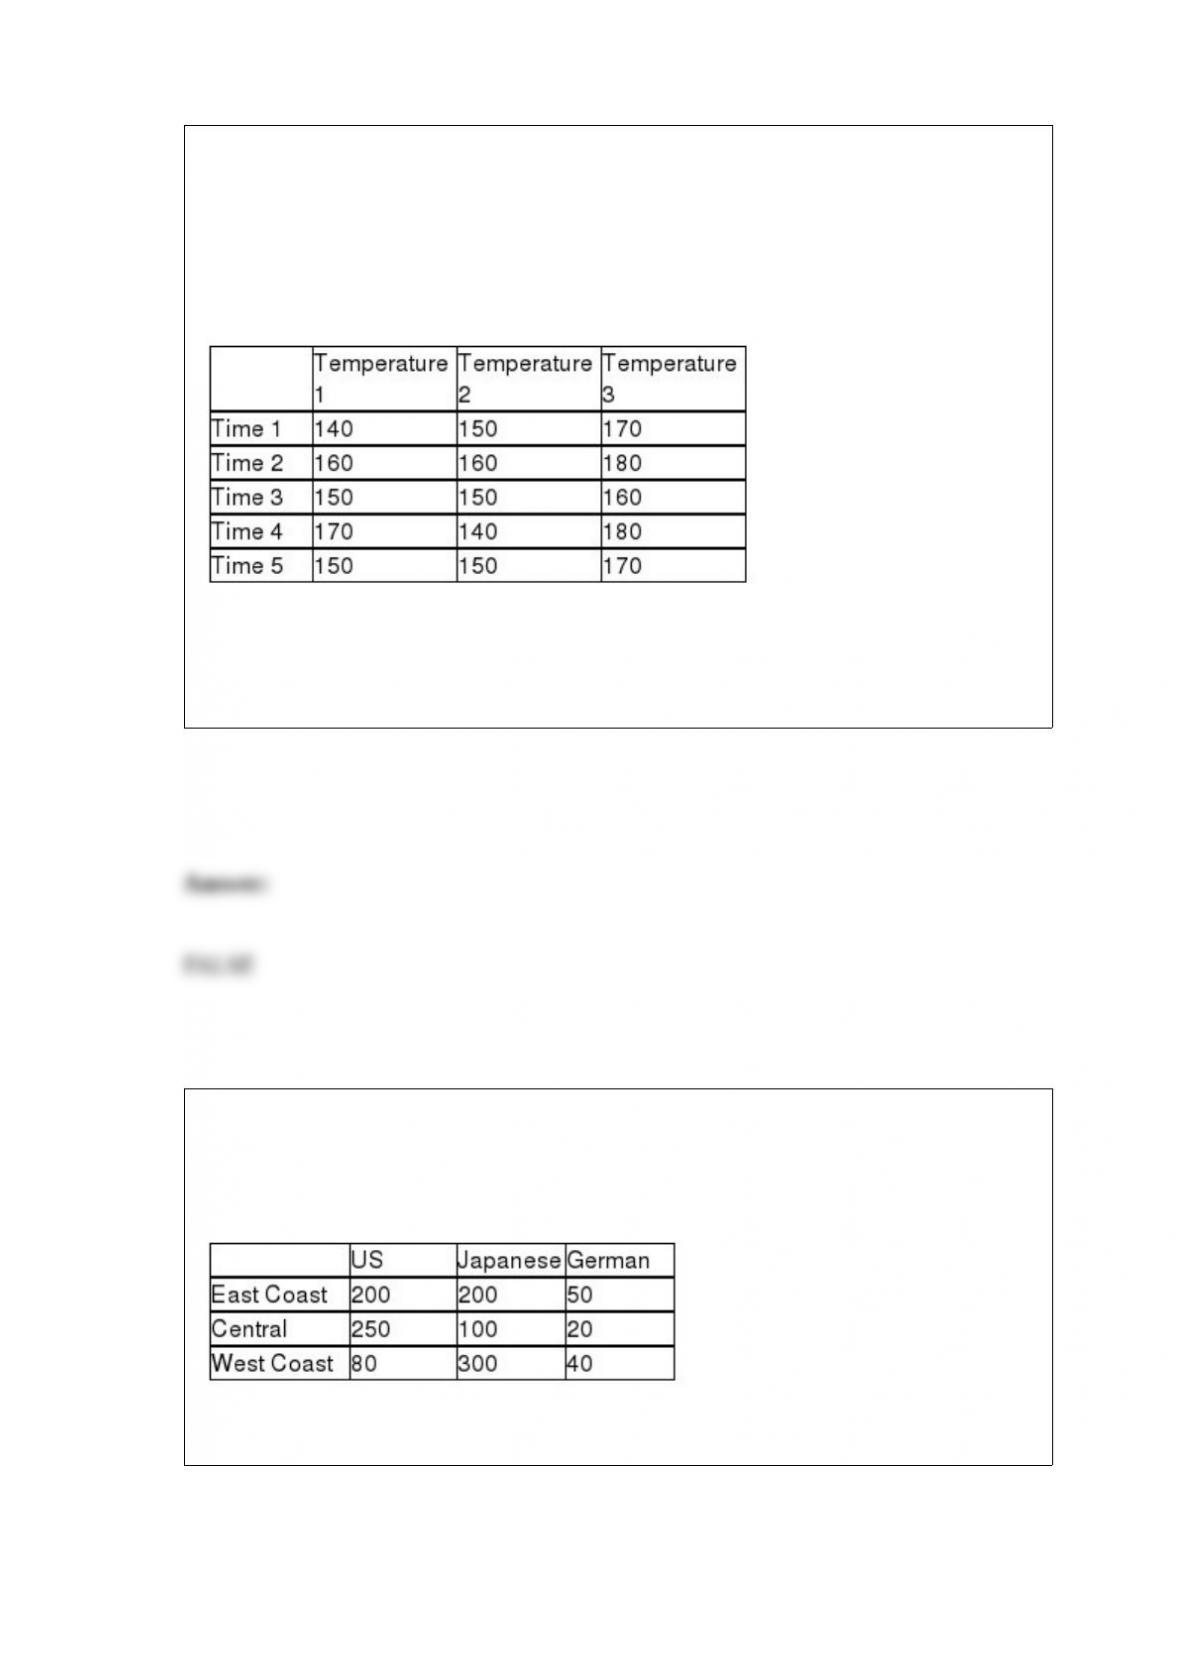
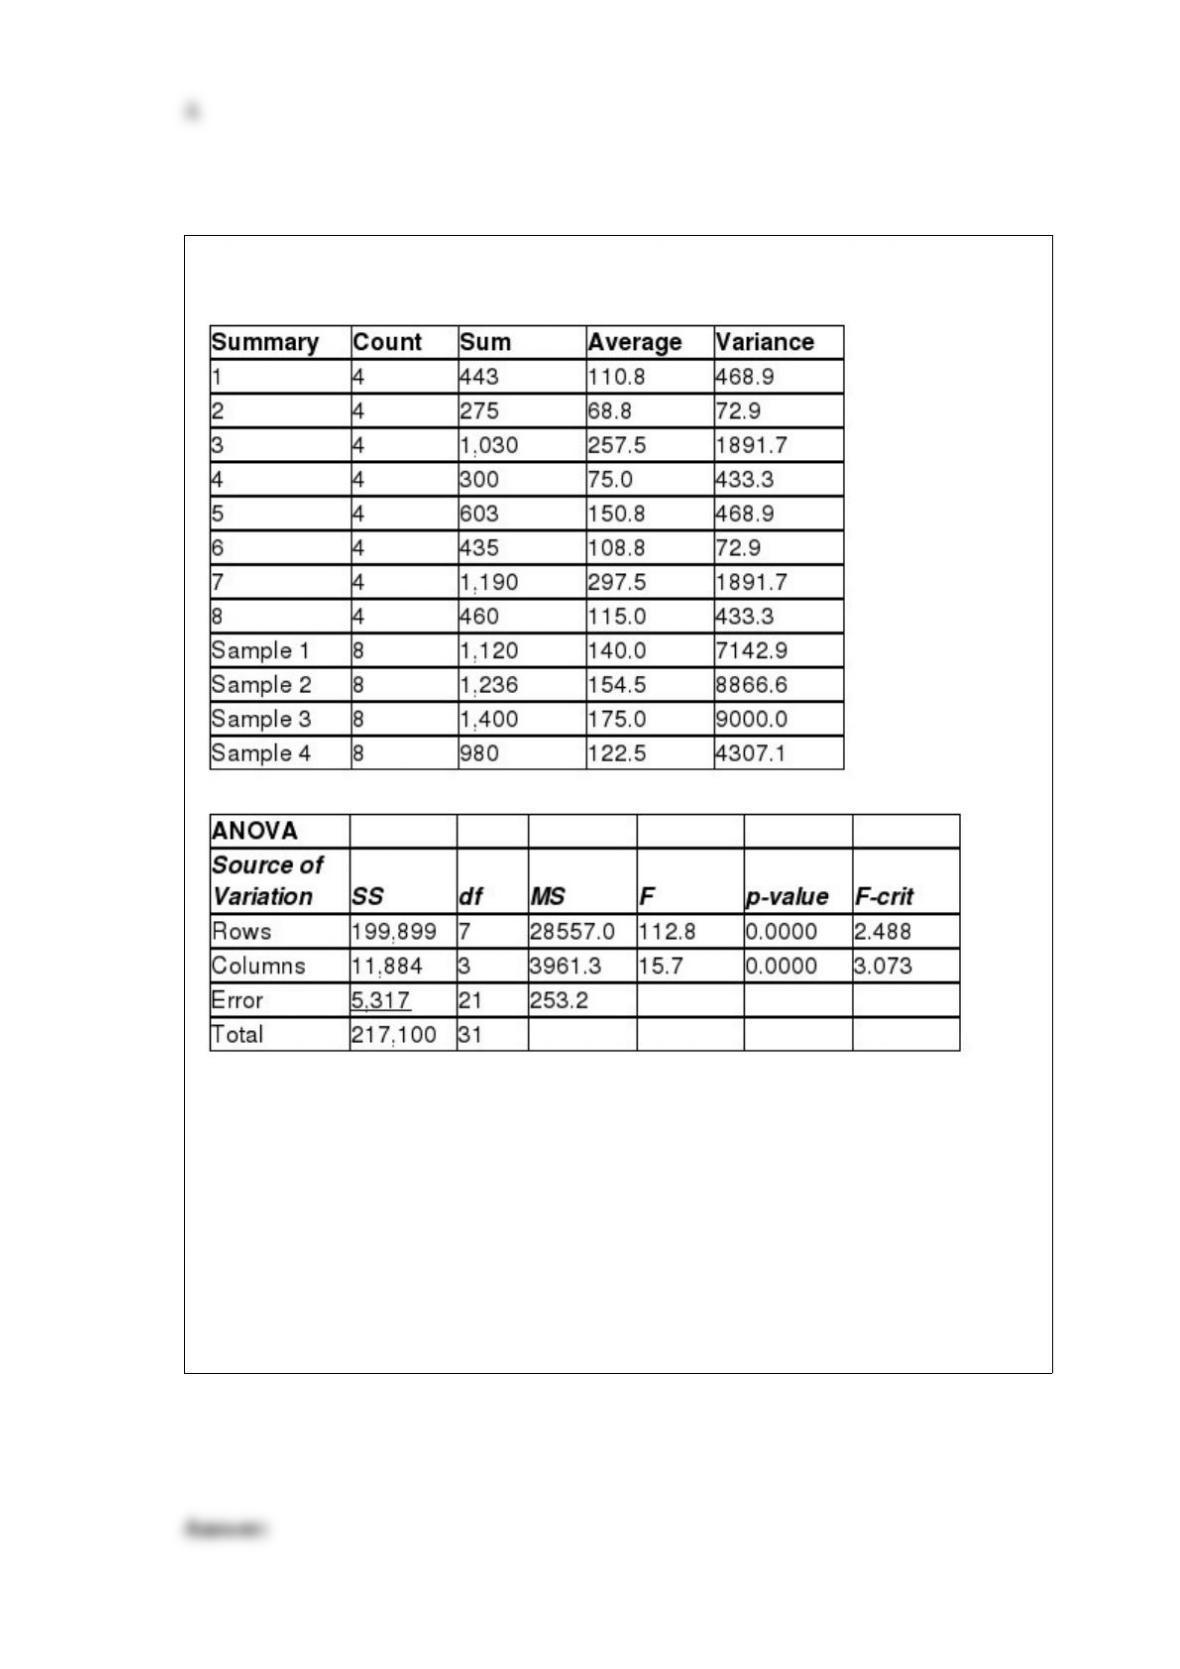
A company has established an experiment with its production process in which three
temperature settings are used and five elapsed times are used for each setting. The
company then produces one product under each and measures the resulting strength of
the product. The managers are mainly interested in determining whether the mean
strength is the same at all temperature settings, but they know that controlling for
process time is important. The following data were observed from the experiment:
Based on these data and experimental design, for a significance level of 0.05, the
managers should conclude that they were justified in blocking on the basis of
processing time.
A study was recently done in the United States in which car owners were asked to
indicate whether their most recent car purchase was a U.S. car, a German car, or a
Japanese car. The people in the survey were divided by geographic region in the United
States. The following data were recorded.
Given this situation, the sample size used in this study was nine.

A local pizza company is interested in estimating the percentage of customers who
would take advantage of a coupon offer. To do this, they give the coupon out to a
random sample of 100 customers. Of these, 45 actually use the coupon. At the 95
percent confidence level it would be appropriate for the manager to conclude that
possibly as many as 50 percent of his customers will redeem the coupon.
An experiment is a process that generates data as its outcome.
Because of the way the F-distribution is formed, all F-tests are one-tailed tests.

Recently, a manager for a major retailer computed the following seasonal indexes:
Note that the index for Summer Qtr is missing. However, it can be determined that the
index for that period is approximately 1.03
Watersports Rental at Flathead Lake rents jet skis and power boats for day use. Each
piece of equipment has a clock that records the time that it was actually in use while
rented. The company has observed over time that the distribution of time used is
normally distributed with a mean of 3.6 hours and a standard deviation equal to 1.2
hours. Watersports management has decided to give a rebate to customers who use the
equipment for only a short amount of time. They wish to grant a rebate to no more than
10 percent of all customers. Based on the information provided, the amount of time that
should be set as the cut-off between getting the rebate and not getting the rebate is
approximately 2.06 hours.
When the best subsets approach is used in a regression application, one method for
determining which of the many possible models to select for potential use is called the
Cp statistic.

A direct retailer that sells clothing on the Internet has two distribution centers and wants
to determine if there is a difference between the proportion of customer order shipments
that contain errors (wrong color, wrong size, etc.). It calculates a 95 percent confidence
interval on the difference in the sample proportions to be -0.012 to 0.037. Based on this,
it can conclude that the distribution centers differ significantly for the proportion of
orders with errors.
In a chi-square contingency test, the number of degrees of freedom is equal to the
number of cells minus 1.
A randomized complete block analysis of variance allows the analyst to control for
sources of variation that might adversely affect the analysis by using the concept of
paired samples.

If a decision maker believes that the population is normally distributed and the data are
known to be ratio level, then the either the t-test or the Wilcoxon signed rank test can be
used to test null hypotheses about a single population mean.
A university recently collected data for a sample of 200 business majors. One variable
collected was the number of credits left to be taken before graduation. This variable
could effectively be displayed using a line chart.
If a hypothesis test is conducted for a population mean, a null and alternative hypothesis
of the form:
H0 : μ = 100
HA : μ ≠ 100
will result in a one-tailed hypothesis test since the sample result can fall in only one tail.
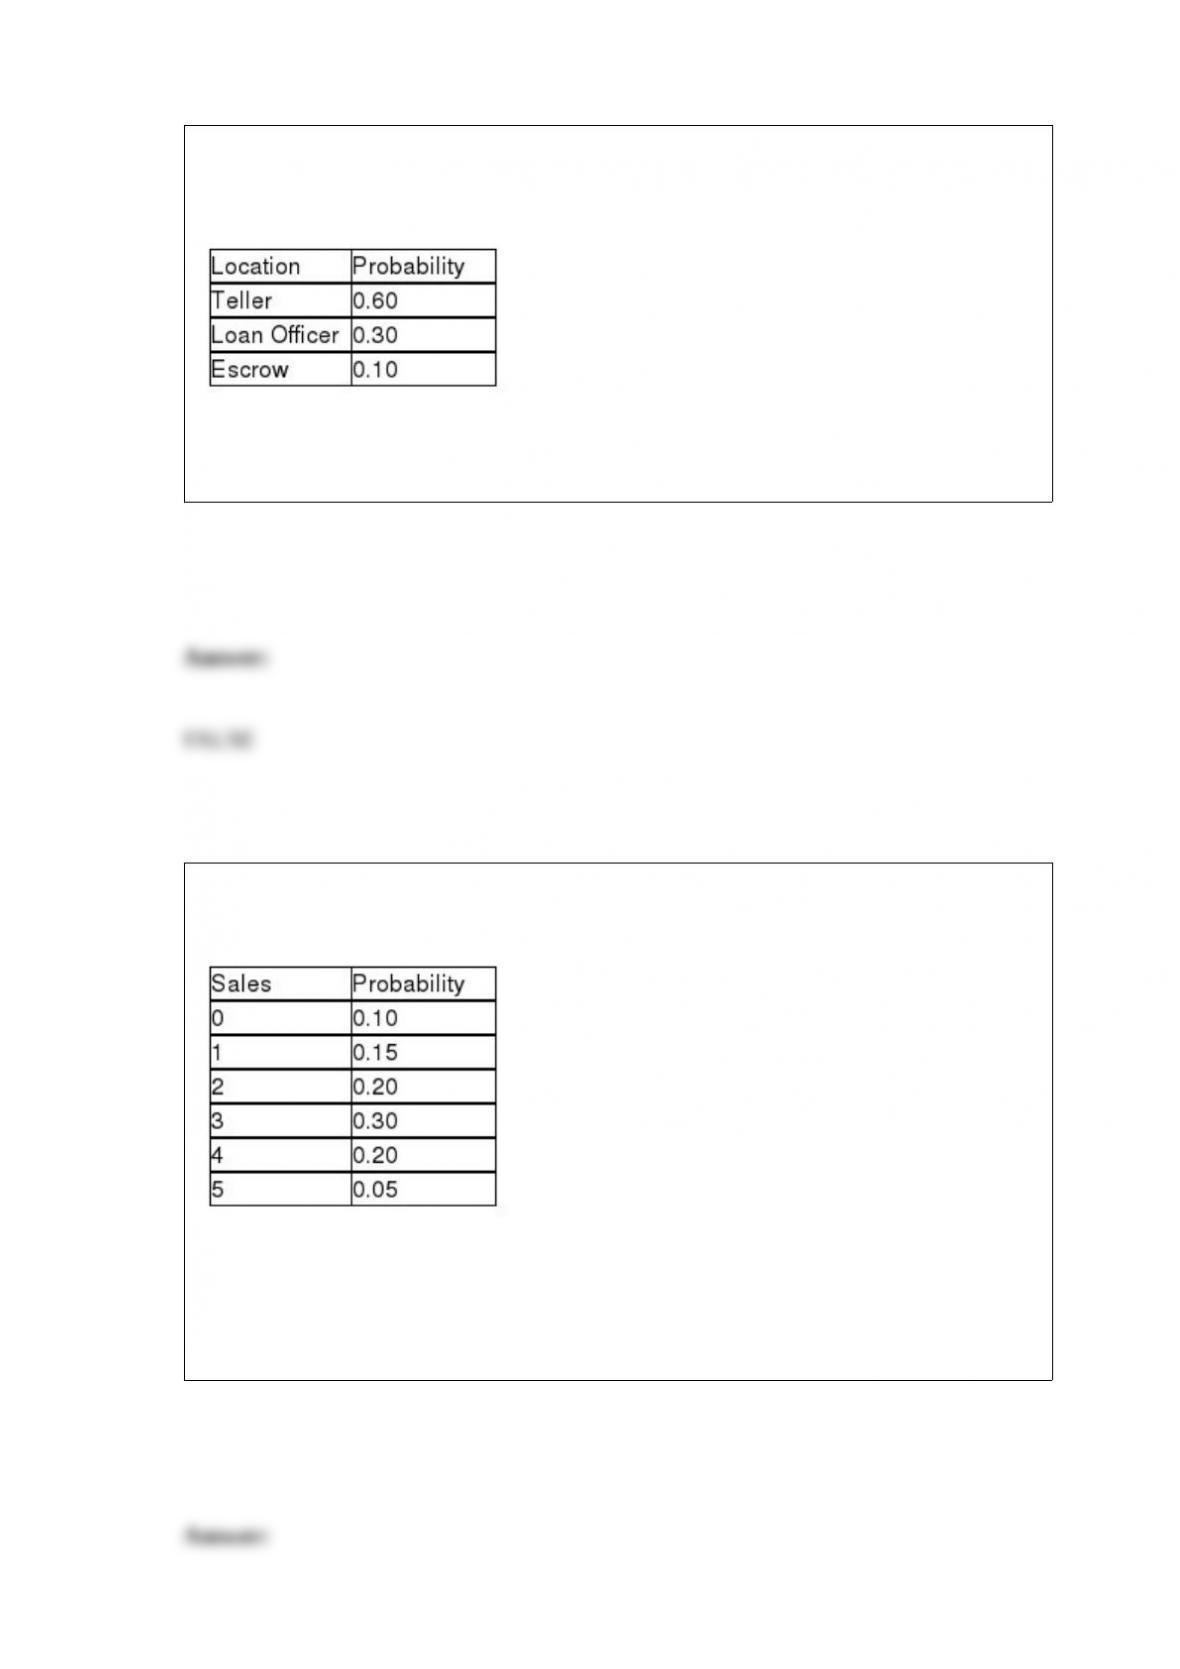
When customers come to a bank, there are three primary locations they may select to go
to: teller, loan officer, or escrow department. Based on past experience, the following
probability distribution applies:
Seventy percent of customers are males. Thus, the probability that the next customer to
enter the bank is a male who goes to the teller is 1.30.
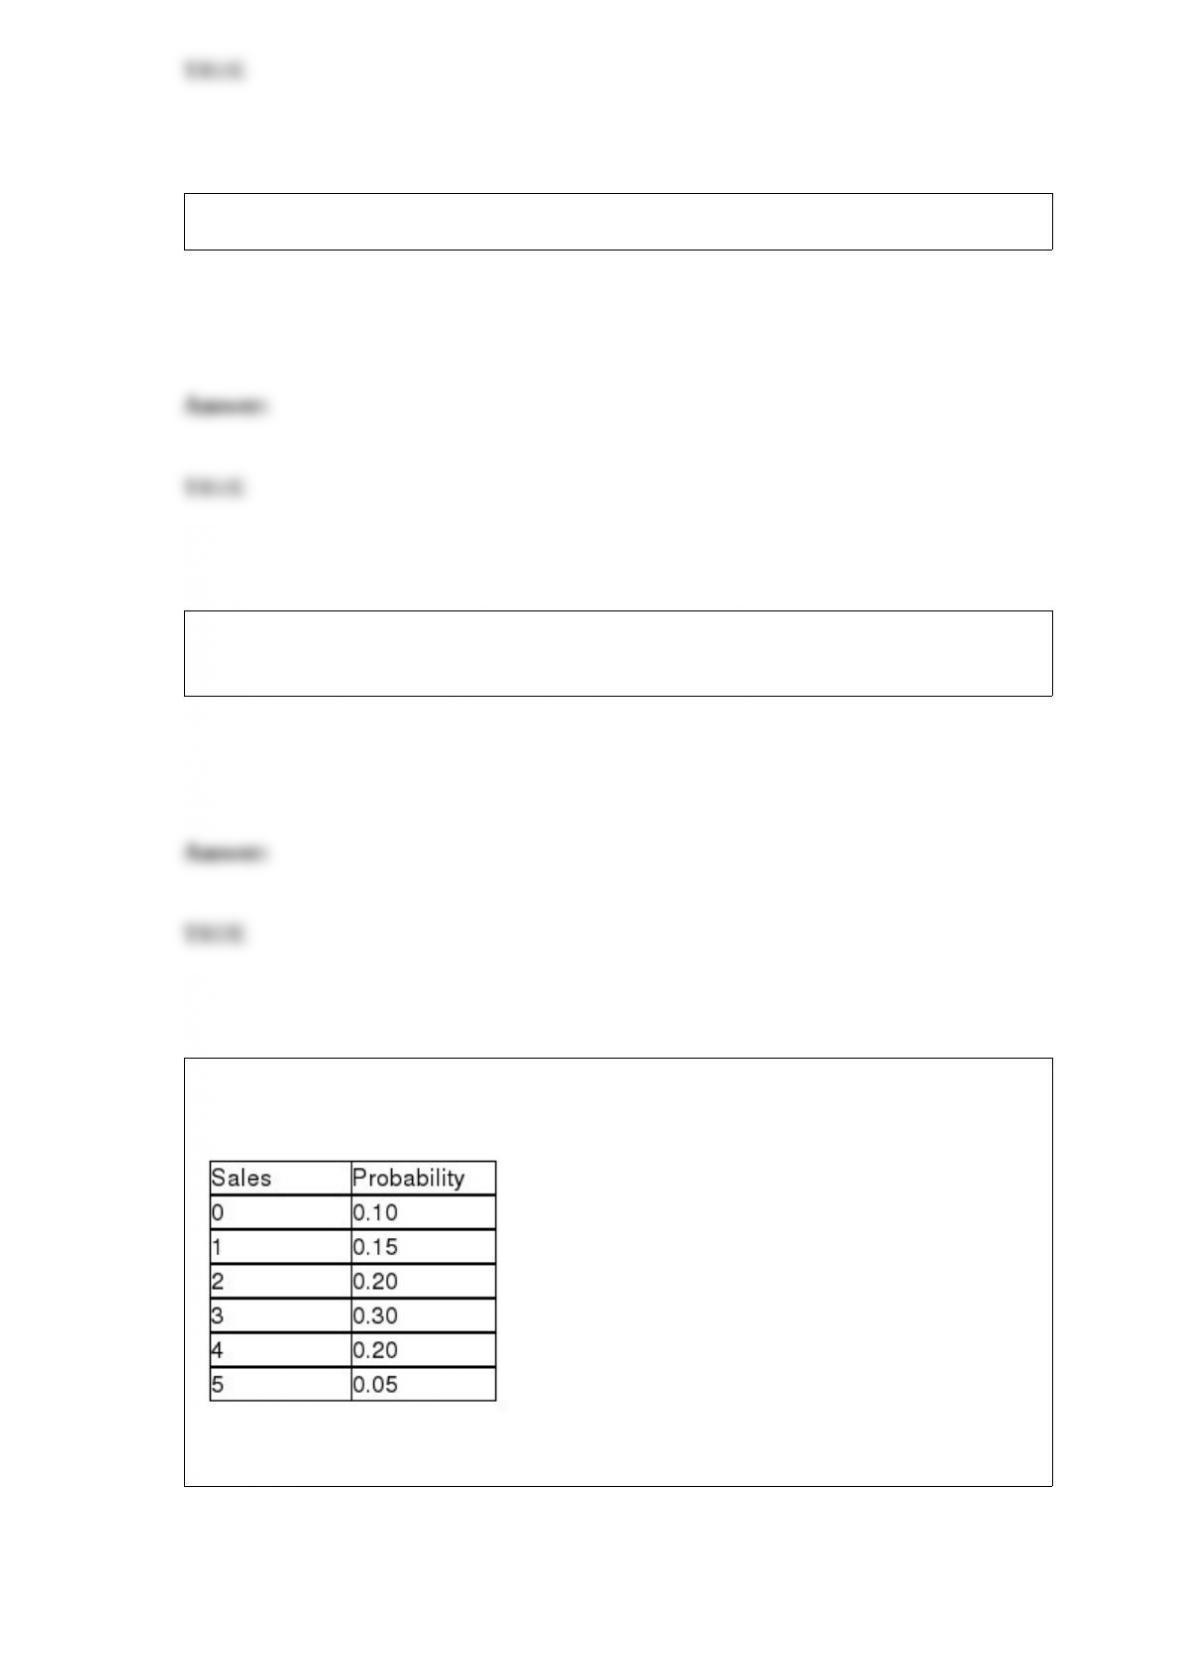
The following probability distribution was subjectively assessed for the number of sales
a salesperson would make if he or she made five sales calls in one day.
When the salesperson makes a sale, there are three possible sales levels: large, medium,
and small. The probability of a large sale is 0.20 and the chance of a medium sale is
0.60. The probability on a given day that the salesperson will make one sale and that it
is medium is 0.09.
Any normal distribution can be converted to a standard normal distribution.
Bar charts can typically be formed with the bars vertical or horizontal without adversely
affecting the interpretation.
The following probability distribution was subjectively assessed for the number of sales
a salesperson would make if he or she made five sales calls in one day.
Given this distribution, the probability that the number of sales is less than 2 is 0.15.

The procedure of the Wilcoxon signed rank test is the same for either small or large
sample sizes.
The police chief in a local city claims that the average speed for cars and trucks on a
stretch of road near a school is at least 45 mph. If this claim is to be tested, the null and
alternative hypotheses are:
H0: μ < 45 mph
Ha : μ ≥ 45 mph
One way to improve the response rate for a survey is to administer the surveys directly
to the respondents.

In a two-factor ANOVA, the minimum number of replications required in any cell is
two, but all cells must have the same number of replications.
If you are sampling from a very large population, a doubling of the sample size will
reduce the standard error of the sampling distribution by one-fourth.
A major automobile manufacturer has developed a new model car that it claims will
average 25 mpg on the highway. A random sample of fifty of these cars was tested and
they averaged 24 mpg. This means that the claim made by the auto company is
incorrect.
You are given the following linear trend model: Ft = 345.60 – 200.5(t). The forecast for
period 15 is approximately -2,662.
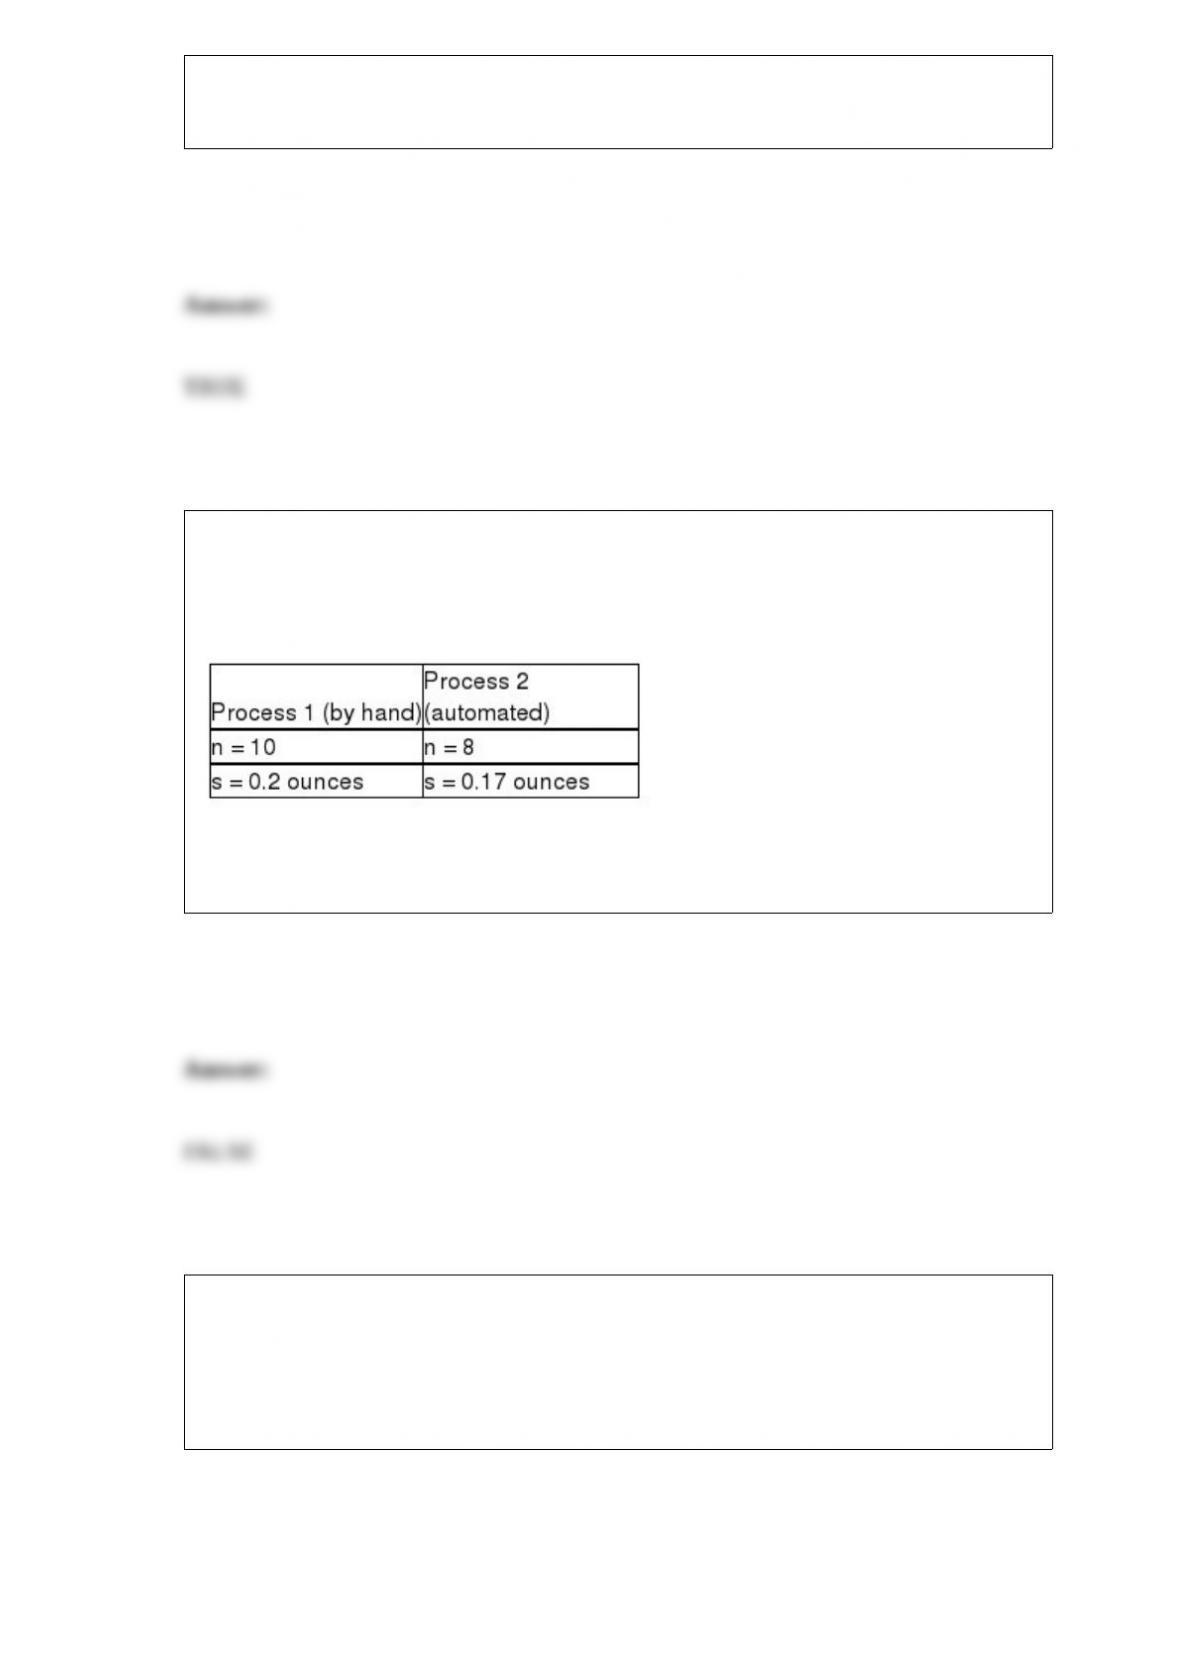
A frozen food company that makes burritos currently has employees making burritos by
hand. It is considering purchasing equipment to automate the process and wants to
determine if the automated process would result in lower variability of burrito weights.
It takes a random sample from each process as shown below.
To conduct a hypothesis test using a 0.05 level of significance, the critical value is
3.347.
The standard deviation for the checking account balances is assumed known to be
$357.50. Recently, a bank manager was interested in estimating the mean balance. To
do this, she selected a random sample of 81 accounts and found a mean balance of
$1,347.20. At a 95 percent confidence level, the lower limit for the confidence interval
is $646.50.

According to the local real estate board, the average number of days that homes stay on
the market before selling is 78.4 with a standard deviation equal to 11 days. A
prospective seller selected a random sample of 36 homes from the multiple listing
service. Above what value for the sample mean should 95 percent of all possible sample
means fall?
A) About 79.3 days
B) About 64 days
C) Approximately 75.4 days
D) Can’t be determined without knowing whether the population is normally
distributed.
A restaurant has three separate dining areas: the patio, the alcove, and the main hall. At
question is whether the median dollar amount per customer is the same or different
between these three restaurant locations. To test this, the manager has randomly
selected samples from each location. These data are shown as follows:
Patio Alcove Main Hall
$22.45 $20.20 $40.00
$35.70 $19.50 $18.50
$17.90 $30.00 $19.60
$25.50 $18.25 $34.50
$19.50 $22.50 $32.00
$14.50 $14.50 $28.70
$30.20 $17.80 $25.00
$36.50 $21.30 $15.75
a. If the manager is unwilling to make the assumption that the bill amounts are normally
distributed at all three locations, what statistical technique would you suggest to test
whether the median bill amounts are the same or different?
b. State the appropriate null and alternative hypotheses.
c. Using an alpha level equal to .05, test the null hypothesis and state your conclusion.

The human resources department at a major high tech company recently conducted an
employee satisfaction survey of 100 of its 3,000 employees. Data were collected on
such variables as age, gender, marital status, current salary, level of overall satisfaction
on a scale from 1 to 5, number of years with the company, and job title. Considering the
age variable where employees were asked to list their age at their last birthday, which of
the following best describes the level of data measurement for that variable?
A) Interval level
B) Nominal level
C) Ratio level
D) Cross-sectional data
If cars arrive to a service center randomly and independently at a rate of 5 per hour on
average, what is the probability that exactly 5 cars will arrive during a given hour?
A) 0.1755
B) 0.6160
C) 0.1277
D) Essentially zero
Consider the following:
How many populations are involved in this test?
A) 4
B) 2
C) 5
D) 3
A small city is considering breaking away from the county school system and starting
its own city school system. City leaders believe that more than 60 percent of residents
support the idea. A poll of n = 215 residents is taken and 134 people say they support
starting a city school district. Using a 0.10 level of significance, conduct a hypothesis
test to determine whether this poll supports the belief of city leaders.

An educational organization in California is interested in estimating the mean number
of minutes per day that children between the age of 6 and 18 spend watching television
per day. A previous study showed that the population standard deviation was 21.5
minutes. The organization selected a random sample of n = 200 children between the
ages of 6 and 18 and recorded the number of minutes of TV that each person watched
on a particular day. The mean time was 191.3 minutes. If the leaders of the organization
wish to develop an interval estimate with 98 percent confidence, what critical value
should be used?
A) z = 1.645
B) t = 2.38
C) Approximately z = 2.33
D) Can’t be determined without knowing the margin of error.
In order for a one-way analysis of variance to be considered a balanced design, which
of the following must hold?
A) The population variances must be equal.
B) The sample sizes selected from each population must be equal.
C) The study must have the same number of rows as it does columns.
D) All of the above are true.

Suppose the life of a particular brand of calculator battery is approximately normally
distributed with a mean of 75 hours and a standard deviation of 10 hours. If the
manufacturer of the battery is able to reduce the standard deviation of battery life from
10 to 9 hours, what would be the probability that 16 batteries randomly sampled from
the population will have a sample mean life of between 70 and 80 hours?
A) 0.6127
B) 0.8124
C) 0.9736
D) 0.8812
If the Type I error (α) for a given test is to be decreased, then for a fixed sample size n:
A) the Type II error (β) will also decrease.
B) the Type II error (β) will increase.
C) the power of the test will increase.
D) a one-tailed test must be utilized.
The Biltmore Hotel manager is getting ready to make a presentation that she hopes will
justify adding additional staff. As part of the presentation, she has constructed charts
and graphs. The general type of statistical analysis she is using is:
A) hypothesis testing.
B) estimation.
C) inferential statistics.
D) descriptive statistics.
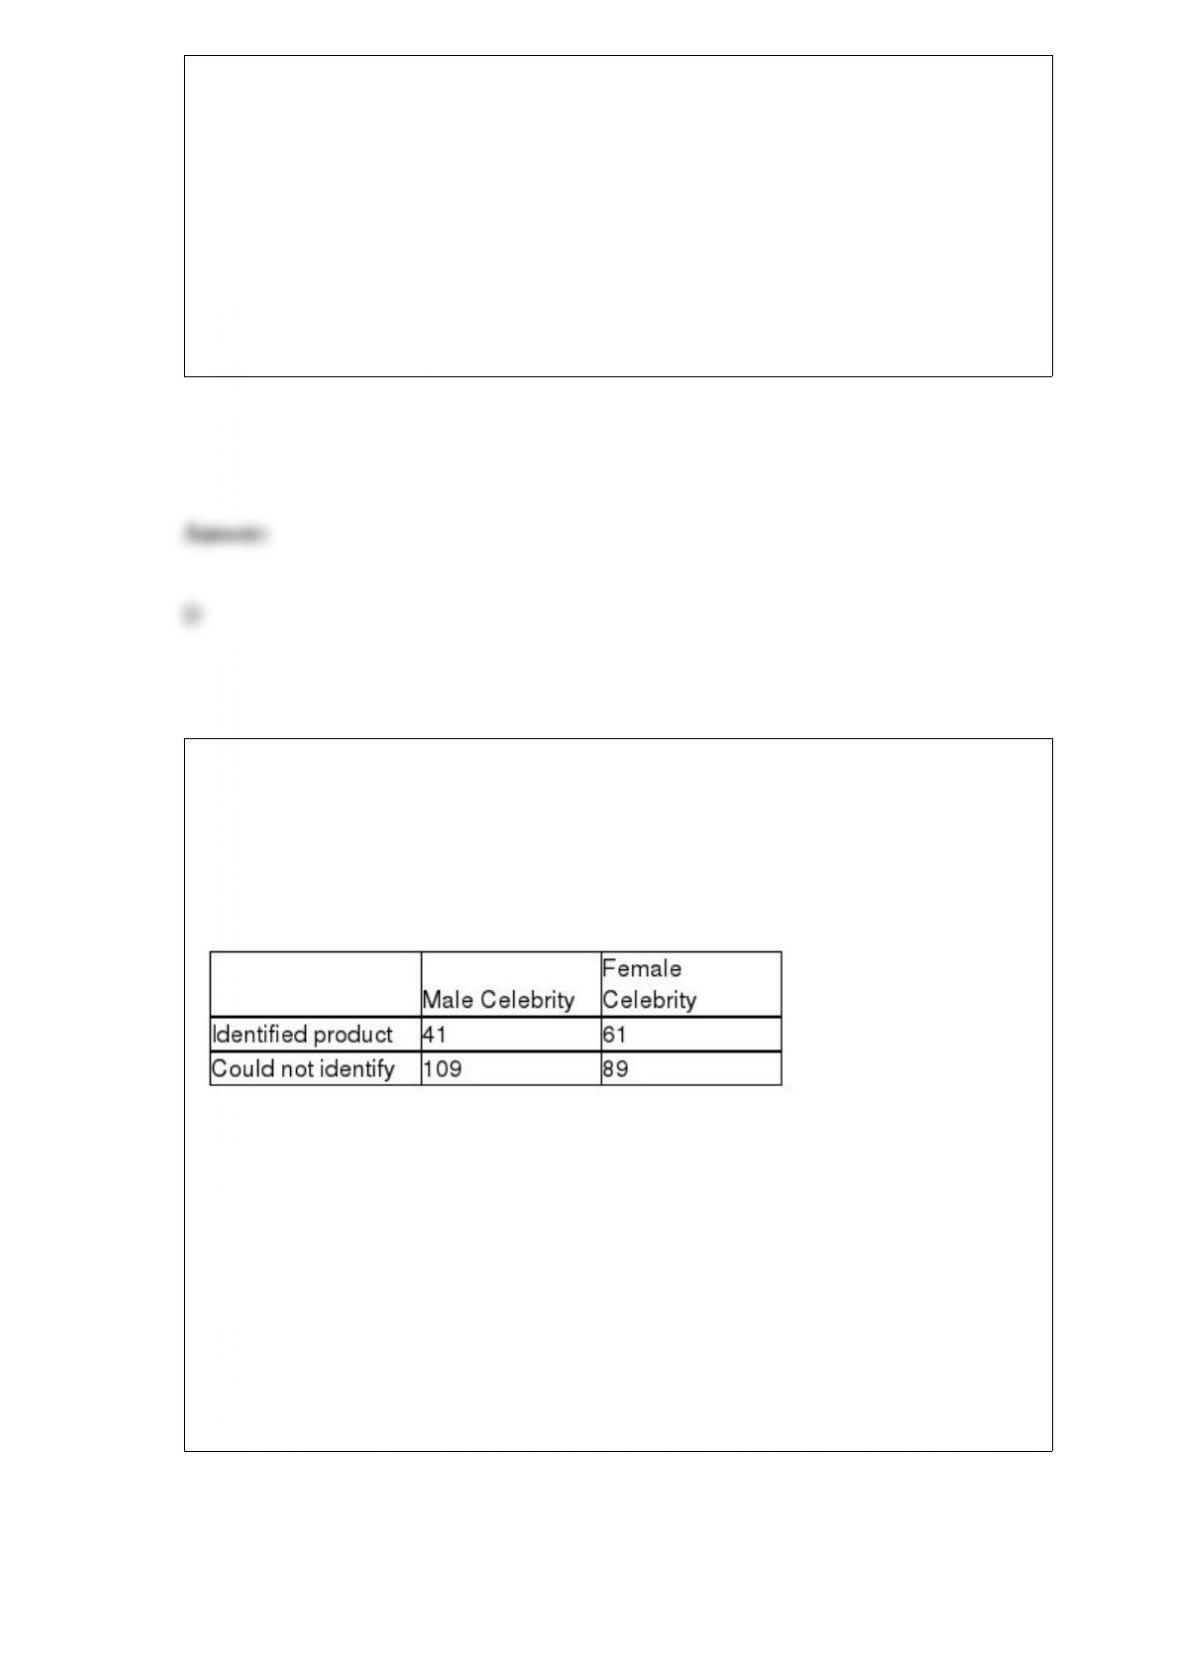
Many companies use well-known celebrities as spokespeople in their TV
advertisements. A study was conducted to determine whether brand awareness of
female TV viewers and the gender of the spokesperson are independent. Each in a
sample of 300 female TV viewers was asked to identify a product advertised by a
celebrity spokesperson. The gender of the spokesperson and whether or not the viewer
could identify the product was recorded. The numbers in each category are given below.
Referring to these sample data, which test would be used to properly analyze the data in
this experiment?
A) x2 test for independence in a two-way contingency table
B) x2 test for equal proportions in a one-way table
C) ANOVA F-test for main treatment effect
D) x2 goodness-of-fit test
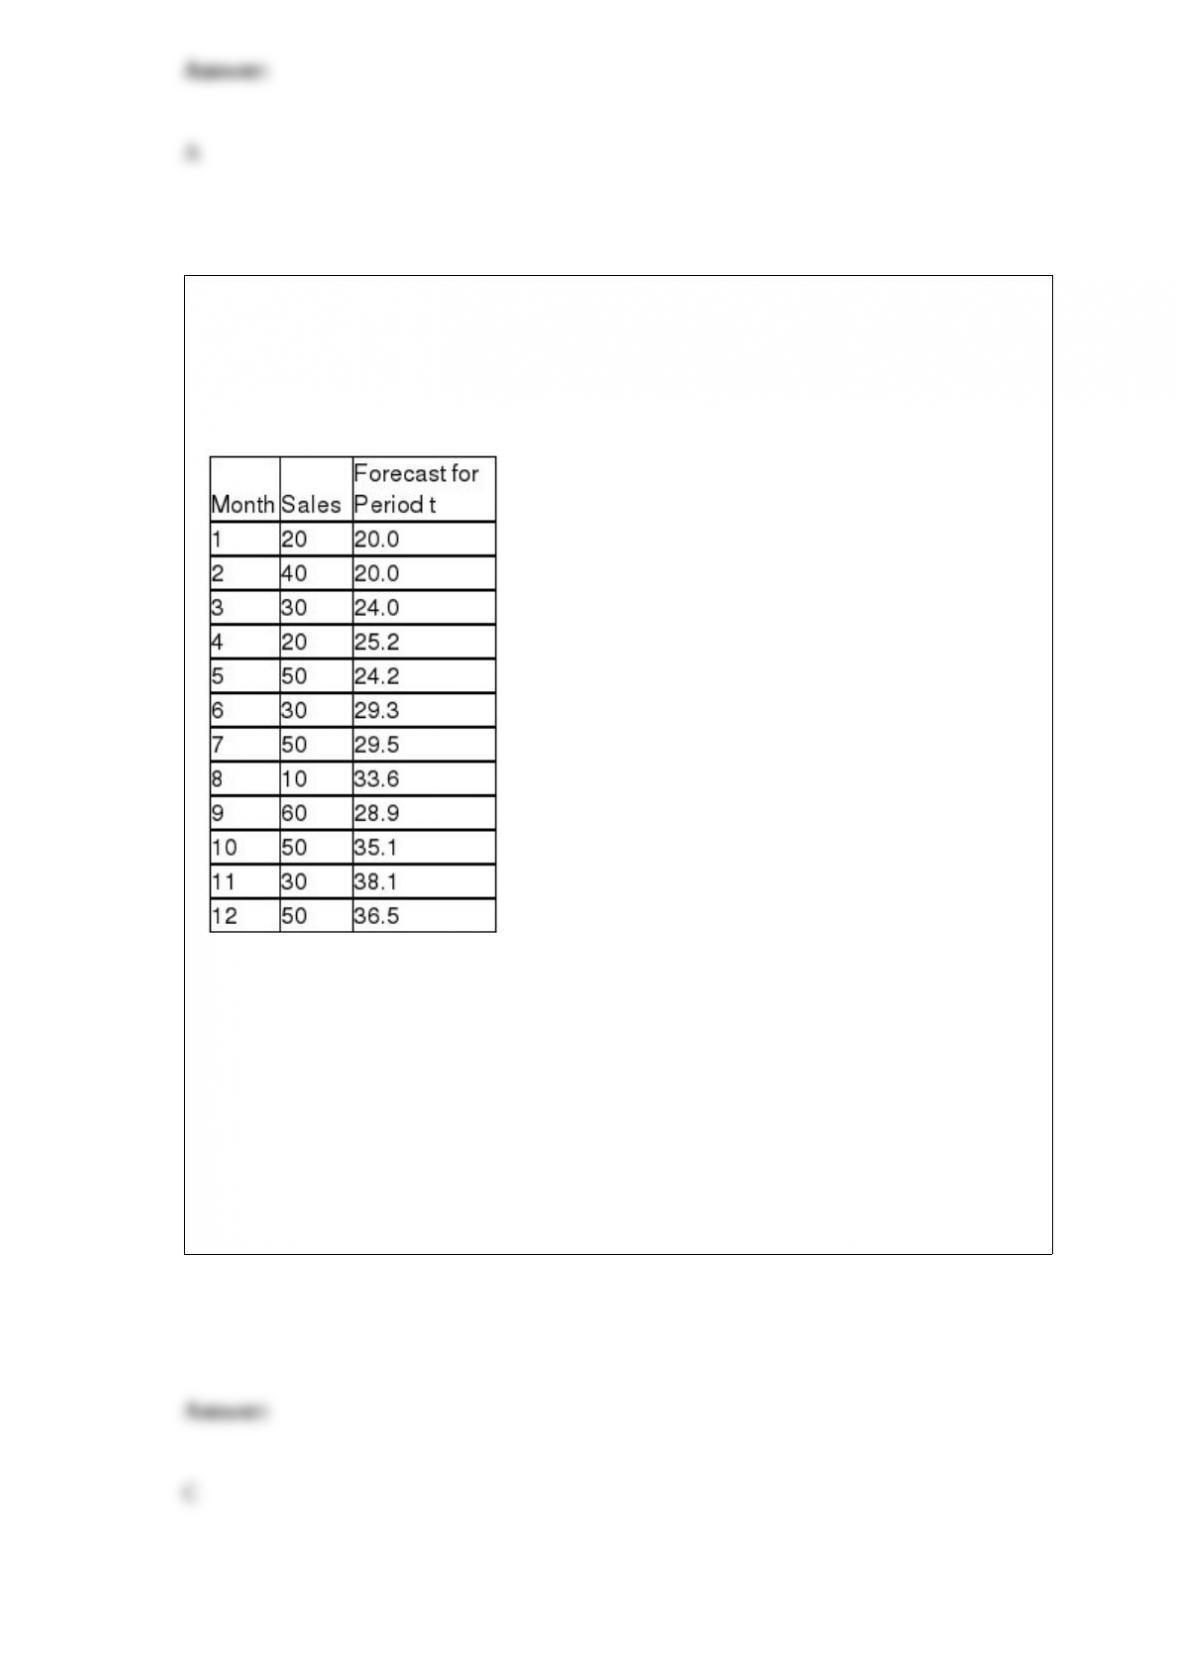
The Zocor Company is interested in forecasting period 13 sales for a product. It has 12
months of historical data. The following shows the data and the forecasted valued for
periods 1-12 using a single exponential smoothing model with a smoothing constant
value equal to 0.20
What is the value of the MAD for periods 2-12?
A) About 19.6
B) Nearly 6
C) Approximately 15.4
D) Can’t be determined without more information
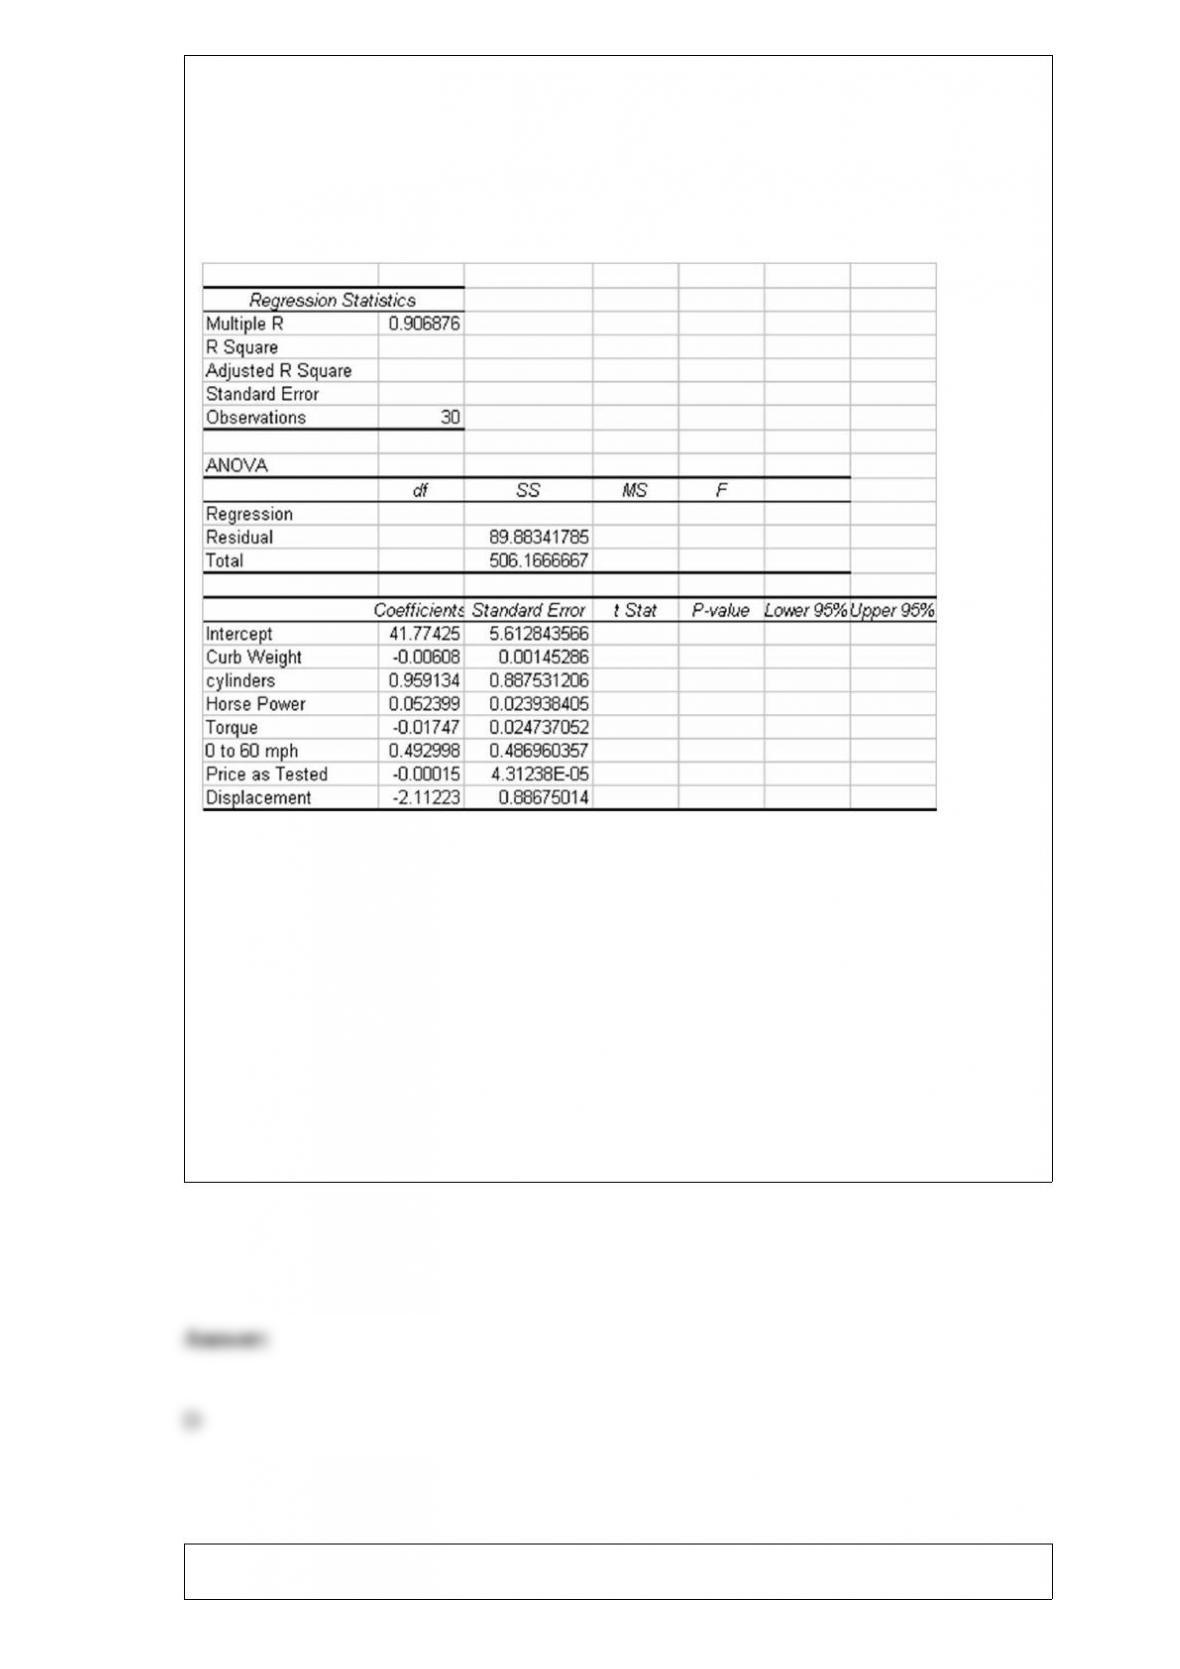
The editors of a national automotive magazine recently studied 30 different automobiles
sold in the United States with the intent of seeing whether they could develop a multiple
regression model to explain the variation in highway miles per gallon. A number of
different independent variables were collected. The following regression output (with
some values missing) was recently presented to the editors by the magazine’s analysts:
Based on this output and your understanding of multiple regression analysis, which of
the independent variables is not considered statistically significant if the test is
conducted at the 0.05 level of statistical significance?
A) All the variables in the model are statistically significant.
B) None of the variables in the model is statistically significant.
C) Torque and price as tested
D) Cylinders, torque, and 0 to 60
A pilot sample of 75 items was taken, and the number of items with the attribute of

interest was found to be 15. How many more items must be sampled to construct a 99%
confidence interval estimate for p with a 0.025 margin of error?
A) 1512
B) 1612
C) 1698
D) 1623
Which of the following is the most frequently used measure of variation?
A) The range
B) The standard deviation
C) The variance
D) The mode
It is assumed that the time failures for an electronic component are exponentially
distributed with a mean of 50 hours between consecutive failures. What is the
probability that a component will be functioning after 60 hours?
A) Approximately 0.30
B) About 0.70
C) About 0.21
D) About 0.49
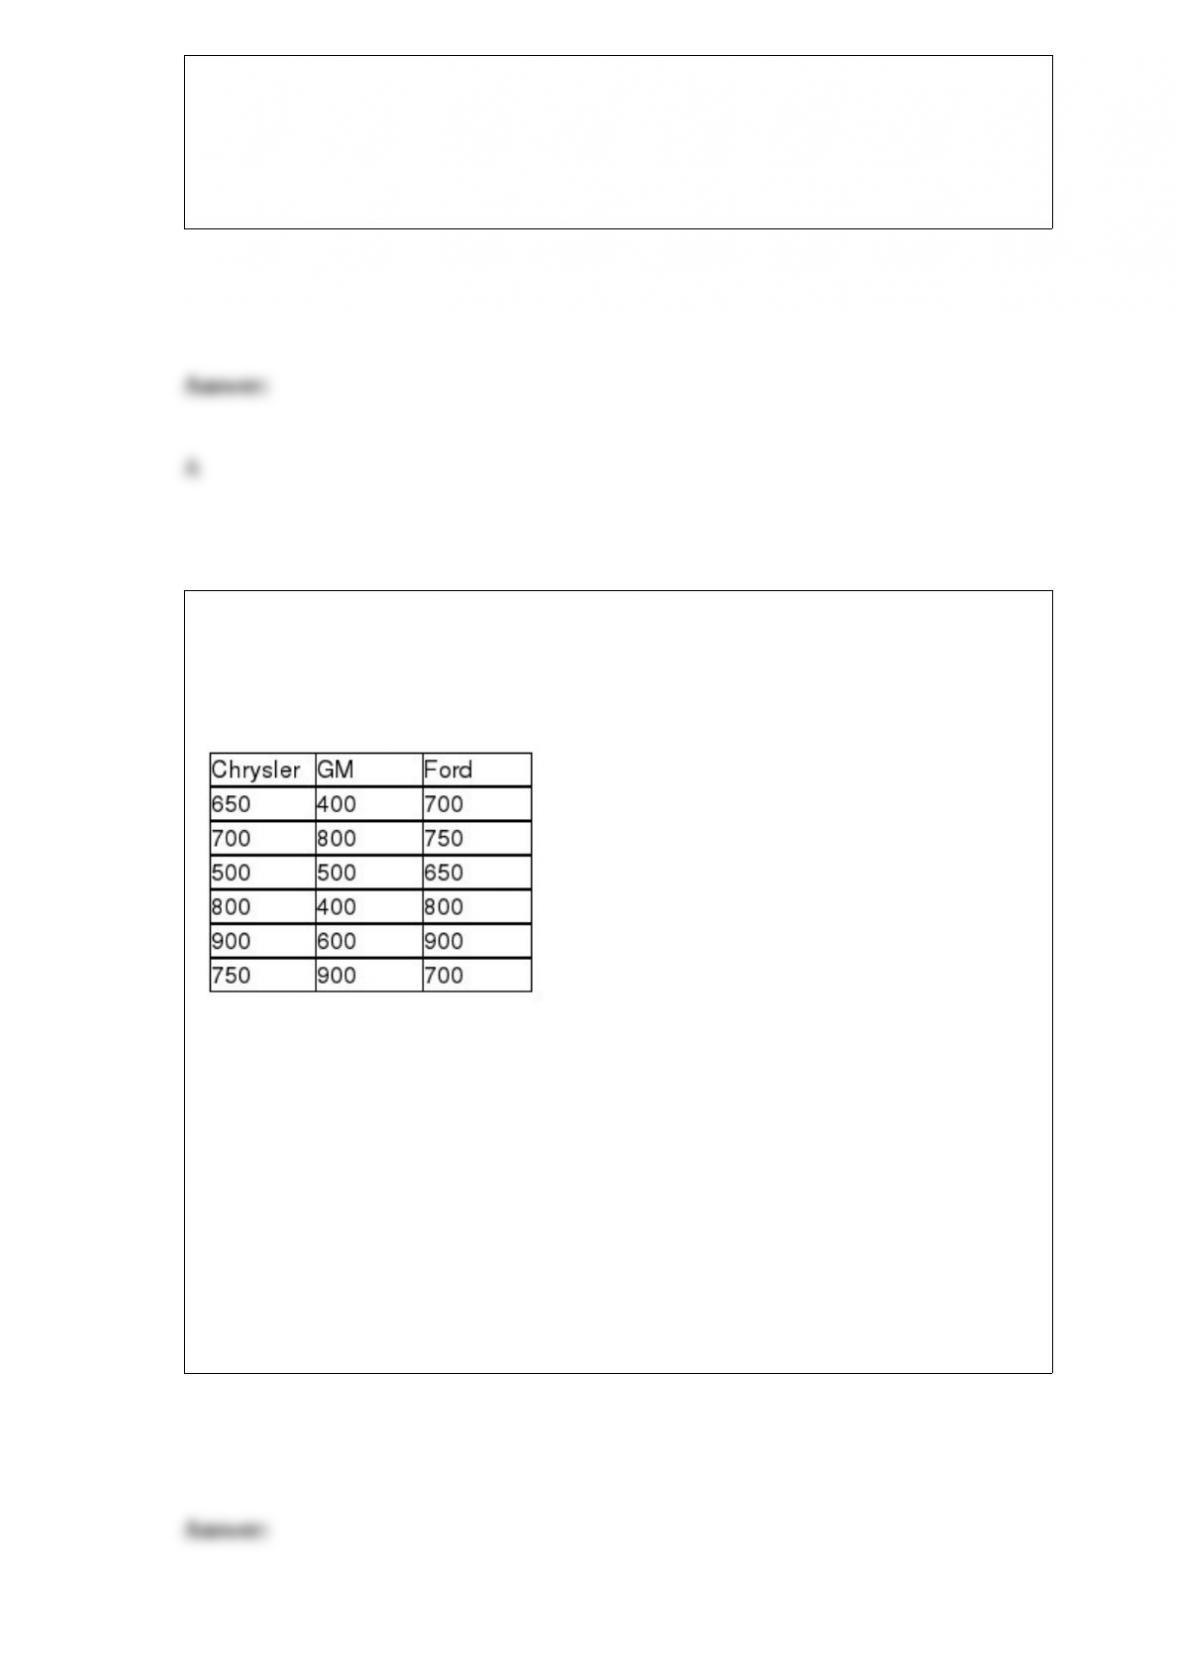
A survey was recently conducted in which random samples of car owners of Chrysler,
GM, and Ford cars were surveyed to determine their satisfaction. Each owner was
asked to rate overall satisfaction on a scale of 1 (poor) to 1000 (excellent). The
following data were recorded:
If the analysts are not willing to assume that the population ratings are normally
distributed and will use the Kruskal-Wallis test to determine if the three companies have
different median ratings, what is correct test statistic for these data?
A) H = 1.965
B) t = 1.96
C) H = 3.34
D) H = .65

In a standard normal distribution, the probability that z is greater than 0 is:
A) 0.5
B) equal to 1
C) at least 0.5
D) 1.96
To show how the price of a stock has changed over the last 3 months, the best type of
chart to use is:
A) a pie chart.
B) a histogram.
C) a line chart.
D) a bar chart.
In a recent meeting, the marketing manager for a large hardware company stated that he
needed to have a forecast prepared for the next three months. The three-month period is
called:
A) the forecasting horizon.
B) the forecasting period.
C) the planning time.
D) a business cycle.
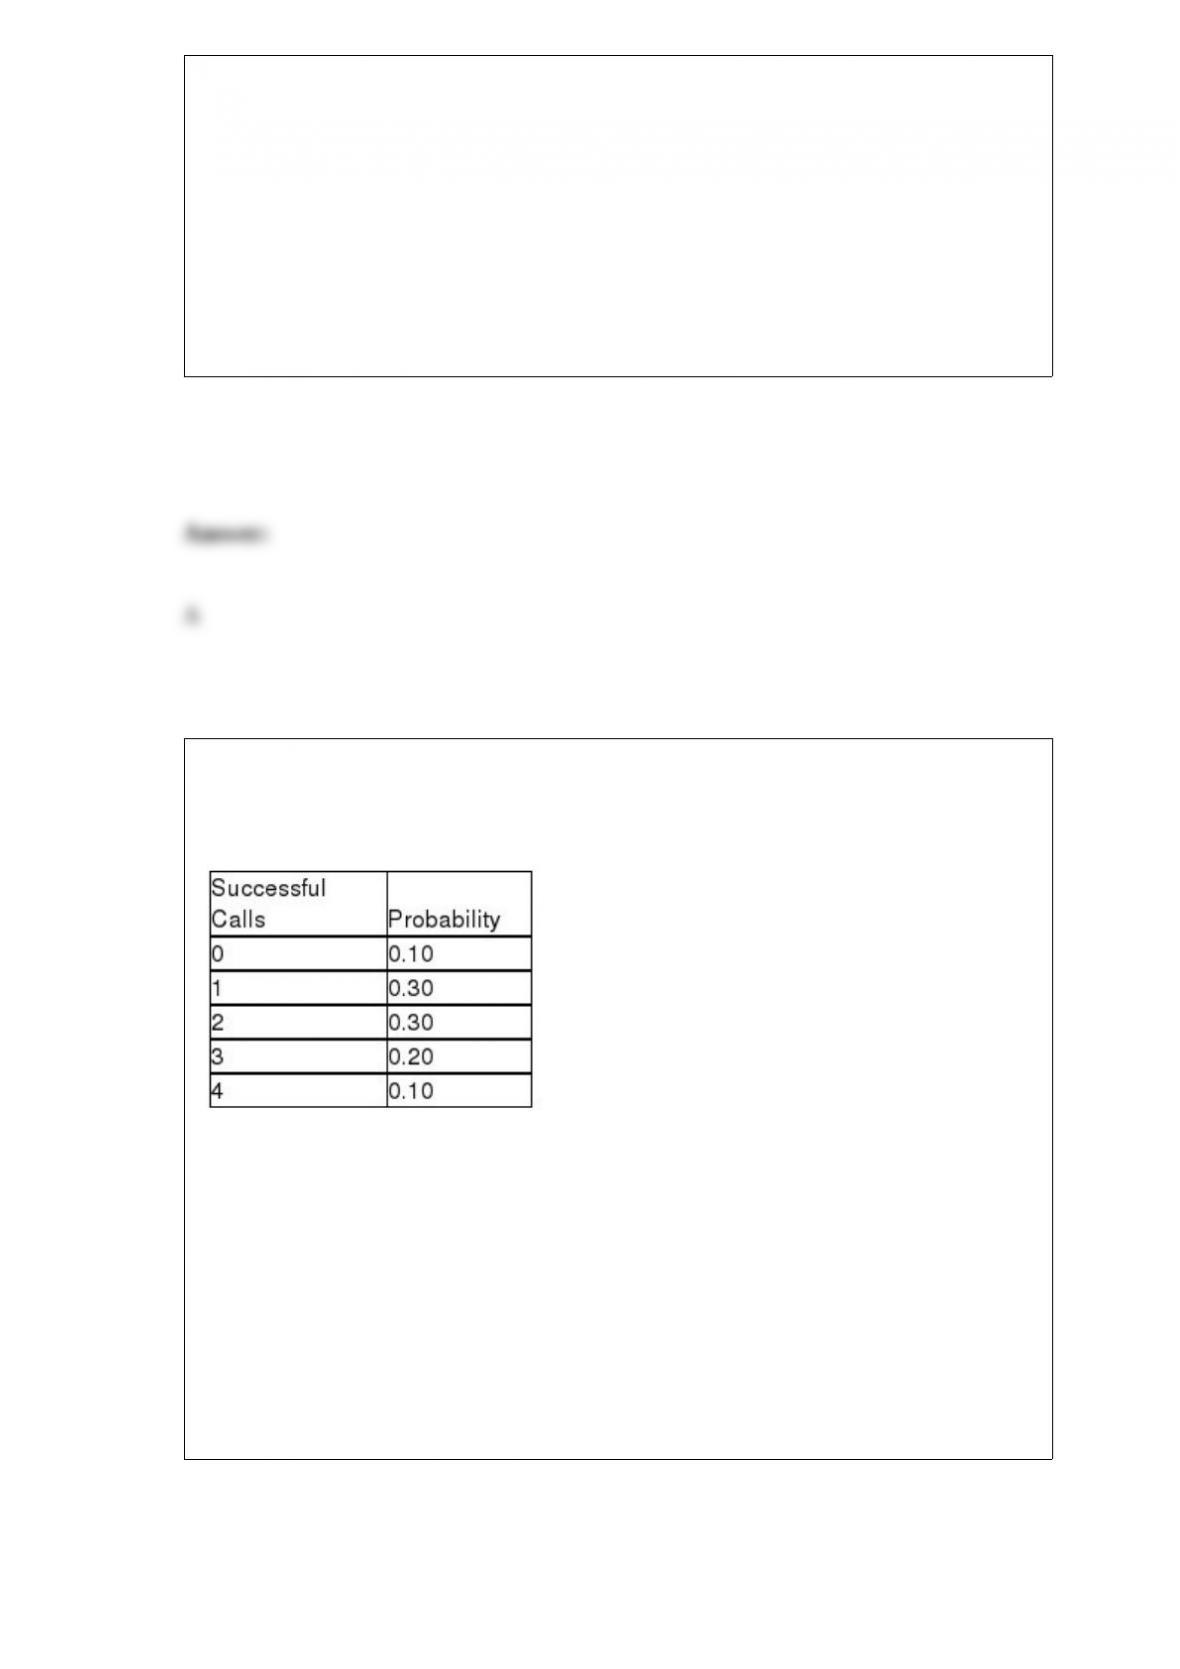
A sales rep for a national clothing company makes 4 calls per day. Based on historical
records, the following probability distribution describes the number of successful calls
each day:
Based on this information, the probability that the sales rep will have a total of 2
successful calls in a two-day period is:
A) 0.60
B) 0.09
C) 0.15
D) 0.06
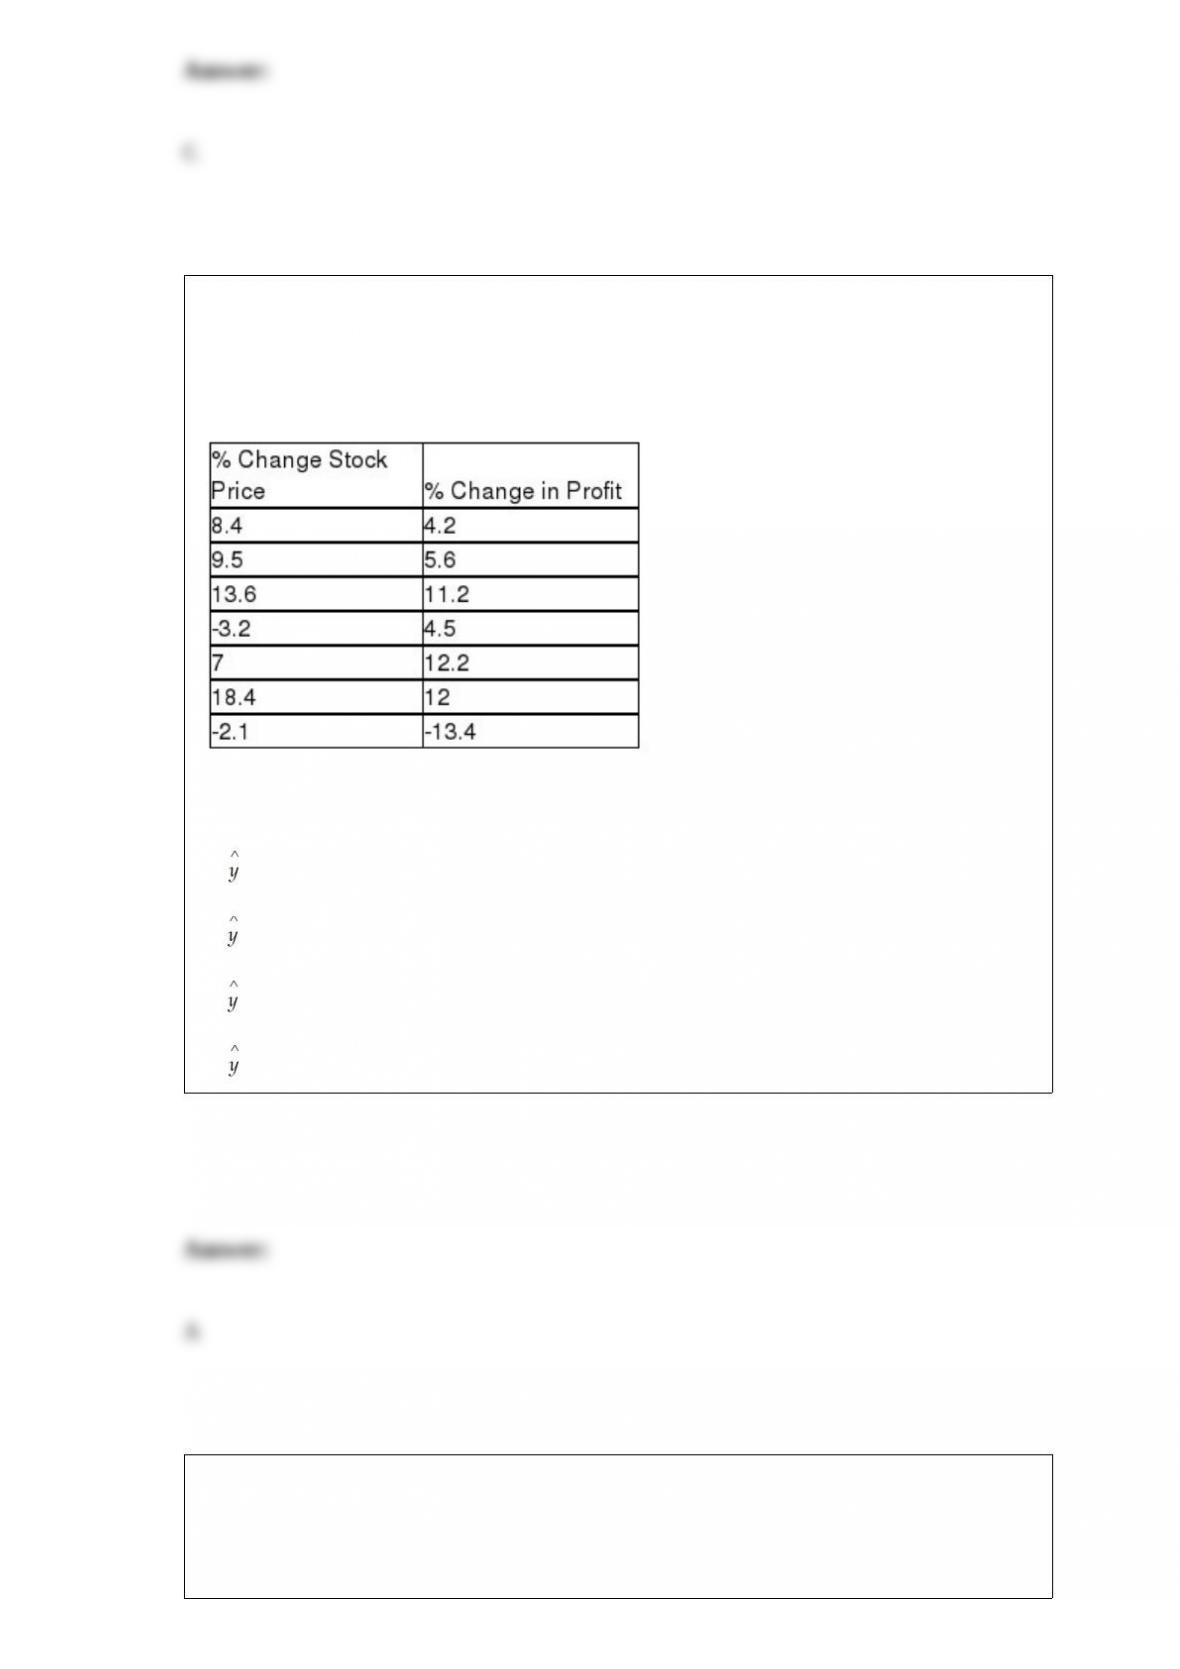
A recent study by a major financial investment company was interested in determining
whether the annual percentage change in stock price for companies is linearly related to
the annual percent change in profits for the company. The following data was
determined for 7 randomly selected companies:
Based upon this sample information, which of the following is the regression equation?
A) = 4.19 + .61x
B) = 15.04 + 4.25x
C) = 1.19 – 3.00x
D) = 20.19 + .005x
If a distribution for a quantitative variable is thought to be nearly symmetric with very
little variation, and a box and whisker plot is created for this distribution, which of the
following is true?

A) The box will be quite wide but the whisker will be very short.
B) The left and right-hand edges of the box will be approximately equal distance from
the median.
C) The whiskers should be about half as long as the box is wide.
D) The upper whisker will be much longer than the lower whisker.
Which one of the following is not a source of variation?
A) People
B) Measurement
C) Materials
D) Control
In an application to estimate the mean number of miles that downtown employees
commute to work roundtrip each day, the following information is given:
n = 20
= 4.33
s = 3.50
If the desired confidence level is 95 percent, the appropriate critical value is:

A) z = 1.96
B) t = 2.093
C) t = 2.086
D) .7826
For a standardized normal distribution, calculate P(-1.28 < z < 1.75).
A) 0.3997
B) 0.4599
C) 0.1404
D) 0.8596
A company has developed a linear trend model to forecast monthly sales. The following
data show the actual sales and the “fitted” sales for months 1-12.
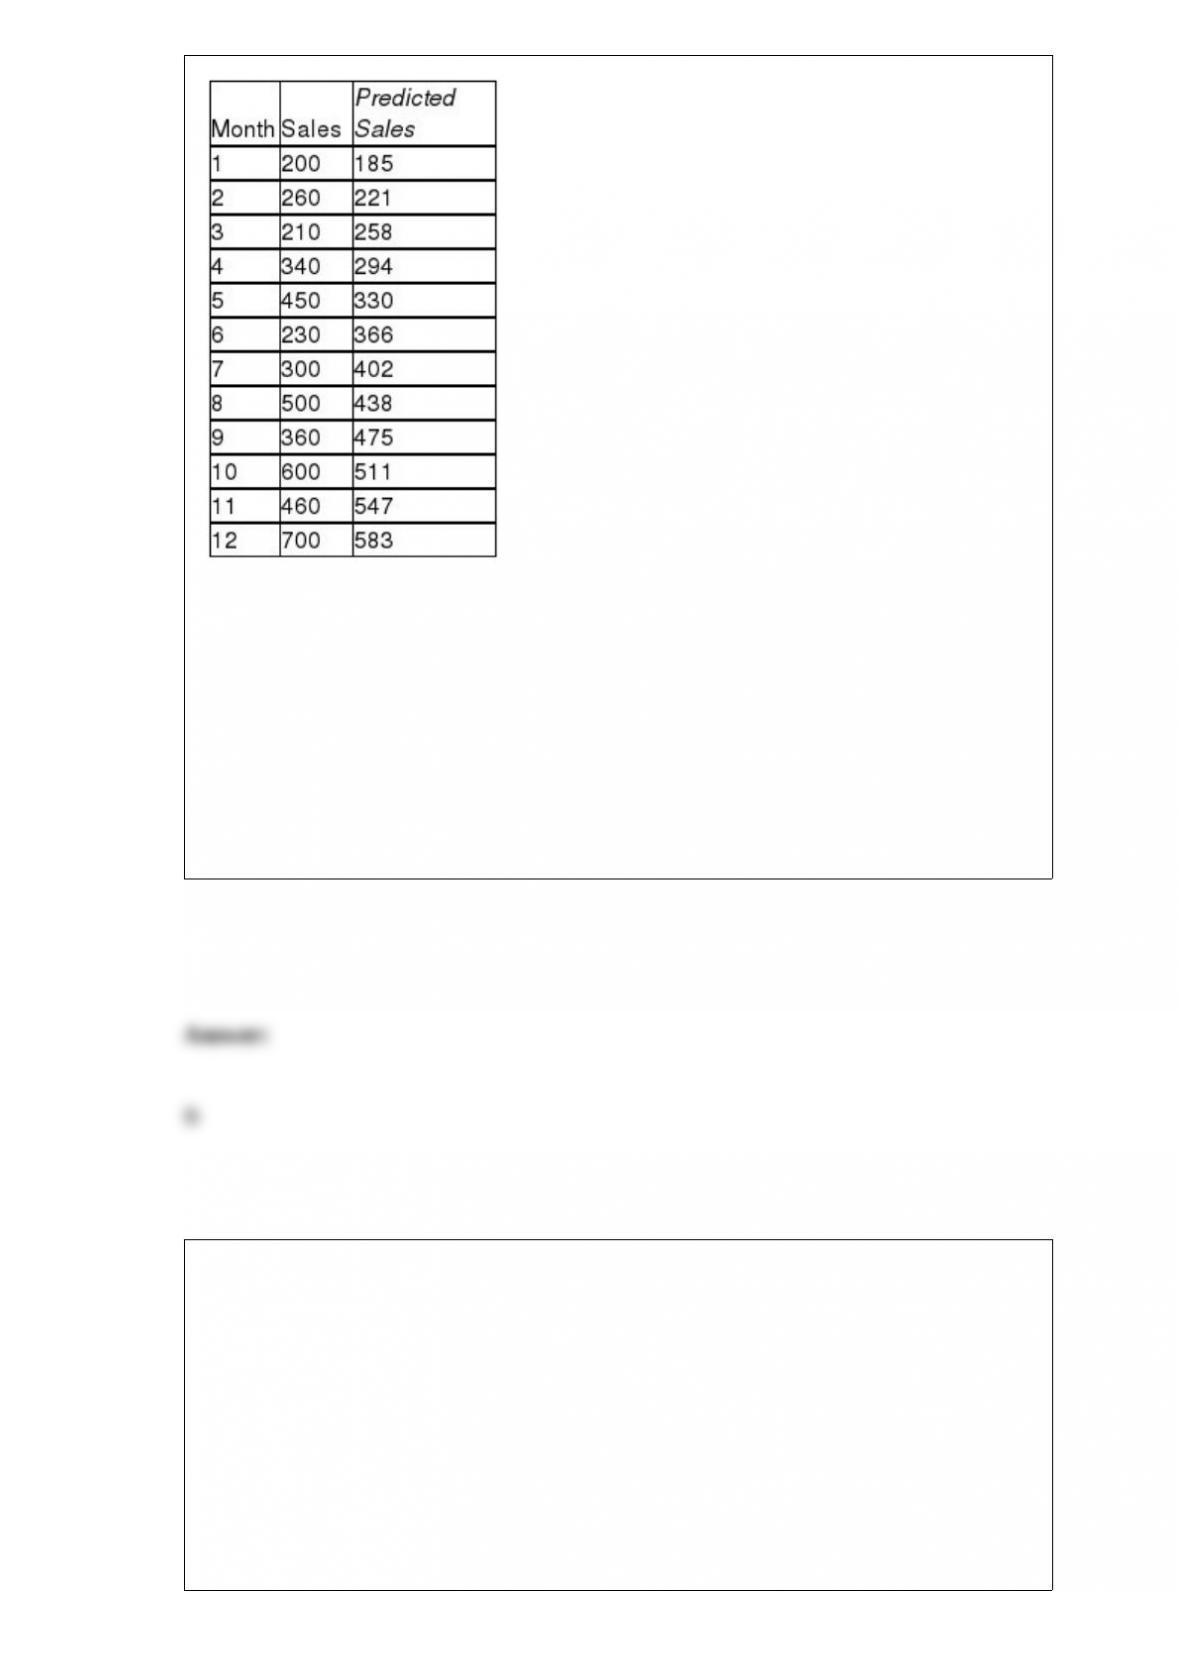
Based on these data, what is the value for the mean absolute deviation for months 1-12?
A) Approximately 975
B) About 81
C) Nearly 150
D) None of the above
A regional hardware chain is interested in estimating the proportion of their customers
who own their own homes. There is some evidence to suggest that the proportion might
be around 0.70. Given this, what sample size is required if they wish a 90 percent
confidence level with a margin of error of .025?
A) About 355
B) Approximately 910
C) Almost 1,300

D) 100
One of the primary advantages of using the median as a measure of the center for a set
of data is that the median is not affected by extreme values in the data.