Use the information below to answer the following question(s).
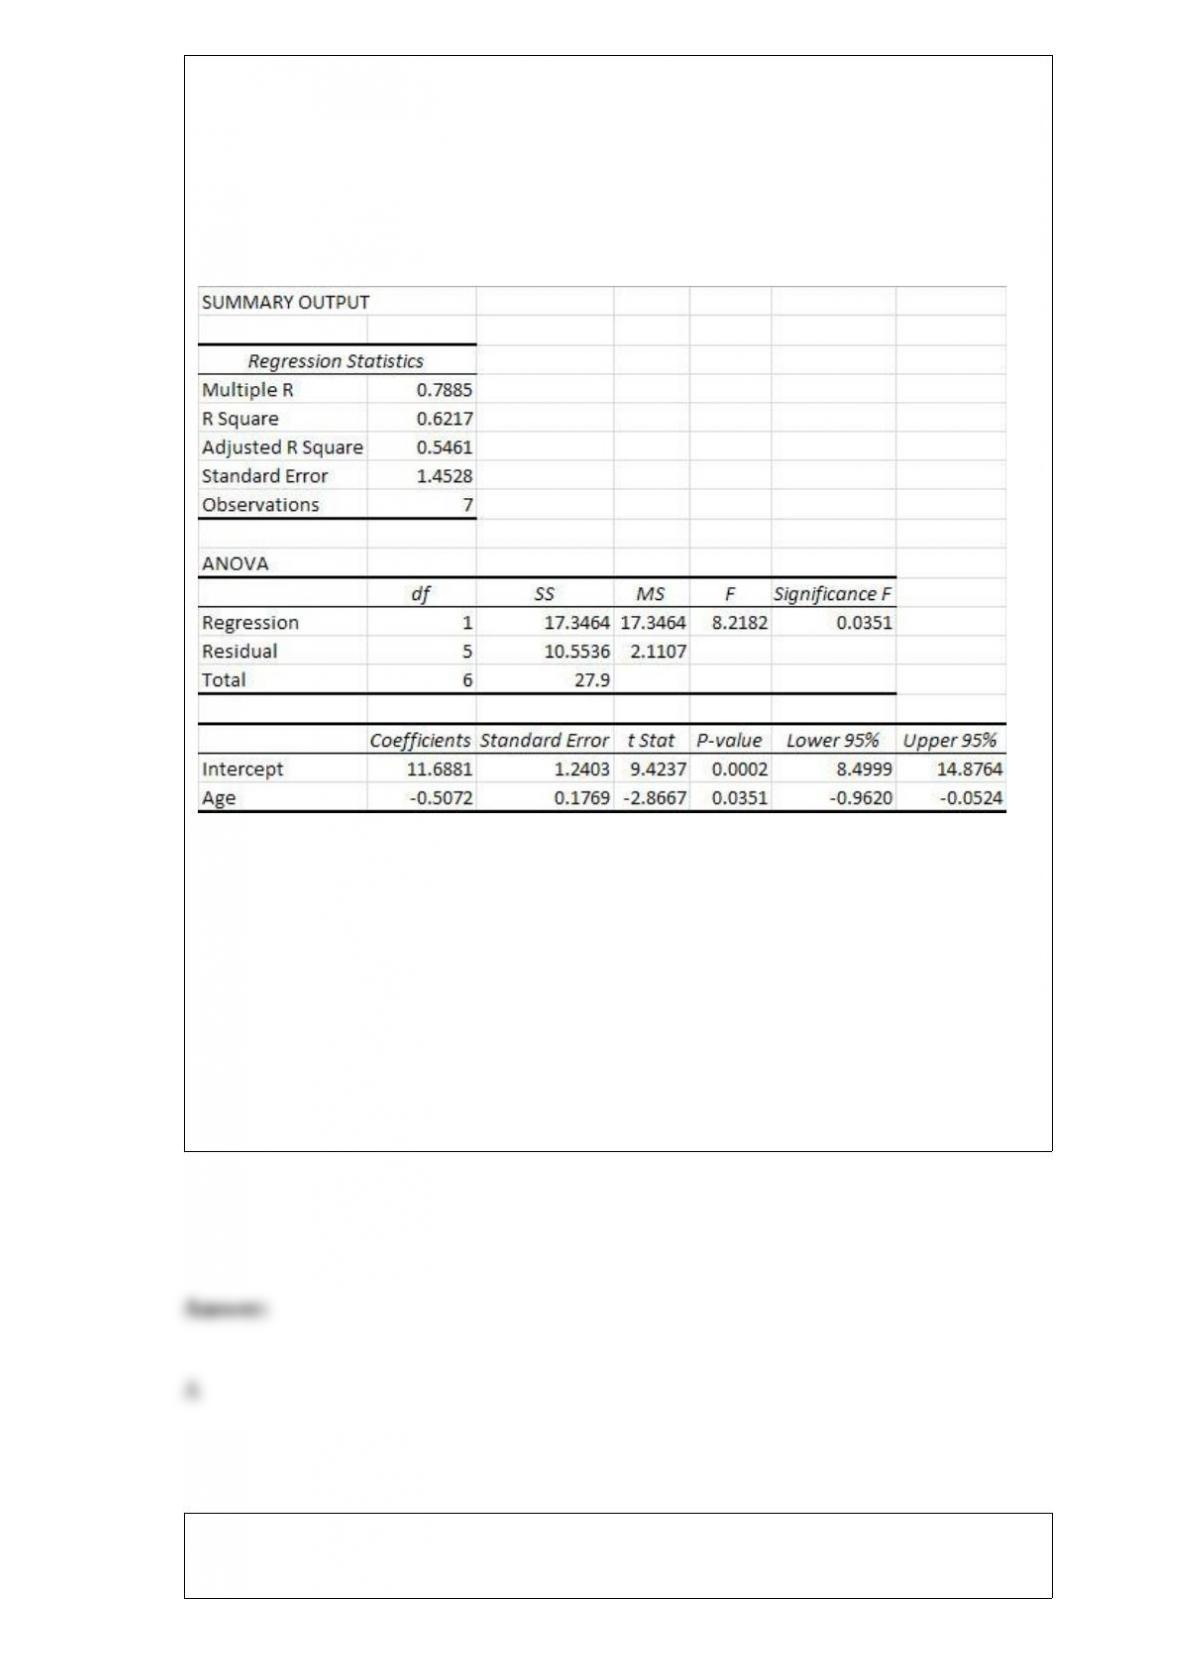
Cars.com would like to use simple regression to predict the selling price of a used car,
in thousands of dollars, based on the age of the car in years. A random sample of used
cars was selected and the result of the regression analysis is shown below.
According to these regression results, the average selling price for a 7-year old car is
________.
A) $8,138
B) $9,663
C) $10,150
D) $11,435
Use the following information to answer the question(s) below.
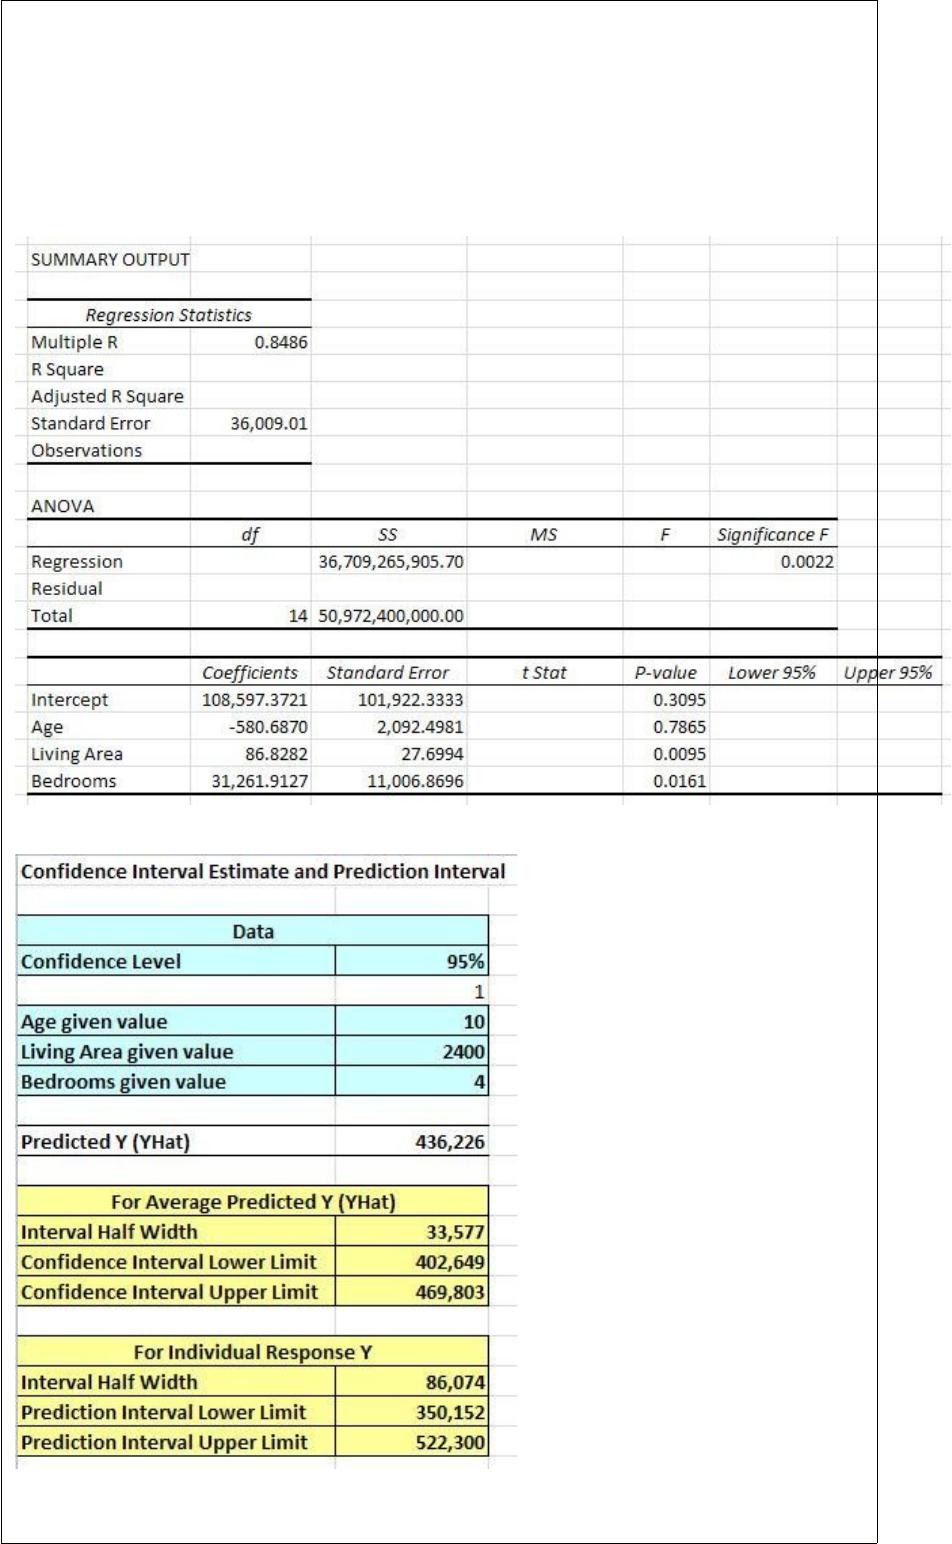
A home appraisal company would like to develop a regression model that would predict
the selling price of a house based on the age of the house in years (Age), the living area
of the house in square feet (Living Area) and the number of bedrooms (Bedrooms). The
following Excel output shows the partially completed regression output from a random
sample of homes that have recently sold.
Every additional bedroom in the house will
_______________________________________.
A) increase the average selling price by $108,597
B) decrease the average selling price by $101,922
C) increase the average selling price by $31,262
D) decrease the average selling price by $31,262
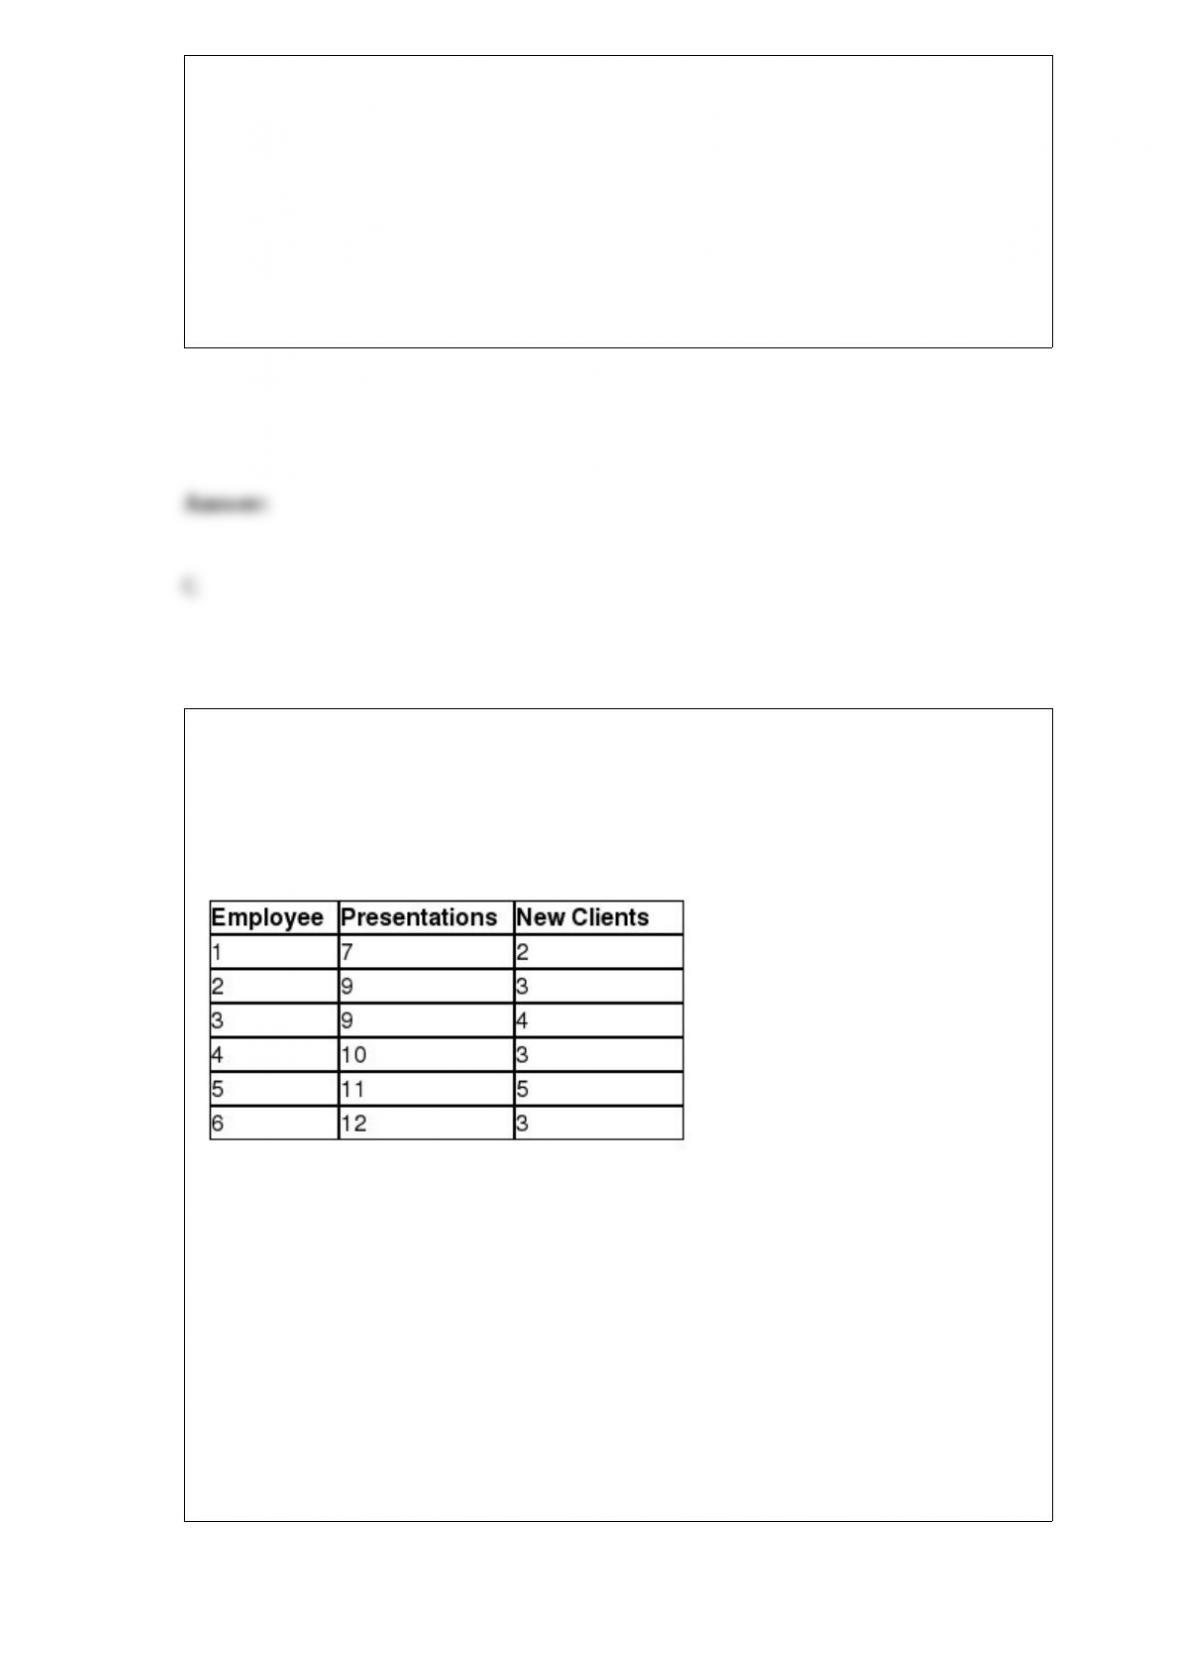
Sarah is the office manager for a group of financial advisors who provide financial
services for individual clients. She would like to investigate whether a relationship
exists between the number of presentations made to prospective clients in a month and
the number of new clients per month. The following table shows the number of
presentations and corresponding new clients for a random sample of six employees.
Sarah would like to use simple regression analysis to estimate the number of new
clients per month based on the number of presentations made by the employee per
month. The sum of squares regression for this sample is ________.
A) 1.01
B) 1.42
C) 2.97
D) 4.08

The Fortune 500 is comprised of Fortune magazine’s annual list of the top 500
companies in the U.S. ranked by revenues. According to Catalyst, 16% of positions on
corporate boards at Fortune 500 companies were held by women in a recent year. A
random sample of 100 Fortune 500 companies was selected. The standard error of the
proportion is ________.
A) 0.0125
B) 0.0329
C) 0.0467
D) 0.0592
The following data represent the square footage of 10 three-bedroom condos for sale in
Hilton Head, South Carolina.
1,559 1,625 1,167 1,264 1,676 1,300 2,058 1,126 1,858 1,321
Determine the percentile of the home that has 1,167 square feet.
The Centers for Disease Control (CDC) would like to test the hypothesis that the
proportion of obese adults in the U.S. has increased this year when compared to last
year. A random sample of 125 adults this year found that 56 were obese. Last year, a
random sample of 140 adults found that 42 were obese. If Population 1 is defined as
this year and Population 2 is defined as last year, the pooled estimate for the overall
proportion is ________.
A) 0.290
B) 0.315
C) 0.370
D) 0.392
The interval measurement level is considered quantitative data.
The Department of Transportation would like to investigate if a difference exists in the
proportion of flights that arrive on-time between Alaska Airlines, Delta Airlines,
Southwest Airlines, and United Airlines. The following data represent the number of
on-time flights from random samples taken from each airline.
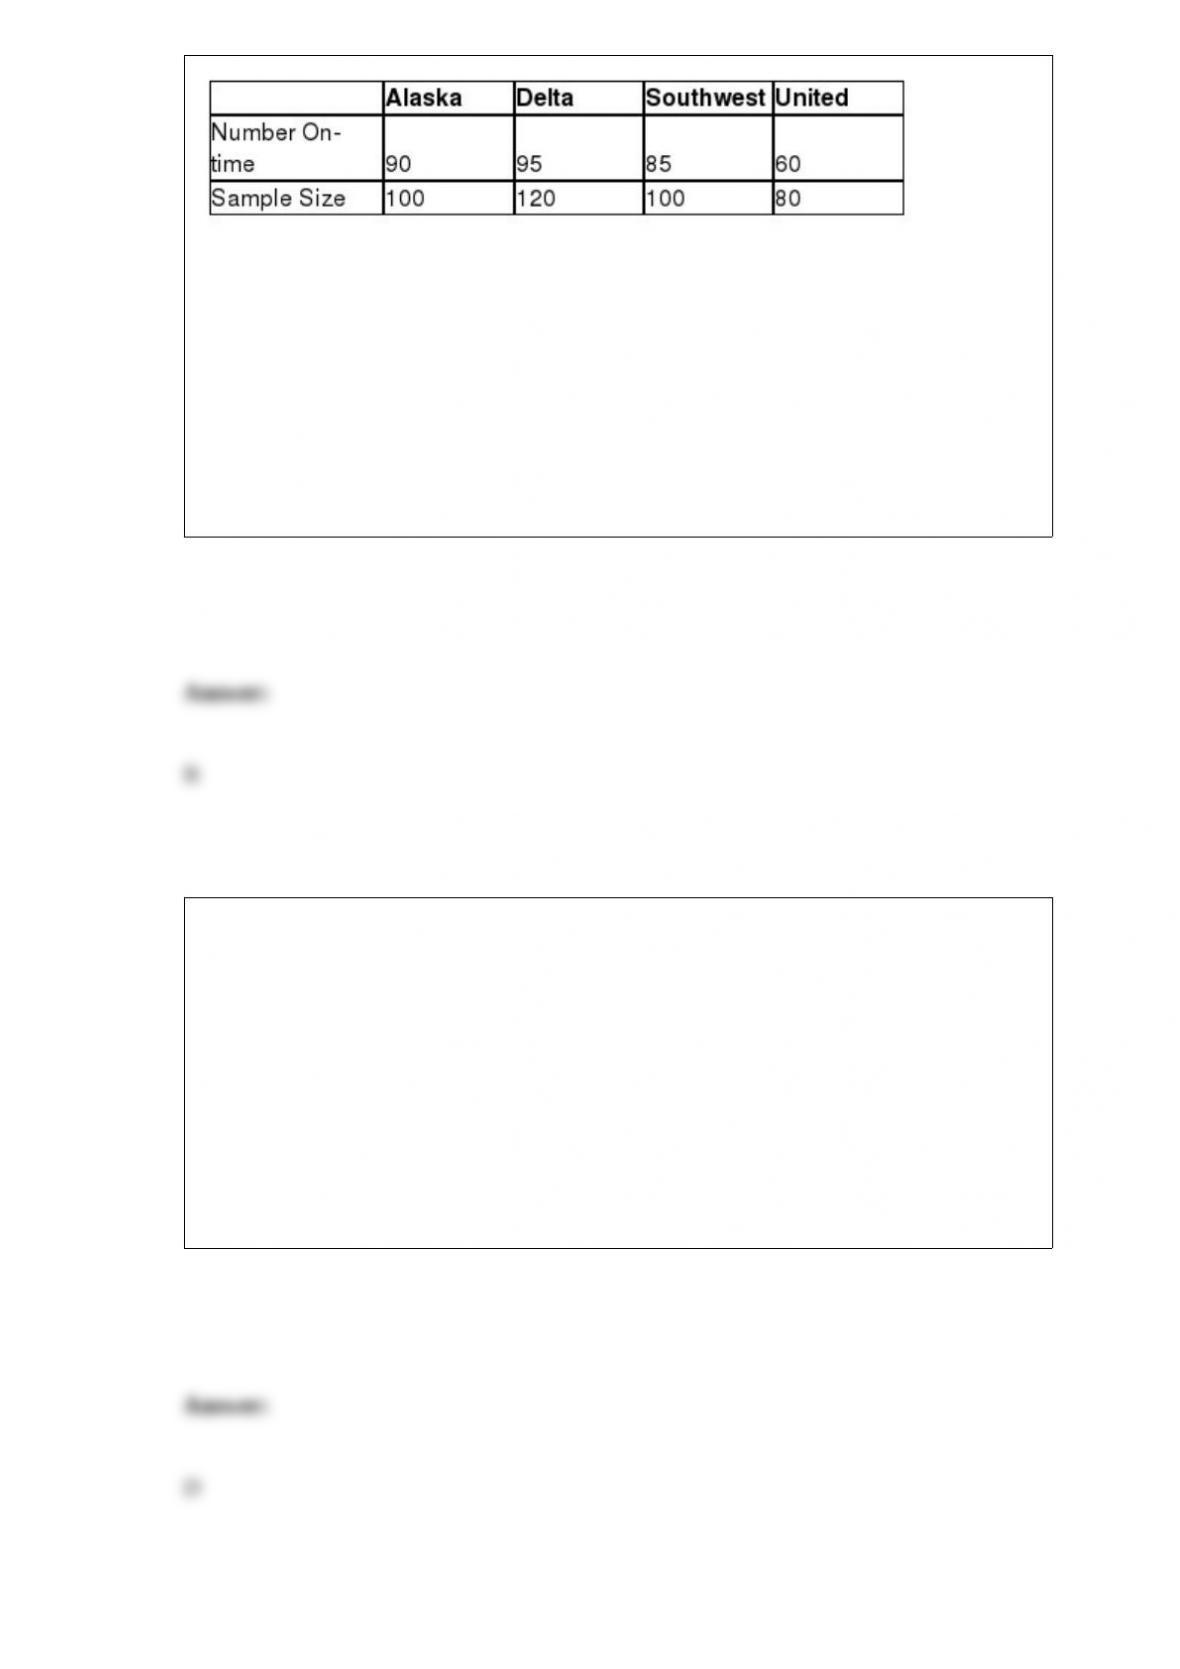
The expected frequency of on-time flights from the Alaska sample is ________.
A) 66
B) 82.5
C) 90
D) 99
Bob’s golf score at his local course follows the normal distribution with a mean of 92.1
and a standard deviation of 3.8. What is the probability that the score on his next round
of golf will be less than 100?
A) 0.5000
B) 0.7357
C) 0.8665
D) 0.9812
According to the Deloitte EV Survey, 5% of respondents indicated that they would be
willing to pay an extra $500 or more for an electric vehicle versus one with a gasoline
engine. A random sample of 25 adults has been selected. Use the Poisson distribution to
approximate the binomial distribution to determine the probability that more than two
adults from this sample would be willing to pay an extra $500 or more for an electric
vehicle versus one with a gasoline engine.
A) 0.0859
B) 0.1316
C) 0.2765
D) 0.3890
Sheridan Motors is a car dealership that would like to investigate if there is a difference
in the average number of car sales per month between three sales employees using a
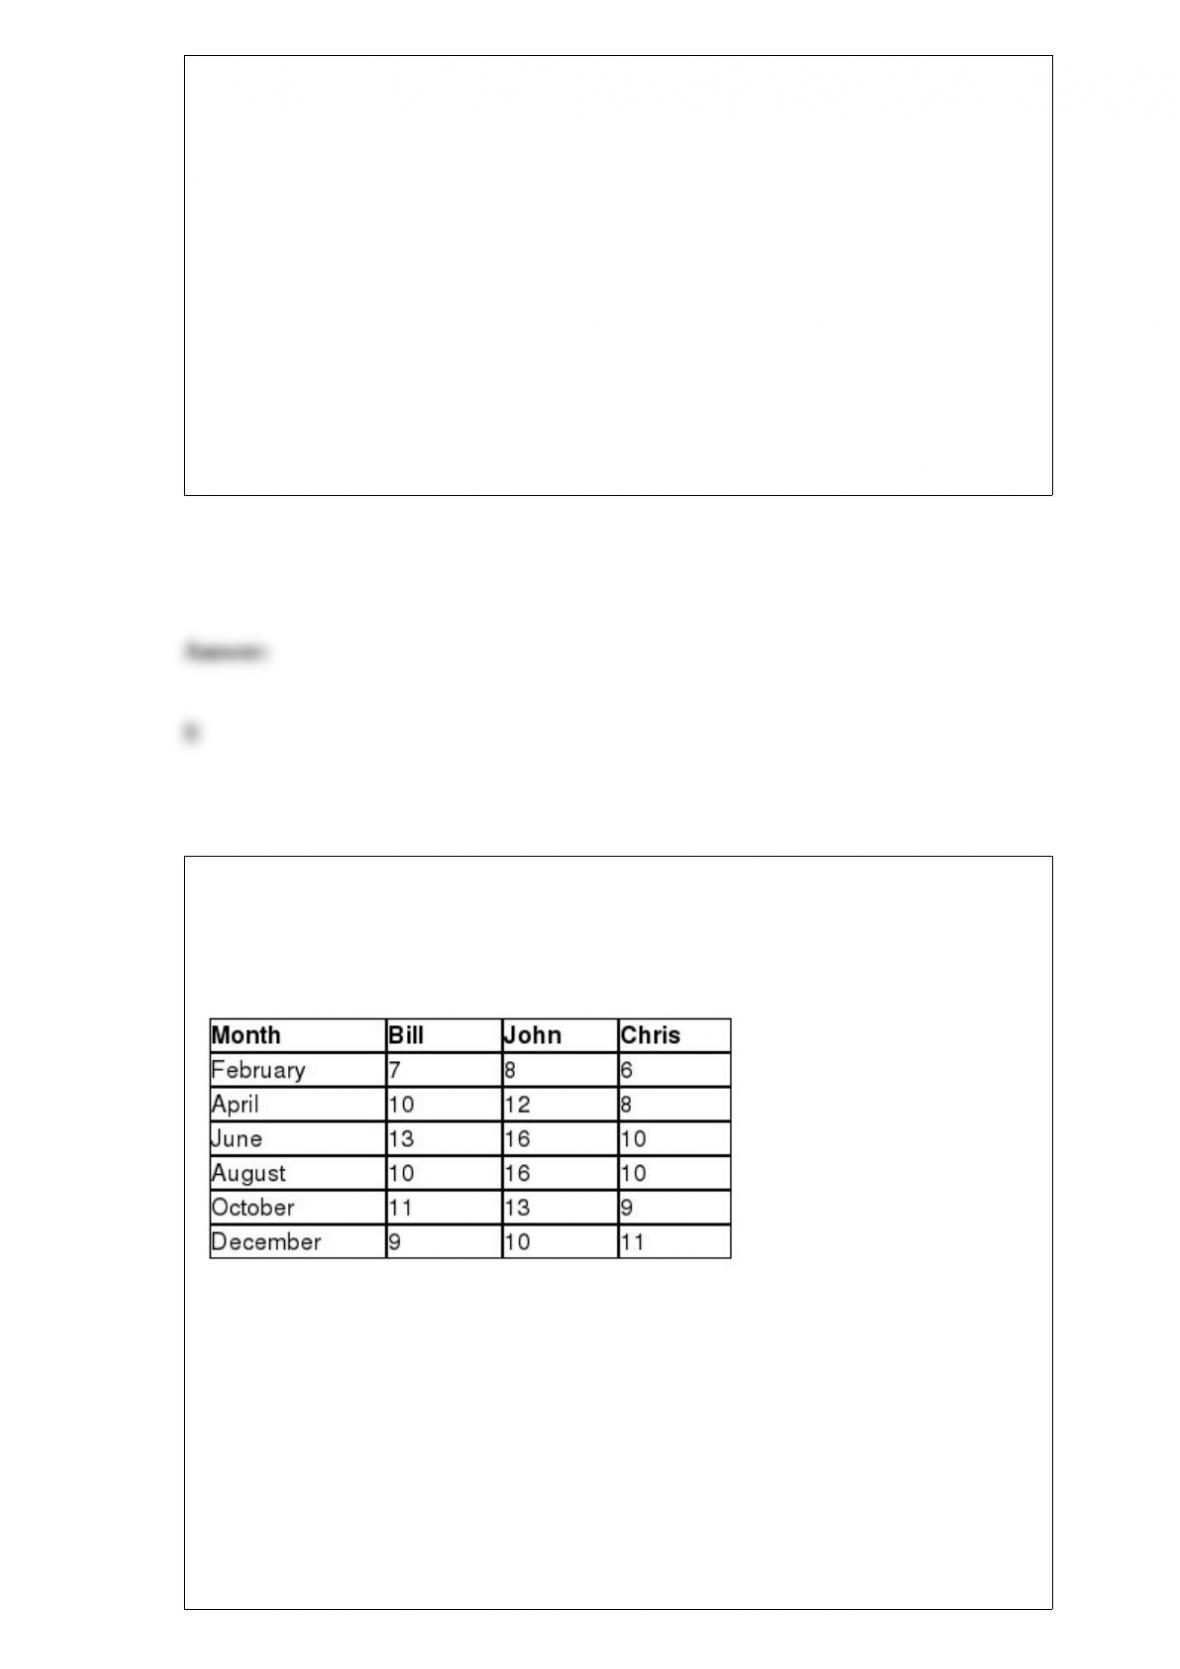
randomized block ANOVA. The following data represent the number of car sales last
year for these employees for six different months.
The conclusion for this hypothesis test using α = 0.05 would be that because the
blocking factor test statistic is
________________________________________________________________.
A) more than the blocking factor critical value, we can conclude that the blocking factor
was not effective
B) less than the blocking factor critical value, we can conclude that the blocking factor
was not effective
C) more than the blocking factor critical value, we can conclude that the blocking factor
was effective
D) less than the blocking factor critical value, we can conclude that the blocking factor
was effective
Costco sells paperback books in their retail stores and wanted to examine the
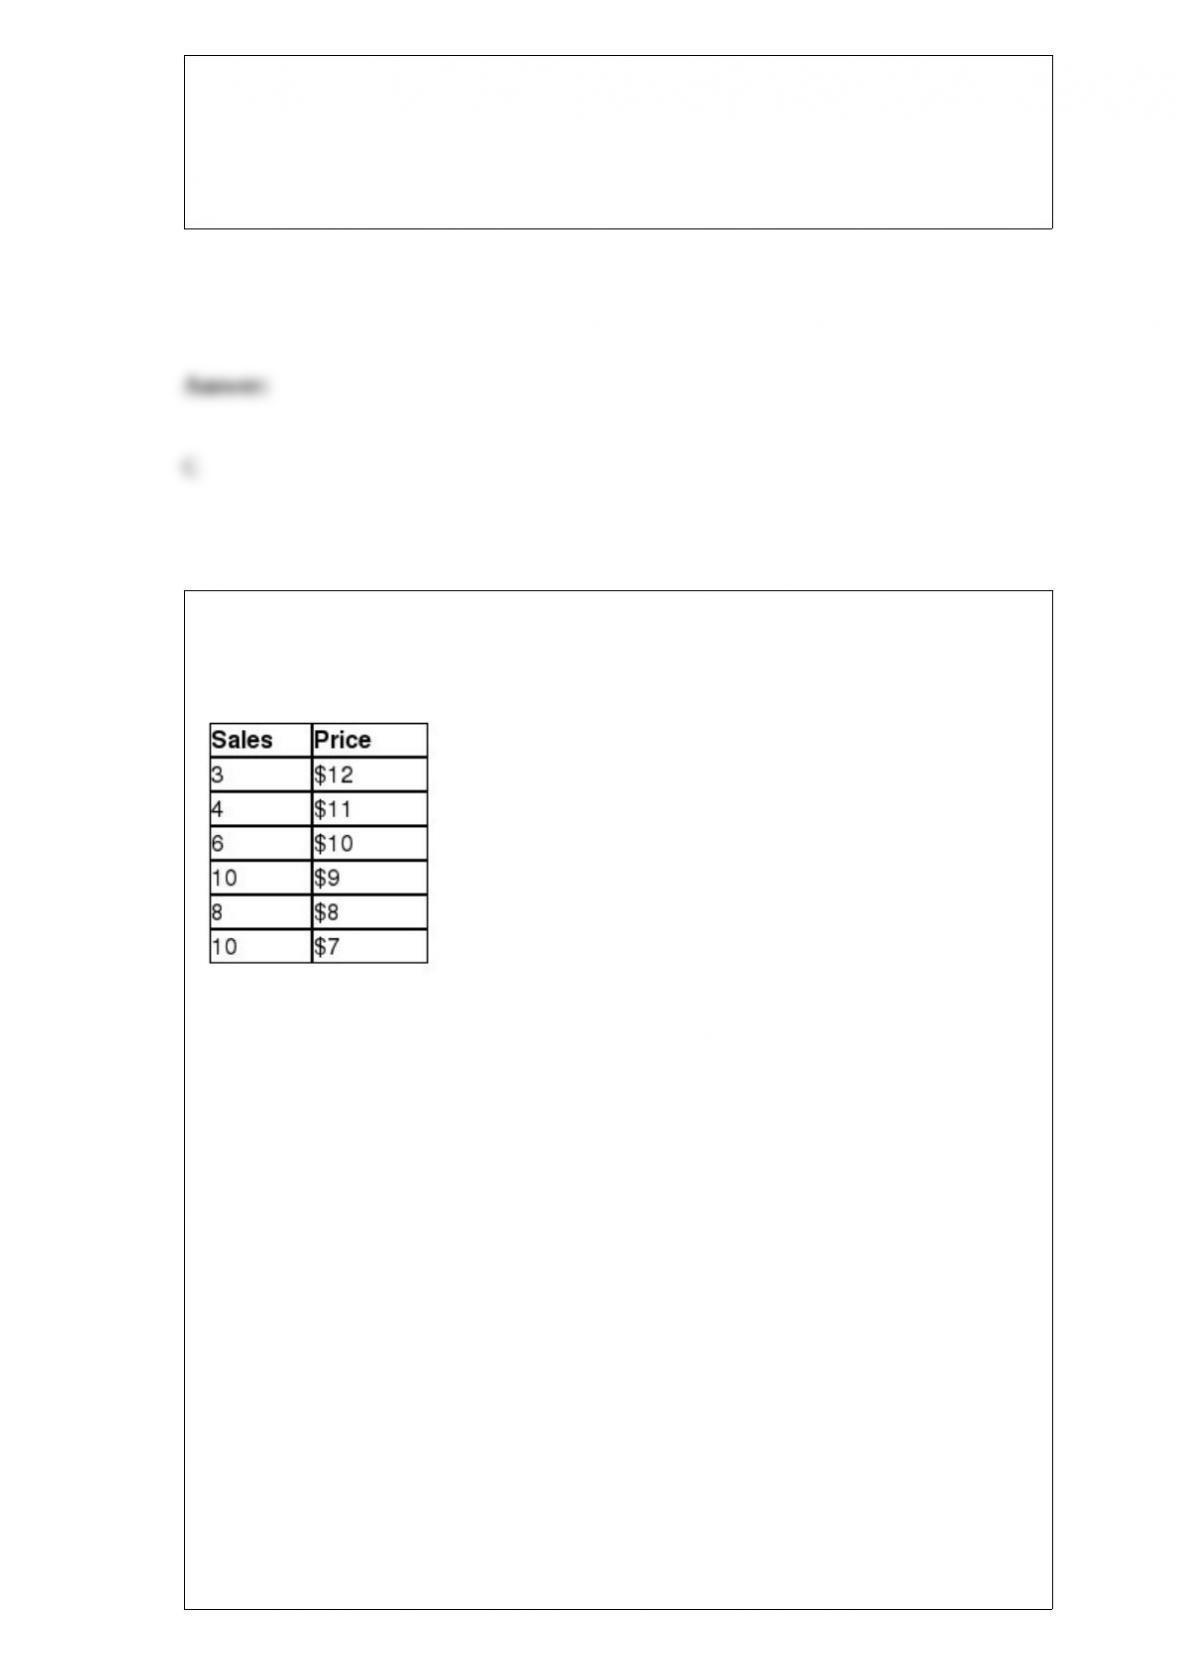
relationship between price and demand. The price of a particular novel was adjusted
each week and the weekly sales were recorded in the table below.
Management would like to use simple regression analysis to estimate weekly demand
for this novel using the price of the novel. Which one of the following statements
describes the results of the hypothesis test that the population slope is not equal to zero
using α = 0.05?
A) Because the absolute value of the test statistic is less than the absolute value of the
critical value, we fail to reject the null hypothesis and cannot conclude that the
population slope is equal to zero.
B) Because the absolute value of the test statistic is less than the absolute value of the
critical value, we can reject the null hypothesis and conclude that the population slope
is equal to zero.
C) Because the absolute value of the test statistic is greater than the absolute value of
the critical value, we can reject the null hypothesis and conclude that the population
slope is not equal to zero.
D) Because the absolute value of the test statistic is greater than the absolute value of
the critical value, we fail to reject the null hypothesis and conclude that the population
slope is equal to zero.
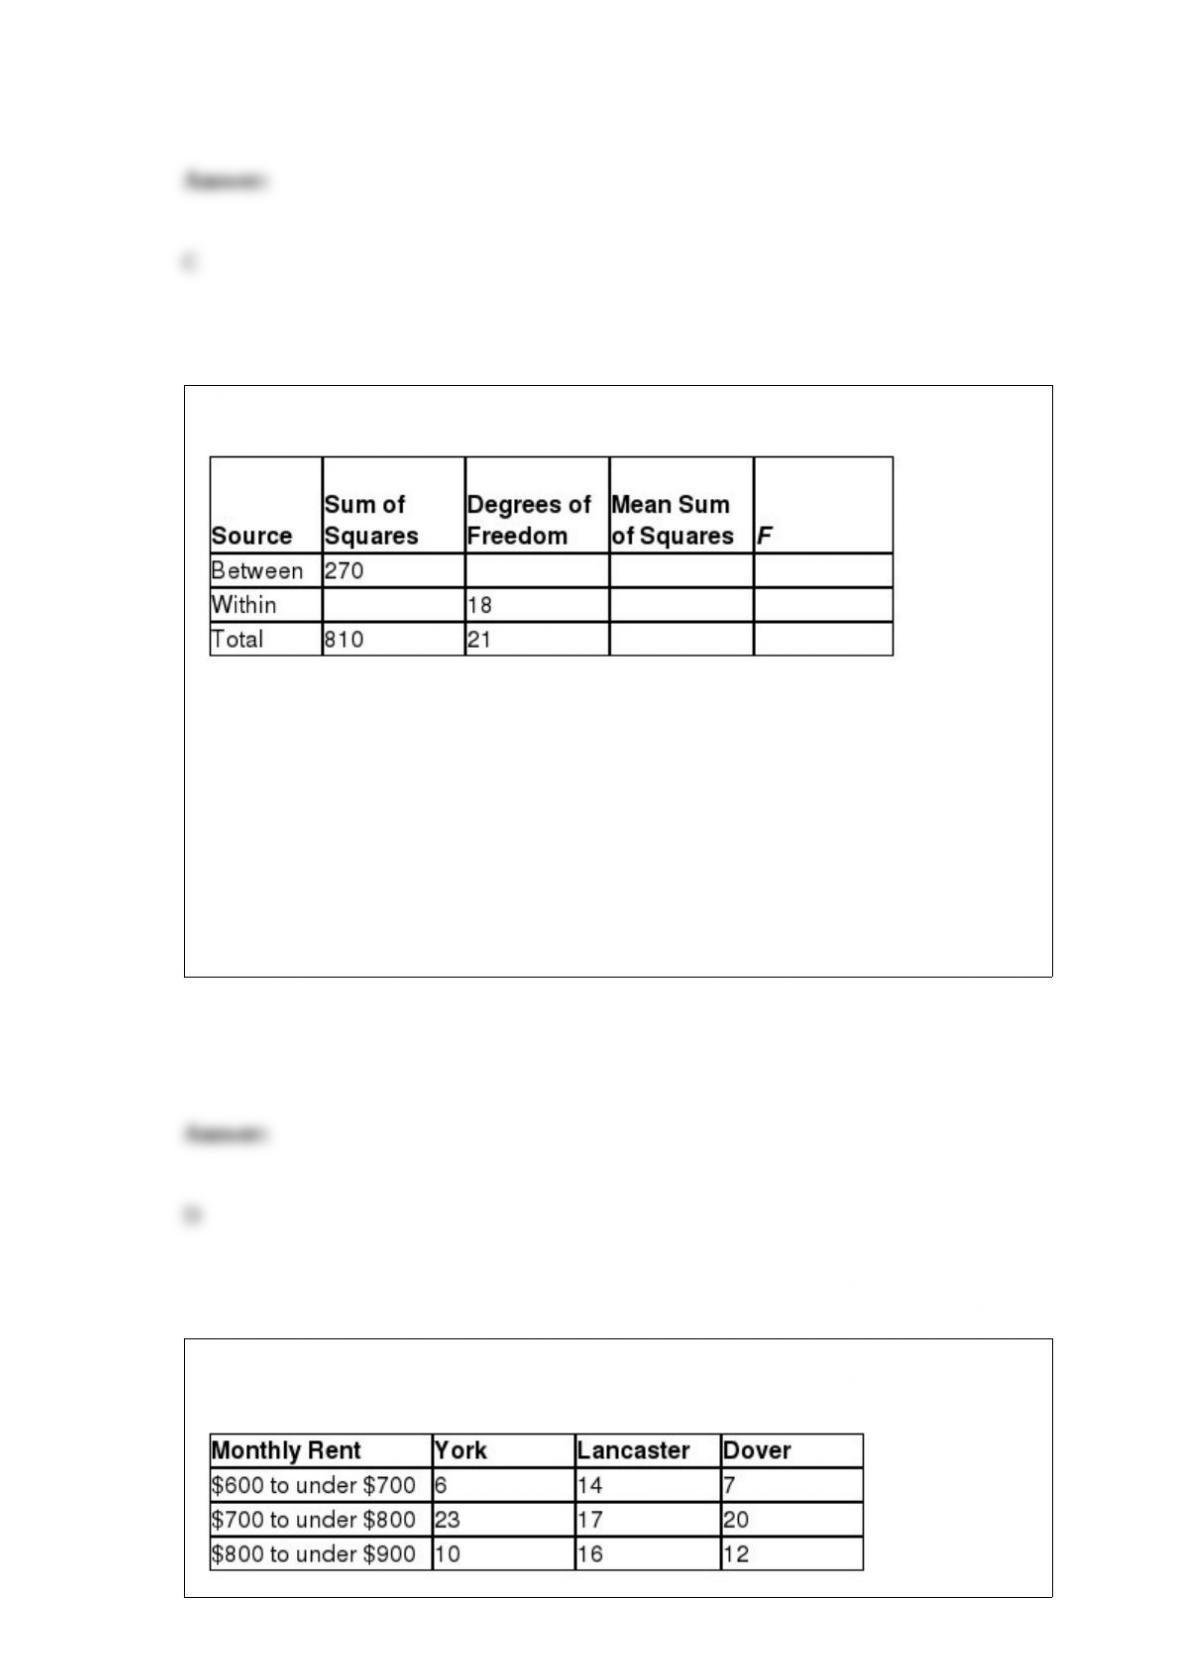
Consider the partially completed one-way ANOVA summary table.
The total number of observations for this ANOVA procedure is ____.
A) 18.
B) 20.
C) 21.
D) 22.
The following contingency table shows the number of two-bedroom apartments
grouped by monthly rent and location.

The probability that a randomly selected apartment from this group was located in York
or Lancaster is ________.
A) 0.350
B) 0.435
C) 0.688
D) 0.712
When testing for the presence of positive autocorrelation and the Durbin-Watson
statistic is between the lower critical value and upper critical value, which one of the
following statements is true?
A) We fail to reject the null hypothesis and conclude that a positive autocorrelation is
present in the time series.
B) We fail to reject the null hypothesis and conclude that no positive autocorrelation is
present in the time series.
C) We reject the null hypothesis and conclude that a positive autocorrelation is present
in the time series.
D) The hypothesis test is inconclusive.
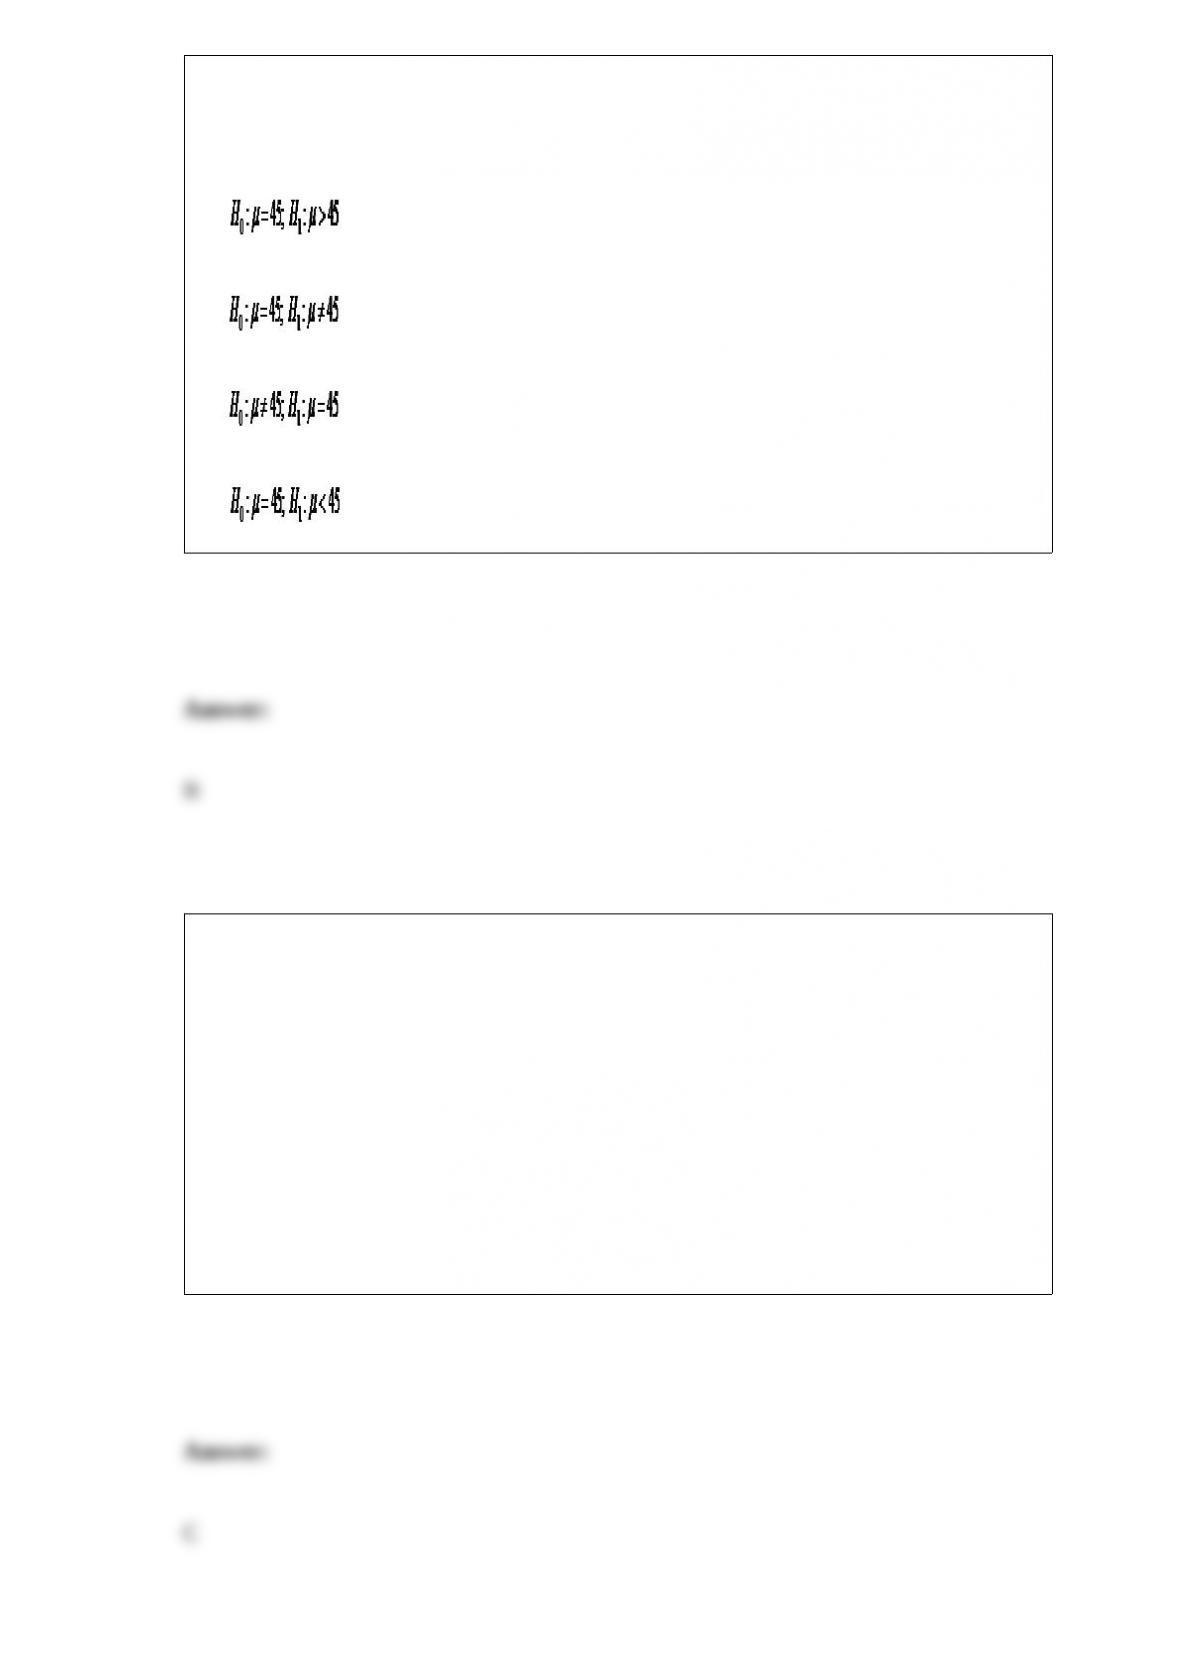
A professor would like to test the hypothesis that the average number of minutes that a
student needs to complete a statistics exam is equal to 45 minutes. The correct
hypothesis statement would be ______________________.
A)
B)
C)
D)
If a customer at a particular grocery store uses coupons, there is a 50% probability that
the customer will pay with a debit card. Thirty percent of customers use coupons and
35% of customers pay with debit cards. Given that a customer does not pay with a debit
card, the probability that the same customer does not use coupons is ________.
A) 0.52
B) 0.60
C) 0.77
D) 0.85
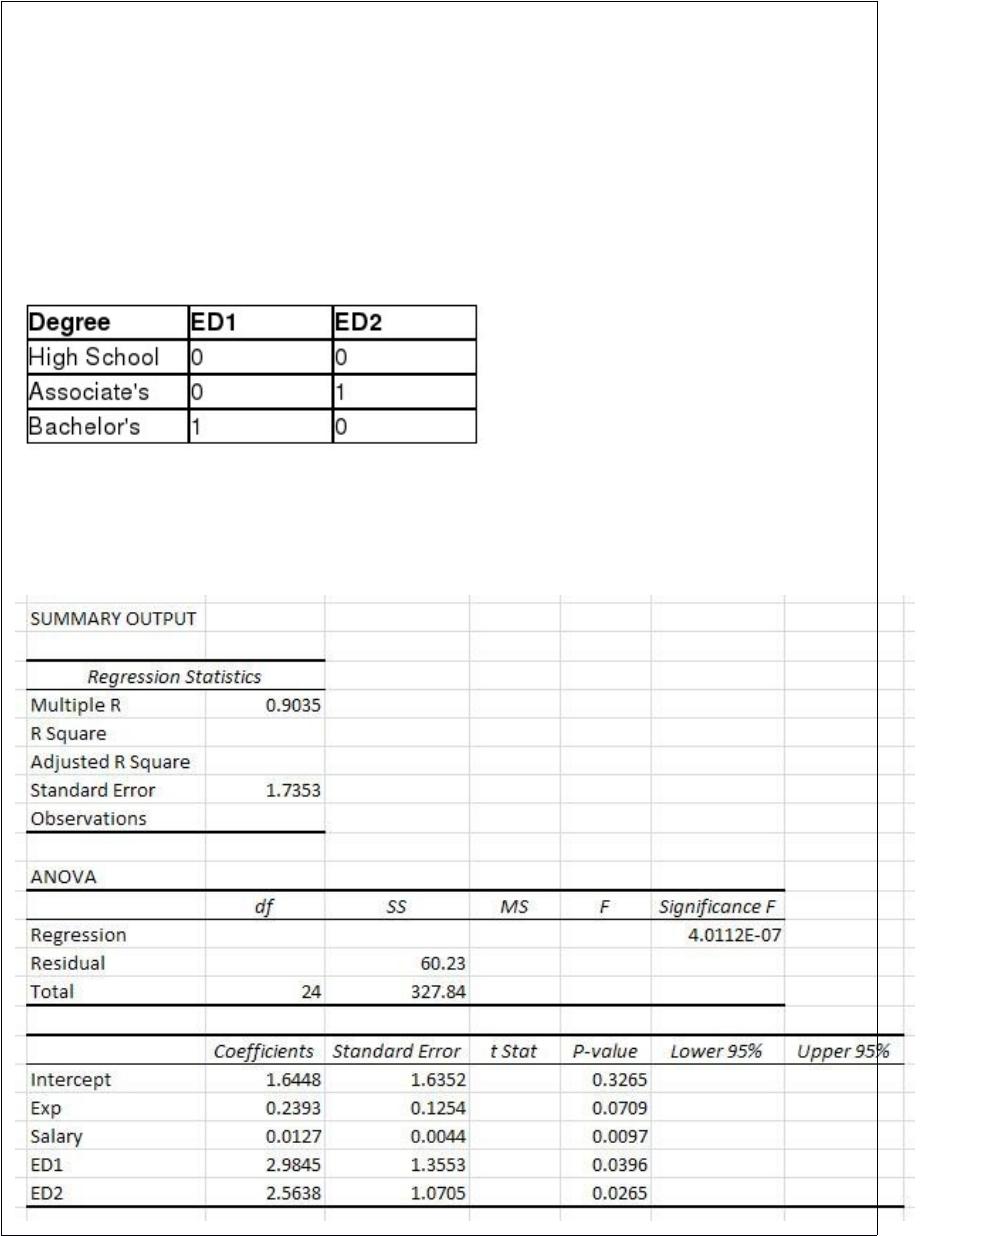
Use the following information to answer the question(s) below.
Ford would like to develop a regression model that would predict the number of cars
sold per month by a dealership employee based on the employee’s number of years of
sales experience (Exp), the employee’s weekly base salary before commissions (Salary),
and the education level of the employee. There are three levels of education in the sales
forcehigh school degree, associate’s degree, and bachelor’s degree. The following
dummy variables have been defined.
The following Excel output shows the partially completed regression output from a
random sample of employees from the previous month.
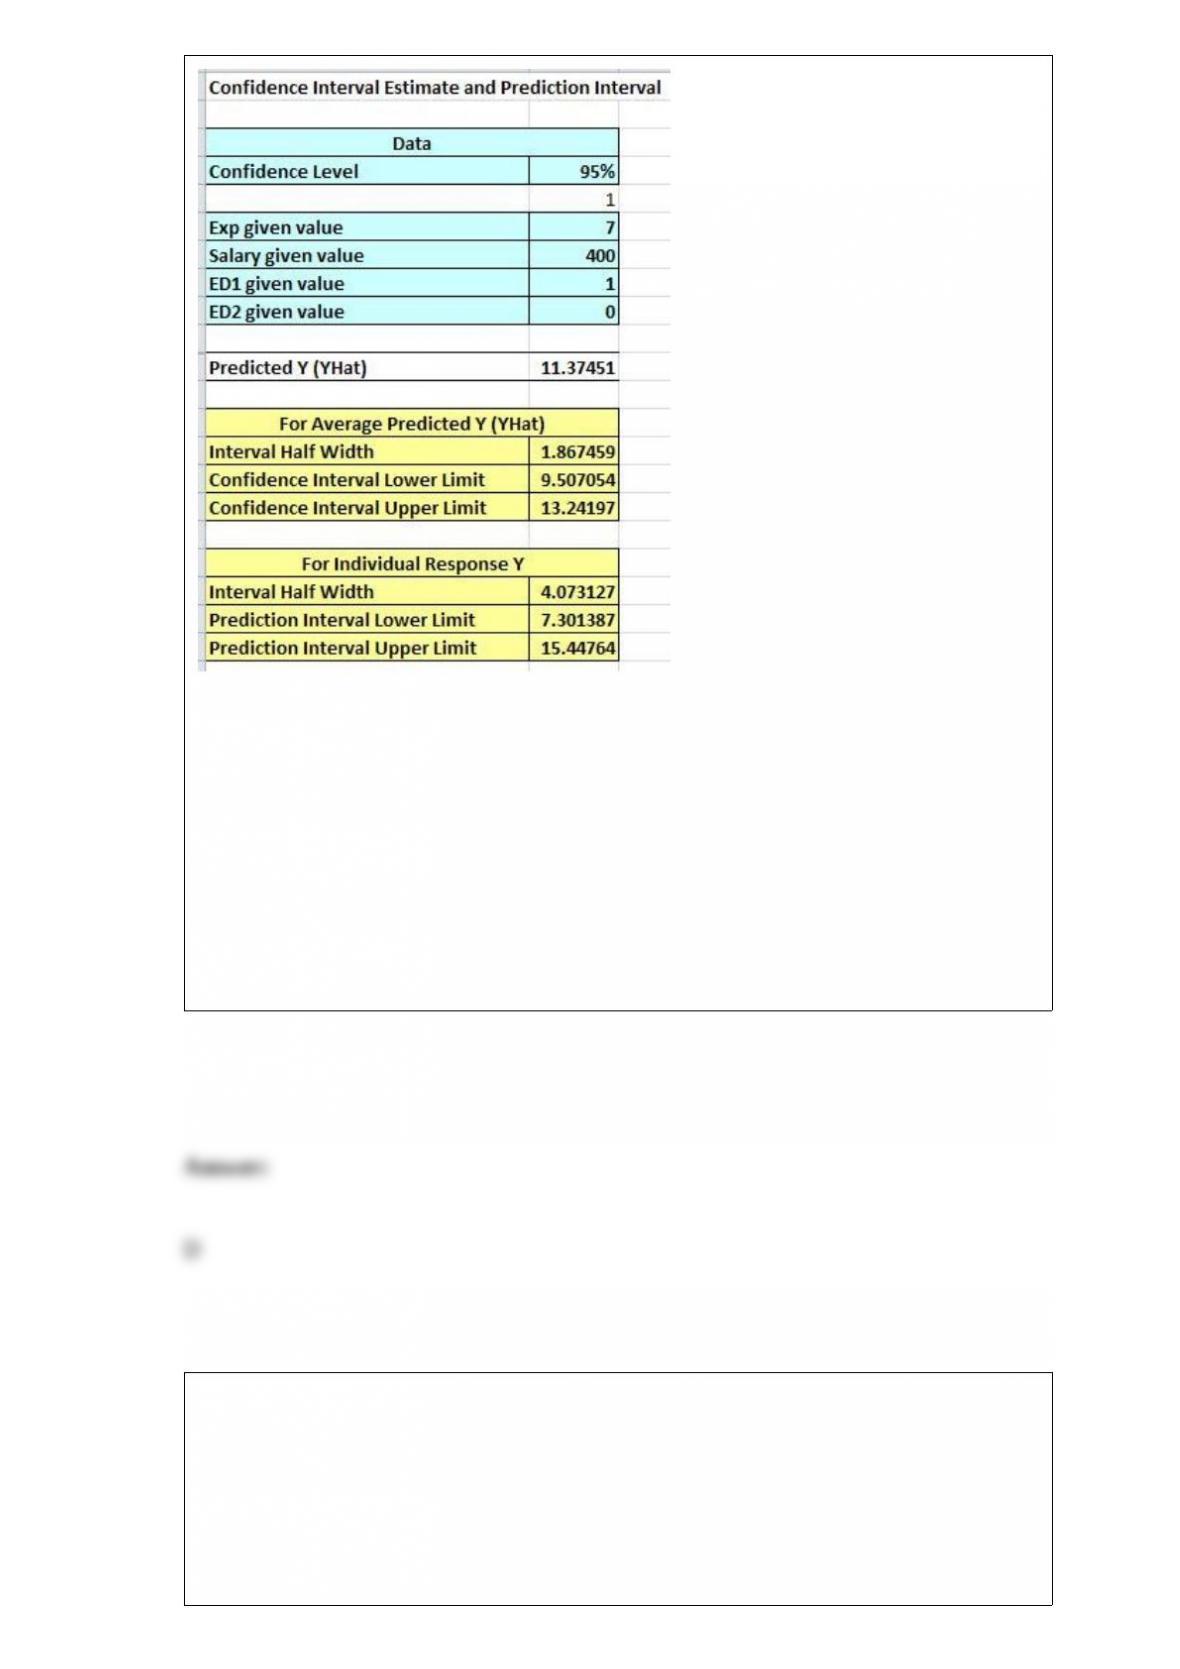
The degrees of freedom for the critical value to test the significance of the regression
coefficients using α = 0.05 are ________.
A) 15
B) 17
C) 18
D) 20
________ display the proportion of observations of each class relative to the total
number of observations.
A) Frequency distributions
B) Cumulative relative frequency distributions
C) Relative frequency distributions
D) Histograms
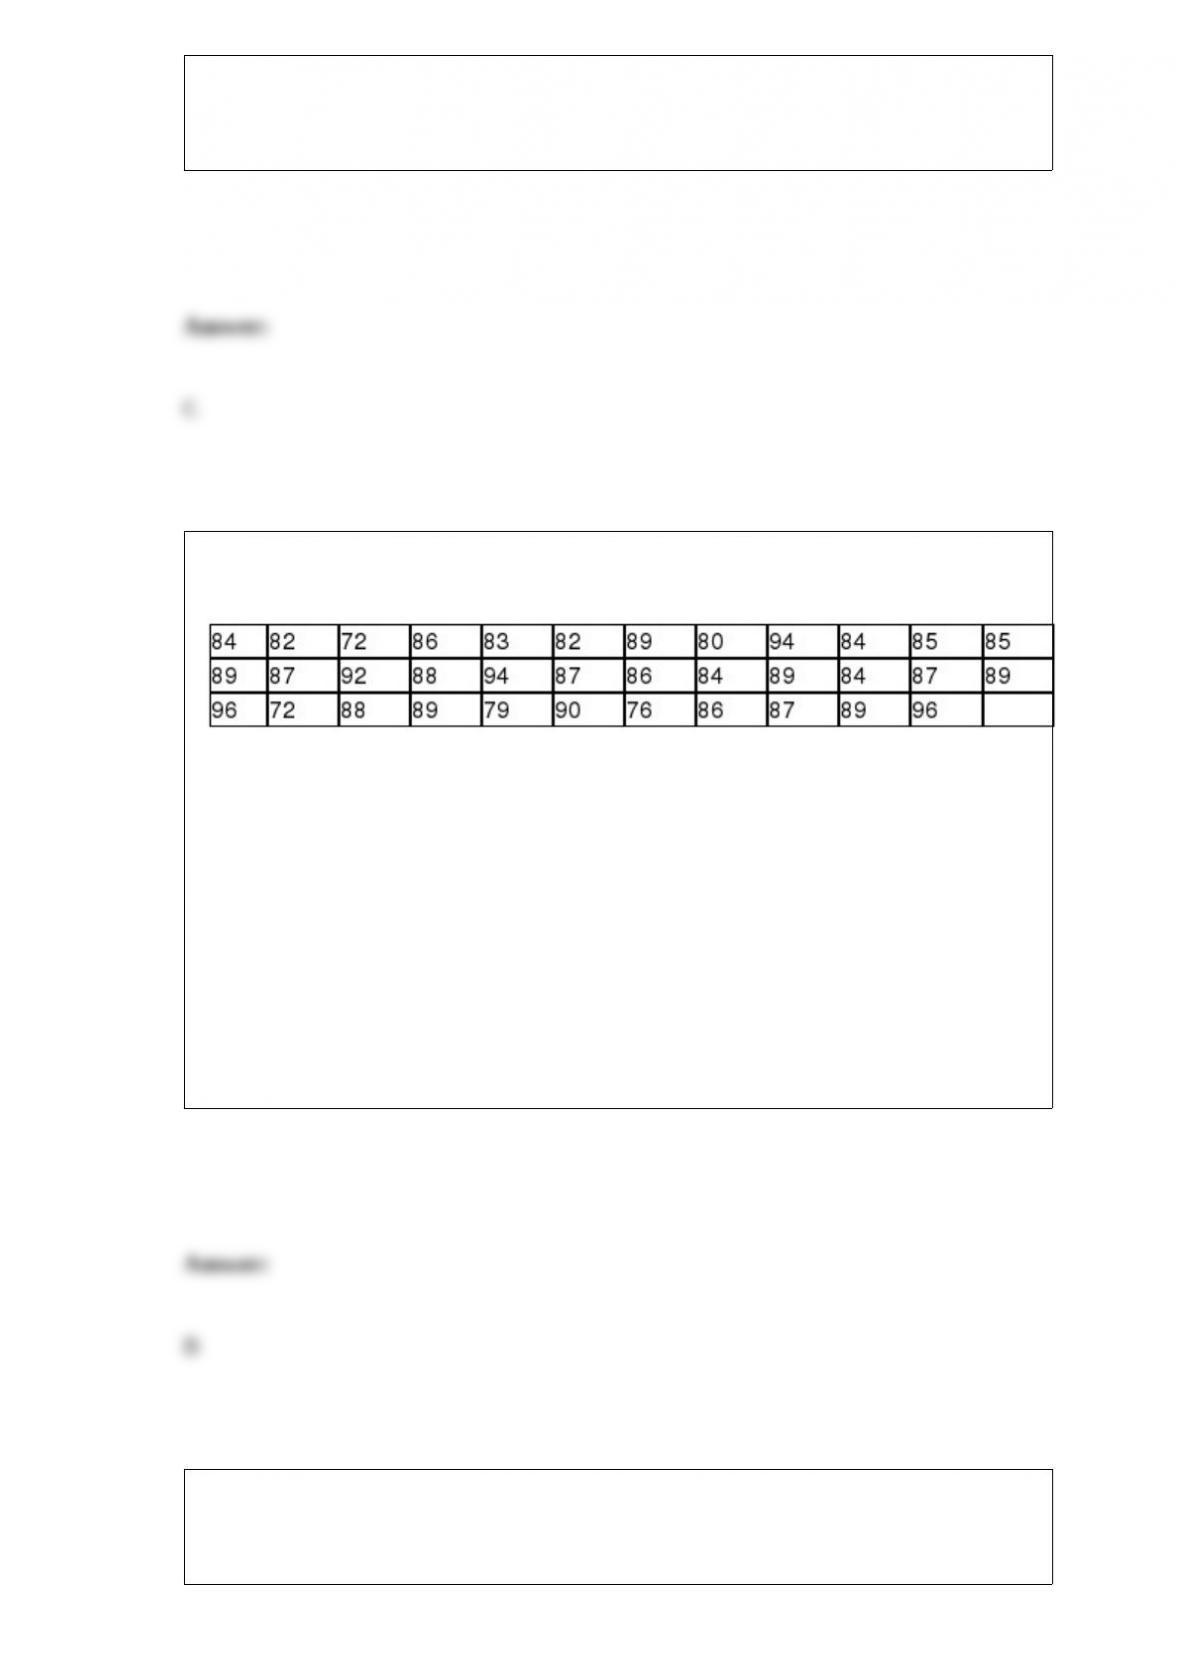
The following data represent a random sample the golf scores for a particular golfer
from a course that he regularly plays.
This golfer would like to test if his golf scores at this course follow the normal
probability distribution with μ = 85.0 and σ = 5.0 using α = 0.05. The critical value for
this hypothesis test is ________.
A) 5.991
B) 7.851
C) 9.448
D) 11.070
An office building has four copier machines that require the administrative assistant to
replenish the paper supply when the paper bin is empty. It is believed that the need for
paper for a copier on any given day follows the binomial distribution with p = 0.50. The
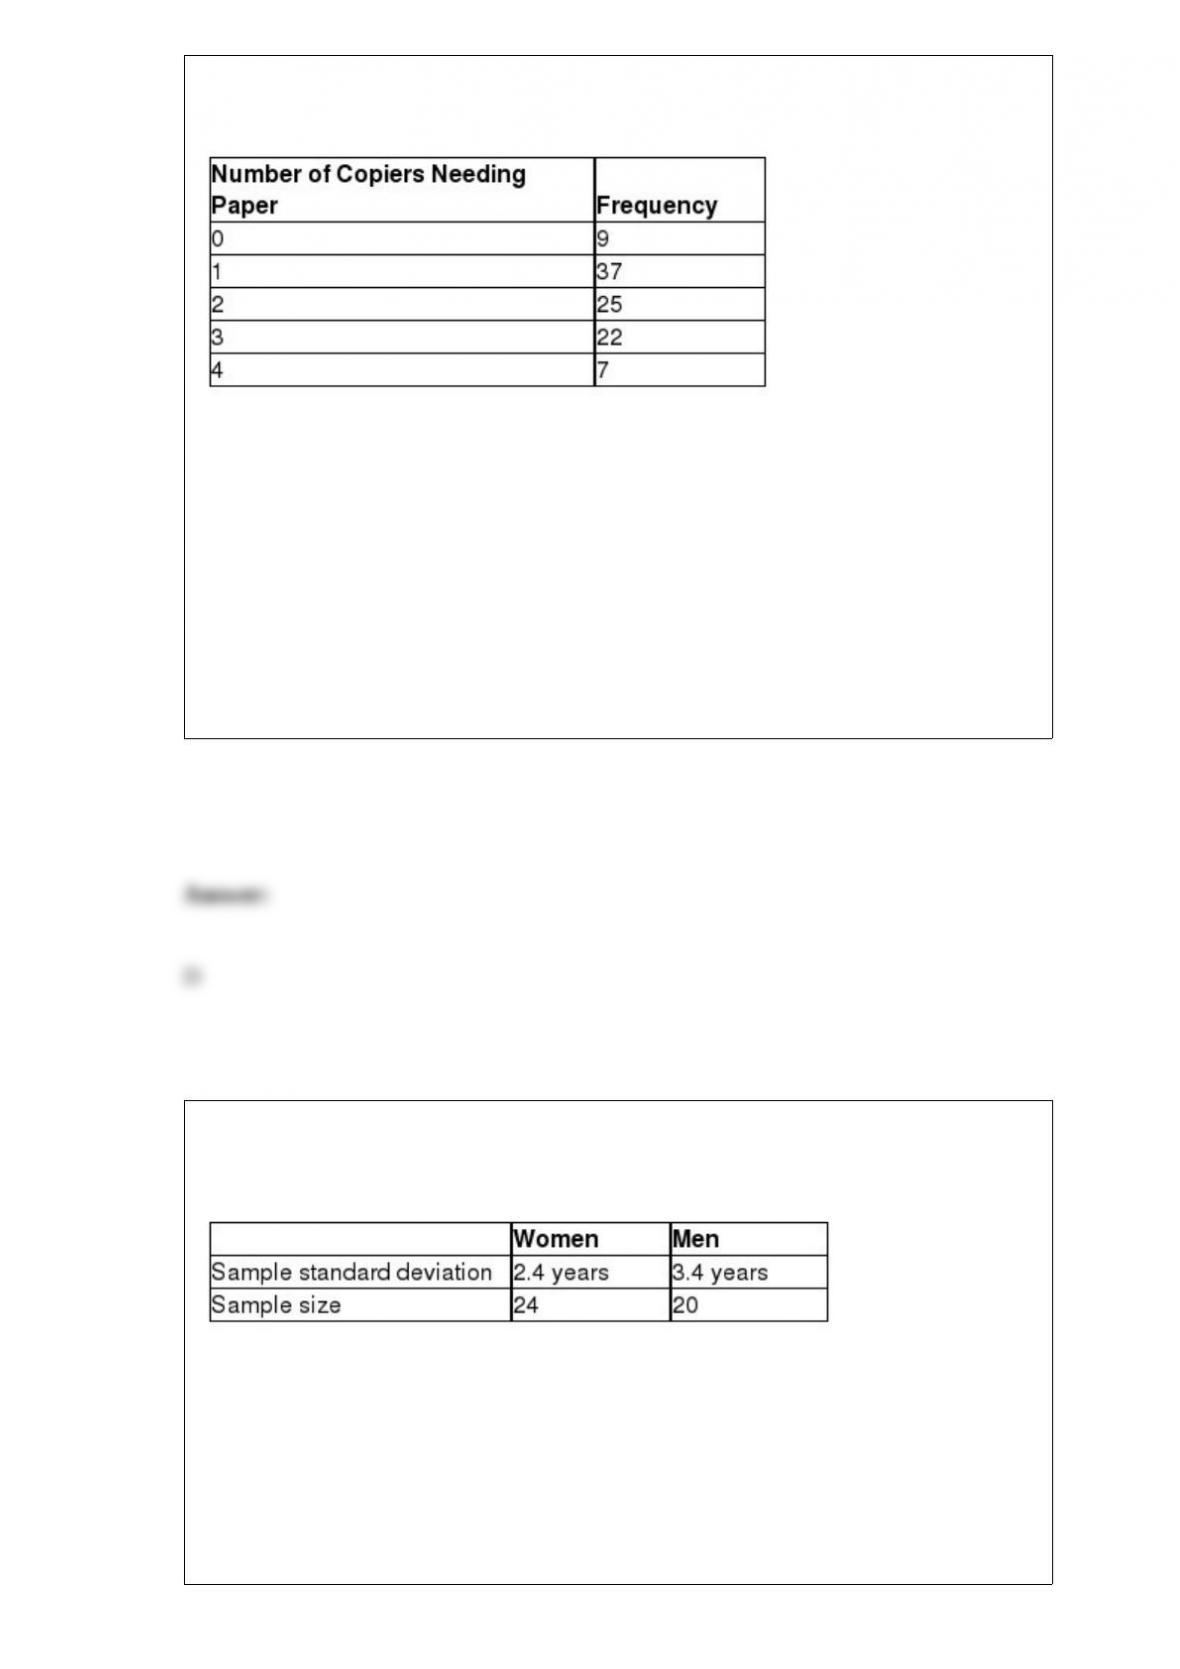
following data represent the number of days that 0, 1, 2, 3, or 4 copiers needed paper
replenished from a random sample of 100 business days.
The expected number of days from this sample that exactly one copier needed to be
replenished is ________.
A) 6.25
B) 15.5
C) 18.25
D) 25.0
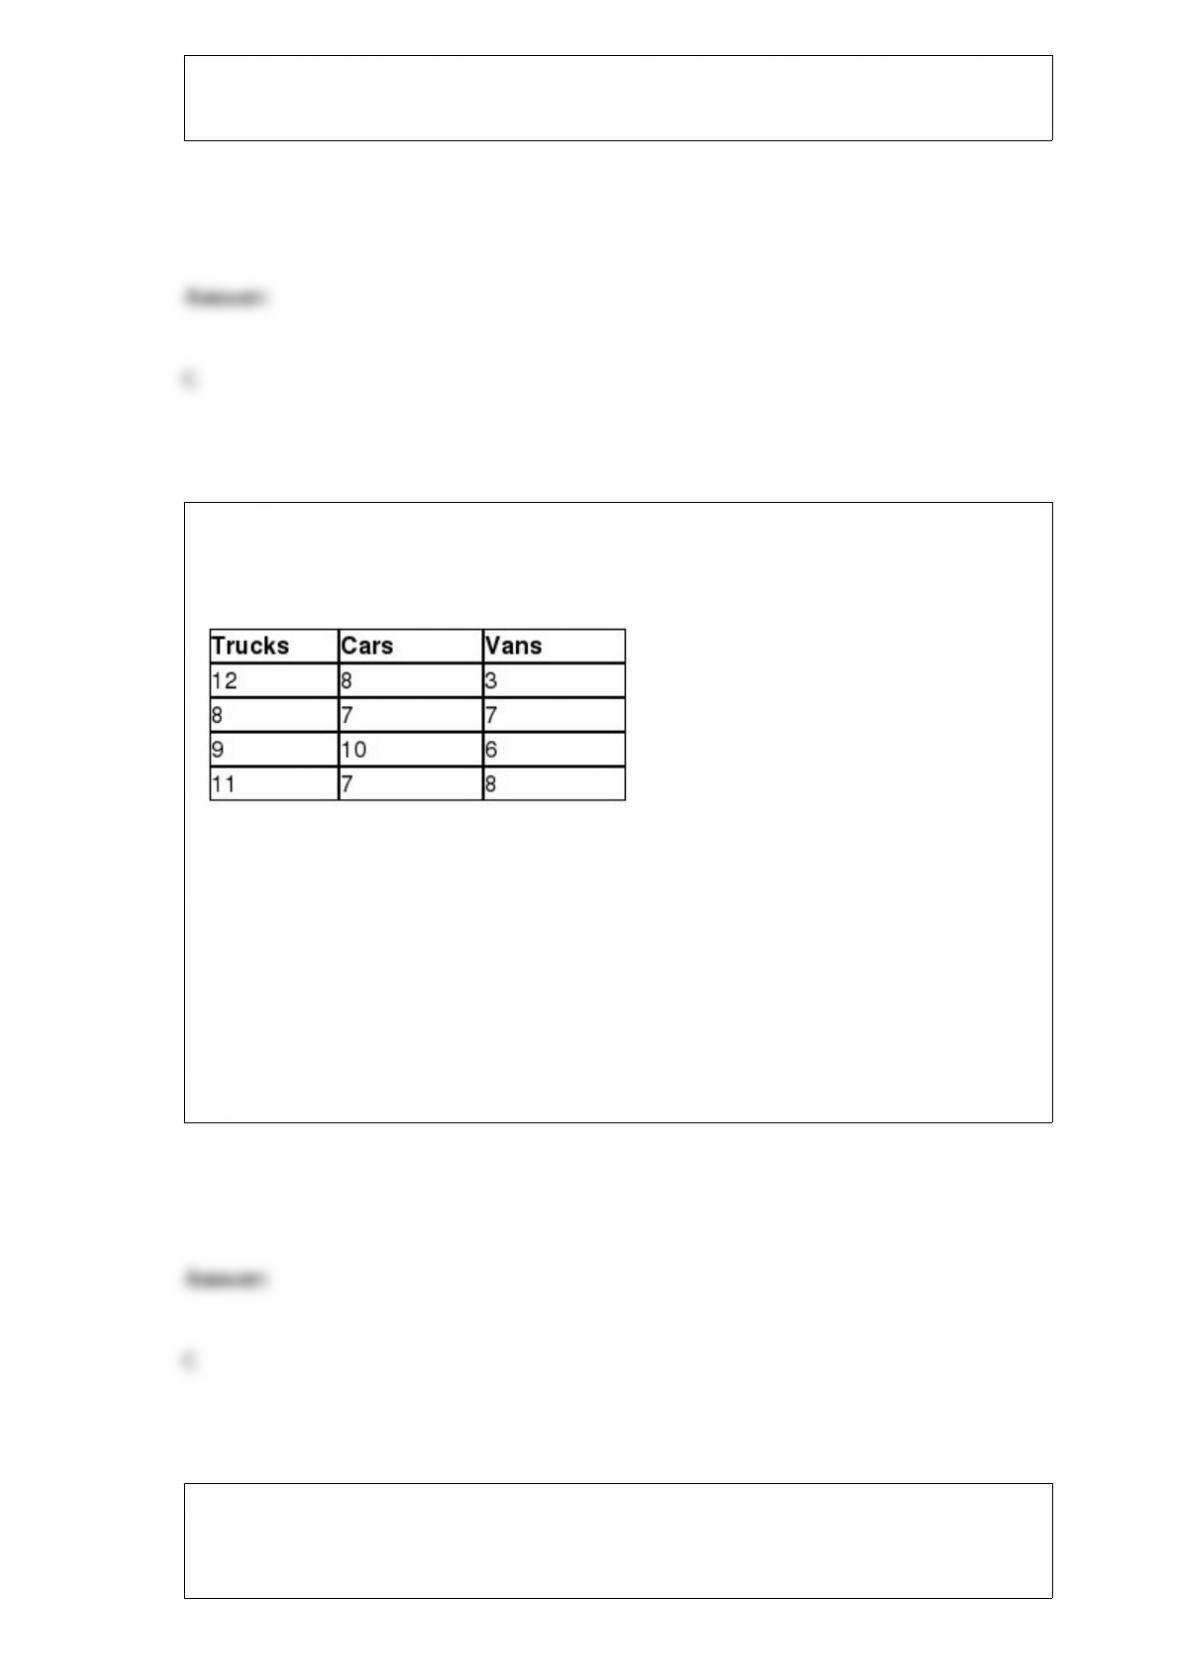
The federal government would like to test the hypothesis that the standard deviation for
the age of men filing for Social Security is higher than the standard deviation for the
age of women. The following table summarizes sample statistics from each population.
The degrees of freedom for the critical value for Population 2 would be ________.
A) 19
B) 20
C) 23
D) 24
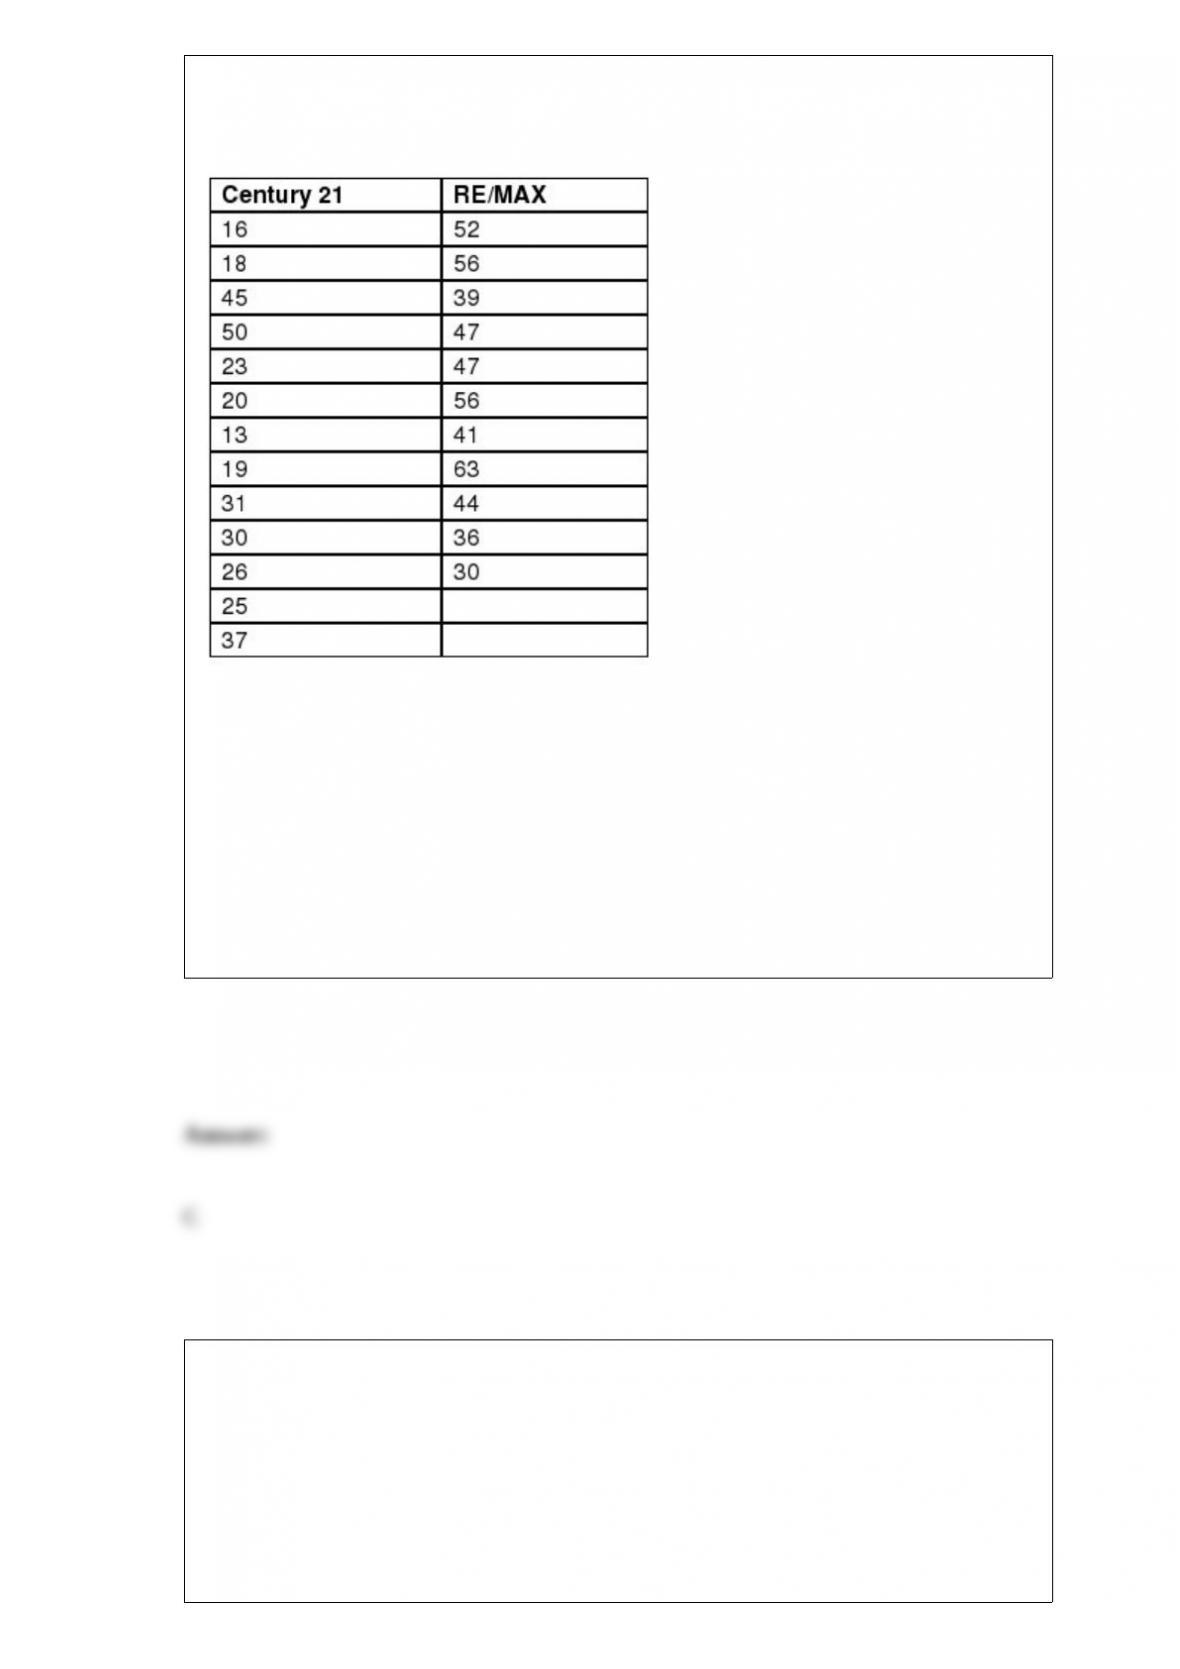
AutoTrader.com would like to test if a difference exists in the median age of three
different types of vehicles currently on the road–trucks, cars, and vans. The following
data represent the age of a random sample of trucks, cars, and vans.
The critical value for this hypothesis test using α = 0.10 is ________.
A) 2.706
B) 3.841
C) 4.605
D) 5.991
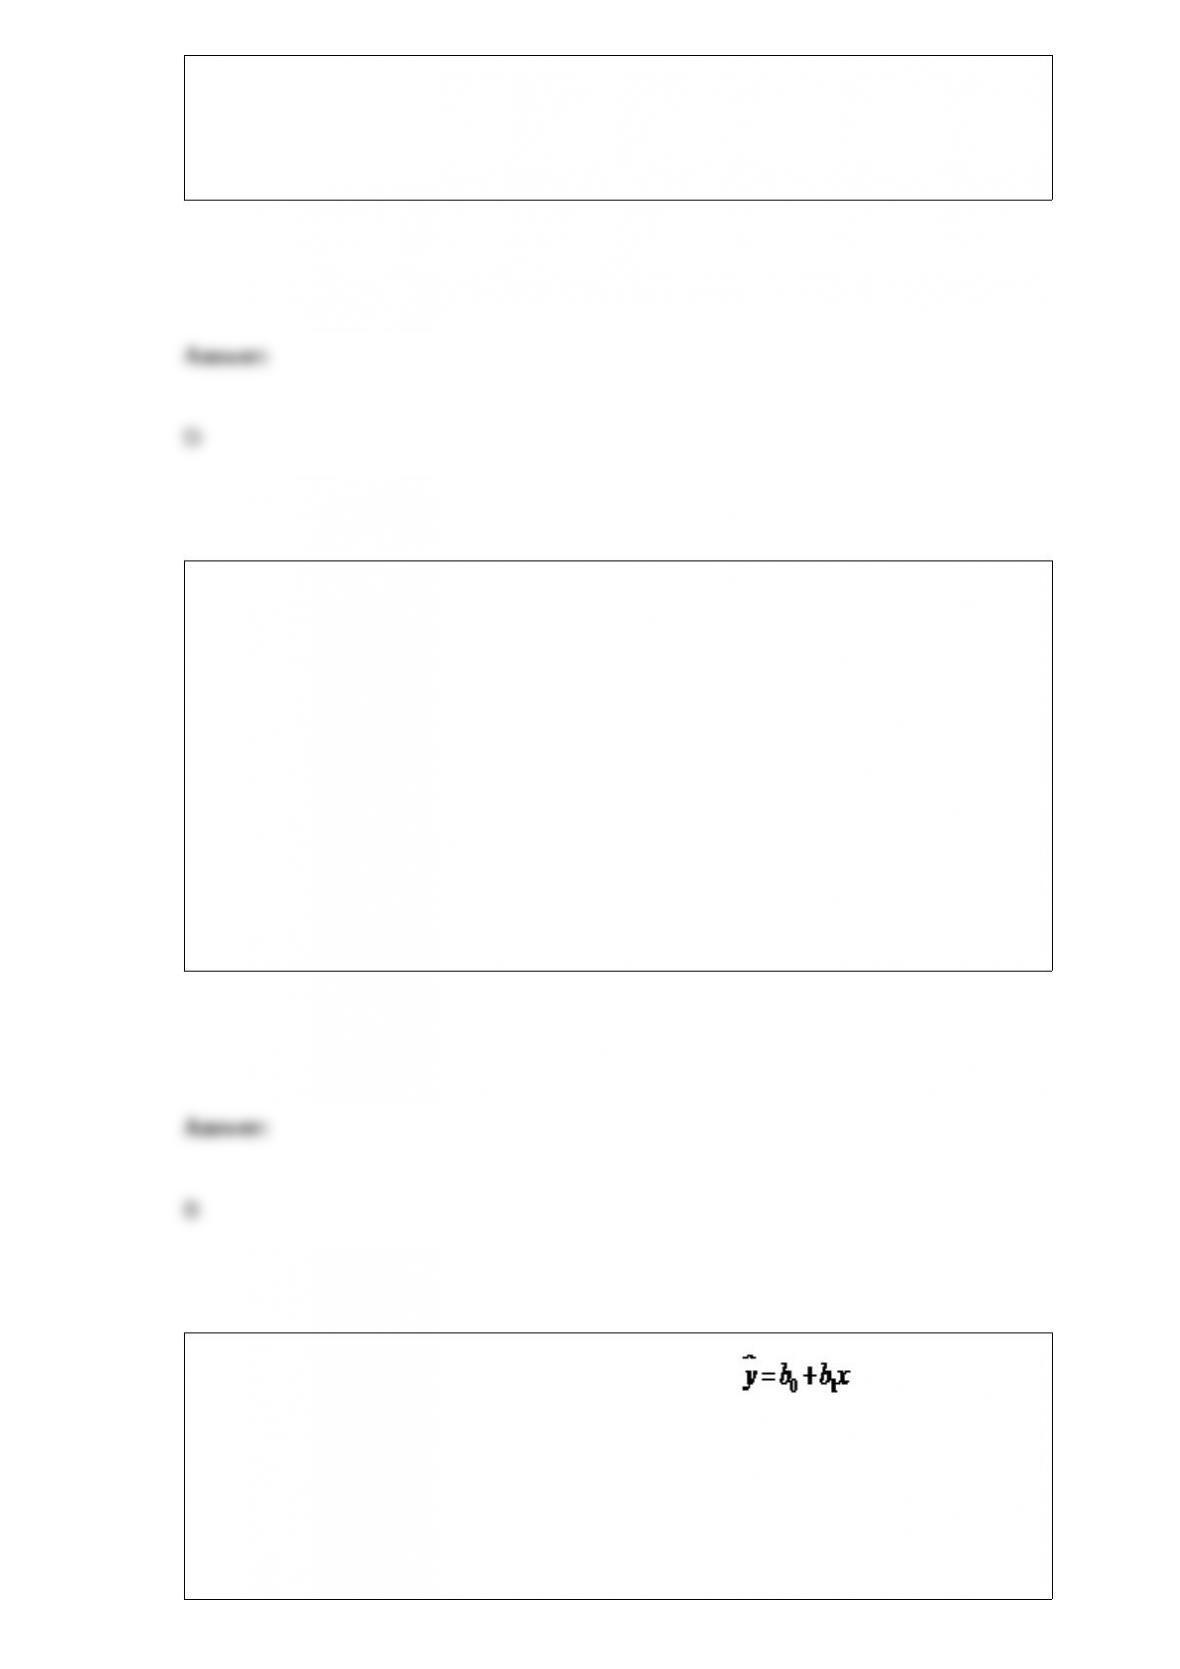
The Chamber of Commerce for a small city would like to test the hypothesis that the
median number of days that a residential home is listed on the real estate market for
Century 21 is different than the median number of days for a house listed by RE/MAX.
The following data shows the number of days a random sample of homes listed by each
realtor.
The sum of the ranks in Sample 1 for this hypothesis test is ________.
A) 94.5
B) 106.5
C) 193.5
D) 180.0
Costco installs automobile tires on a first-come first-serve basis. The total time a
customer needs to wait for the installation to be completed follows the normal
distribution with a mean time of 106.3 minutes and a standard deviation of 18.5
minutes. What is the probability that a randomly selected customer will wait less than
100 minutes for his or her tires to be installed?
A) 0.1151

B) 0.2578
C) 0.3669
D) 0.4761
The Graduate Management Admission Test (GMAT) is a standardized test used by
schools to determine the aptitude of individuals who are applying for MBA programs.
The range of the GMAT score is 200-800. Brian has recently taken the exam and scored
720. This is an example of __________ data.
A) nominal
B) ordinal
C) interval
D) ratio
A camera manufacturer just shipped a batch of 36 digital cameras to local retailers and
seven of the cameras have a defective sensor. Cutler Electronics received eight of these
digital cameras. What is the probability that two of the cameras shipped to Cutler are
defective?
A) 0.0516
B) 0.1374
C) 0.2155
D) 0.3297
Nationwide Insurance would like to perform a chi-square test to investigate whether a
difference exists in the proportion of male and female teenagers who text while they
drive. A random sample of 80 male teenagers found that 50 indicated they texted while
driving. A random sample of 120 female teenagers found that 65 indicated they texted
while driving. The chi-square critical value using α = 0.5 is ________.
A) 2.706
B) 3.841
C) 5.991
D) 7.815
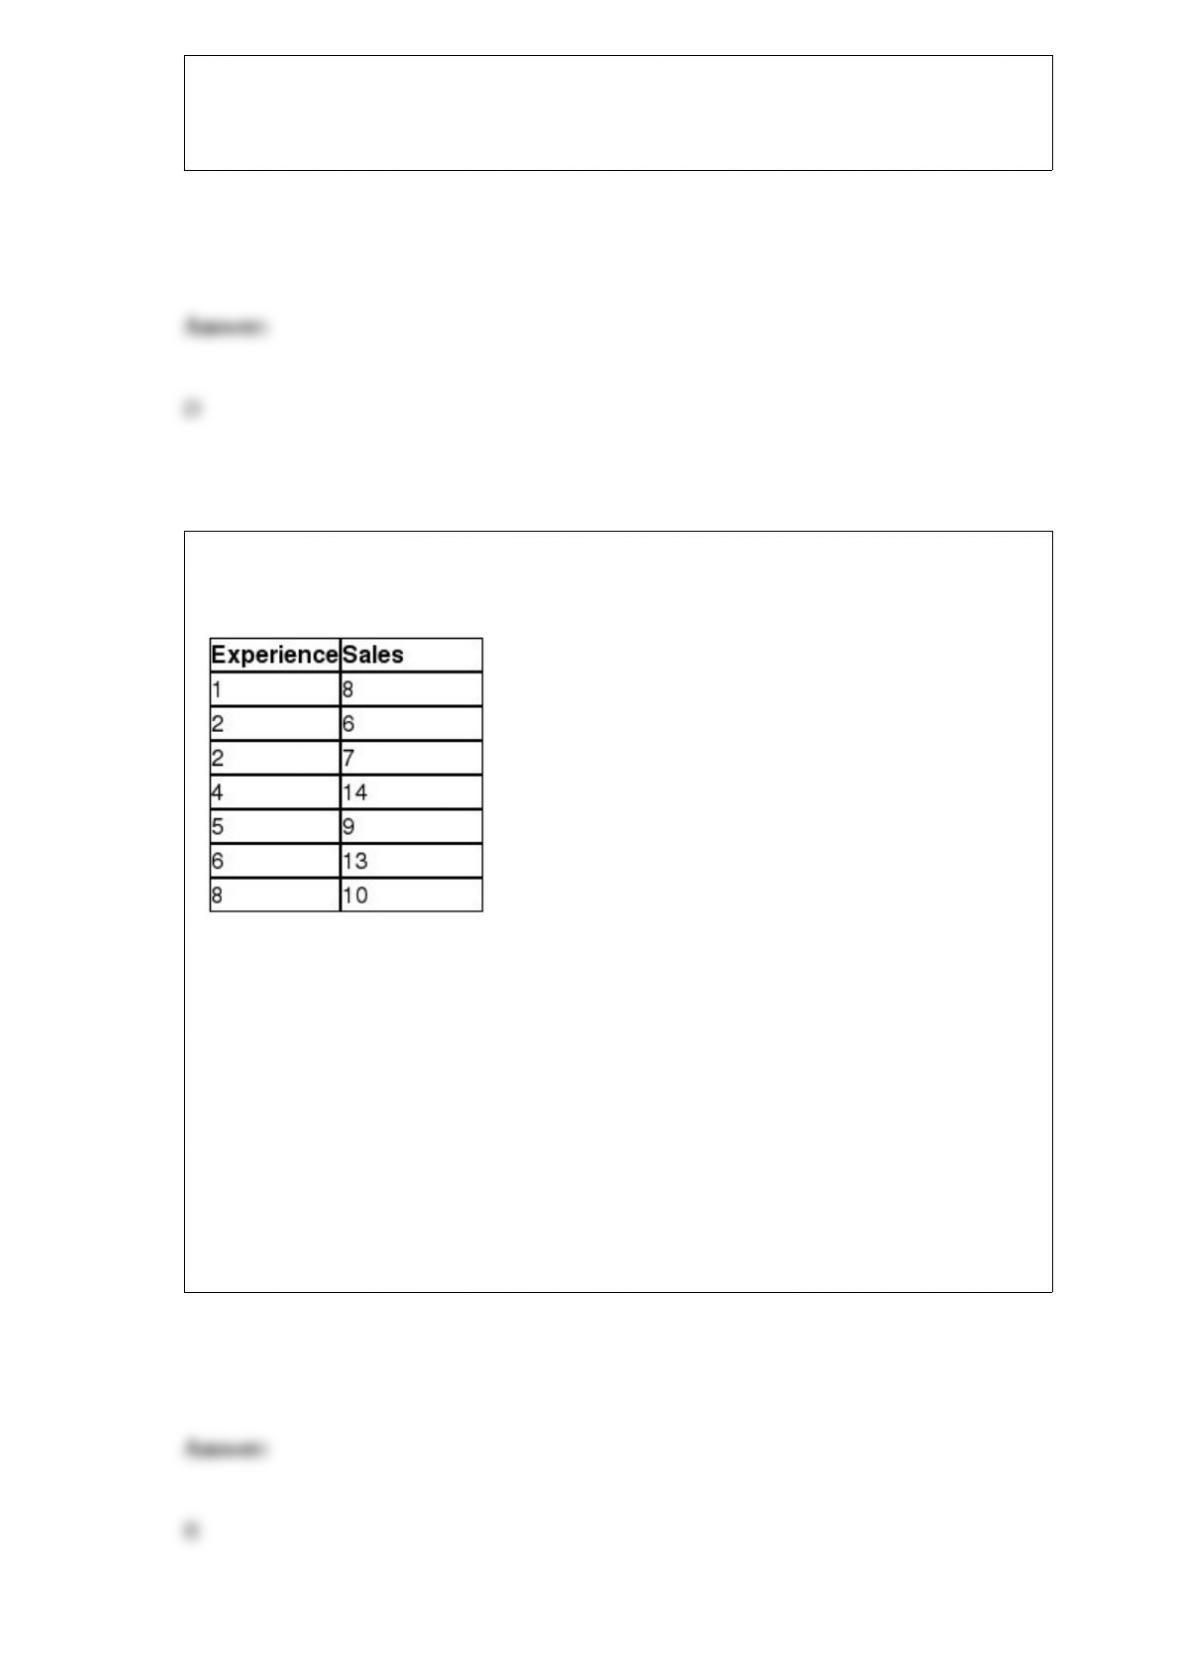
The formula for the equation describing a straight line is . The value for b in
this equation represents the _______________________________.
A) predicted value of y given a value of x
B) independent variable
C) y-intercept of the straight line
D) slope of the straight line
The table below shows the number of cars sold last month by seven employees at
Concord Motors and their number of years of sales experience.
Management would like to use simple regression analysis to estimate monthly car sales
using the number of years of sales experience. The slope for the regression equation is
________.
A) “0.563
B) 0.658
C) 1.215
D) 2.450

Sony would like to test the hypothesis that the average age of a PlayStation user is
different from the average age of an Xbox user. A random sample of 36 PlayStation
users had an average age of 34.2 years while a random sample of 30 Xbox users had an
average age of 32.7 years. Assume that the population standard deviation for the age of
PlayStation and Xbox users is 3.9 and 4.0 years, respectively. Sony would like to set α
= 0.10. The 90% confidence interval for the difference in population means is
________.
A) (1.18, 1.82)
B) (0.65, 2.35)
C) (-0.11, 3.11)
D) (“1.70, 4.70)
A Type I error occurs in hypothesis testing when
we_____________________________.
A) reject the alternative hypothesis and the alternative hypothesis is true
B) fail to reject the null hypothesis and the null hypothesis is false
C) fail to reject the alternative hypothesis and the alternative hypothesis is false
D) reject the null hypothesis and the null hypothesis is true
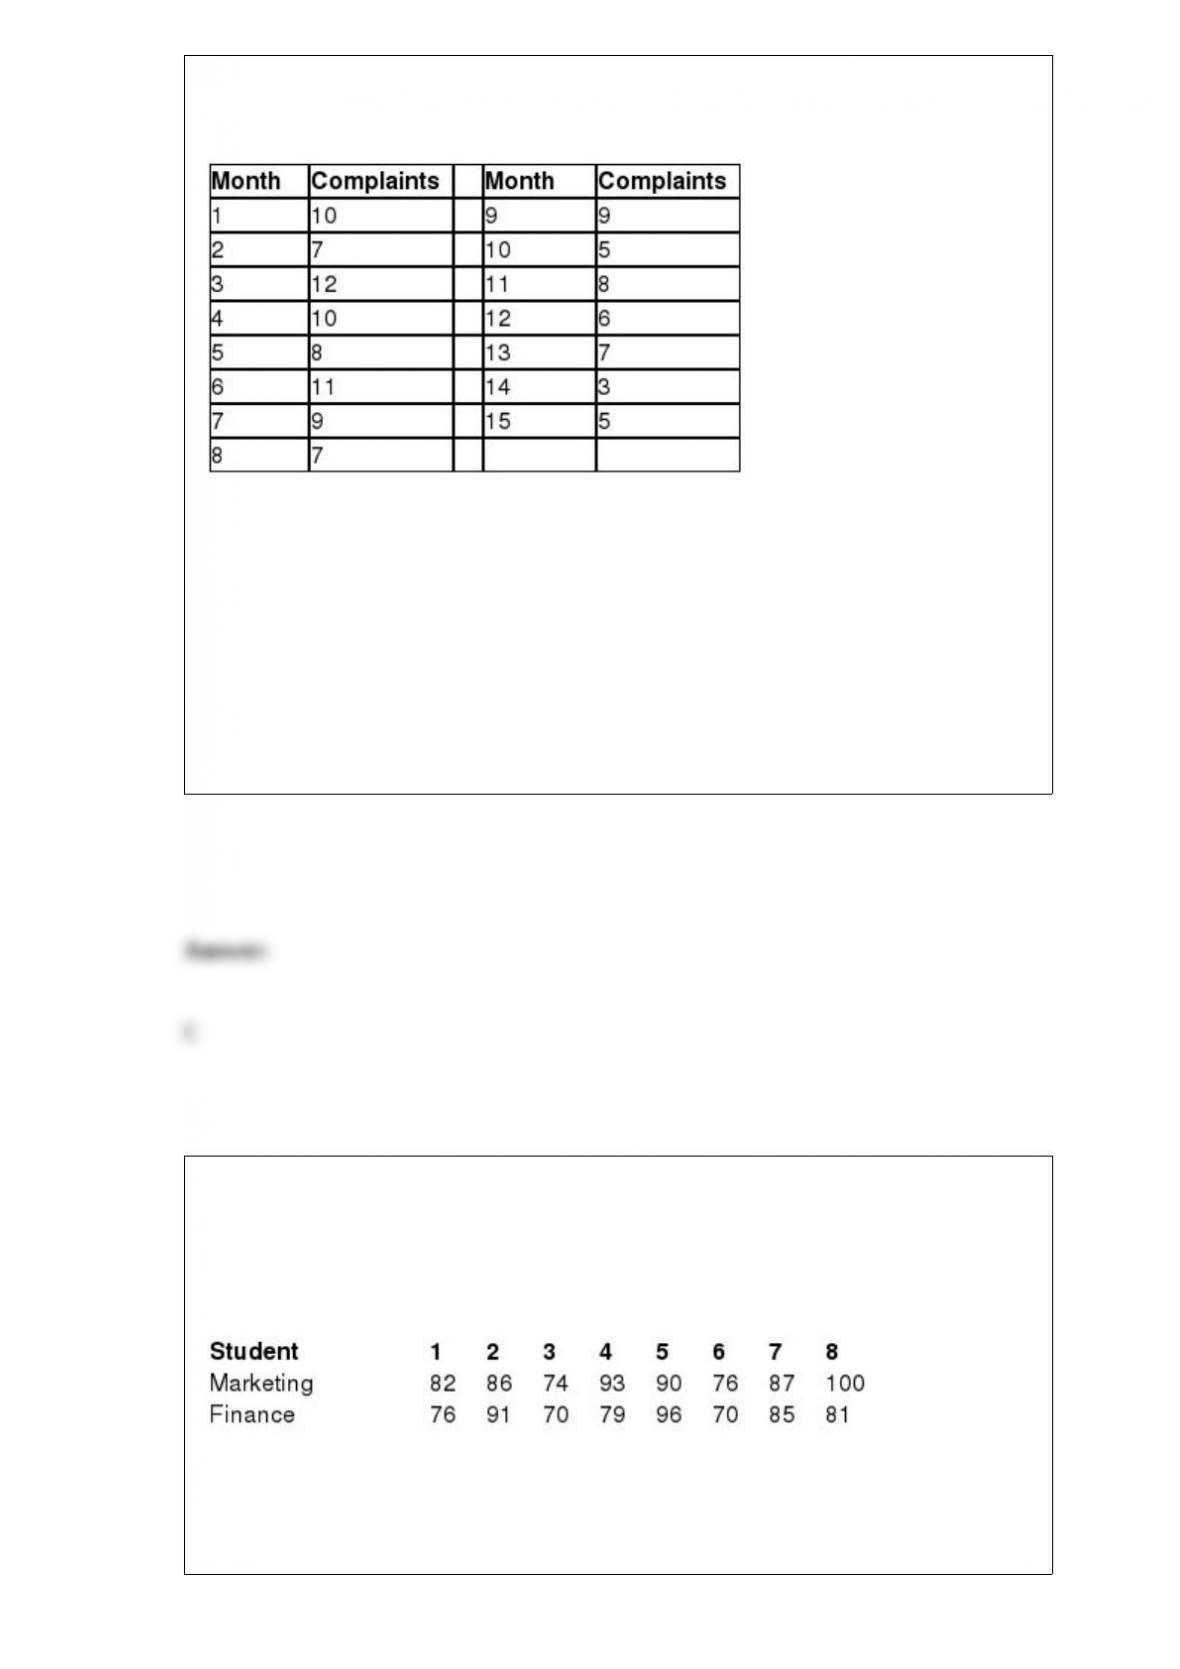
The following data represent the number of complaints per month that customer service
received at a large retailer over the last 15 months.
The residual for Month 6 is ________.
A) -2.6
B) -0.8
C) 2.4
D) 5.0
The Dean of the Business School at State University would like to test the hypothesis
that no difference exists between the average final exam grades for the Introduction to
Marketing course and the Introduction to Finance course. A random sample of eight
students who took both courses was selected and their final exam grades for each
course are shown below.
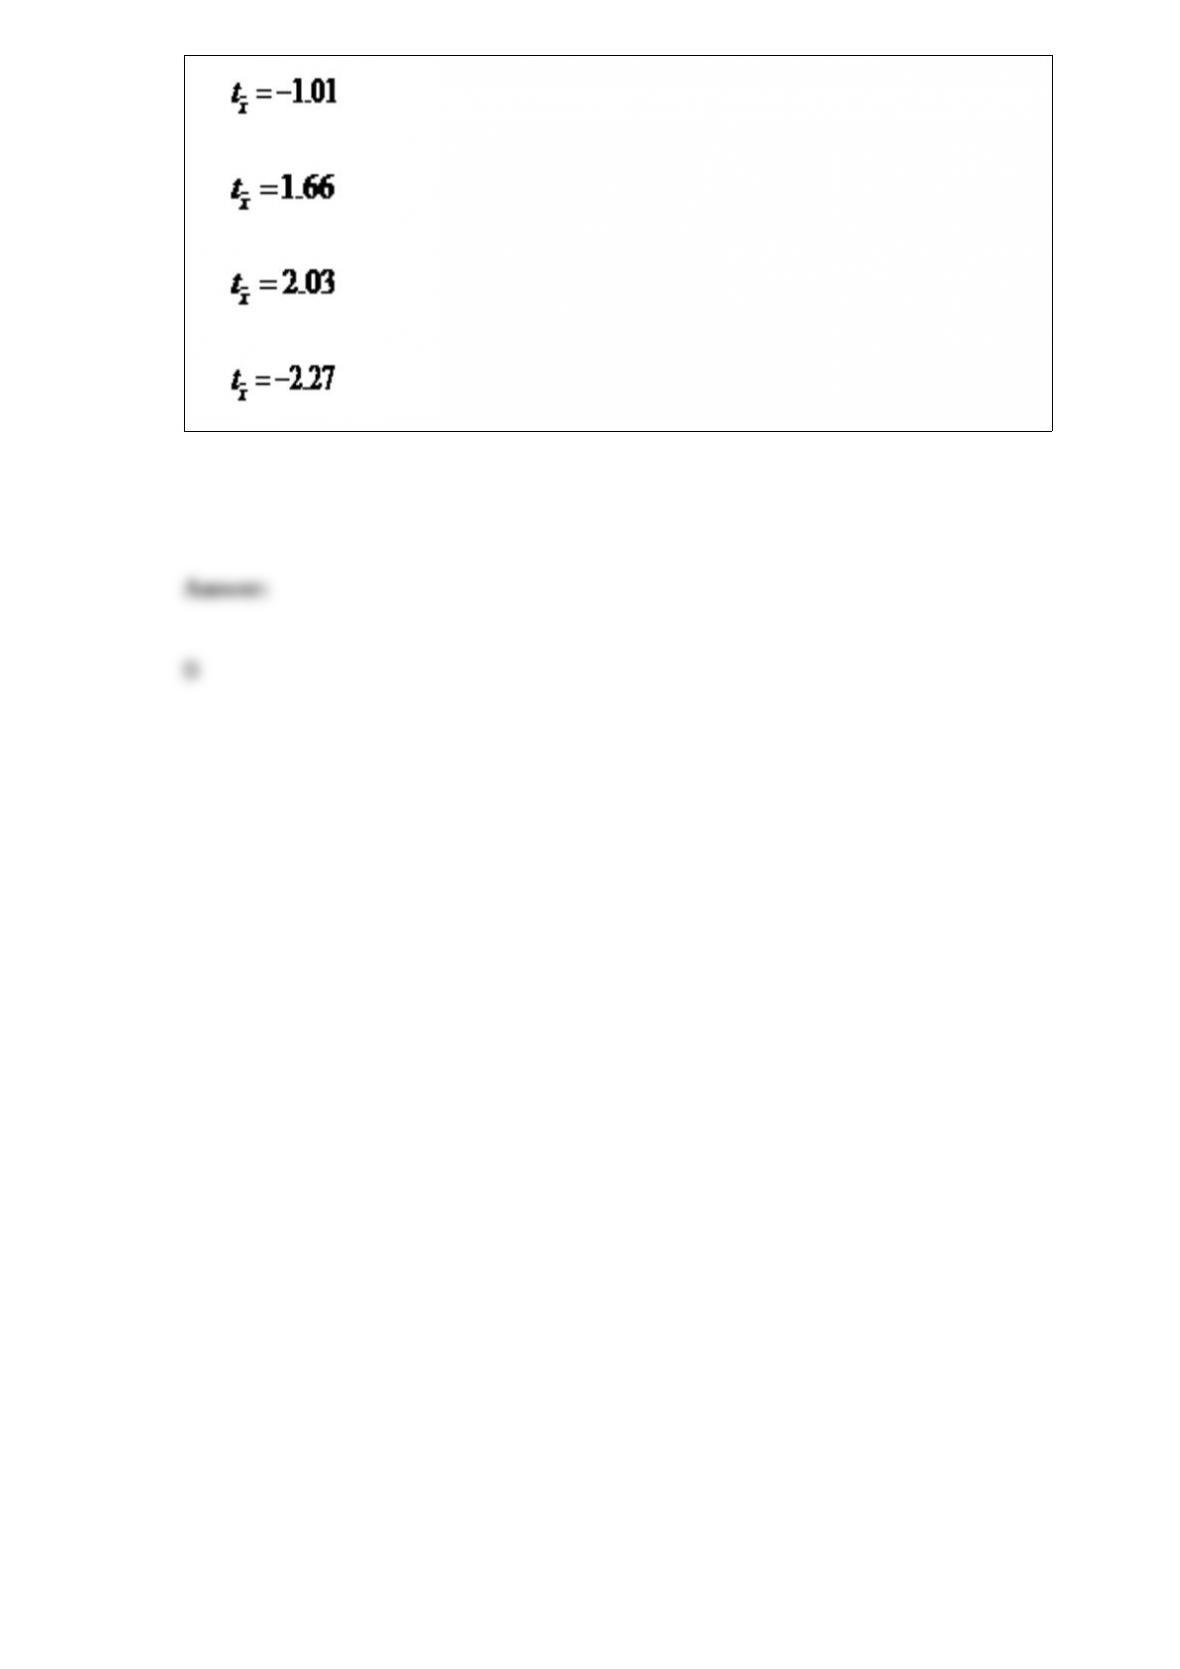
If Population 1 is defined as the Marketing exam scores and Population 2 is defined as
the Finance exam scores, the test statistic for this hypothesis test would be ________.
A)
B)
C)
D)