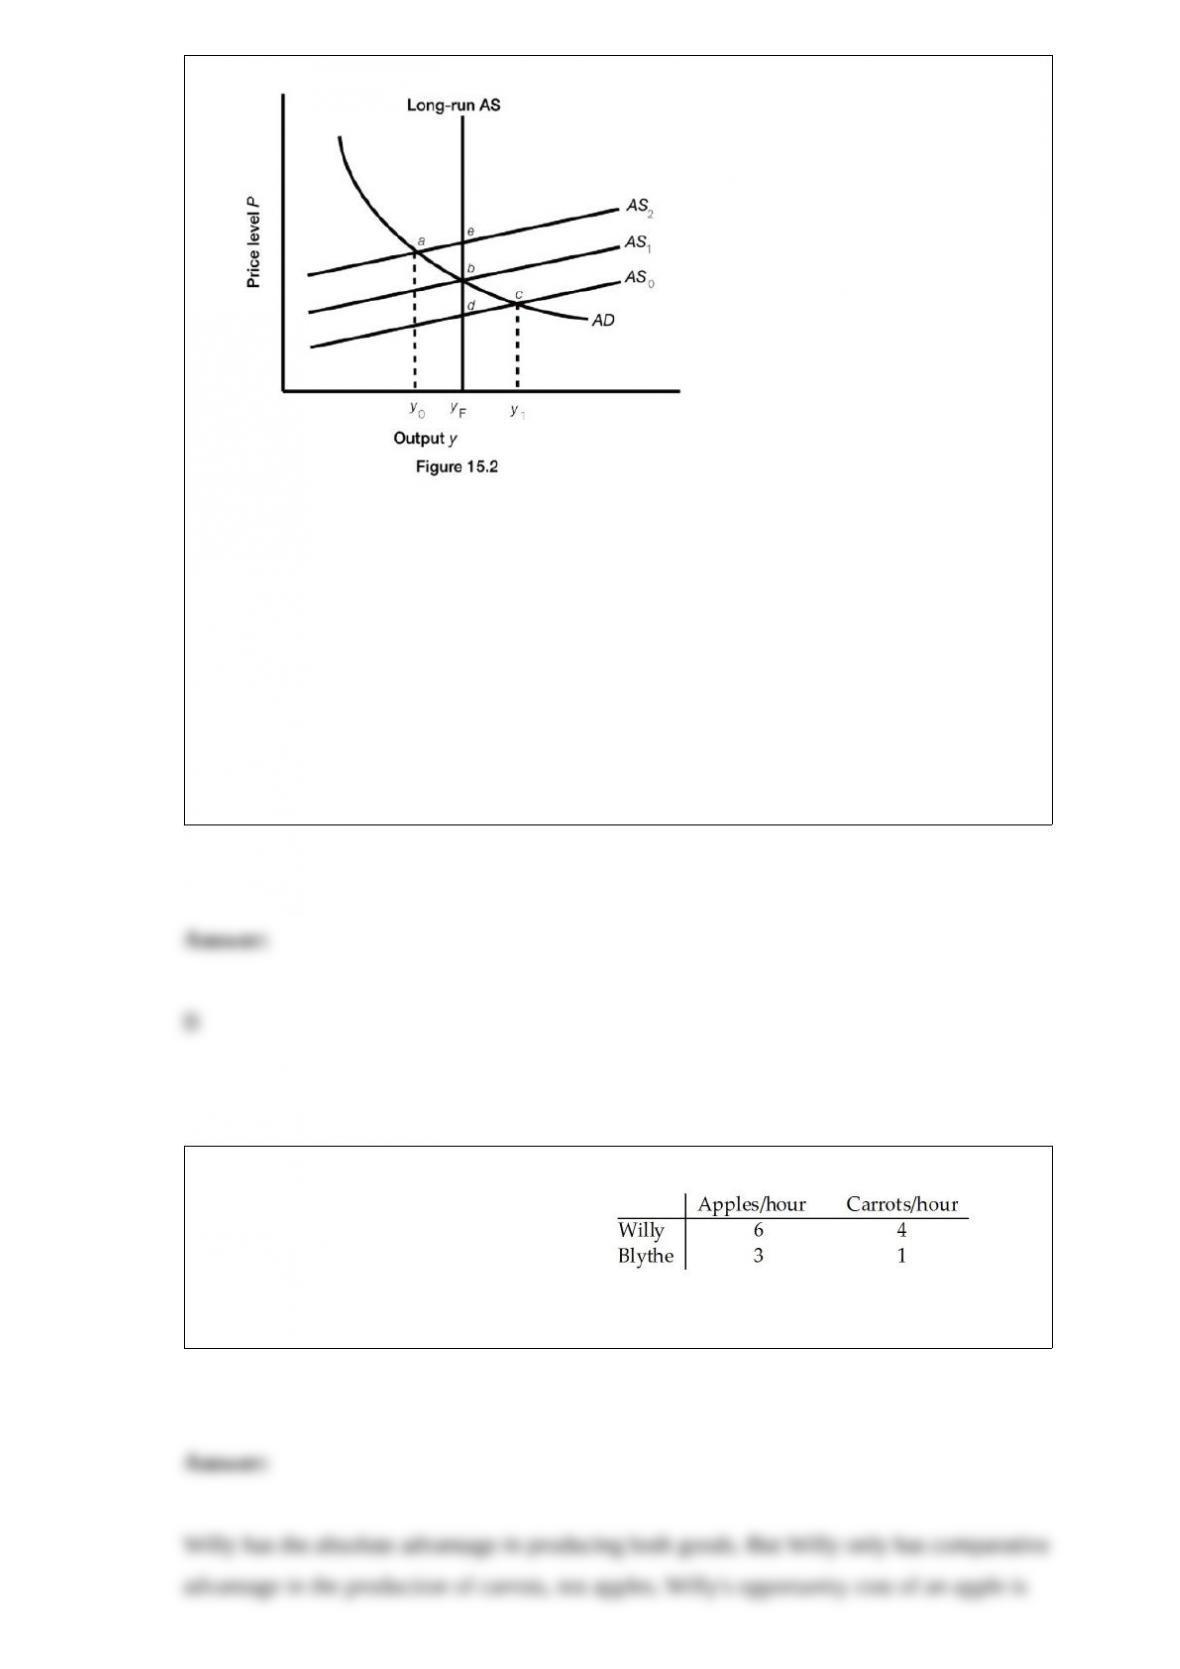
Refer to Figure 15.2. The economy is at full employment and the unemployment rate is
at the natural rate at point
A) a.
B) .
C) c.
D) d.
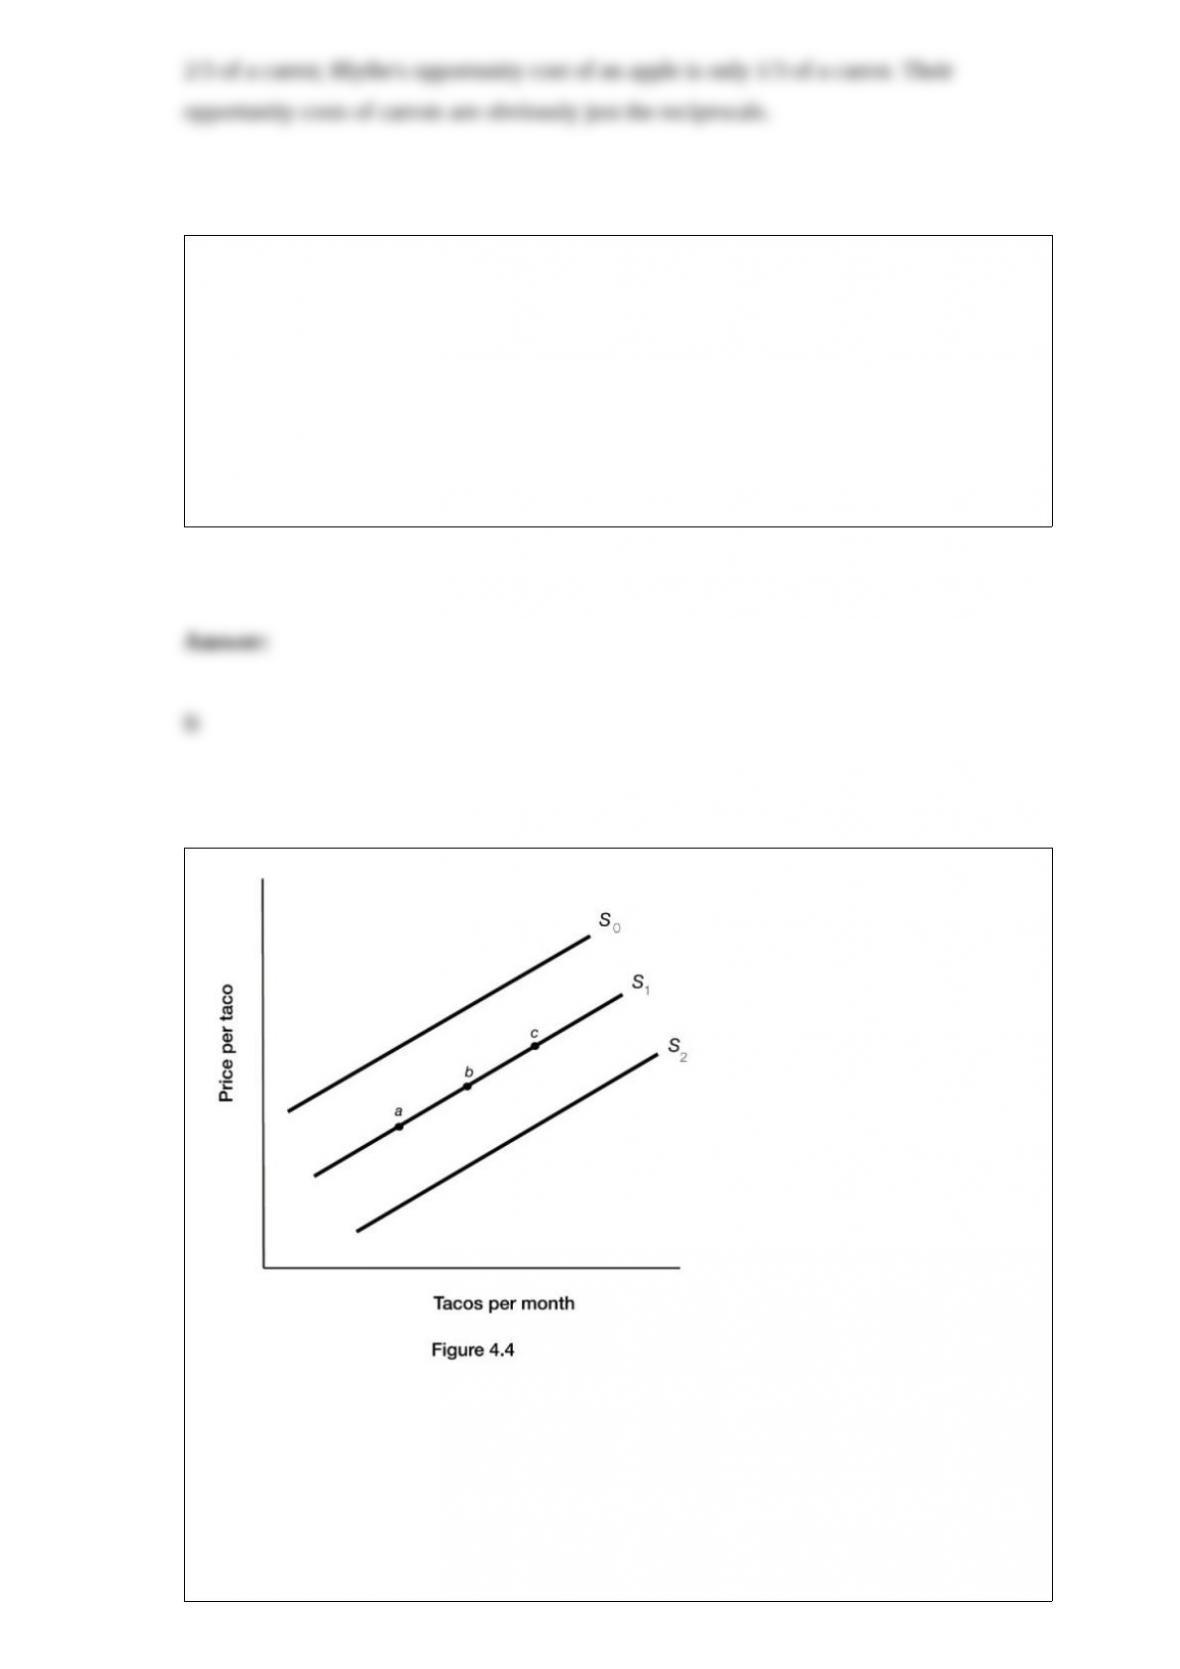
Consider two individuals, Willy and Blythe, who produce carrots and apples. Willy and
Blythe’s hourly productivity are as follows: Who
has the absolute advantage or comparative advantage in the production of apples or
carrots?
The largest single component of M2 is
A) demand deposits.
B) savings deposits.
C) money market mutual funds.
D) currency held by the public.
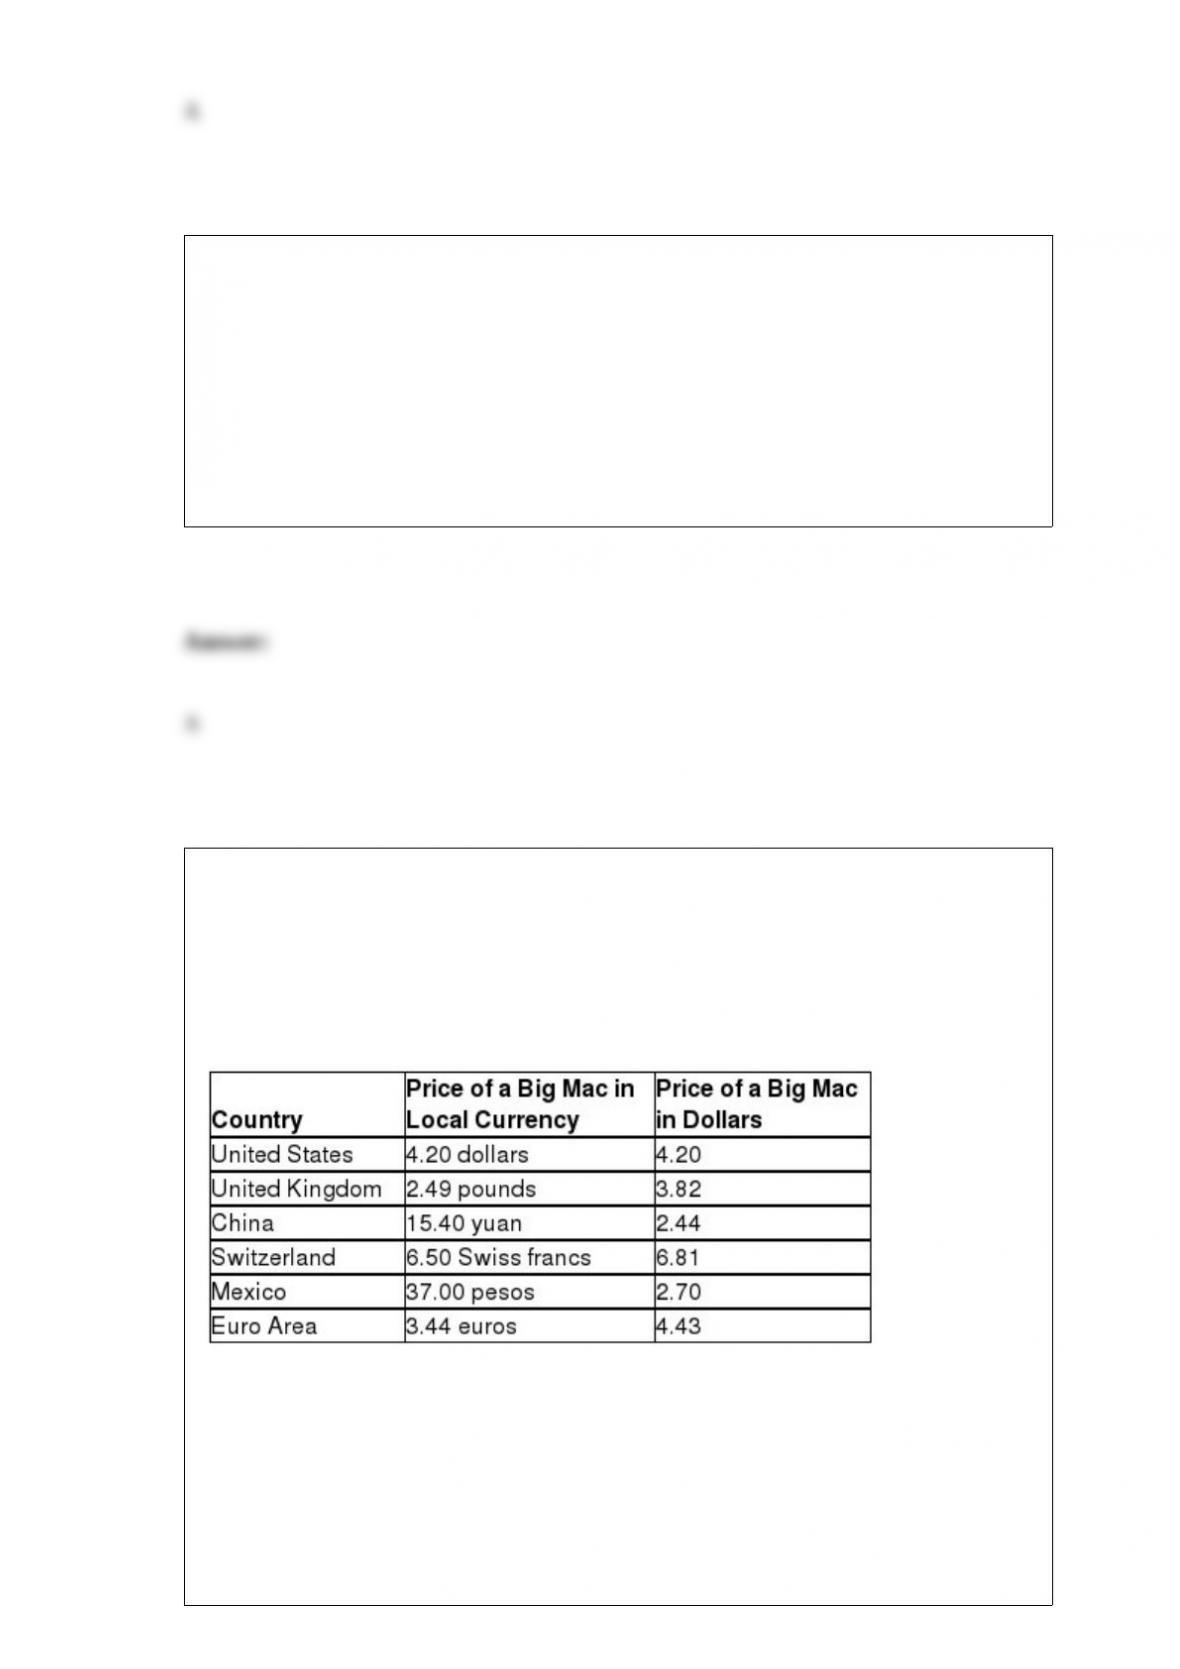
Figure 4.4 illustrates the supply of tacos. An increase in the supply of tacos is
represented by a movement from
A) point a to point .
B) point c to point .

C) S2 to S1.
D) S0 to S1.
If a project costs $3,500 today and pays a return of $4,200 next year, what is the highest
interest rate at which the project should be undertaken?
A) 7 percent
B) 14 percent
C) 20 percent
D) 70 percent
________ unemployment rises and falls with economic fluctuations.
A) Cyclical
B) Frictional
C) Structural
D) Inflationary
An example of a Federal Reserve action that decreases the money supply is:
A) an increase in the required reserve ratio.
B) a decrease in the discount rate.
C) a reduction in the taxes banks pay on their profits.
D) the Fed buying government bonds in the open market.
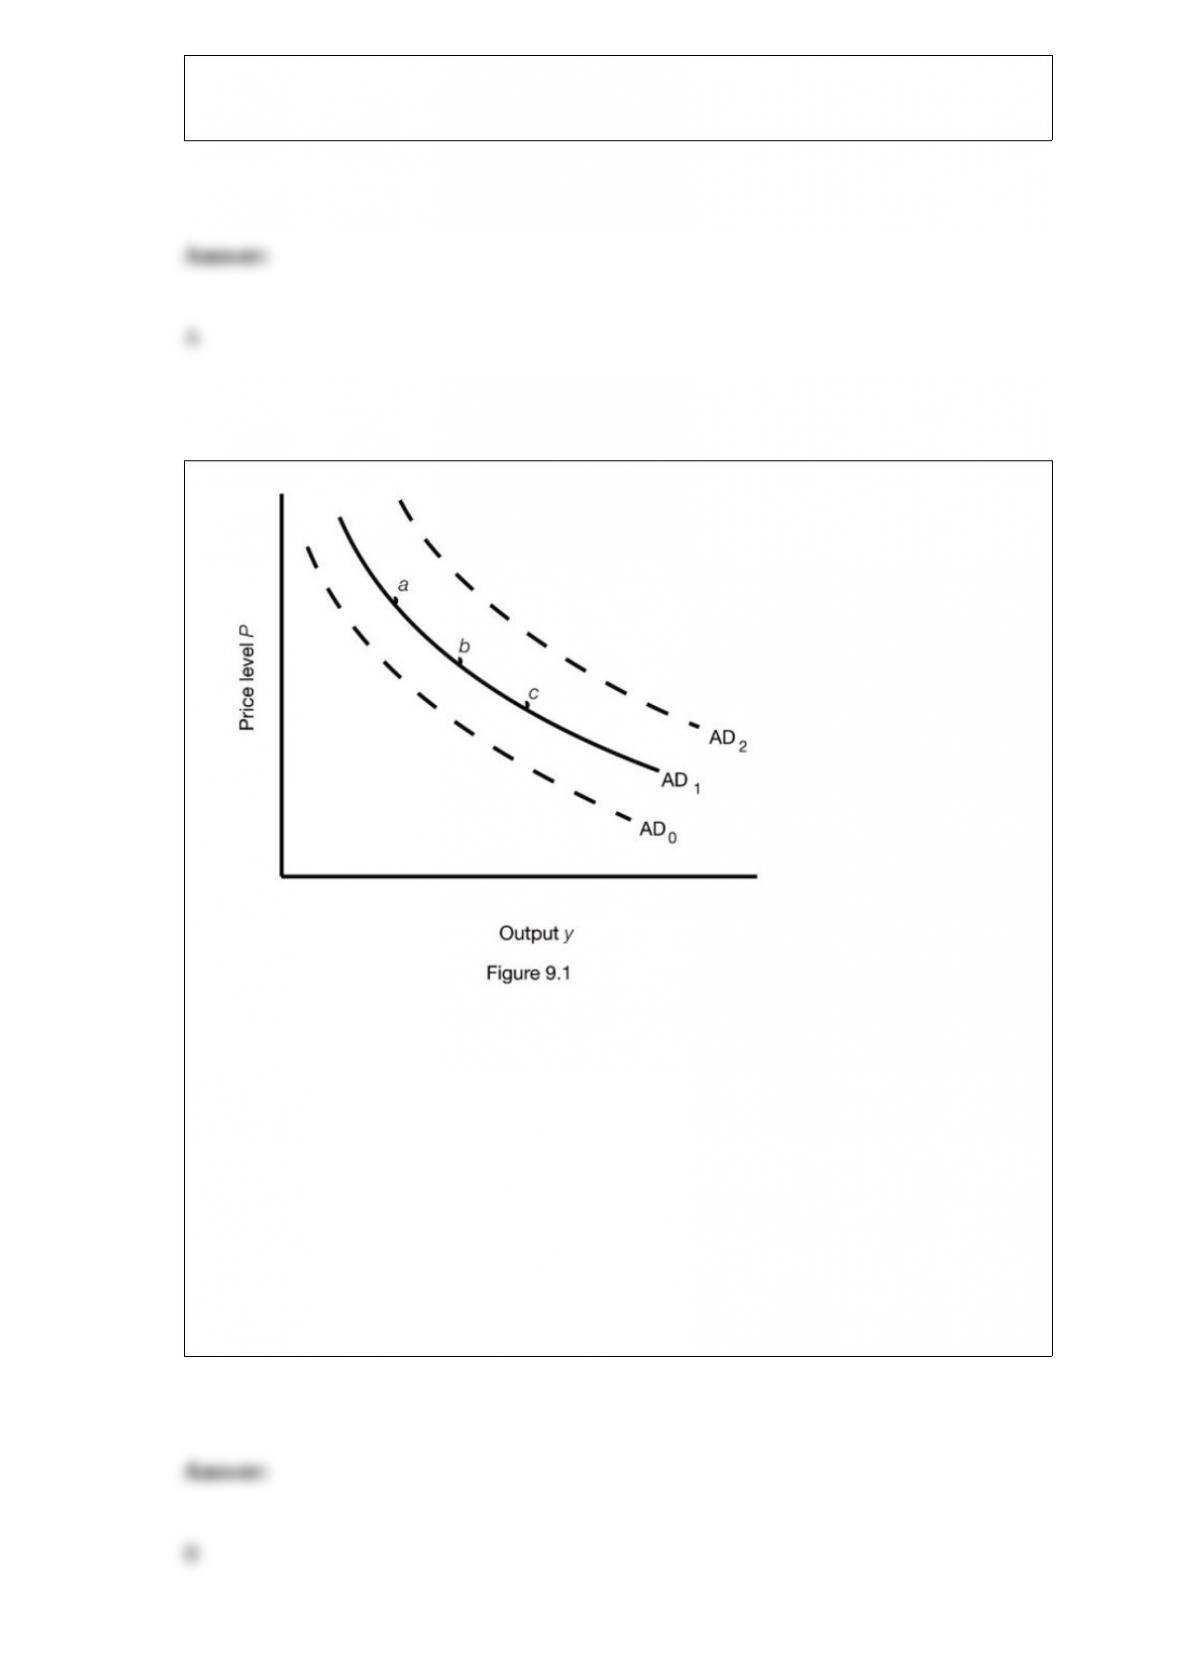
Recall the Application about the price of Big Macs in China and around the world to
answer the following question(s).
The following table is taken from the Application. For several years, The Economist has
measured the prices of Big Macs throughout the world and compared the price
differences to exchange rates.
According to the table, the Big Mac would cost the same in China and the United States
at an exchange rate of ________ yuan for every one U.S. dollar.
A) 1.27
B) 2.72

C) 3.67
D) 6.32
The statistics on unemployment usually shows that men:
A) and women have roughly the same unemployment rates.
B) have higher unemployment rates than women.
C) have lower unemployment rates than women.
D) and women have zero unemployment rates.
For the consumption function, C = Ca + bY, Ca represents:
A) aggregate output.
B) aggregate consumption.
C) the level of consumption that is independent from income.
D) the slope of the line.

If the equilibrium output is below potential output:
A) unemployment is constant.
B) aggregate demand increases.
C) the price level decreases.
D) inflation usually rises.
The country of Needia has recently suffered a decline in its growth rate from 3 to 2
percent per year. How many more years will it now take for output to double in Needia?
A) 23
B) 21
C) 12
D) 7
The opportunity cost of going to college
A) is zero if your parents pay your tuition.
B) is equal to the cost of tuition, room and board, and other expenses.

C) includes wages you lose by going to school instead of working.
D) is the same for all students at a particular school who pay full tuition.
A minimum supply price is defined as:
A) the lowest price at which a product is made available for sale.
B) the lowest price at which a product is bought.
C) the lowest cost to produce a good.
D) the lowest price at which other sellers also want to sell the good.
Recall Application 4, “Trade, Consumption and Inequality,” to answer the following
questions:
According to the application, living standards have not become more unequal because:
A) the prices of goods and services that low income groups have paid have risen slower
than the prices of goods and services that high income groups have paid.
B) the prices of goods and services that low income groups have paid have risen faster
than the prices of goods and services that high income groups have paid.
C) the prices of goods and services that low income groups have paid have been
dropping while the prices of goods and services that high income groups have not.
D) the prices of goods and services that low income groups have paid have risen while
the prices of goods and services that high income groups have not.
Figure 9.1 shows three aggregate demand curves. A movement from curve AD0 to curve
AD1 could be caused by a(n)
A) decrease in the money supply.
B) decrease in taxes.
C) decrease in the price level.
D) decrease in government spending.