
Part of the lag in monetary policy effects is due to
a. the long political process of monetary policy decisions.
b. precise economic forecasts.
c. the time required for firms and households to alter their spending plans.
d. changes in the unemployment rate.
According to 2009 data on the U.S. population, which of the following groups of adults
(ages 20 and older) had the highest unemployment rate?
a. white males
b. white females
c. black males
d. black females
Jeff decides that he would pay as much as $2,000 for a new laptop computer. He buys
the computer and realizes a consumer surplus of $300. How much did Jeff pay for his
computer?
a. $300.
b. $1,700.
c. $2,000.
d. $2,300.
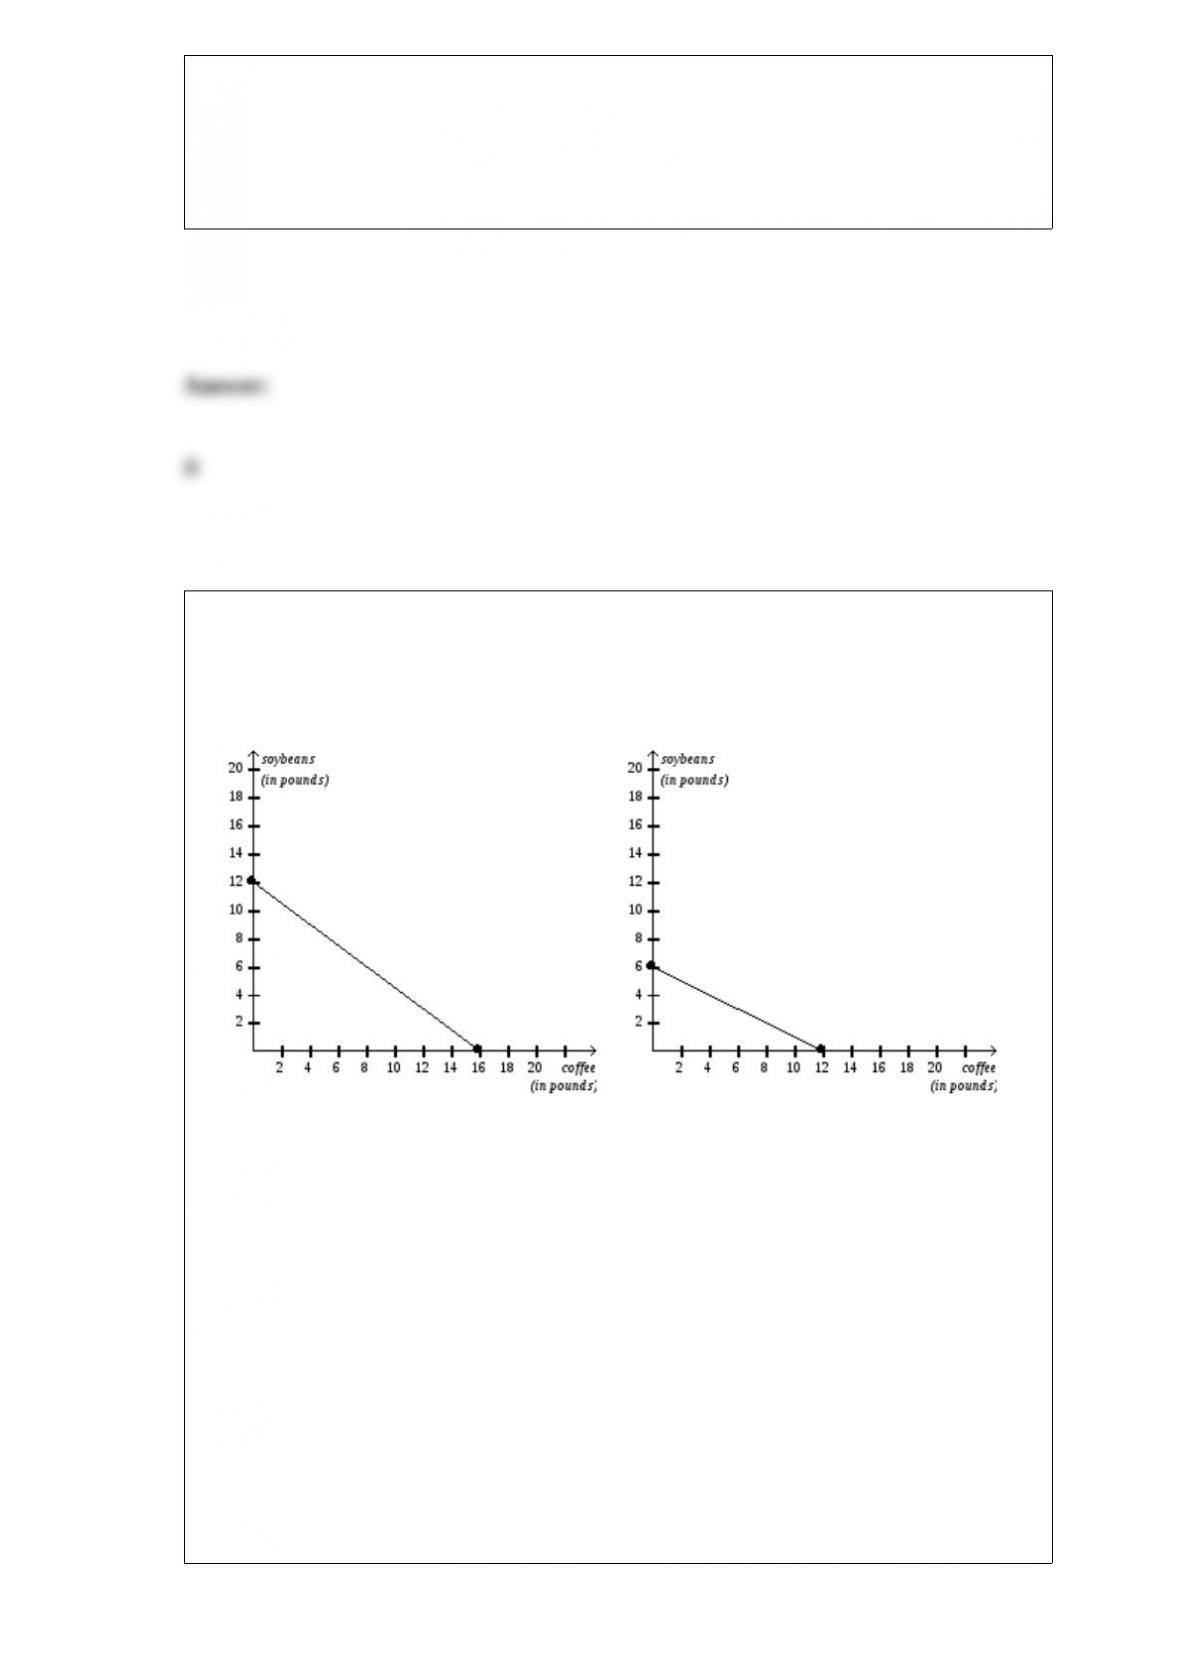
Figure 3-8
Chile’s Production Possibilities Frontier Colombia’s Production Possibilities
Frontier
Refer to Figure 3-8. If Chile and Colombia each spends all of its time producing the
good in which it has a comparative advantage and the countries agree to trade 7 pounds
of coffee for 5 pounds of soybeans, then Chile will consume
a. 7 pounds of coffee and 7 pounds of soybeans and Colombia will consume 5 pounds
of coffee and 5 pounds of soybeans.
b. 7 pounds of coffee and 7 pounds of soybeans and Colombia will consume 5 pounds
of coffee and 11 pounds of soybeans.
c. 23 pounds of coffee and 7 pounds of soybeans and Colombia will consume 5 pounds
of coffee and 5 pounds of soybeans.
d. 23 pounds of coffee and 7 pounds of soybeans and Colombia will consume 5 pounds
of coffee and 11 pounds of soybeans.
Suppose there is an increase in the price of steel. We would expect the supply curve for
steel beams to
a. shift rightward.
b. shift leftward.
c. become flatter.
d. remain unchanged.
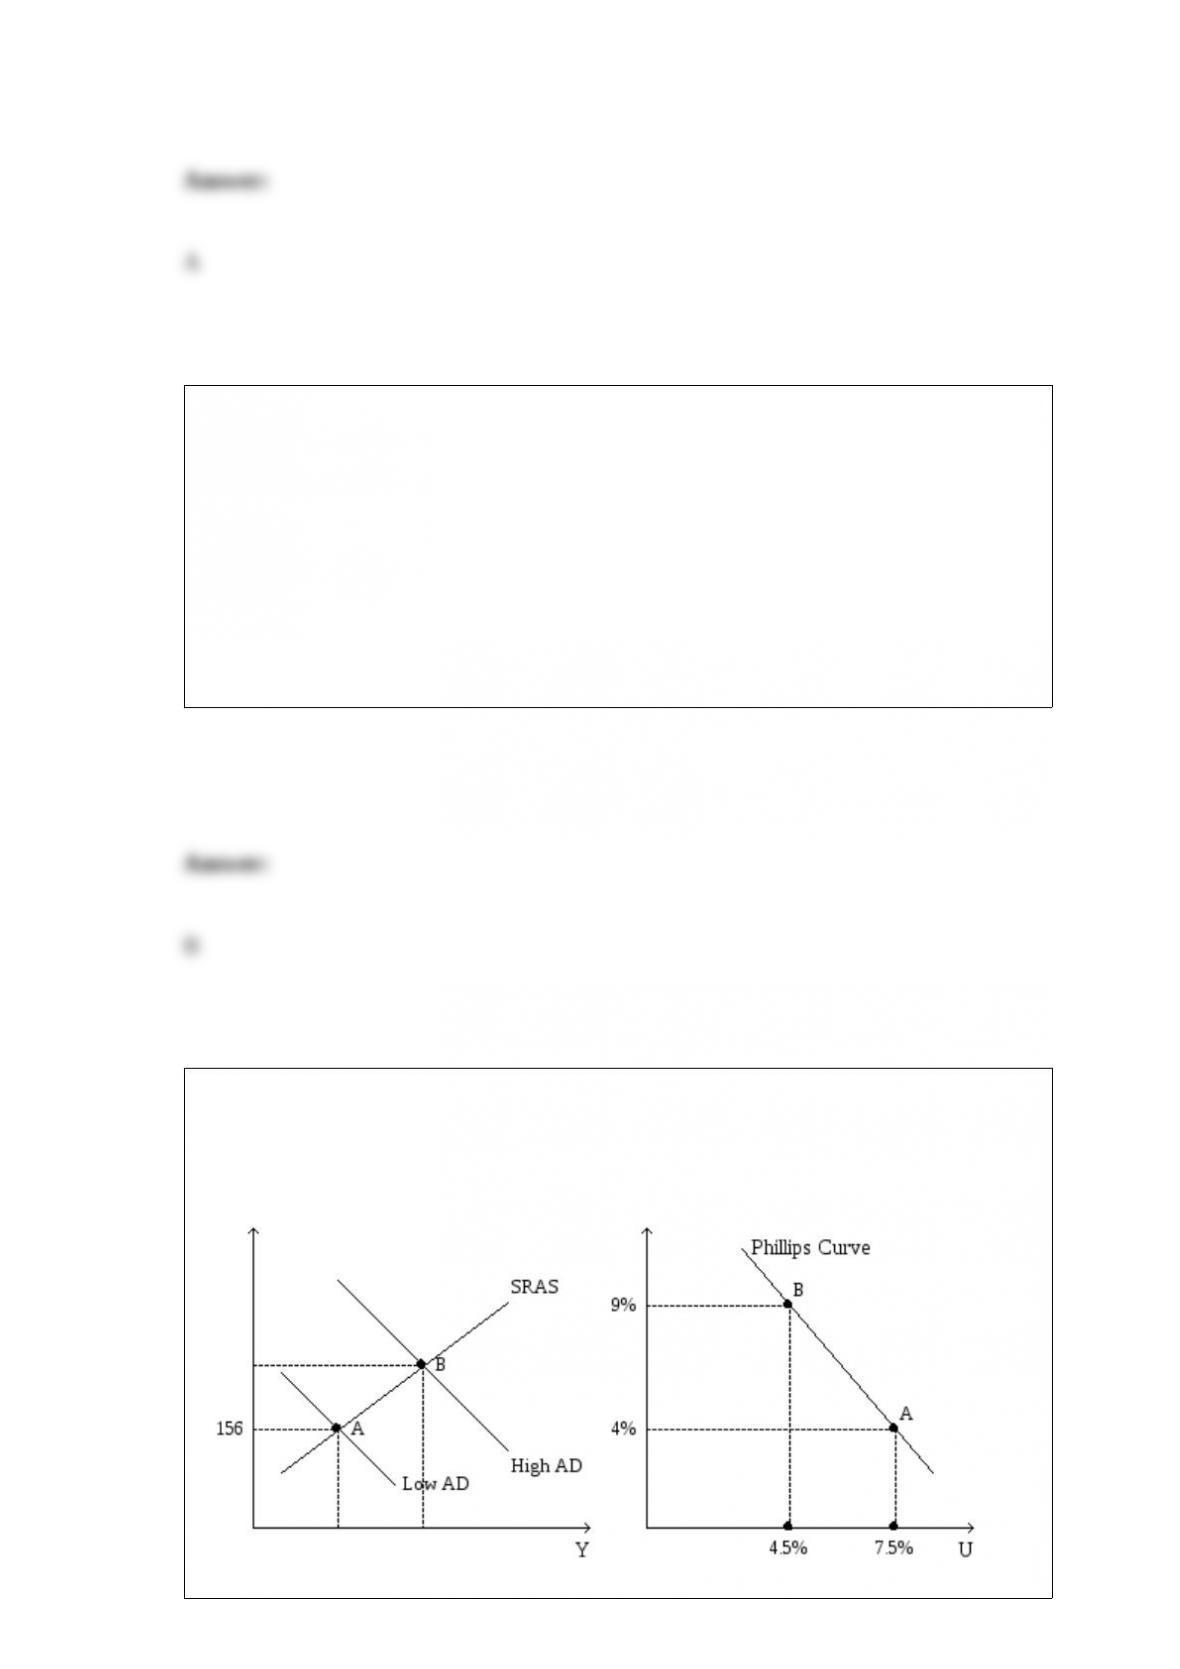
Figure 22-3. The left-hand graph shows a short-run aggregate-supply (SRAS) curve
and two aggregate-demand (AD) curves. On the left-hand diagram, Y represents output
and on the right-hand diagram, U represents the unemployment rate.

Refer to Figure 22-3. Assume the figure charts possible outcomes for the year 2018. In
2018, the economy is at point B on the left-hand graph, which corresponds to point B
on the right-hand graph. Also, point A on the left-hand graph corresponds to A on the
right-hand graph. The price level in the year 2018 is
a. 155.56.
b. 159.00.
c. 163.50.
d. 170.04.
If the money multiplier is 2 and the Fed buys $50,000 worth of bonds, what happens to
the money supply?
a. it increases by $100,000
b. it increases by $150,000
c. it decreases by $100,000
d. it decreases by $150,000
When the government imposes taxes on buyers or sellers of a good, society
a. loses some of the benefits of market efficiency.

b. gains efficiency but loses equality.
c. is better off because the government’s tax revenues exceed the deadweight loss.
d. moves from an elastic supply curve to an inelastic supply curve.
A country has $50 million of domestic investment and net capital outflow of $15
million. What is saving?
a. $65 million.
b. -$65 million.
c. $35 million.
d. -$35 million.
The art in scientific thinking is
a. finding the right problem to study.
b. deciding which assumptions to make.
c. the ability to make an abstract subject easy to understand.
d. not something in which economists have to be skilled.
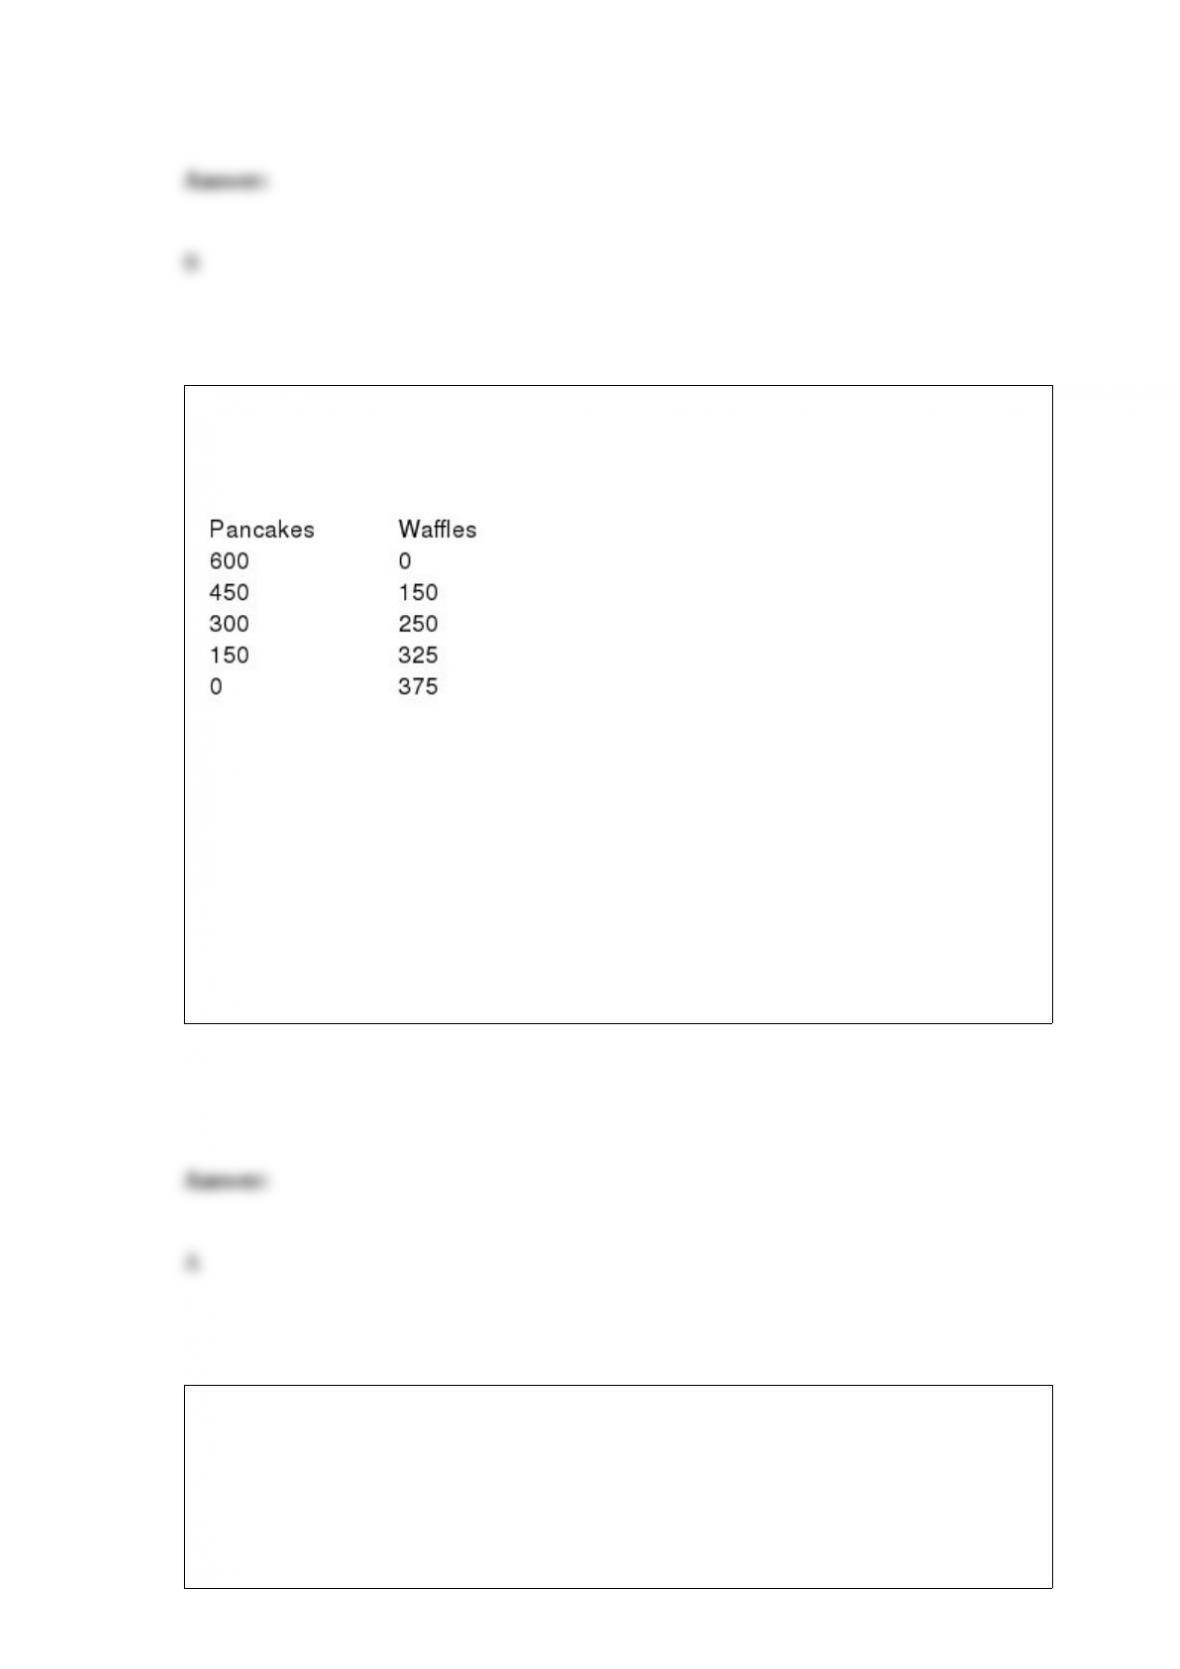
Table 2-4
Production Possibilities for Batterland
Refer to Table 2-4. What is the opportunity cost to Batterland of increasing the
production of pancakes from 150 to 300?
a. 75 waffles
b. 150 waffles
c. 250 waffles
d. 325 waffles
The manager of the bank where you work tells you that your bank has $10 million in
excess reserves. She also tells you that the bank has $400 million in deposits and $355
million dollars in loans. Given this information you find that the reserve requirement
must be
a. 35/355.

b. 45/355.
c. 35/400.
d. 45/400.
Phoenix furniture uses 10 workers, each working eight hours, to produce 80 rocking
chairs. What is Phoenix’s productivity?
a. 80 rocking chairs
b. 10 rocking chairs per hour
c. 1 rocking chair per hour
d. 1 hour per rocking chair
Which of the following could be the price elasticity of demand for a good for which an
increase in price would decrease revenue?
a. 0
b. 0.5
c. 1
d. 1.5
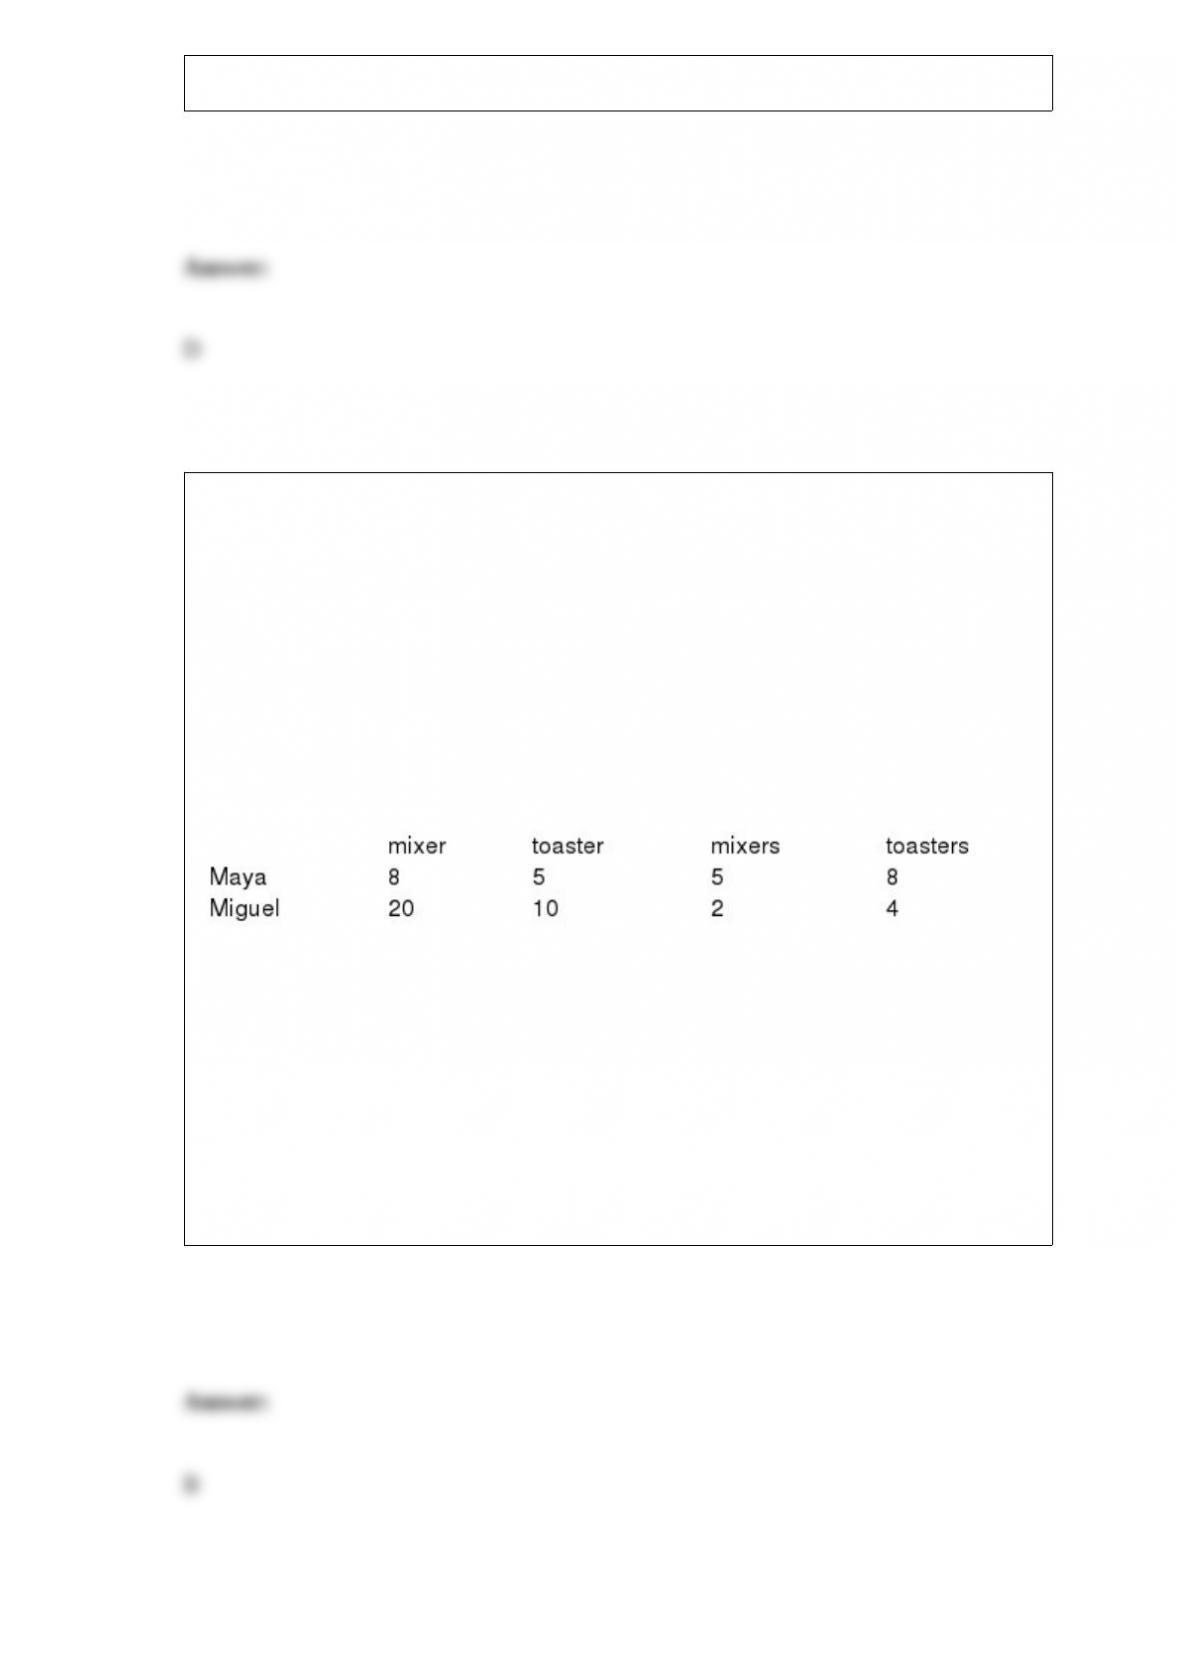
Table 3-6
Assume that Maya and Miguel can switch between producing mixers and producing
toasters at a constant rate.
Hours Needed
To Make 1 Amount Produced
in 40 Hours
Refer to Table 3-6. Which of the following combinations of mixers and toasters could
Miguel not produce in 90 hours?
a. 0 mixers and 4 toasters.
b. 1 mixer and 3 toasters.
c. 0.75 mixers and 2.5 toasters.
d. 2 mixers and 0 toasters.

When prisoners use cigarettes or some other good as money, cigarettes become
a. commodity money, but do not function as a unit of account.
b. commodity money and function as a unit of account.
c. fiat money, but do not function as a unit of account.
d. fiat money and function as a unit of account.
Which of the following could the government do to decrease the costs of inflation
without lowering the inflation rate?
a. Avoid unexpected changes in the inflation rate.
b. Rewrite the tax laws so that nominal gains were taxed instead of real gains.
c. Make policy that would discourage firms from issuing indexed bonds.
d. All of the above are correct.
Figure 8-6
The vertical distance between points A and B represents a tax in the market.
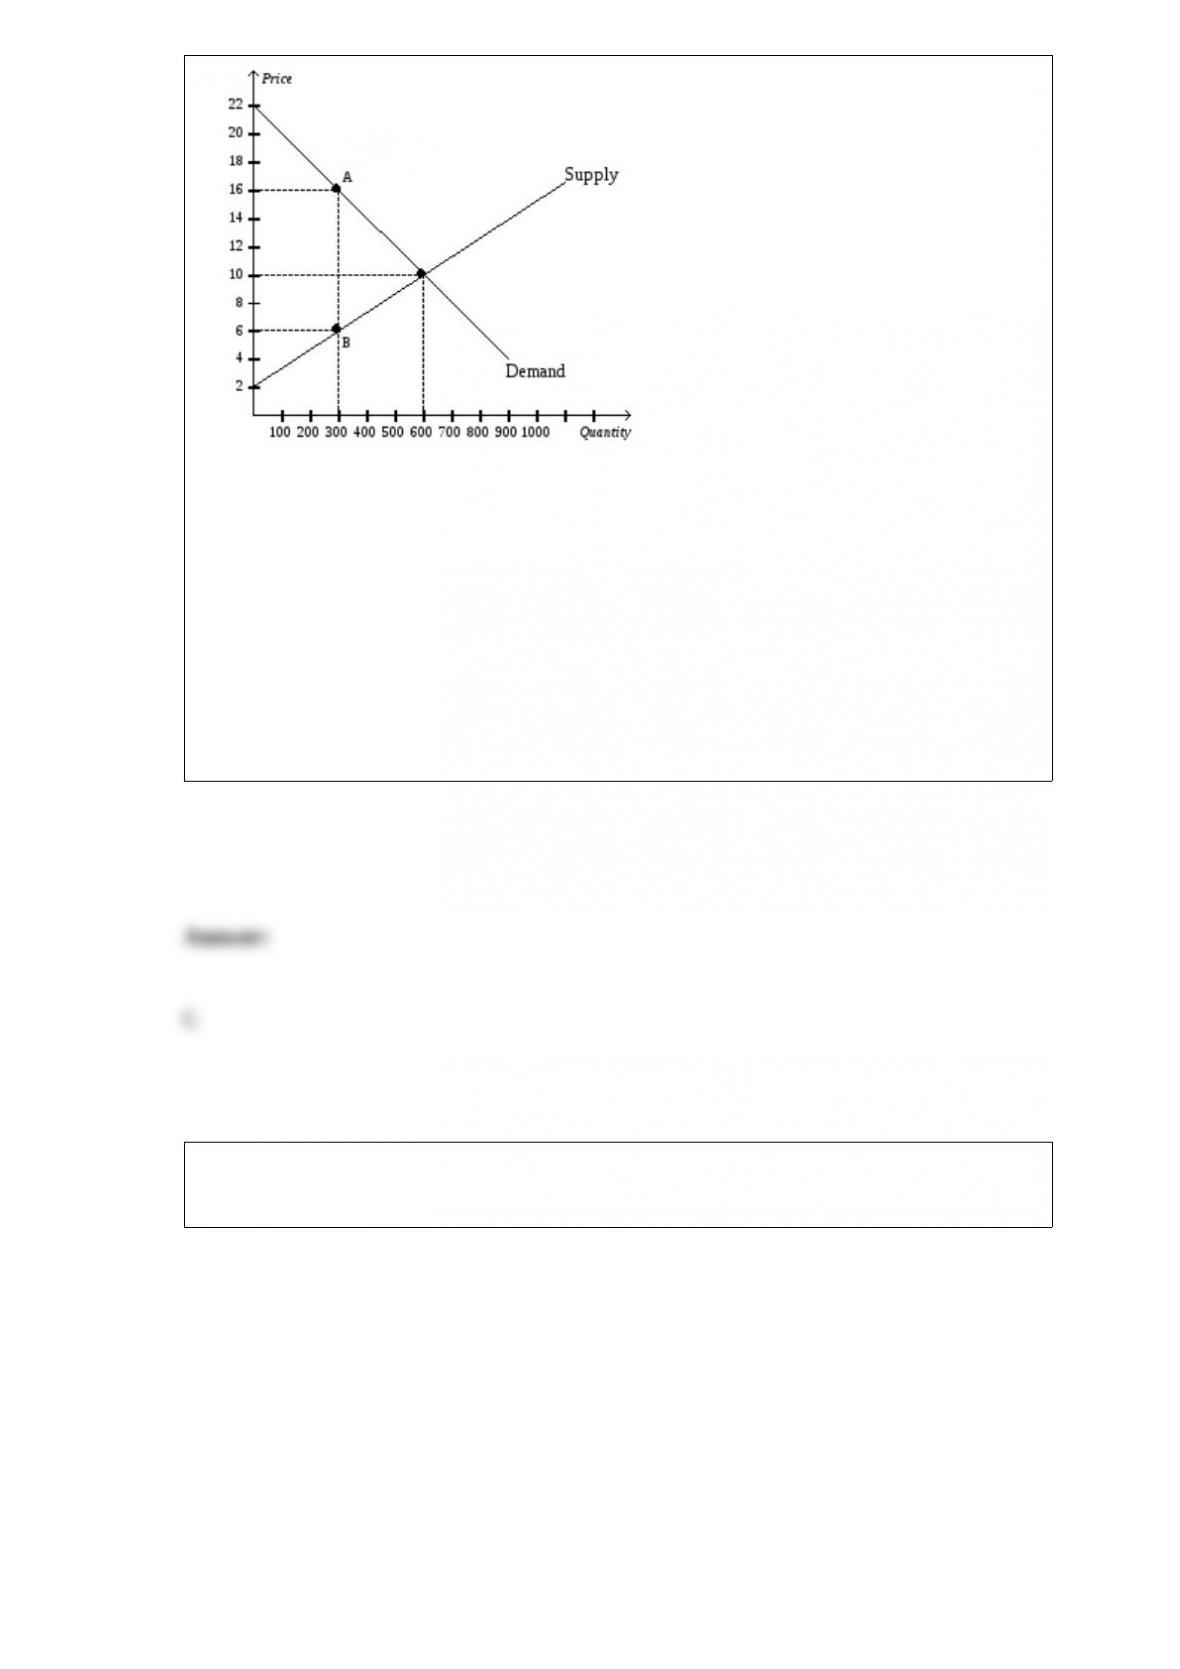
Refer to Figure 8-6. What happens to producer surplus when the tax is imposed in this
market?
a. Producer surplus falls by $600.
b. Producer surplus falls by $900.
c. Producer surplus falls by $1,800.
d. Producer surplus falls by $2,100.
Figure 5-16
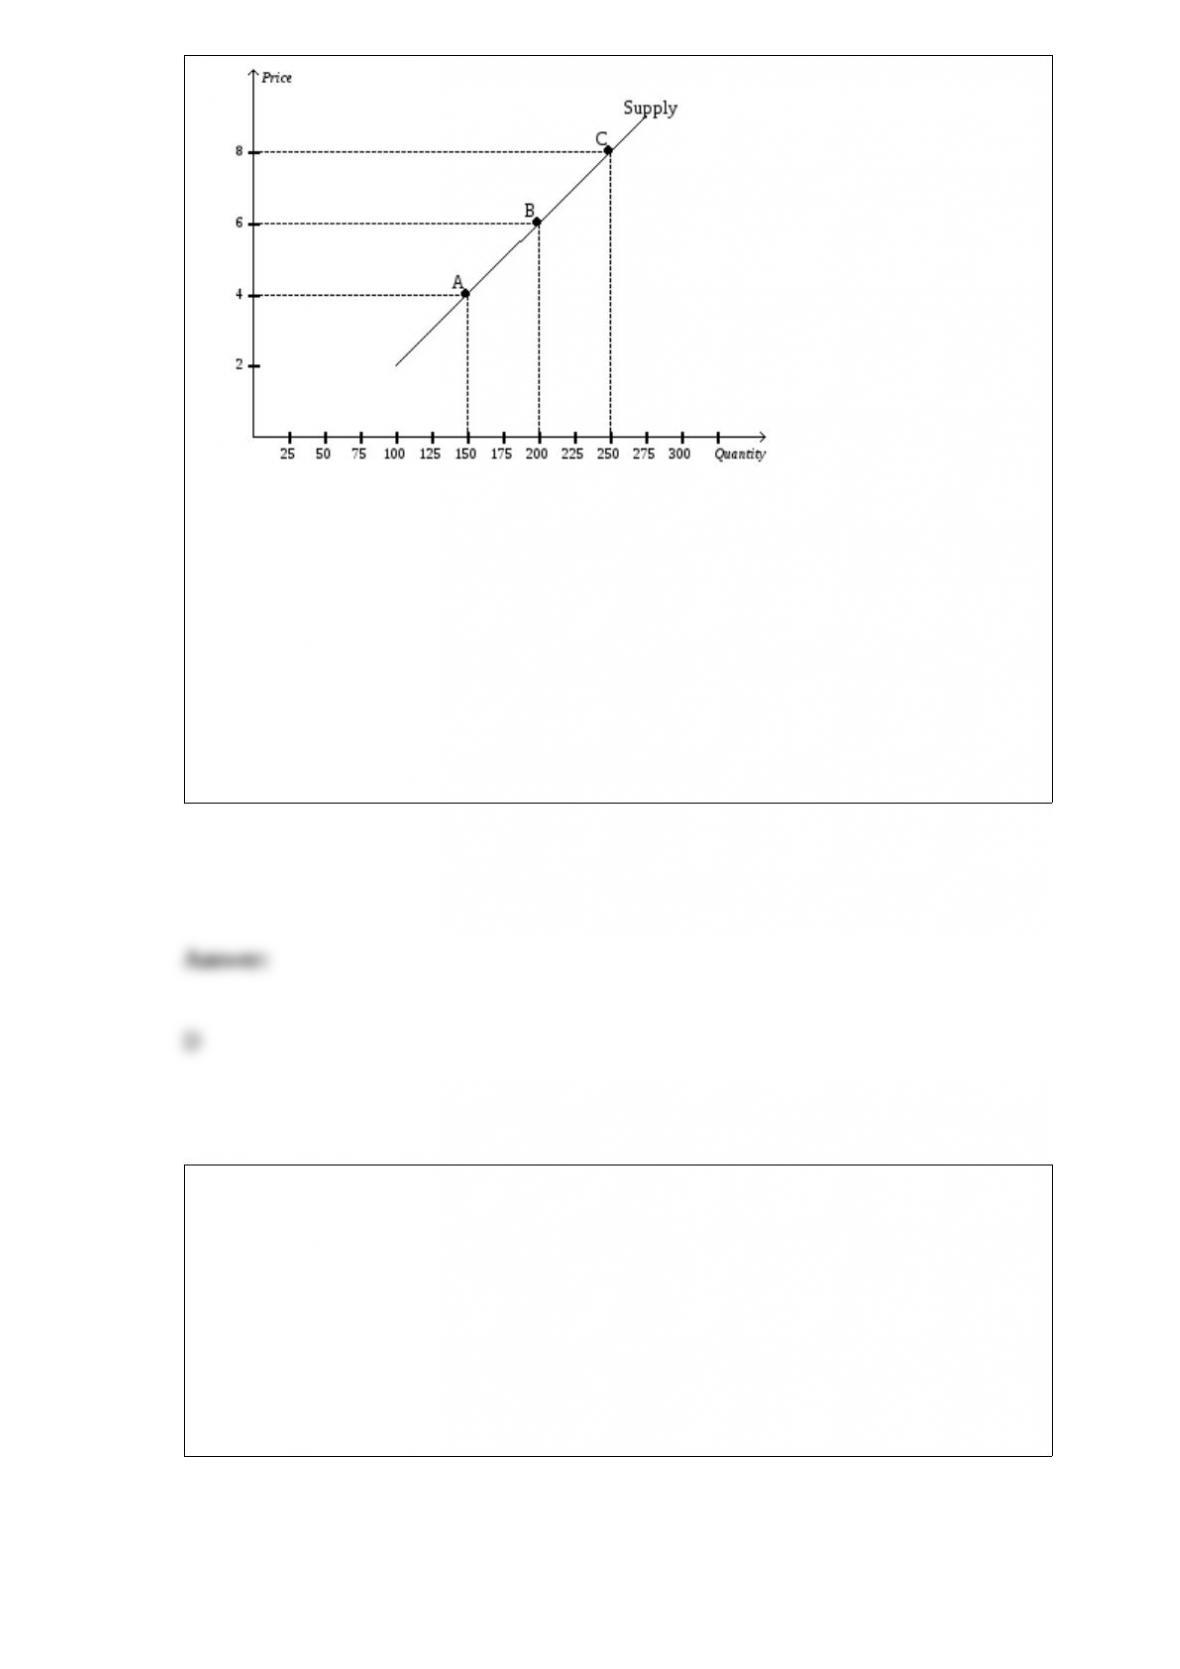
Refer to Figure 5-16. Using the midpoint method, what is the price elasticity of supply
between point B and point C?
a. 1.44
b. 1.29
c. 0.96
d. 0.78
When a tax is imposed on the sellers of a good, the supply curve shifts
a. upward by the amount of the tax.
b. downward by the amount of the tax.
c. upward by less than the amount of the tax.
d. downward by less than the amount of the tax.
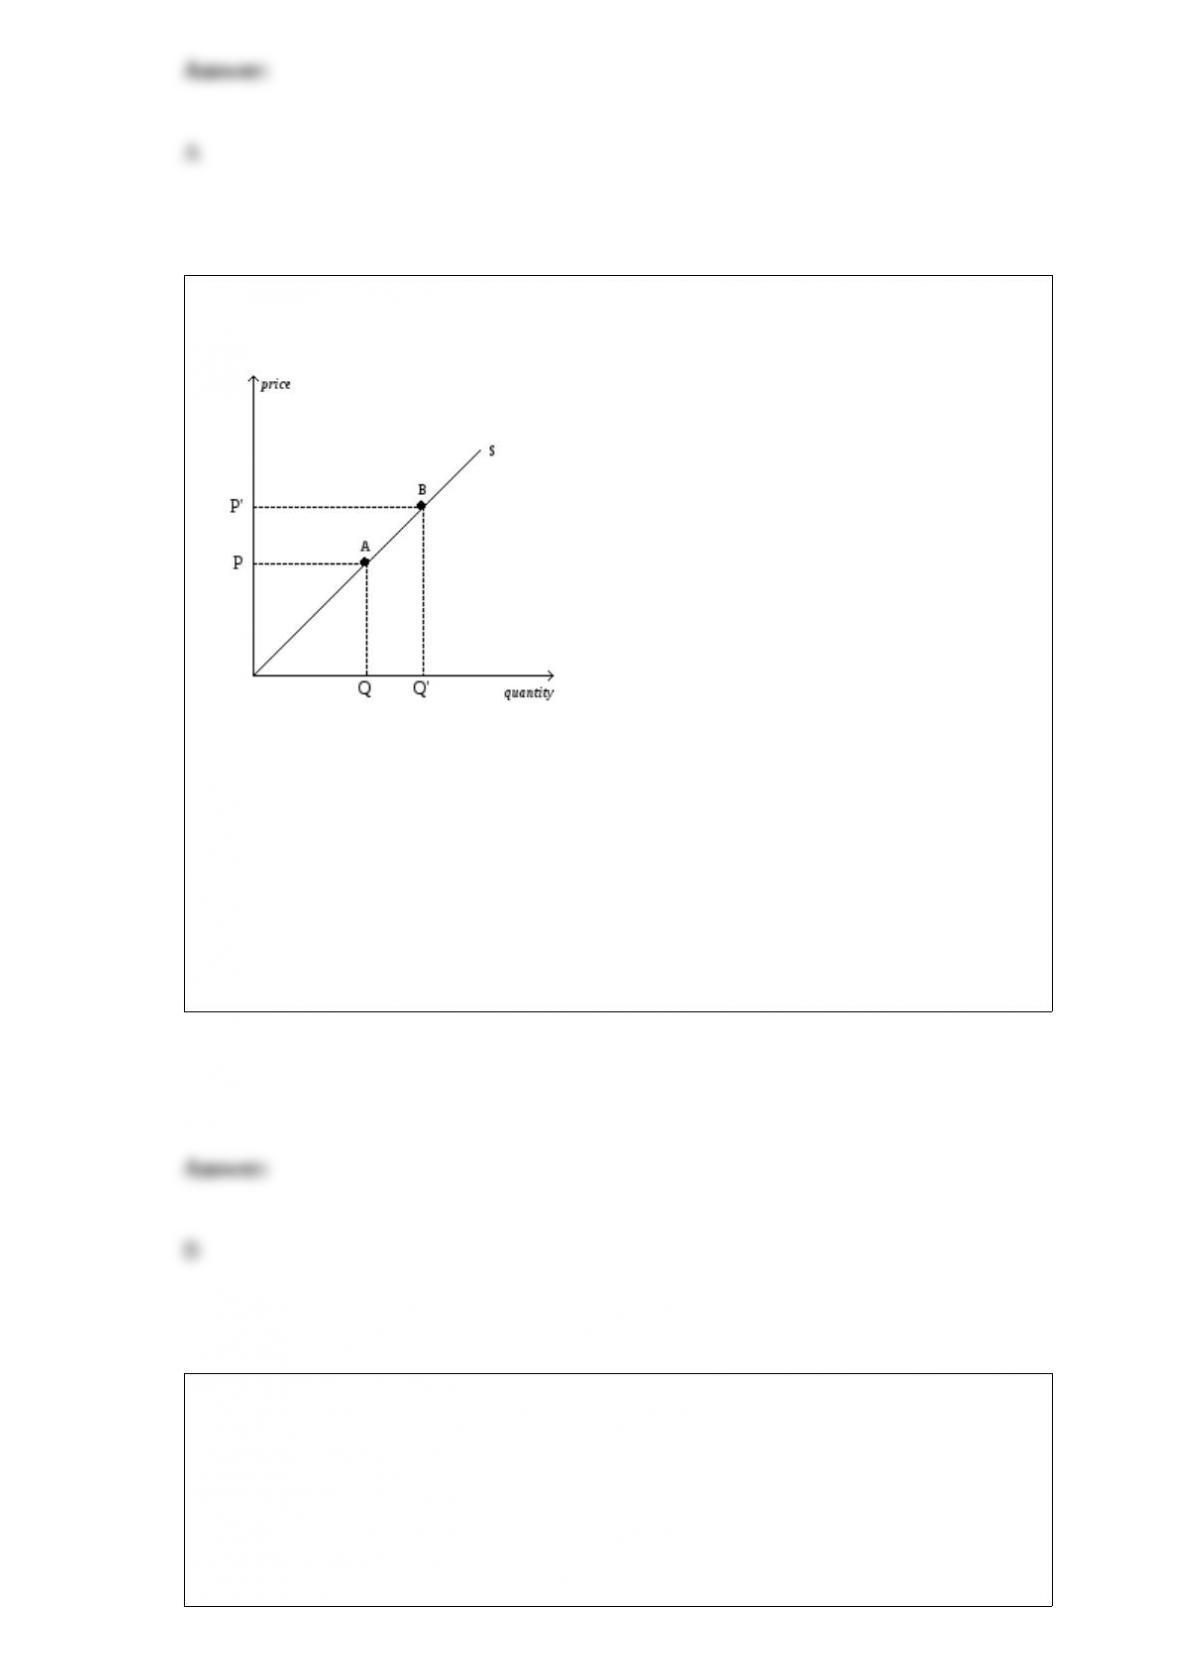
Figure 4-9
Refer to Figure 4-9. The movement from point A to point B on the graph is caused by
a. a decrease in the price of the good.
b. an increase in the price of the good.
c. an advance in production technology.
d. a decrease in input prices.
The goal of an economist who formulates new theories is to
a. provide an interesting framework of analysis, whether or not the framework turns out
to be of much use in understanding how the world works.
b. provoke stimulating debate in scientific journals.
c. contribute to an understanding of how the world works.
d. demonstrate that economists, like other scientists, can formulate testable theories.
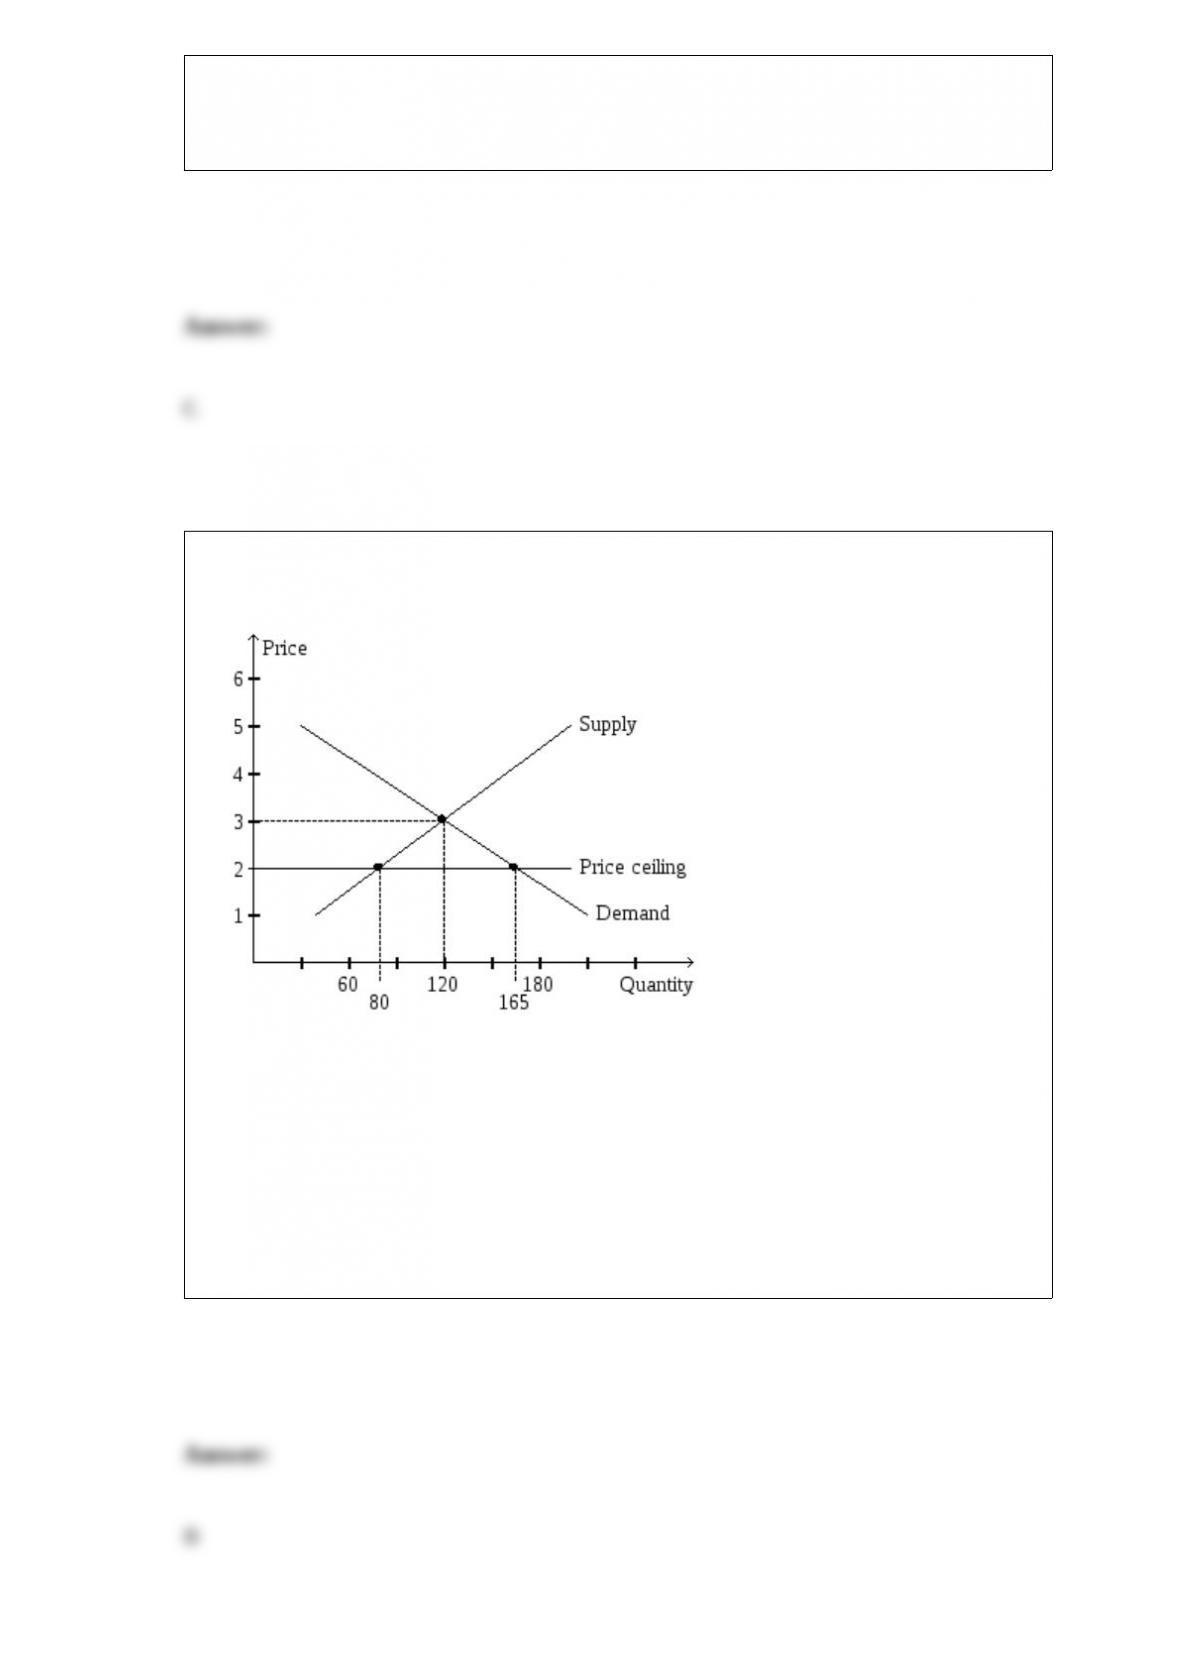
Figure 6-2
Refer to Figure 6-2. The price ceiling
a. causes a shortage of 45 units of the good.
b. makes it necessary for sellers to ration the good.
c. is not binding because it is set below the equilibrium price.
d. Both a) and b) are correct.

According to the Phillips curve, unemployment and inflation are positively related in
a. the short run and in the long run.
b. the short run, but not in the long run.
c. the long run, but not in the short run.
d. neither the long run nor the short run.
Using the liquidity-preference model, when the Federal Reserve increases the money
supply,
a. the equilibrium interest rate decreases.
b. the aggregate-demand curve shifts to the left.
c. the quantity of goods and services demanded is unchanged for a given price level.
d. the long-run aggregate-supply curve shifts to the right.
Goods with many close substitutes tend to have
a. more elastic demands.

b. less elastic demands.
c. price elasticities of demand that are unit elastic.
d. income elasticities of demand that are negative.
The distinction between efficiency and equality can be described as follows:
a. Efficiency refers to maximizing the number of trades among buyers and sellers;
equality refers to maximizing the gains from trade among buyers and sellers.
b. Efficiency refers to minimizing the price paid by buyers; equality refers to
maximizing the gains from trade among buyers and sellers.
c. Efficiency refers to maximizing the size of the pie; equality refers to producing a pie
of a given size at the least possible cost.
d. Efficiency refers to maximizing the size of the pie; equality refers to distributing the
pie fairly among members of society.
Which of the following effects helps to explain the slope of the aggregate-demand
curve?
a. the exchange-rate effect
b. the wealth effect

c. the interest-rate effect
d. All of the above are correct.
A change in the tax laws that increases the supply of loanable funds will have a smaller
effect on investment when
a. the demand for loanable funds is more elastic and the supply of loanable funds is
more inelastic.
b. the demand for loanable funds is more inelastic and the supply of loanable funds is
more elastic.
c. both the demand for and supply of loanable funds are more elastic.
d. both the demand for and supply of loanable funds are more inelastic.
Marta lends money at a fixed interest rate and then inflation turns out to be higher than
she had expected it to be. The real interest rate she earns is
a. higher than she had expected, and the real value of the loan is higher than she had
expected.
b. higher than she had expected, and the real value of the loan is lower than she had
expected.
c. lower than she had expected, and the real value of the loan is higher than she had

expected.
d. lower then she had expected, and the real value of the loan is lower than she had
expected.
If P denotes the price of goods and services measured in terms of money, then
a. 1/P represents the value of money measured in terms of goods and services.
b. P can be interpreted as the inflation rate.
c. the supply of money influences the value of P, but the demand for money does not.
d. All of the above are correct.
Which of the following statements about mutual funds is correct?
a. A mutual fund is a financial intermediary.
b. A mutual fund acquires its funds primarily by selling shares to the public.
c. People who buy shares from a mutual fund accept all of the risk and return associated
with the mutual fund’s portfolio.
d. All of the above are correct.

Suppose the Fed requires banks to hold 10 percent of their deposits as reserves. A bank
has $20,000 of excess reserves and then sells the Fed a Treasury bill for $9,000. How
much does this bank now have to lend out if it decides to hold only required reserves?
a. $29,000
b. $28,100
c. $19,100
d. $11,000
A market includes
a. buyers only.
b. sellers only.
c. both buyers and sellers.
d. the place where transactions occur but not the people involved.

If a tax is levied on the buyers of a product, then the demand curve will
a. not shift.
b. shift down.
c. shift up.
d. become flatter.