Chapter 8 Mechanisms and Inhibitors
Matching Questions
Use the following to answer questions 1-10:
Choose the correct answer from the list below. Not all of the answers will be used.
a) hydrolysis
b) affinity label
c) tyrosinase
d) chymotrypsin
e) pepsin
f) noncompetitive
g) uncompetitive
h) metal ion
i) approximation and orientation
j) acid–base
k) competitive
1.
____________ An enzyme that temporarily undergoes covalent catalysis as part of its
mechanism.
2.
____________ The type of reaction catalyzed by proteases.
Section: 8.3
3.
____________ A protease enzyme with a low pH optimum.
Section: 8.2
4.
____________ The type of catalysis where two substrates are brought into close proximity.
Section: 8.1
5.
____________ A molecule also known as a substrate analog.
Section: 8.2
Chapter 8 Mechanisms and Inhibitors
2
6.
____________ The inhibitor that binds only to the ES complex and lowers the Vmax and KM.
7.
____________ The enzyme inhibition that can be overcome by increasing concentration of
substrate.
Ans:
k
Section: 8.2
8.
____________ A type of catalysis where the proton donor is not water.
Ans:
j
Section: 8.1
9.
____________ A type of enzyme inhibitor where KM is unaltered.
Ans:
f
Section: 8.2
10.
Ans:
c
Section: 8.2
____________ An enzyme that is part of a pigment formation pathway and has a low-
temperature optimum.
Fill–in-the-Blank Questions
11.
An enzyme catalyst mechanism that uses a metal cation to stabilize a negative charge in the
active site is a .
12.
is a catalytic mechanism that forces two substrates into an appropriate 3-dimensional
arrangement for the reaction to occur.
Ans: Catalysis by approximation and orientation Section: 8.1
13.
The antibiotic, penicillin, is an example of what kind of inhibitor? .
Ans: irreversible Section: 8.2
14.
In conducting an experiment with a new drug, you find that regardless of the concentration of
substrate, the drug is able to inhibit the enzyme activity. You are likely to not have what kind of
inhibitor? .
Ans: competitive Section: 8.2
15.
An uncompetitive inhibitor will have two lines on a double-reciprocal plot.
Ans: parallel Section: 8.2
Ans:
g
Section: 8.2
Chapter 8 Mechanisms and Inhibitors
3
16.
A inhibitor binds irreversibly to the active site of an enzyme.
17.
The stabilizes the tetrahedral intermediate of the hydrolysis of a peptide bond by
chymotrypsin.
Ans: oxyanion hole Section: 8.3
18.
A inhibitor has a structure similar to the substrate and reversibly binds to the active site of the
enzyme.
Ans: competitive Section: 8.2
19.
The straight-line kinetic plot of 1/ V0 versus 1/S is called a .
Ans: double-reciprocal plot Section: 8.2
20.
Which amino acids in chymotrypsin are found in the active site and are participants in substrate
cleavage? .
A) his, ser, asp B) his, ser, asn C) asp, lys, ser D) lys, arg, asn E) his, ser, arg
Ans: A Section: 8.3
21.
The mechanism of chymotrypsin involves the formation of an unstable -shaped intermediate
that is stabilized by the oxyanion hole.
Ans: tetrahedral Section: 8.3
Multiple-Choice Questions
22.
What conclusion can be drawn concerning an inhibitor if the KM is the same in the presence and
absence of the inhibitor?
A)
The inhibitor binds to the substrate.
B)
The inhibitor has a structure that is not very similar to the substrate.
C)
The inhibitor forms a reversible covalent bond with the enzyme.
D)
The inhibitor binds to the same active site as the substrate.
E)
The Vmax is larger in the presence of inhibitor.
Ans: B Section: 8.2
23.
What type(s) of inhibition can be reversed?
A)
competitive
D)
All of the above.
B)
noncompetitive
E)
None of the above.
C)
uncompetitive
Ans: D Section: 8.2
24.
In what type of inhibition can the inhibitor only bind to the ES complex to form an ESI
complex?
A)
competitive
D)
uncompetitive
B)
noncompetitive
E)
None of the above.
C)
irreversible
Ans: D Section: 8.2
Ans: suicide Section: 8.2

Chapter 8 Mechanisms and Inhibitors
4
25.
How is specificity determined by chymotrypsin?
A)
interaction of the active site amino acids with the substrate
B)
binding of the N-terminus amino acid at the active site
C)
covalent binding of a his residue to the substrate
D)
conformational change upon binding of substrate
E)
binding of the proper amino acid into a deep pocket on the enzyme
26.
Where does cleavage of the scissile bond by chymotrypsin occur?
A)
between a his and ser amino acid
B)
on the N-terminal side of a phe or trp residue
C)
on the C-terminal side of a phe or trp residue
D)
at the N-terminal amino acid
E)
on the C-terminal side of an arg or lys amino acid
Ans: C Section: 8.3
27.
An enzyme is optimally active at neutral pH, but activity drops off sharply if the pH is changed,
This enzyme is likely to have what in the active site?
A)
the side chains of aspartate and glutamate
B)
two histidine amino acid side chains
C)
a glycine amino acid
D)
polar side chains
E)
nonpolar side chains
Ans: A Section: 8.2
Ans: E Section: 8.3

Chapter 8 Mechanisms and Inhibitors
5
28.
In this catalytic strategy, a cofactor serves as an electrophile to stabilize a negative charge on a
reaction intermediate.
A)
covalent catalysis
B)
general acid–base catalysis
C)
metal ion catalysis
D)
catalysis by approximation and orientation
E)
irreversible catalysis
29.
In Chapter 7, it stated that double-reciprocal plots were not used to determine KM and Vmax;
however, they are shown again in Chapter 8, Section 2. What explanation could there be for
their use in this chapter?
A)
The slope of the line, + inhibitor, relative to the slope of the line, – inhibitor, gives
information about whether or not the enzyme is regulated allosterically.
B)
The x-axis more accurately determines kcat for the reaction + inhibitor.
C)
The slope of the line provides information about the transition state intermediate.
D)
The slope of the line, + inhibitor, relative to the slope of the line, – inhibitor, gives
information about the mechanism of inhibition.
E)
The y-axis can be used to determine binding constants for substrate versus inhibitor.
29.
In designing a drug to inhibit an enzyme specific to a new strain of E. coli, would you choose a
group-specific inhibitor or a mechanism-based inhibitor? Why?
A)
Mechanism-based because it mimics the transition-state intermediate.
B)
Mechanism-based because it modifies a catalytically active group on the enzyme.
C)
Group-specific because it will react to specific R-groups in the enzyme.
D)
Group-specific because its activity can be enhanced with an allosteric inhibitor.
E)
Group-specific because they are structurally similar to the enzyme’s substrate.
Ans: B Section: 8.2
30.
What two biochemical principles explain the enzyme activity versus temperature curve?
A)
The rising portion of the curve is due to increase in Brownian motion of the molecules,
and the decrease is due to activation of inhibitor molecules.
B)
An increase in temperature increases the interactions with allosteric activators, and a
decrease in temperature increases the interactions with allosteric inhibitors.
C)
The rising portion of the curve is due to increase in Brownian motion of the molecules,
and the decrease is due to enzyme denaturation.
D)
The rising portion of the curve is due to increase in enzyme synthesis, and the decrease is
due to reduction in Brownian motion of the molecules.
E)
The rising portion of the curve is due to increase in enzyme synthesis, and the decrease is
due to activation of inhibitor molecules.
Ans: C Section: 8.1
Ans: C Section: 8.2
Chapter 8 Mechanisms and Inhibitors
6
31.
When chymotrypsin activity is monitored with a chromogenic substrate, the kinetics shows a
burst phase and a steady-state phase. What does this tell us about chymotrypsin’s mechanism of
catalysis?
A)
The chromogenic stubtrate is an uncompetitive inhibitor.
B)
The burst phase is due to release of the chromophore and formation of an enzyme-acyl
intermediate.
C)
The steady-state phase occurs more rapidly causing a deacylation and release of more
chromophore.
D)
All of the above.
E)
None of the above.
Short-Answer Questions
32.
How are the types of inhibition kinetically distinguishable?
to the EI complex; however, the Vmax is decreased. In mixed inhibition, both values may
be altered.
Section: 8.3
33.
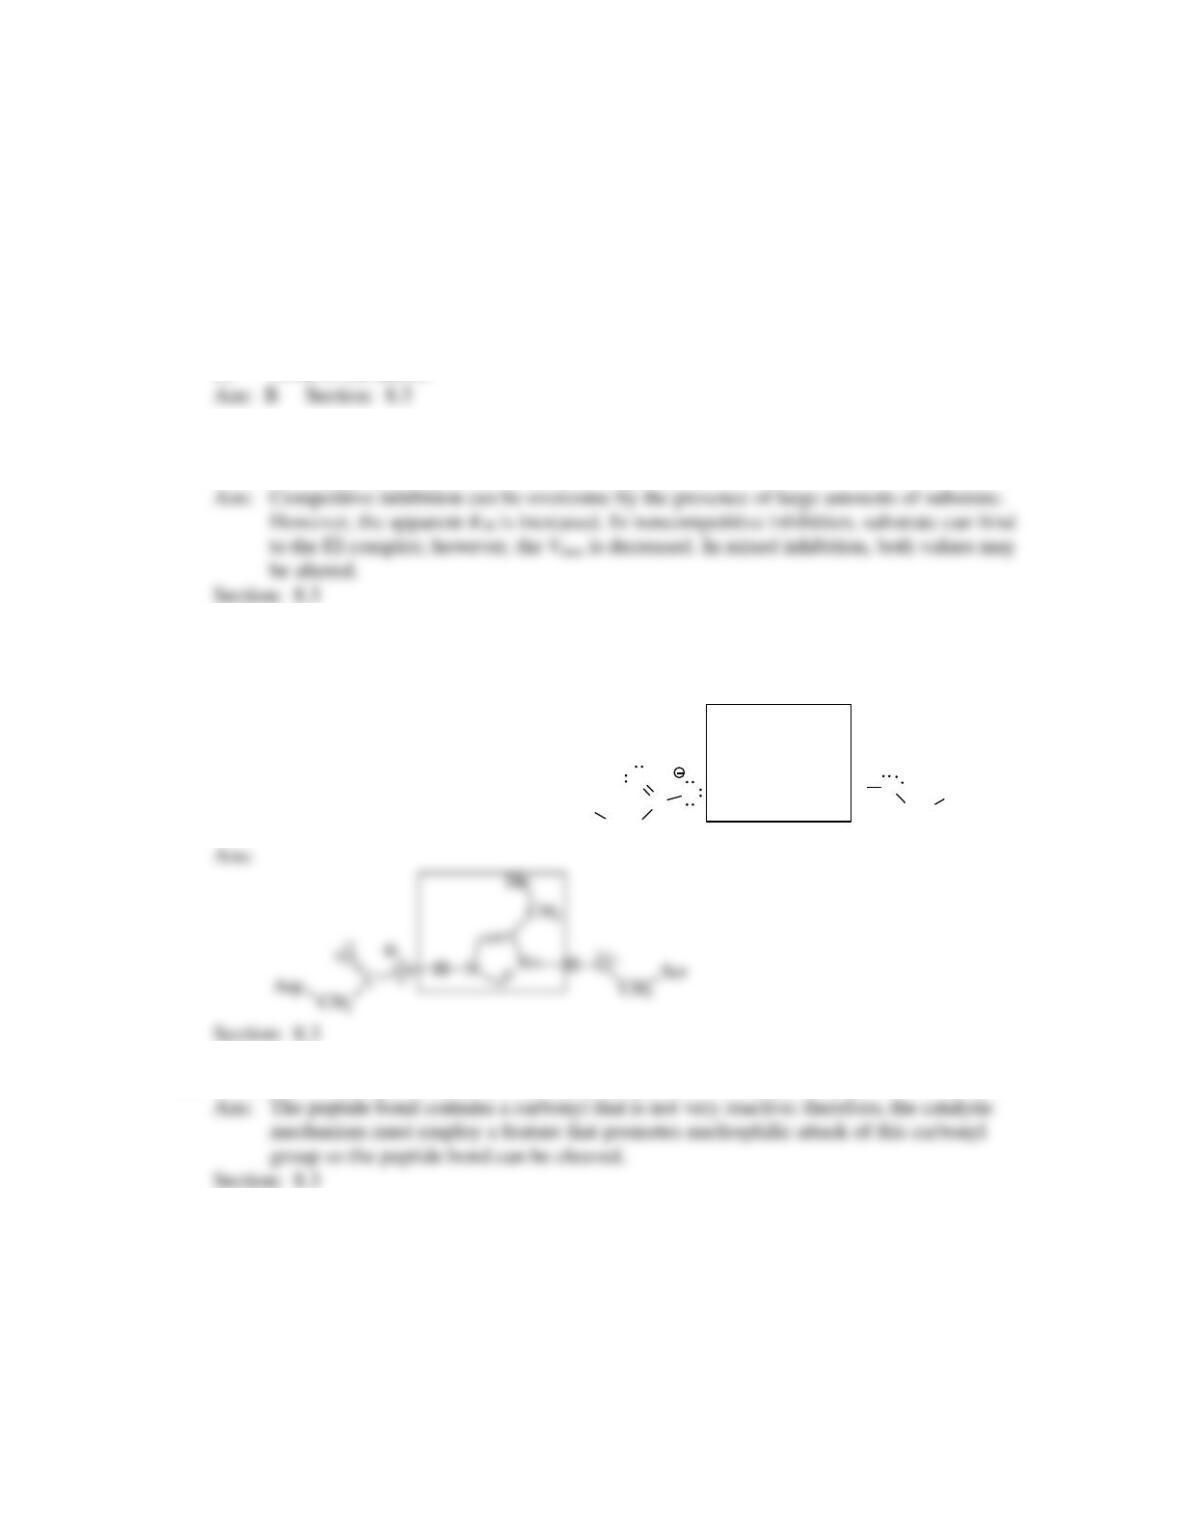
Complete the structure of the catalytic triad of chymotrypsin by drawing the proper structure of
the missing residue side chain in the box provided. Show the proper hydrogen bonding involved
in this triad.
H O CH2Ser
CO
O
CH2
Asp
Section: 8.3
34.
What is the challenge for a protease to facilitate hydrolysis of a peptide bond?
mechanism must employ a feature that promotes nucleophilic attack of this carbonyl
group so the peptide bond can be cleaved.
Section: 8.3
Ans: B Section: 8.3
Chapter 8 Mechanisms and Inhibitors
7
35.
How can covalent modification be used to determine the mechanism of action of an enzyme?
36.
What is an affinity label?
site, and chemically reacts with a residue in the active site. It is used to study enzyme
structure and mechanism.
Section: 8.3
37.
Why are substrate analogs used to monitor enzyme activity?
manner using spectrophotometers.
Section: 8.3
38.
What caused a “burst” of activity followed by a steady-state reaction when chymotrypsin was
studied by stop-flow techniques?
Ans:
Chymotrypsin cleaves peptide bonds in a two-step reaction in which the first step,
formation of the acyl enzyme intermediate, is faster than the second step, hydrolysis.
Section: 8.3
39.
Designing drugs to inhibit enzymes is a large part of pharmaceutical research. What are some of
the enzymatic features that are important?
enzyme assays would be used to determine the effect of the inhibitors on Kcat, KM, and
Section: 8.2
40.
What factors should an enzymologist consider when designing an enzyme assay?
catalytic function, and additional regulatory compounds are needed to measure the
Section: 8.2
41.
There is a key difference between an enzyme that uses a covalent catalysis mechanism and the
other catalytic strategies. What is the key difference?
utilizes a covalent catalyst strategy covalently binds the substrate to one or more of the
amino acids in the active site.
Section: 8.1
the loss of activity, such as conformational change.
Section: 8.3
Chapter 8 Mechanisms and Inhibitors
8
42.
Which of the following curves
(no inhibitor, inhibitor #1, and inhibitor #2) represents the
rate of reaction versus substrate concentration for a
competitive and uncompetitive inhibitor. Draw the double-
reciprocal plot for each case.
43.
What is the difference between KM and KM app?
Ans:
The Km is the Michaelis–Menten constant measuring the affinity of an enzyme for its
substrate. The Km app is the altered constant in the presence of an inhibitor.
Section: 8.2 and Figs. 8.10 and 8.11
44.
Draw and describe the reaction pathway for a noncompetitive inhibitor.
Section: 8.2
45.
What are group specific reagents?
groups of an amino acid. These are used to define the active site amino acids of an
specific –OH group on a serine in chymotrypsin.
Section: 8.2
46.
Bacteria that become penicillin resistant express an enzyme called -lactamase and this enzyme
hydrolyses the lactam ring on penicillin. Suggest a reason why this protein allows cells to grow
in the presence of penicillin?
the cell wall of the bacteria to properly form.
Section: 8.2
Vo
[S]
No I
I #1
I #2
Ans:
Inhibitor #1 is a competitive inhibitor. Inhibitor #2 is an uncompetitive inhibitor.
Section: 8.2
Chapter 8 Mechanisms and Inhibitors
9
47.
The initial reaction kinetics of some enzymes result in a quick burst of product in a short period
of time followed by a slower but sustained increase in product formation over time. What does
this type of kinetic response tell an enzymologist about the mechanism of the catalysis?
48.
A site directed mutagenesis converting histidine 57 of chymotrypsin to a lysine results in an
inactive enzyme even though lysine has an amino group in its side chain. Describe why the
scientist may have thought this result surprising and why it wasn’t.
ability to partially deprotonize the neighboring serine’s –OH group. Lysine does not have
Section: 8.3
49.
How does the enzyme chymotrypsin bind, and specifically, hydrolyze its substrate? How does
this differ from other proteases?
into an appropriate conformation for the active site amino acids to do their job. If this
binding site were altered or missing, the active site would remain and the protein would
Section: 8.3
50.
Describe the mechanism for the proteolysis catalyzed by chymotrypsin.
Ans:
This is an acid–base, covalent catalysis that generates an unstable tetrahedral-
intermediate. The intermediate is stabilized by the interactions of the oxyanion hole. The
reaction mechanism is shown on Fig. 8.25.
Section: 8.3
51.
You measure the initial velocity of an enzyme in the absence and presence of an inhibitor. In
each case the inhibitor is at 10 µM. Show the primary data for all three cases and the
Lineweaver–Burk plot. Calculate the KM and Vmax for each case both graphically and
mathematically. Determine the mechanism for each inhibitor and where they will interact on
the enzyme.
Initial Velocity (µmole/ml min)
Enzyme Enzyme Enzyme
[S] mM
alone
+ inhibitor 1
+ inhibitor 2
0.33
1.65
1.05
0.79
0.50
2.13
1.43
1.02
1.00
2.99
2.22
1.43
2.00
3.72
3.08
1.79
5.00
4.00
3.80
2.00
Ans:
Construct a double-reciprocal plot, then from the intercept of the vertical axis, determine
the value for the intercept = 1/Vmax and the horizontal axis to determine the value for –
1/Km.
Section: 7.2
Ans:
These two-phase reactions (rapid burst phase and a steady-state phase) indicate that the
reaction takes place in two steps. The first step is very quick and will achieve
equilibrium rapidly, and there is a second, slower step of the reaction.