36) According to the logistic growth equation, = rmaxN,
A) the number of individuals added per unit time is greatest when N is close to zero.
B) the per capita growth rate (r) increases as N approaches K.
C) population growth is zero when N equals K.
D) the population grows exponentially when K is small.
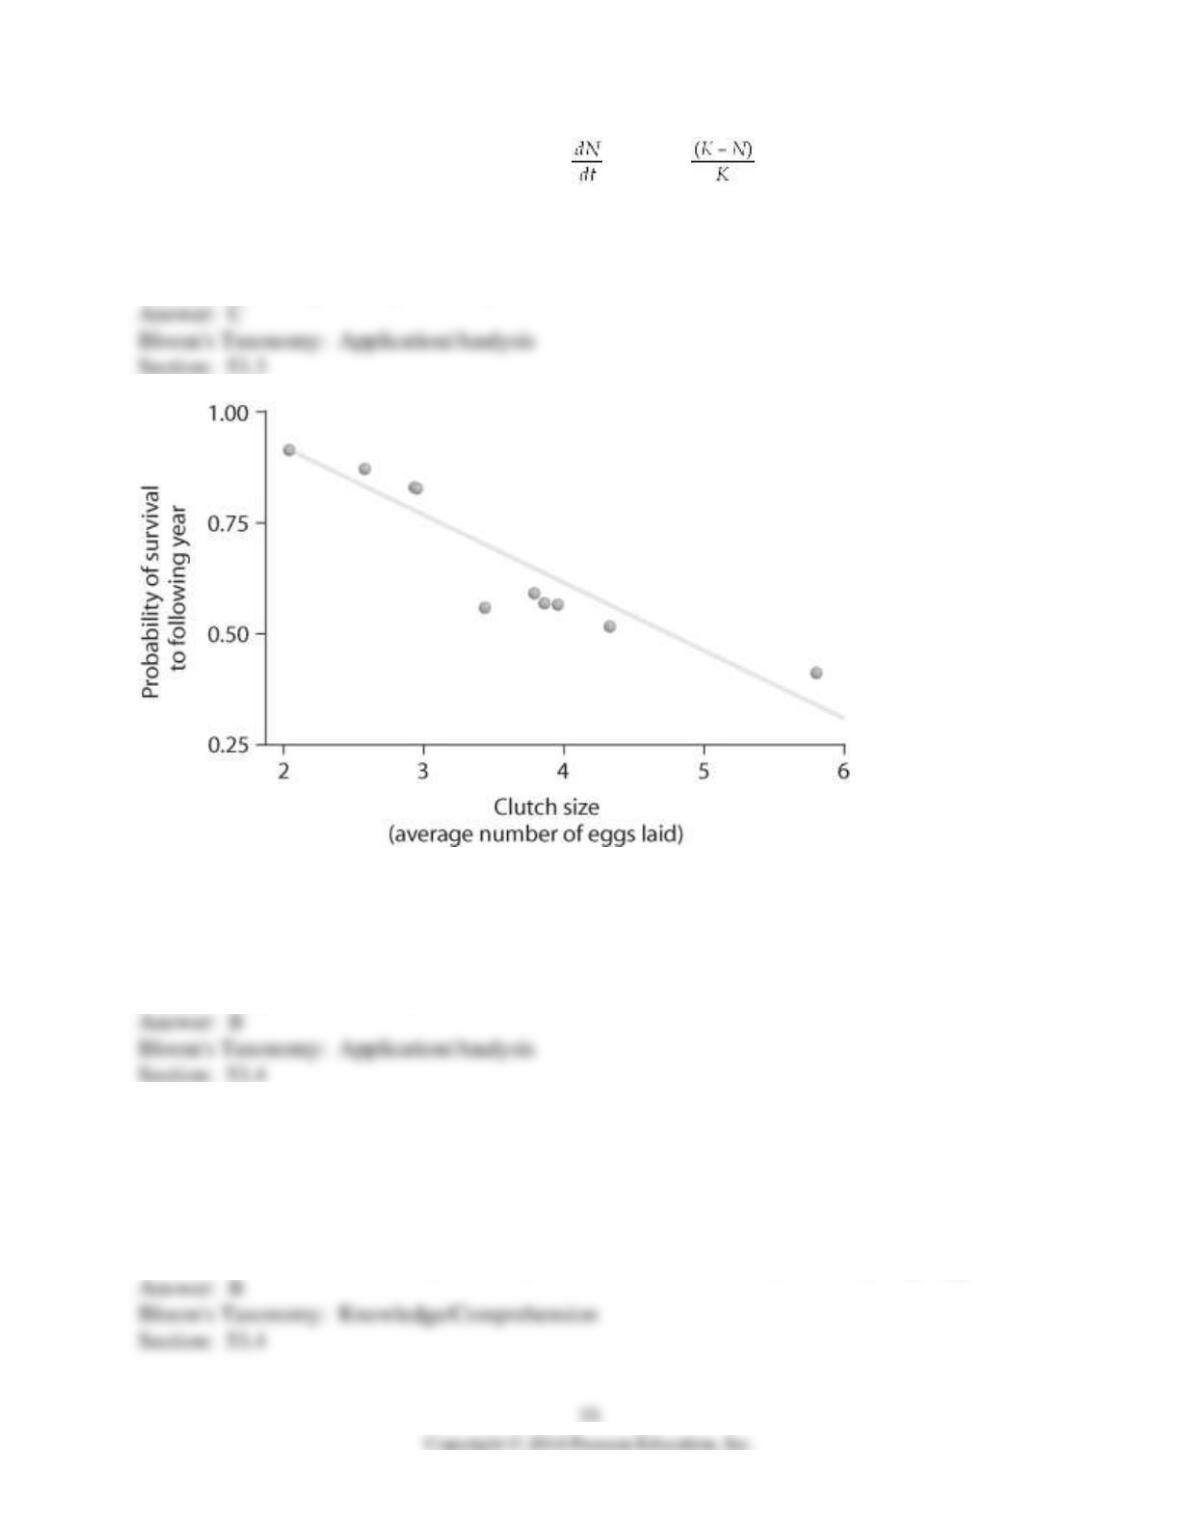
37) Looking at the data in the figure above, what can be said about survival and clutch size?
A) Animals with low survival tend to have smaller clutch sizes.
B) Large clutch size correlates with low survival.
C) Animals with high survival tend to have larger clutch sizes.
D) Probability of survivorship does not correlate with clutch size.
38) What is the primary limiting factor that determines why no female animal can produce a very
large number of very large eggs?
A) Time is limited.
B) There are energy constraints.
C) Temperature constraints will prevent females from carrying too many eggs.
D) There will be an increase in predation pressure if the females carry too many large eggs.
39) You observe two female fish of the same species breeding. One female lays 100 eggs and the
other female lays 1000 eggs. Which one of the following is LEAST likely given the limits of
fitness trade-offs?
A) The female laying 100 eggs breeds more often than the female laying 1000 eggs.
B) The female laying 100 eggs lives longer than the female laying 1000 eggs.
C) The eggs from the female laying 1000 eggs have larger yolks than the yolks of the eggs from
the female laying 100 eggs.
D) The female laying 1000 eggs is larger than the female laying 100 eggs.
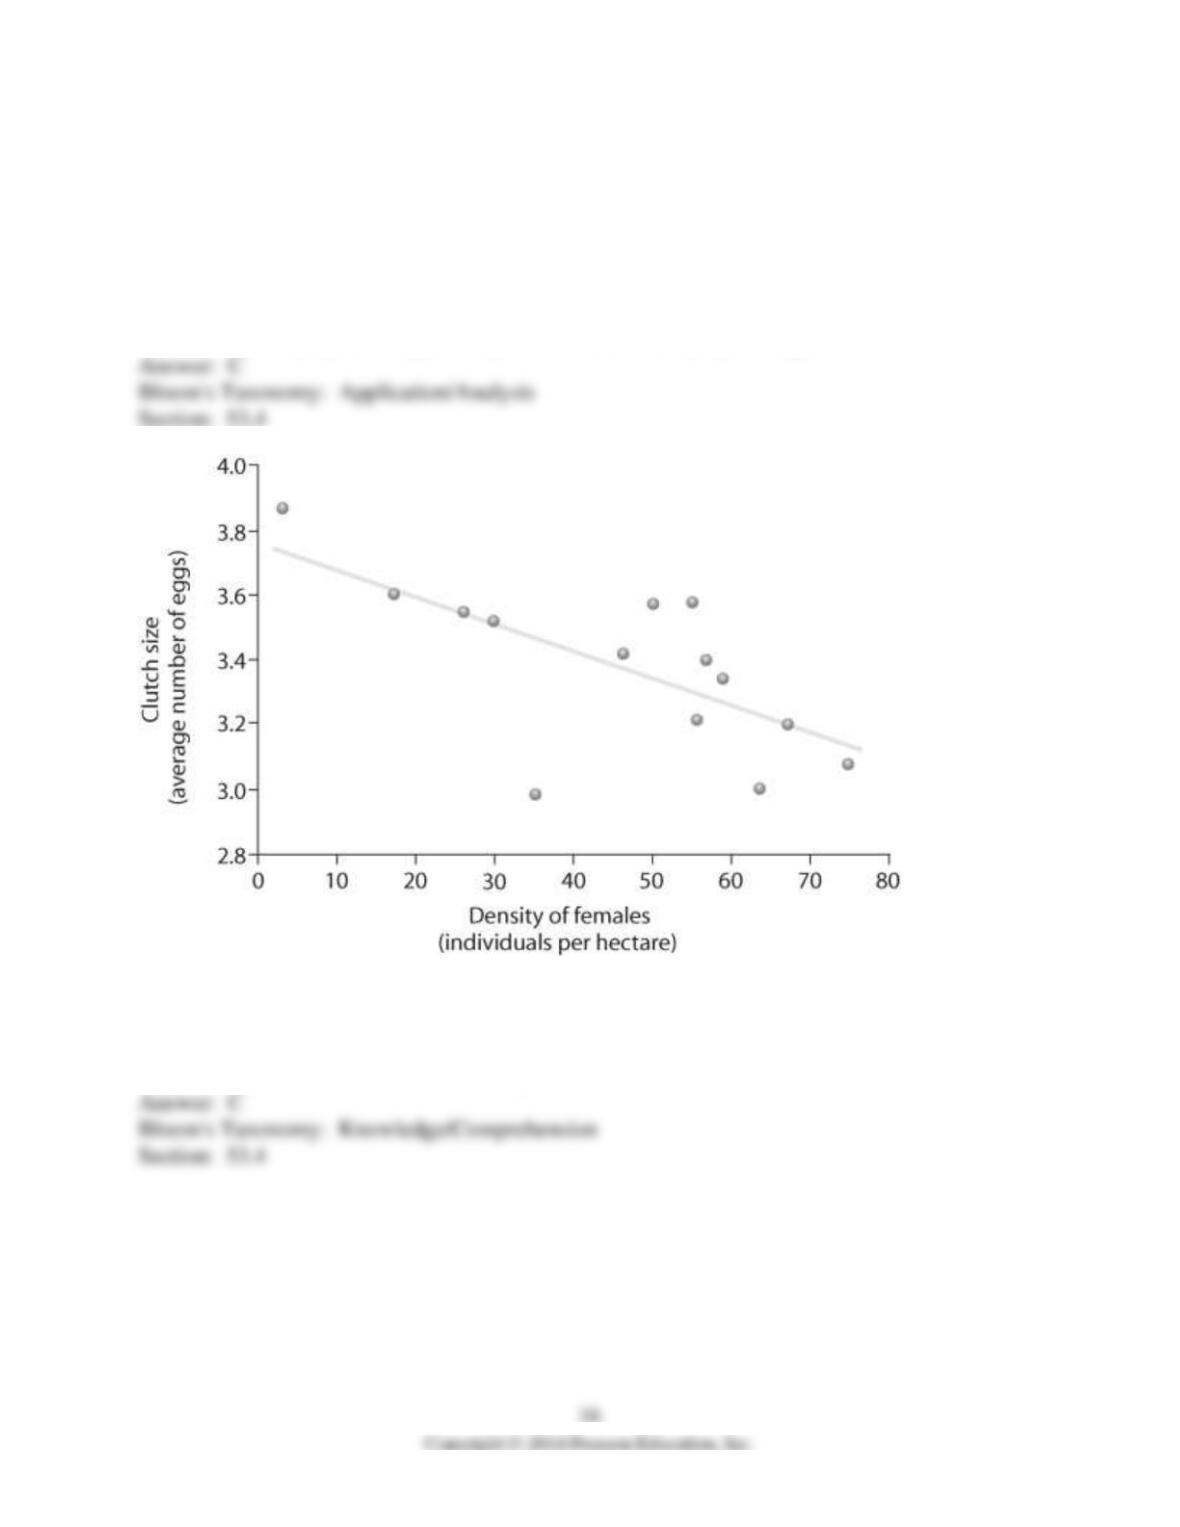
40) Based on the figure above, which of the following statements correctly interprets the data?
A) As female density increases, clutch size increases.
B) As female density increases, survivorship decreases.
C) Clutch size decreases as female density increases.

41) Which pair of terms most accurately describes life history traits for a stable population of
wolves?
A) semelparous; r-selected
B) semelparous; K-selected
C) iteroparous; r-selected
D) iteroparous; K-selected
42) Natural selection involves energetic trade-offs between _____.
A) choosing how many offspring to produce over the course of a lifetime and how long to live
B) producing large numbers of gametes when employing internal fertilization versus fewer
numbers of gametes when employing external fertilization
C) increasing the number of individuals produced during each reproductive episode and a
corresponding decrease in parental care
D) high survival rates of offspring and the cost of parental care
43) Which of the following is characteristic of K-selected populations?
A) offspring with good chances of survival
B) many offspring per reproductive episode
C) small offspring
D) a high intrinsic rate of increase
44) In which of the following situations would you expect to find the largest number of K–
selected individuals?
A) a recently abandoned agricultural field in Ohio
B) a shifting sand dune community of south Lake Michigan
C) an old-growth forest
D) South Florida after a hurricane
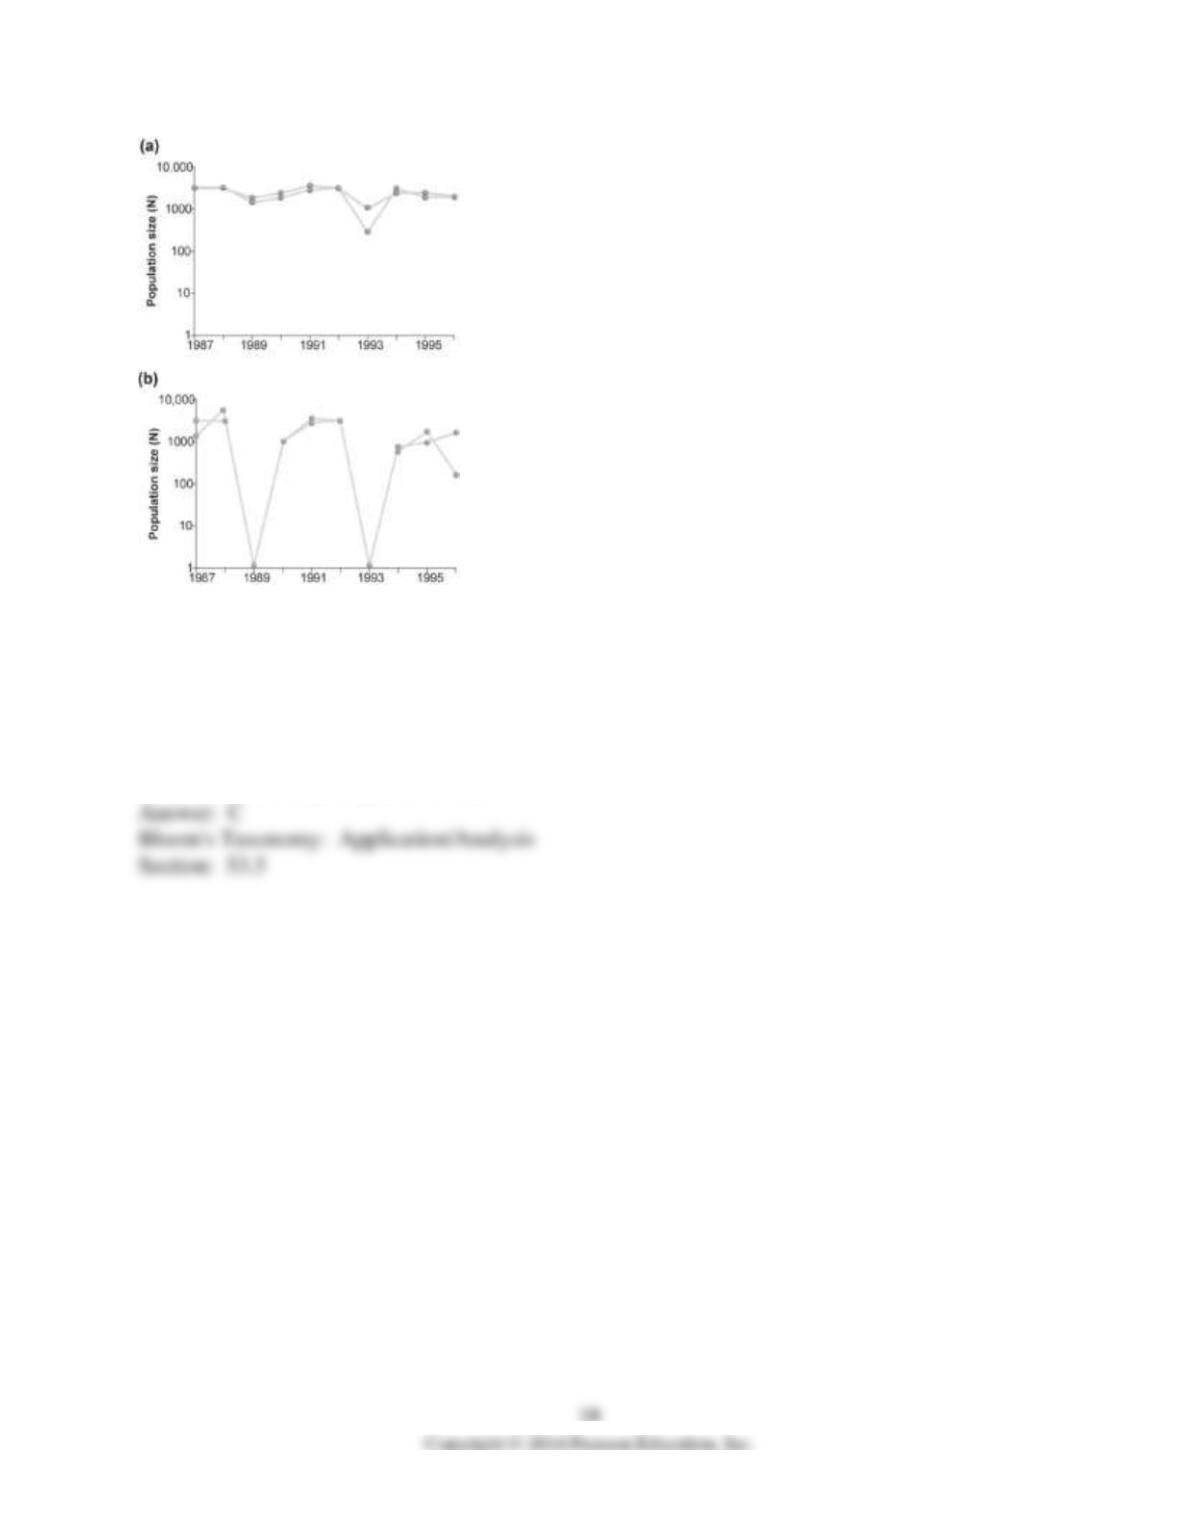
45) Graph (b) in the figure above shows the normal fluctuations of a population of grouse.
Assuming graph (a) in the figure above is the result of some experimental treatment in the grouse
population, what can be concluded?
A) The experimental treatment exacerbated the population cycling.
B) The experimental treatment did not affect population cycling in this species.
C) The experimental treatment has most likely identified the cause of population cycling.
D) None of the other responses is true.
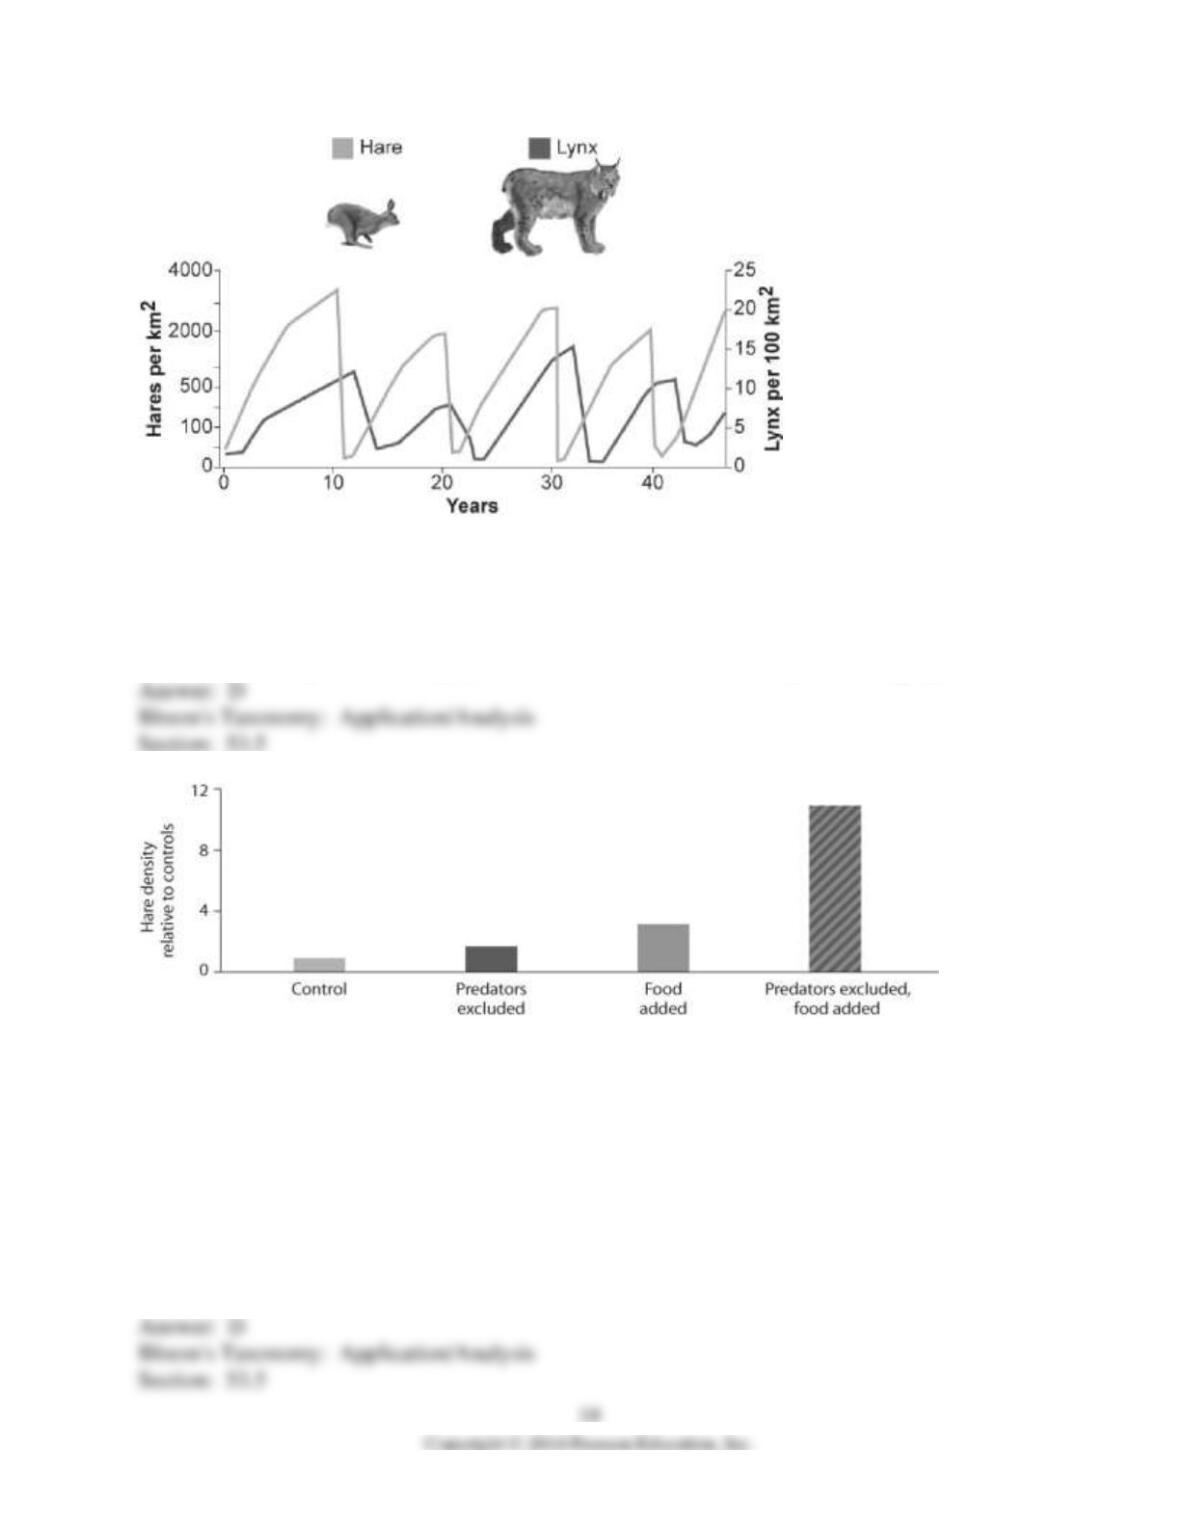
46) What conclusion can you draw from the figure above?
A) Hares control lynx population size.
B) Lynx control hare population size.
C) Lynx and hare populations are independent of each other.
D) The relationship between the populations cannot be determined only from this graph.
47) Looking at the data in the figure above from the hare/lynx experiment, what conclusion can
you draw?
I) Food is a factor in controlling hare population size.
II) Excluding lynx is a factor in controlling hare population size.
III) The effect of excluding predators and adding food in the same experiment is greater than the
sum of excluding lynx alone plus adding food alone.
A) only I
B) only II
C) only III
D) I, II, and III

48) Often the growth cycle of one population has an effect on the cycle of another. As moose
populations increase, for example, wolf populations also increase. Thus, if we are considering
the logistic equation for the wolf population,
dN/dt = rN ,
which of the factors accounts for the effect of the moose population?
A) r
B) N
C) rN
D) K
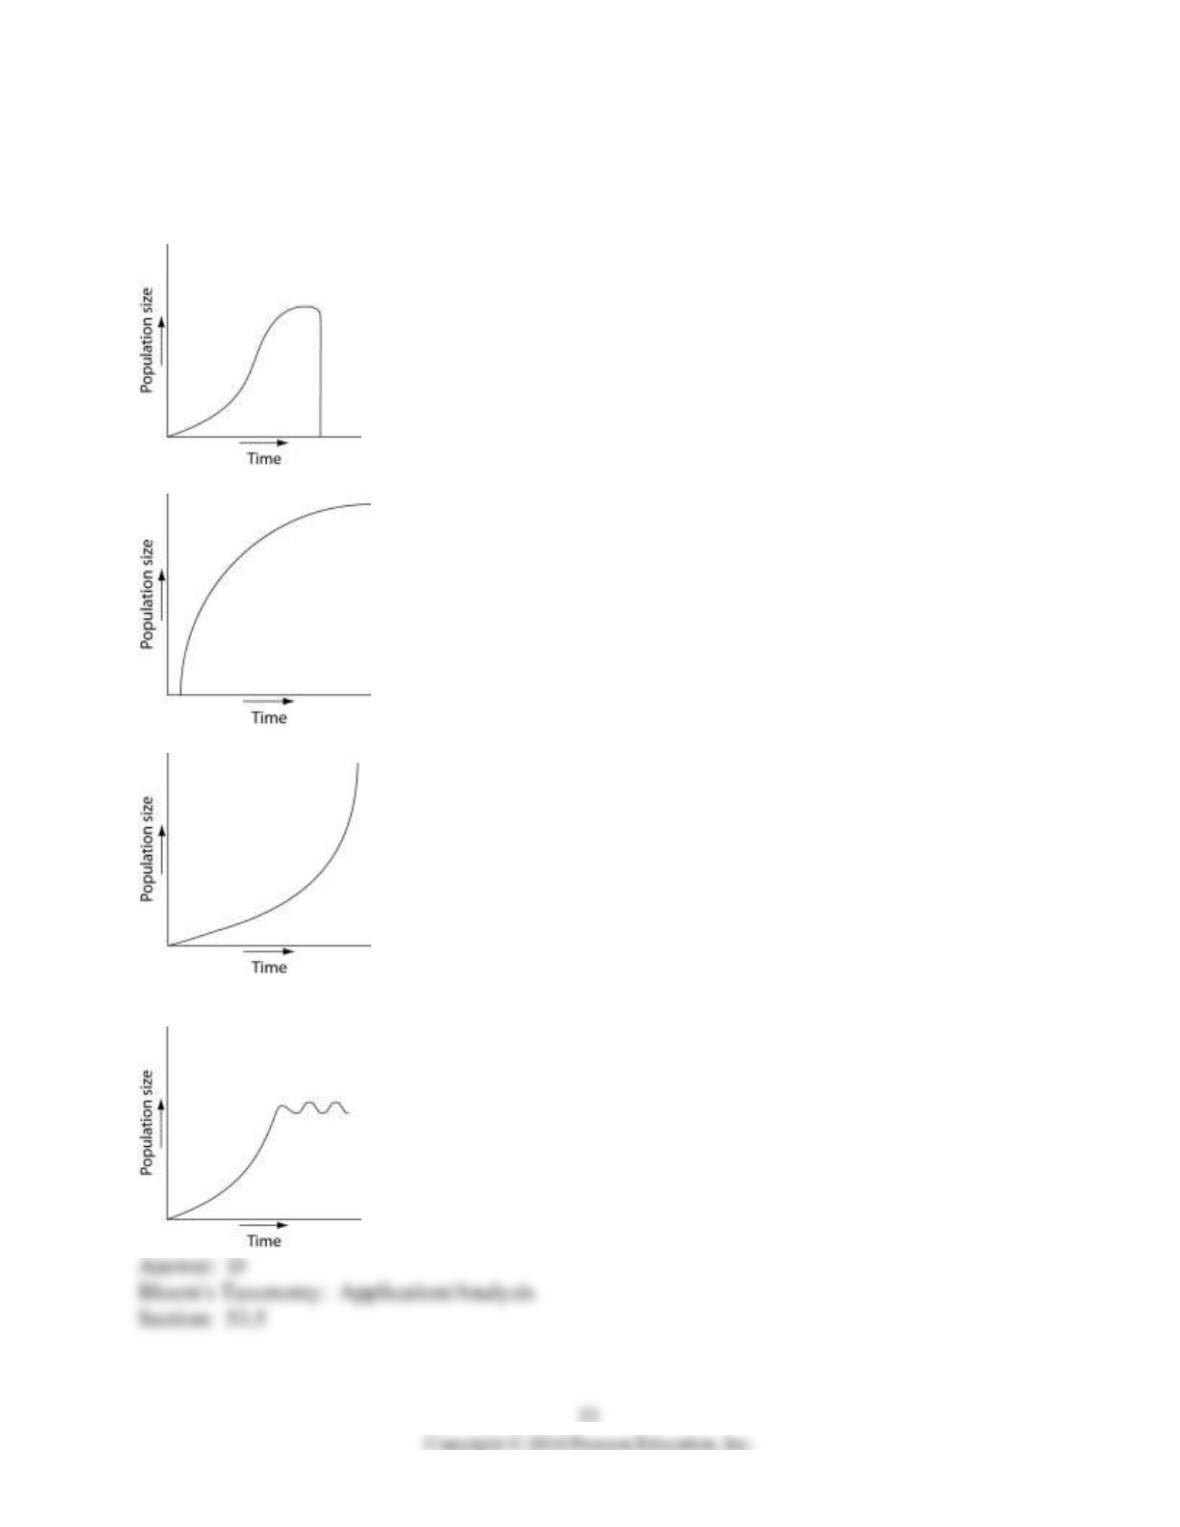
49) Which of the following graphs illustrates the growth over several seasons of a population of
snowshoe hares that were introduced to an appropriate habitat also inhabited by predators in
northern Canada?
A)
B)
C)
D)
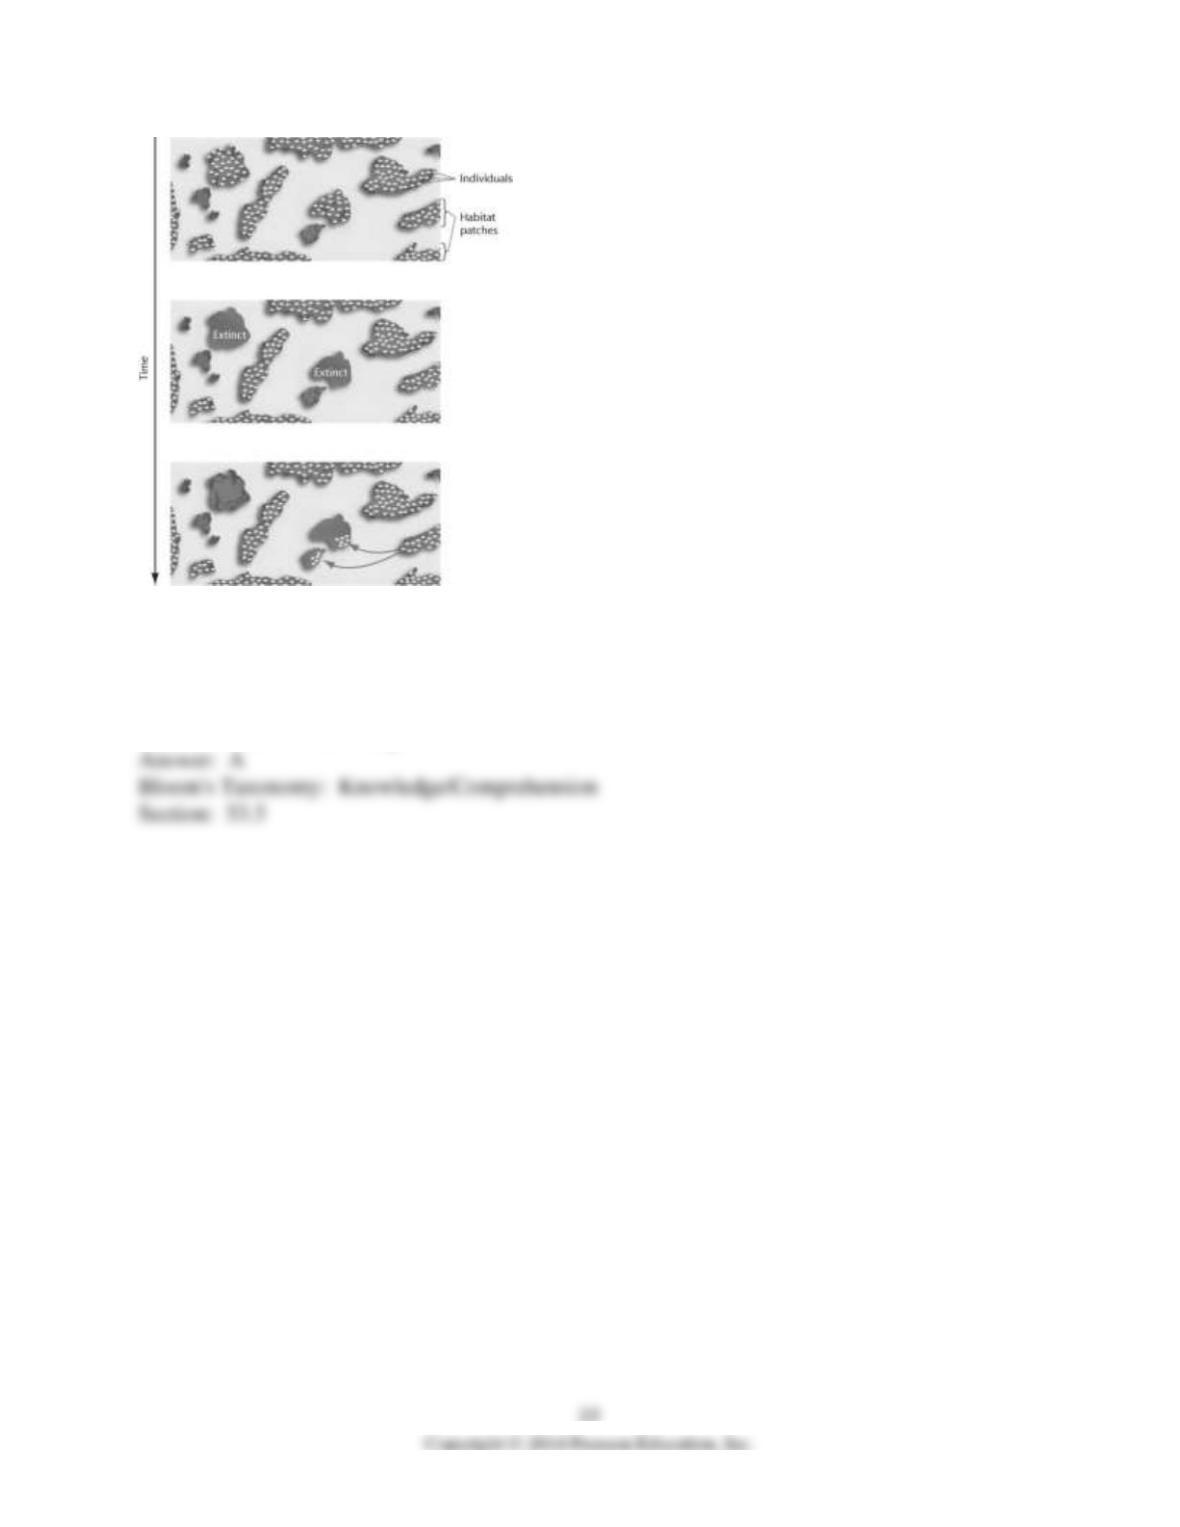
50) The figure above represents the dynamics of _____.
A) metapopulations
B) extinction
C) emigration
D) both extinction and emigration

51) Use the following abstract from Theoretical Population Biology to answer the question.
Abstract:
We derive measures for assessing the value of an individual habitat fragment for the dynamics
and persistence of a metapopulation living in a network of many fragments. We demonstrate that
the most appropriate measure of fragment value depends on the question asked. Specifically, we
analyze four alternative measures: the contribution of a fragment to the metapopulation capacity
of the network, to the equilibrium metapopulation size, to the expected time to metapopulation
extinction and the long-term contribution of a fragment to colonization events in the network.
The latter measure is comparable to density-dependent measures in general matrix population
theory, though some differences are introduced by the fact that “density dependence” is spatially
localized in the metapopulation context. We show that the value of a fragment depends not only
on the properties of the landscape but also on the properties of the species. Most importantly,
variation in fragment values between the habitat fragments is greatest in the case of rare species
that occur close to the extinction threshold, as these species are likely to be restricted to the most
favorable parts of the landscape. We expect that the measures of habitat fragment described and
analyzed here have applications in landscape ecology and in conservation biology.
Copyright © 2003 Elsevier Inc. All rights reserved. (Otso Ovaskainen and Ilkka Hanski. 2003.
How much does an individual habitat fragment contribute to metapopulation dynamics and
persistence? Theoretical Population Biology 64:481-95.)
One measure for the value of the patch was given by the long-term contribution of a fragment to
colonization events in the network. How do the properties of a landscape and the properties of a
species affect the value of a patch? The value of the fragment depends _____.
A) on the properties of the landscape and the properties of the species
B) only on the properties of the landscape and not on the properties of the species
C) not on the properties of the landscape but only on the properties of the species
D) on neither the properties of the landscape nor on the properties of the species
52) A population of white-footed mice becomes severely overpopulated in a habitat that has been
disturbed by human activity. Sometimes intrinsic factors cause the population to increase in
mortality and lower reproduction rates to occur in reaction to the stress of overpopulation. Which
of the following is an example of intrinsic population control?
A) Owl populations frequent the area more often because of increased hunting success.
B) Females undergo hormonal changes that delay sexual maturation, and many individuals suffer
depressed immune systems and die due to the stress of overpopulation.
C) Clumped dispersion of the population leads to increased spread of disease and parasites,
resulting in a population crash.
D) All of the resources (food and shelter) are used up by overpopulation, and much of the
population dies of exposure and/or starvation.
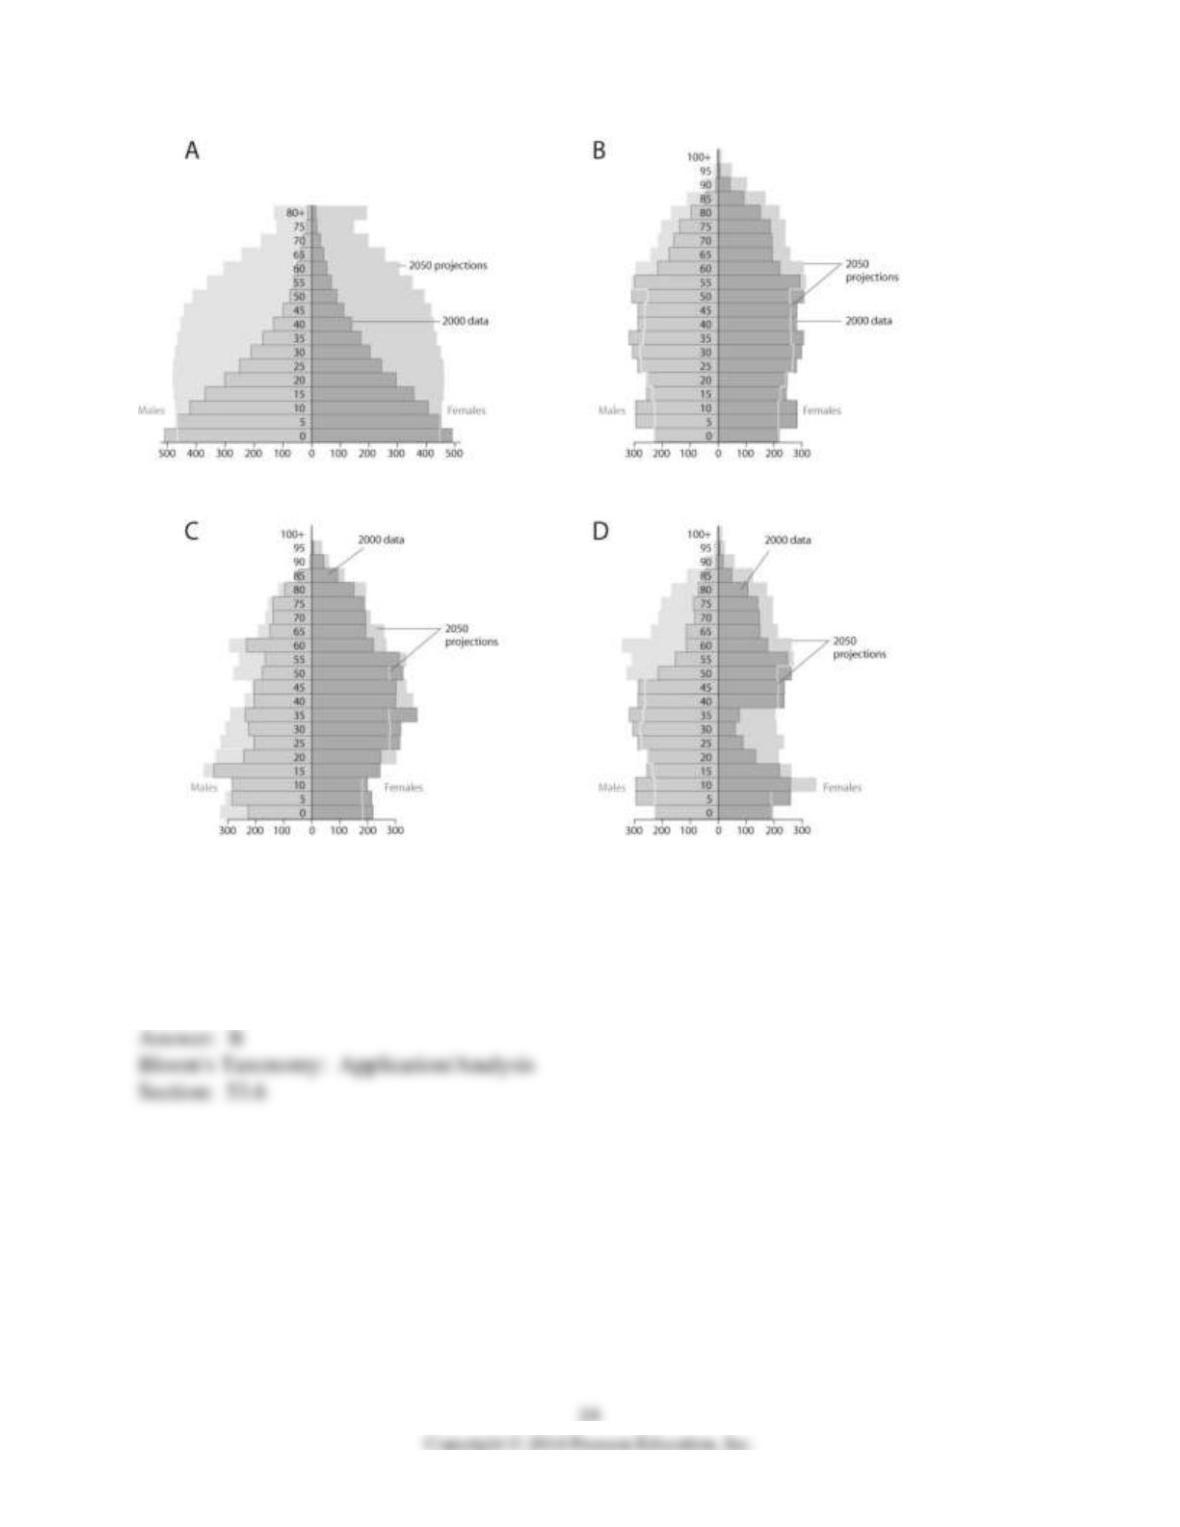
53) Based on the diagrams in the figure above and on the large population of baby boomers in
the United States, which graph best reflects U.S. population in twenty years?
A) A
B) B
C) C
D) D

54) Which of the following statements regarding the future of populations in developing
countries are correct?
I) The fecundity is predicted to increase.
II) Survivorship will increase.
III) Overall population size will increase dramatically.
IV) The number of offspring each year is predicted to remain high.
A) only I and III
B) only II and IV
C) only II, III, and IV
D) only I, II, and III
55) Why does the 2009 U.S. population continue to grow even though the United States has
essentially established a zero population growth (ZPG)?
A) emigration
B) immigration
C) baby boomer reproduction
D) the 2007-2009 economic recession

Infant mortality and life expectancy at birth in developed
and developing countries (data as of 2005).
56) What is a logical conclusion that can be drawn from the graphs above? Developed countries
have _____.
A) lower infant mortality rates and lower life expectancy than developing countries
B) higher infant mortality rates and lower life expectancy than developing countries
C) lower infant mortality rates and higher life expectancy than developing countries
D) higher infant mortality rates and higher life expectancy than developing countries
57) A recent study of ecological footprints concluded that _____.
A) Earth’s carrying capacity would increase if per capita meat consumption increased
B) current demand by industrialized countries for resources is much smaller than the ecological
footprint of those countries
C) it is not possible for technological improvements to increase Earth’s carrying capacity for
humans
D) the ecological footprint of the United States is large because per capita resource use is high

58) Which of the following statements about human population in industrialized countries are
correct?
I) Life history is r-selected.
II) The population has undergone the demographic transition.
III) The survivorship curve is Type III.
IV) Age distribution is relatively uniform.
A) only I and III
B) only II and IV
C) only I, II, and IV
D) only II, III, and IV
59) Which population(s) appear(s) to be stable?
A) I
B) III
C) I and II
D) II and III
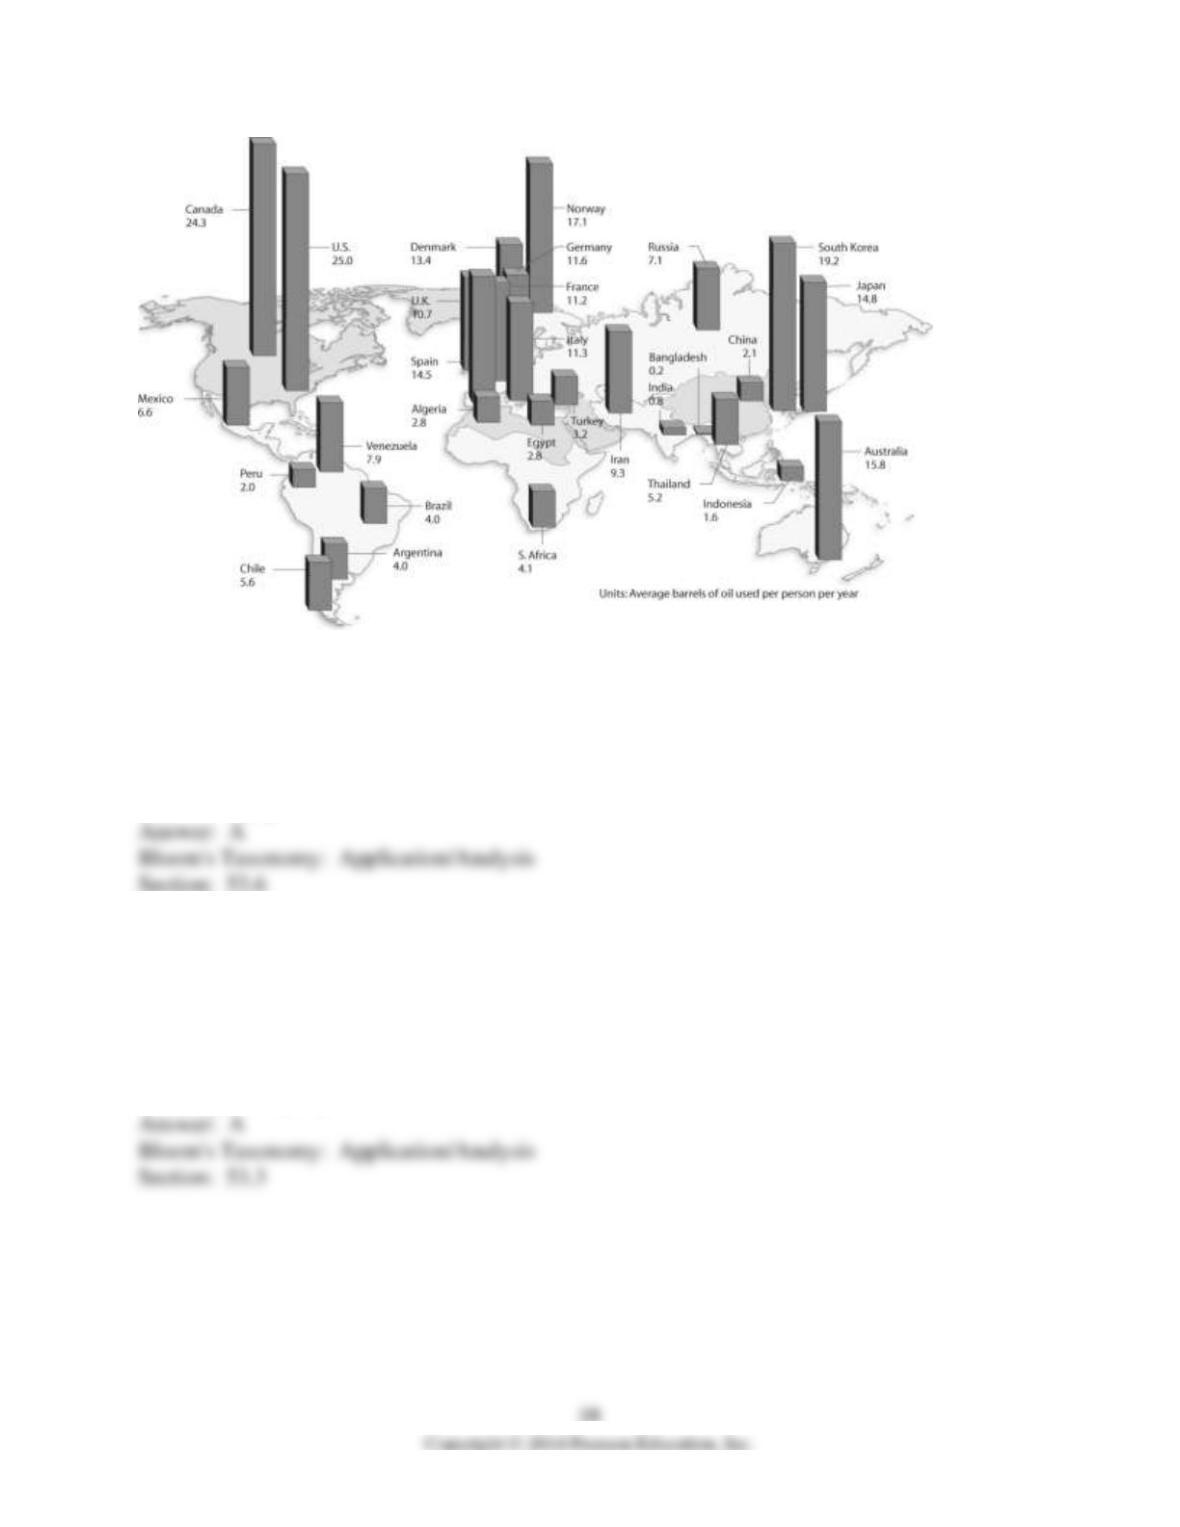
60) Based on the figure above and given the populations of the following countries, which
country uses the most oil overall?
A) United States (population = 320 million)
B) Canada (population = 36 million)
C) China (population = 1.33 billion)
D) Russia (population = 144 million)
61) A population of squirrels on an island has a carrying capacity of 350 individuals. If the
maximum rate of increase is 1.0 per individual per year and the population size is 275, determine
the population growth rate (Round to the nearest whole number).
A) 59 squirrels per year
B) -34 squirrels per year
C) 75 squirrels per year
D) 15 squirrels per year