CHAPTER 4
DNA, Chromosomes, and Genomes
Questions
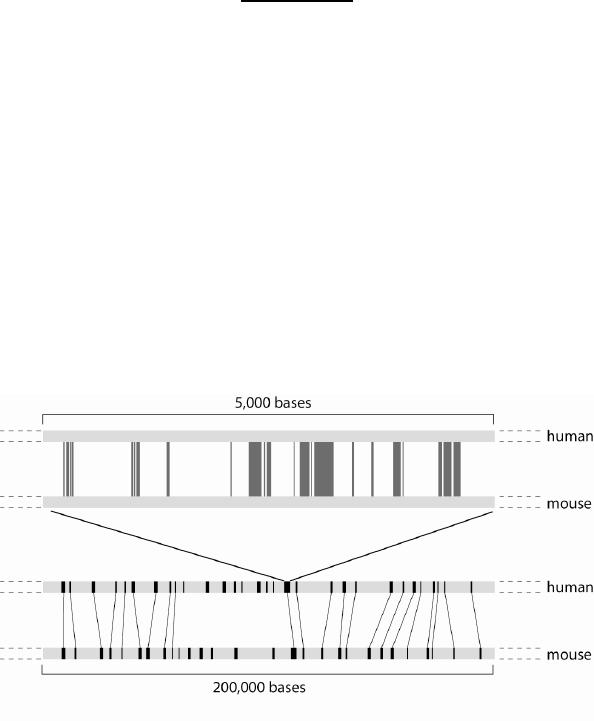
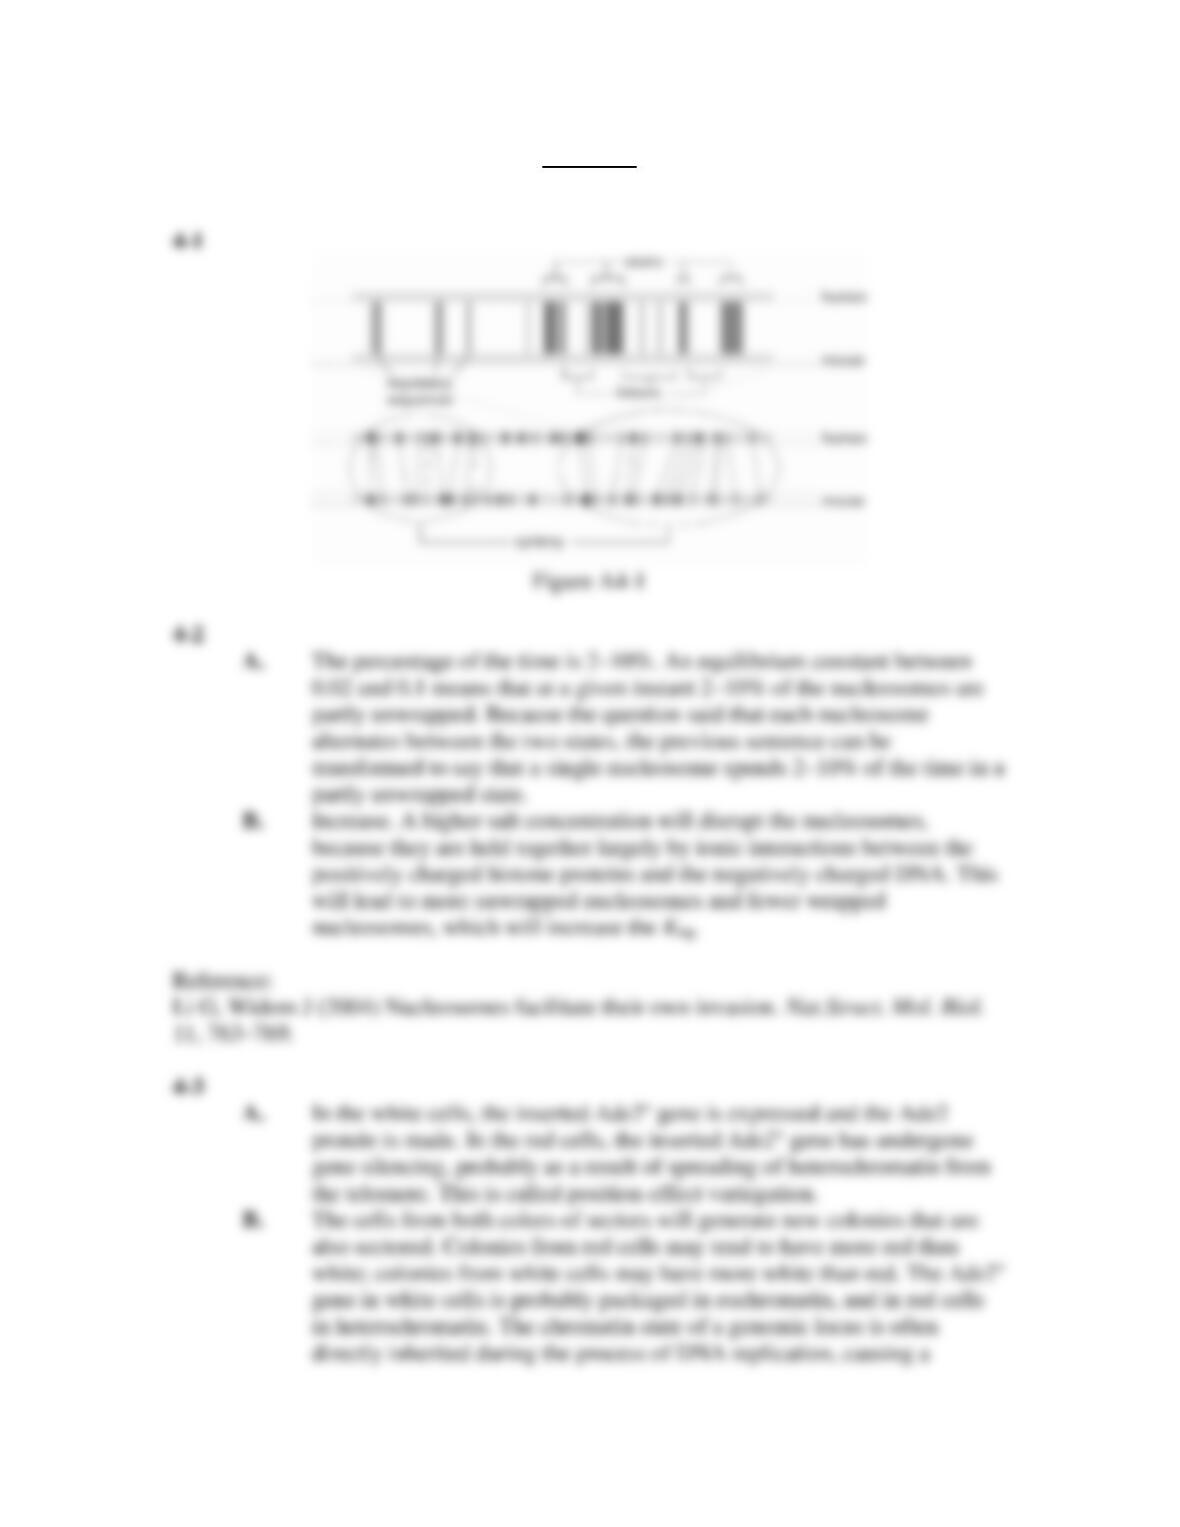
4-1 Figure Q4-1 shows a hypothetical alignment of nucleotide sequences from two
organisms. The bottom panel shows an alignment of large chromosomal regions,
with black blocks representing DNA stretches of at least 500 nucleotides for
which there is a corresponding sequence somewhere in the other organism’s
genome. Gray lines connect the pairs of corresponding sequences found in this
alignment region. The top panel shows a magnified view of one region,
approximately the length of an average gene. Here, each vertical gray line
represents a stretch of six nucleotides in which five of the six are identical
between the two species. Annotate the top panel of the figure to indicate likely
locations of exons, introns, and regulatory sequences; annotate the bottom panel
to show regions of synteny.
Figure Q4-1
4-2 The dynamics of nucleosomes can be studied in a test tube by mixing histone
proteins with short pieces of DNA to form a single nucleosome on each DNA
molecule. When a dye molecule is covalently linked to one end of the DNA and a
complementary dye molecule is linked to a histone protein, the proximity of the
two dyes can be measured. Such measurements, combined with other
experiments, suggested that nucleosomes alternated between two states, one fully
wrapped (W) and the second partly unwrapped (U). The equilibrium constant
between these two states, Keq = [U]/[W], depends on the concentration of salt in
the test tube. At the salt concentration found in cells, the Keq was between 0.02
and 0.1.
A. About what percentage of the time is a given nucleosome partly
unwrapped at this salt concentration? Explain.
B. Will increasing the salt concentration increase or decrease the Keq?
Explain.
4-3 When placed on an agar slab and incubated at 30°C for 2 days, a single yeast cell
proliferates into a colony with a diameter of 2 mm containing 108 yeast cells. If
the cell has a functional Ade2 gene (Ade2+), the colony will be white; if Ade2 is
non-functional (Ade2–), the colony will be red. You take a strain with a mutant
Ade2– at the regular chromosomal position fired colonies) and insert a second,
functional Ade2+ gene near the telomere. You find that the colonies are a mixture
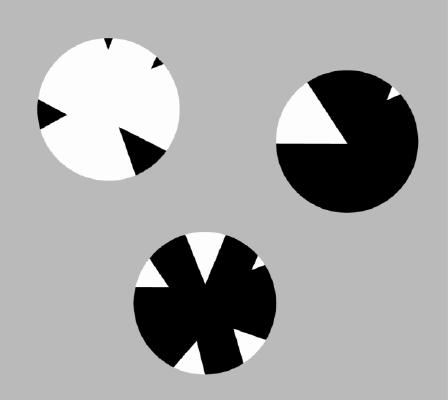
of red and white patches or sectors. Figure Q4-3 shows some colonies; the black
regions represent the red sectors.
A. Explain what happened to the Ade2+ gene near the telomere in the red
cells and in the white cells. What is the term for this phenomenon?
B. You take single cells from the white sectors and allow them to form new
colonies. You do the same with cells from the red sectors. Predict the
color of the colonies. Explain.
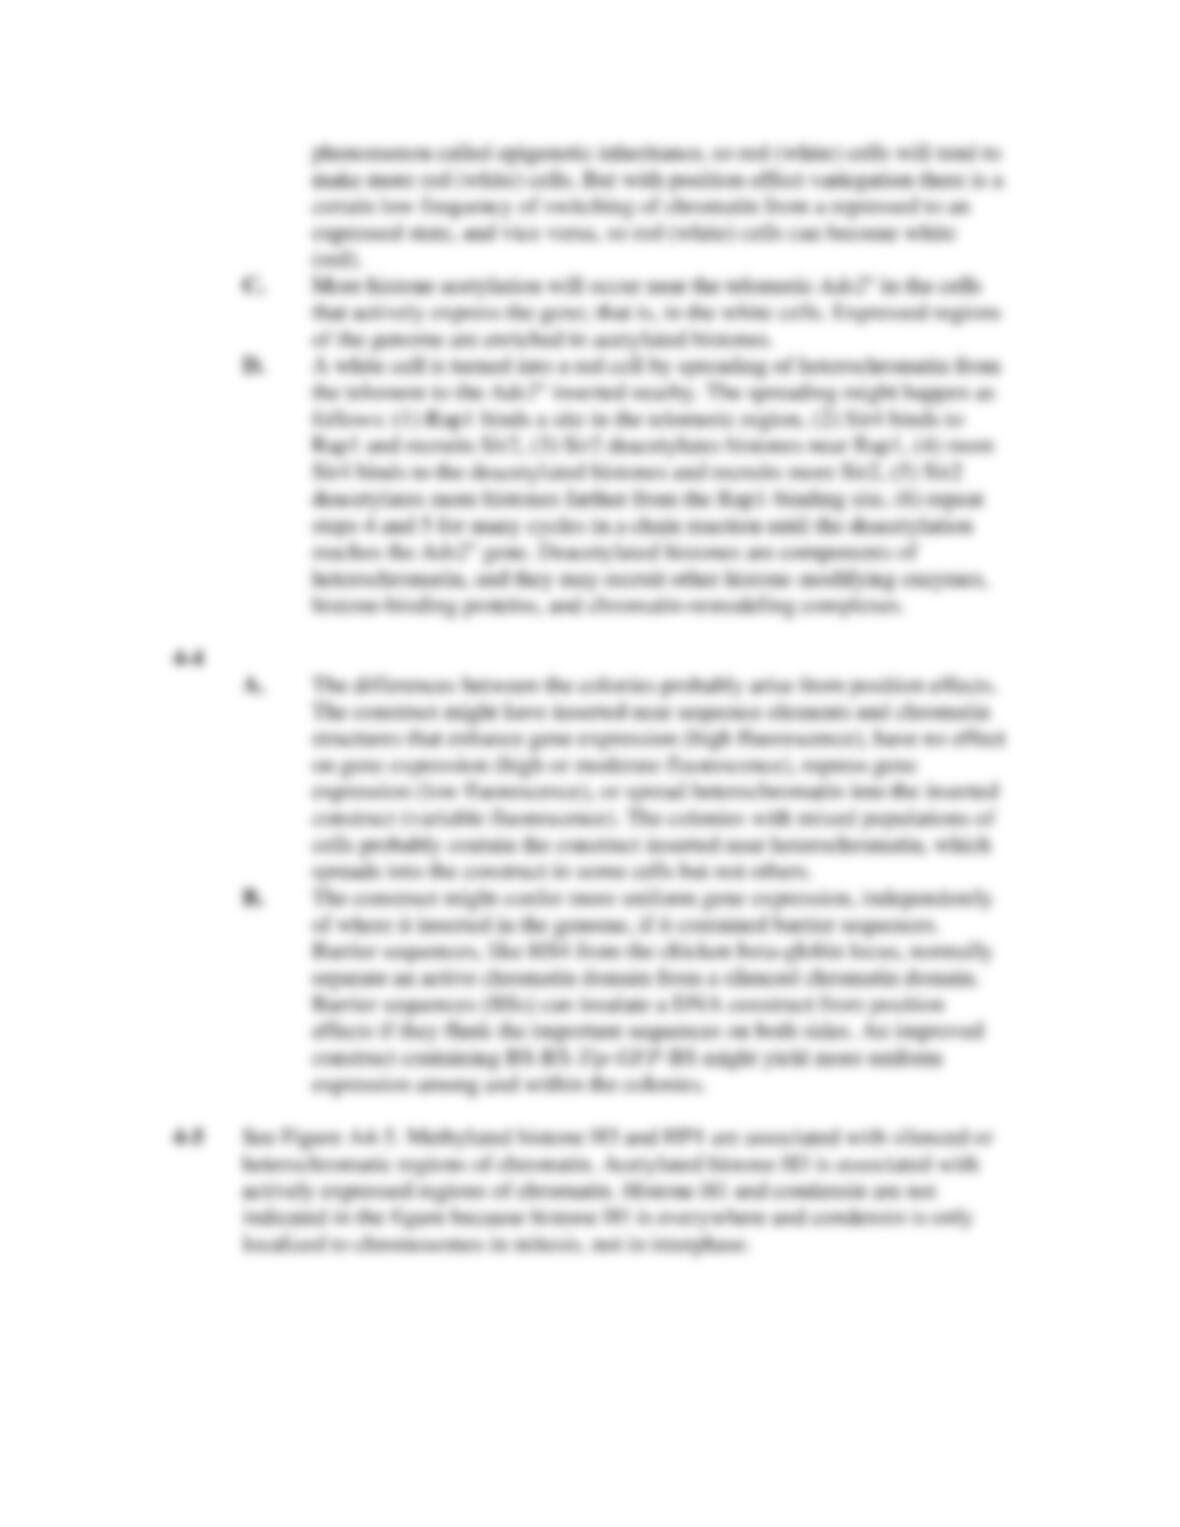
C. You measure acetylation of the N-termini of histones H3 and H4 that are
located near the telomeric Ade2+. Do you expect more or less acetylation
in the red cells than in the white cells?
D. You look for mutants that give only white colonies. You find mutations in
three genes: Rap1, which encodes a protein that binds specific short DNA
sequences near the telomere; Sir2, which encodes a histone deacetlyase;
and Sir4, which encodes a protein that binds Rap1, Sir2, and deacetylated
N-termini of histones H3 and H4. Propose a series of events in which
these proteins act together to turn a white cell into a red cell.
Figure Q4-3
4-4 You want to examine where within the cell a protein called Tip resides. To do
this, you make a DNA construct containing regulatory sequences (RS) that control
gene expression, the protein-coding region of the Tip gene, and a sequence that
codes for green fluorescent protein (GFP). The expressed fusion protein includes
the Tip protein covalently linked at one end to Gfp, and therefore you can
visualize the subcellular location of Tip by viewing green fluorescence with a
microscope. You transfect mouse cells with the RS-Tip–GFP construct and find
cells in which the constructs have been inserted in the genome at random. You
look at 10 colonies, each arising from an independent insertion, and find that
some colonies contain cells that all have high levels of fluorescence, whereas
other colonies have only cells with moderate or low levels. Two colonies even
have a mixture of cells, some with high levels of fluorescence and others with low
levels.
A. Explain the observed differences between colonies and for each observed
colony behavior.
B. Propose an improved version of your RS-Tip–GFP construct that might
make the colonies more uniform. List the order of sequences in the
improved construct.
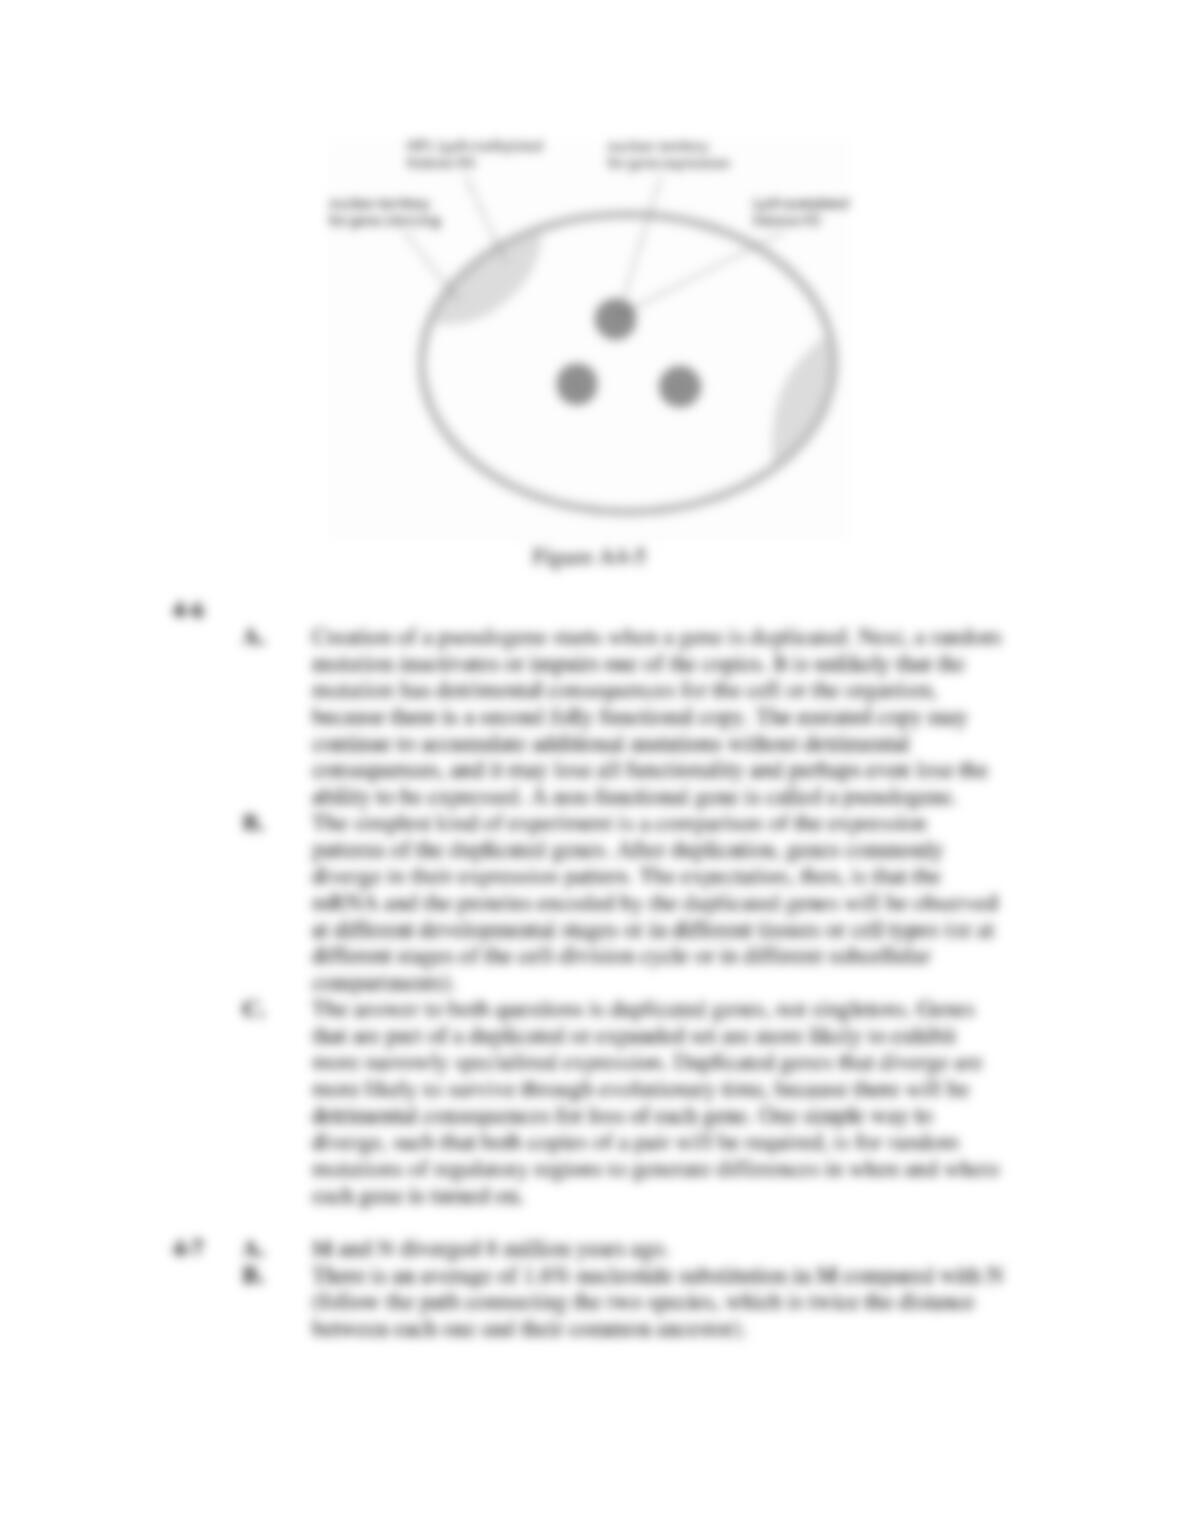
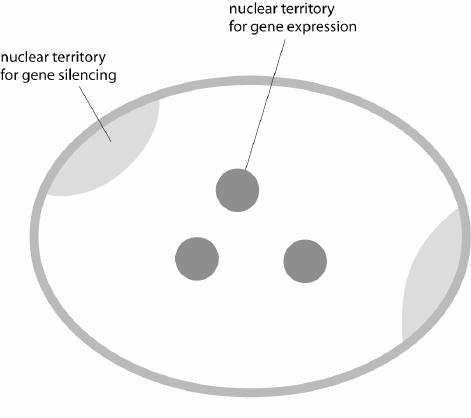
4-5 You want to investigate the substructure of an intact interphase nucleus. To do
this, you fix cells and isolate their nuclei. You add fluorescent antibodies that bind
specifically to particular proteins, and then observe fluorescence with a
microscope. A nucleus is represented in Figure Q4-5. Which of the proteins listed
below do you expect to be concentrated in a subnuclear region? Indicate on the
figure where you expect those proteins to localize. Proteins: HP1, histone H3
acetylated on lysine 9, histone H3 methylated on lysine 9, histone H1, and
condensin.
Figure Q4-5
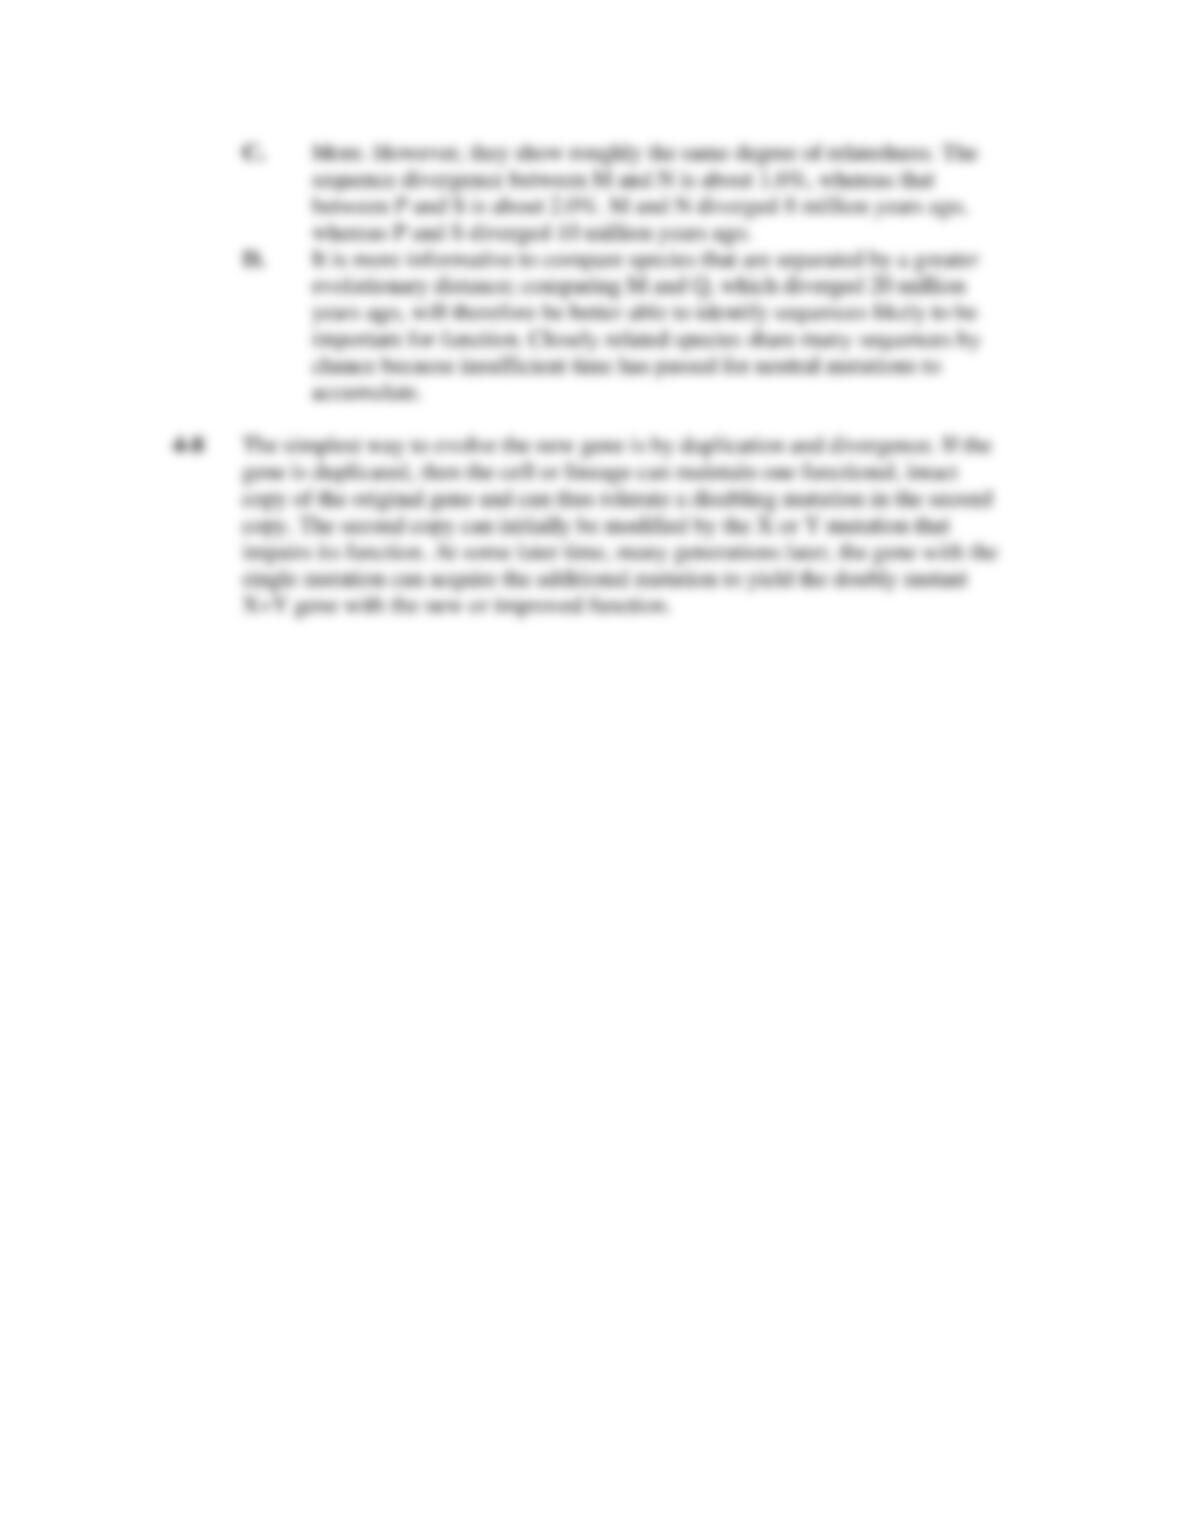
4-6 Gene duplication is widely believed to be a major mechanism for generating
genetic novelty and increased biological complexity.
A. How does a pseudogene arise?
B. Identify the simplest kind of experiment to begin characterizing the
divergence of a pair of functional genes that arose from an ancient
duplication event, and describe what results are expected.
C. Because of the availability of whole-genome DNA sequences and whole-
genome gene expression measurements, researchers classify each gene as
a member of a duplicated set or a singleton and then evaluate whether
there is a difference between expression patterns of the two classes. Which
class contains a larger proportion of genes whose expression differs
between strains of an organism? Which class contains a larger proportion
of genes whose expression differs between different stages in
embryogenesis? Explain.
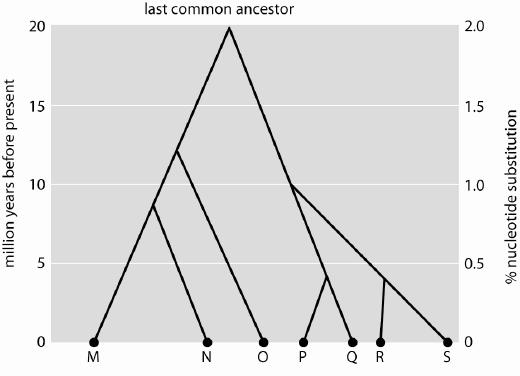
4-7 A hypothetical phylogenetic tree is shown in Figure Q4-7. Use this tree to answer
the following questions.
A. How many years ago did species M and N diverge from their last common
ancestor?
B. How much nucleotide divergence is there on average between M and N?
C. Are M and N more or less closely related to each other than P and S?
D. In looking for functionally important nucleotide sequences, is it more
informative to compare the genome sequences of M and N or those of M
and Q? Explain.
Figure Q4-7
4-8 Consider a gene with a particular function. Mutation X and mutation Y separately
cause defects in the function of the encoded protein. Yet a gene containing both
mutations X and Y encodes a protein that works even better than the original
protein. The odds that a single mutational event will generate both mutations X
and Y are exceedingly small. Explain a simple way in which an organism with a
mutant gene containing both mutations X and Y could arise during evolution.
Answers