
1
Campbell Essential Biology, 6e (Simon/Dickey/Hogan/Reece)
Chapter 19 Population Ecology
Chapter 19 Learning Outcomes
19 Biology and Society: Invasion of the Lionfish
19.1 Explain why people should not introduce pets into the wild, using the introduced lionfish
in the Atlantic region as an example.
19.1 An Overview of Population Ecology
19.2 Relate a population to population ecology and population density.
19.3 Compare Type I, Type II, and Type III survivorship curves.
19.4 Compare the characteristics of species that show opportunistic or equilibrial life histories.
19.2 Population Growth Models
19.5 Compare the exponential growth model to the logistic growth model and the effects of
density-dependent and density-independent factors on various population cycles.
19.3 Applications of Population Ecology
19.6 Compare the benefits and risks of population ecology strategies used to help reach human
resource management goals including species protection, maximizing harvests, and
control of biological pests.
19.7 Describe the goals of integrated pest management and its advantages over the widespread
use of pesticides.
19.4 Human Population Growth
19.8 Describe the growth of the human population over the last 2,000 years.
19.9 Explain how age structure diagrams can help to predict changes in a population and in
social conditions.
19.10 Compare ecological footprints for an individual versus nations and for countries versus
the world’s average footprint and Earth’s biocapacity.
19 Evolution Connection: Humans as an Invasive Species
19.11 Explain how and why the North American population of mammals has changed in the
last 10,000 years.
Global Learning Outcomes
1. Demonstrate an understanding of the principles of scientific inquiry.
2. Demonstrate the ability to think critically and employ critical-thinking skills.
3. Read and interpret models, graphs, and data.
4. Demonstrate the quantitative skills needed to succeed in biology.
5. Demonstrate an understanding of the impact of science on society.
6. Evaluate the credibility of scientific information from various sources.
7. Demonstrate the ability to make connections between concepts across biology.
8. Communicate effectively in writing.
9. Apply the scientific method to interpret information and draw conclusions.
19.1 Multiple Choice Questions
1) Chinese privet is a plant that is native to China. Over 150 years ago, Chinese privet was
introduced to the United States as a fast-growing shrub that serves as an excellent privacy hedge.
With no natural predators, Chinese privet quickly established itself and spread in natural areas
throughout the southeast and eastern seaboard of the United States. Its dominance in these areas
has jeopardized the survival of native plant species. Chinese privet provides evidence that
________.
A) introducing non-native organisms can cause environmental damage
B) American gardeners can easily control the spread of Chinese privet
C) integrated pest management strategies will not decrease Chinese privet populations
D) non-native plant species have Type I survivorship curves
2) What is a population?
A) a group of organisms that occupy the same general area at different times
B) a group of individuals of a single species that occupy the same general area at the same time
C) the growth rate of individuals of a single species that occupy the same general area at the
same time
D) the growth rate of individuals of a single species that occupy the same general area at
different times
3) Which of these is a characteristic of Type I survivorship?
A) There is low survivorship for the very young.
B) Most individuals survive to older age intervals.
C) Survivorship is constant over the lifespan.
D) Survivorship is high for the few individuals that survive to a certain age.
4) Type I survivorship curves are typical of species that exhibit ________.
A) an intermediate number of offspring and an intermediate level of parental care
B) few offspring and good parental care
C) many offspring and good parental care
D) many offspring and poor parental care
5) Which of these best describes Type II survivorship?
A) There is high survivorship for the very young.
B) Most individuals survive to older age intervals.
C) Survivorship is constant over the lifespan.
D) Survivorship is high for the few individuals that survive to a certain age.
6) Which of these best describes Type III survivorship?
A) There is high survivorship for the very young.
B) Most individuals survive to older age intervals.
C) Survivorship is constant over the lifespan.
D) Survivorship is high for the few individuals that survive to a certain age.
7) Opportunistic species typically ________.
A) are very long-living
B) have a large number of offspring
C) reach sexual maturity slowly
D) exhibit a Type I survivorship curve
8) Species that exhibit an equilibrial life history typically ________.
A) have long lives
B) exhibit a Type III survivorship curve
C) exhibit a Type II survivorship curve
D) have a large number of offspring
9) If there are 500 oak trees in a forest covering 50 square kilometers, then the population density
is ________.
A) 5 trees per square kilometer
B) 10 trees per square kilometer
C) 50 trees per square kilometer
D) 100 trees per square kilometer
10) In an ideal, unlimited environment, a population’s growth follows a(n) ________ model.
A) exponential
B) density-dependent
C) logistic
D) boom-and-bust
11) In an ideal, unlimited environment, what shape does a population’s growth curve most
closely resemble?
A) S
B) J
C) ∧
D) ∪
12) If a population’s growth rate decreases as the population size approaches carrying capacity,
the population’s growth follows a(n) ________ model.
A) exponential
B) boom-and-bust
C) logistic
D) density-independent
13) In a population that is following a logistic growth pattern, what shape does the population’s
growth curve most closely resemble?
A) S
B) J
C) ∧
D) ∪
14) ________ is the maximum population size that a particular habitat can support.
A) Population cycle
B) Carrying capacity
C) Life history pattern
D) Survivorship curve
15) According to the logistic growth model, what happens to a population when the size of the
population reaches carrying capacity?
A) The growth rate increases.
B) The growth rate decreases.
C) The growth rate cannot be determined.
D) The growth rate is zero.
16) Competition among individuals of the same species is ________ competition.
A) density-independent
B) intraspecific
C) Type II
D) Type III
17) Which of these factors operates on populations in a density-dependent manner?
A) blizzard
B) volcanic eruption
C) food supply
D) flood
18) Over time, the populations of most species ________.
A) fluctuate
B) increase rapidly, crash, and never recover
C) continuously increase
D) exhibit boom-and-bust cycles
19) An unexpected freeze that kills a population of chipmunks is an example of ________.
A) a density-independent factor
B) a biological control
C) a density-dependent factor
D) a population momentum
20) The Endangered Species Act aims to help protect species that ________.
A) are in danger of extinction
B) dominate suitable habitats
C) compete with invasive species
D) are economically valuable
21) The red-cockaded woodpecker, an endangered species, is dependent upon ________ for
maintenance of its source habitat.
A) thick vegetation at least 15 feet in height
B) fire
C) floods
D) corn snakes
22) You arrive back in the United States after having visited a foreign country located on another
continent. The customs agent stops the person in front of you and confiscates the fruit basket this
person is bringing home. Being the knowledgeable person you are, you calmly explain to your
enraged fellow traveler that the reason for the detainment is that the fruit basket may be
________.
A) carrying endangered fruit
B) carrying a non-native species that could damage North American ecosystems
C) contaminated with CFCs that will damage the ozone layer above North America
D) contaminated with sufficient DDT to cause serious harm to anyone who eats the fruit
23) Non-native species can have important effects on biological communities by ________.
A) preying upon native species only
B) competing with native species for resources only
C) reducing biodiversity only
D) All of these are effects that non-native species can have on biological communities.
24) Examples of invasive species include ________.
A) kudzu and red-cockaded woodpeckers
B) cod and Chilean sea bass
C) snowshoe hares and kudzu
D) cheatgrass and Burmese pythons
25) The intentional release of a natural enemy to attack a pest population is called ________.
A) biological control
B) coevolution
C) sustainable resource management
D) integrated pest management
26) The use of the Indian mongoose to control rat populations ________.
A) shows the effectiveness of biological control
B) shows why integrated pest management usually fails
C) became a disaster when the mongoose turned out to be as invasive as its target
D) is an example of how coevolution makes biological control difficult
27) Kudzu, an Asian vine introduced to the United States in the 1930s as a means to control
erosion, is referred to as “the plant that ate the South” because it grows so fast and overtakes
most plant species in its path. A recent and unusual way that some people are using to control
kudzu growth is to allow goats to graze their land and eat the kudzu, roots and all. This is
considered by some to be the most environment-friendly way to eliminate this invasive vine.
How can we best describe the goats in this situation?
A) a threatened species
B) an invasive species
C) a biological control agent
D) an integrated pest management agent
28) Most crop pests ________.
A) have an opportunistic life history
B) have an equilibrial life history
C) exhibit type I survivorship
D) consist of long-lived individuals
29) Integrated pest management ________.
A) favors overwhelming a pest with chemical pesticides
B) advocates total eradication of pest species
C) aims to keep pest populations on an exponential growth curve
D) advocates mixed-species plantings and rotating crops
30) Throughout most of human history, human population size ________.
A) was at carrying capacity
B) grew very slowly
C) showed boom-and-bust cycles
D) skyrocketed
31) In most developed countries, overall population growth rates ________.
A) are high, so the population size is growing rapidly
B) are high, so the population size is fairly stable
C) are near zero, so the population size is fairly stable
D) are low, so the population size is declining
32) In most developing countries, ________.
A) birth rates equal death rates, so the population is fairly stable
B) birth rates are lower than death rates, so the population is declining
C) birth rates are lower than death rates, so the population is growing rapidly
D) birth rates are much higher than death rates, so the population is growing rapidly
33) What will be the approximate shape of the age-structure diagram of a rapidly increasing
population?
A) a rectangle
B) a pyramid
C) an inverted pyramid
D) an hourglass
34) A study of the human ecological footprint conducted by the World Wildlife Fund in 2008
shows that ________.
A) we have already exceeded the planet’s biocapacity per person
B) we are far below the planet’s biocapacity per person
C) Earth can sustain a population about double the current population
D) the human population will soon crash
35) The ecological footprint of the United States ________.
A) is about the same as the global average
B) is lower than the global average
C) shows that Americans consume a disproportionate amount of food and fuel
D) shows that its population size is increasing slowly
36) During the Pleistocene era, many large mammal species went extinct. Their permanent
disappearance occurred in a short period of time when humans were expanding across North
America. In this situation, how do many scientists view humans?
A) as a threatened species
B) as a density-independent factor
C) as an invasive species
D) as a biological control agent
19.2 Art Questions
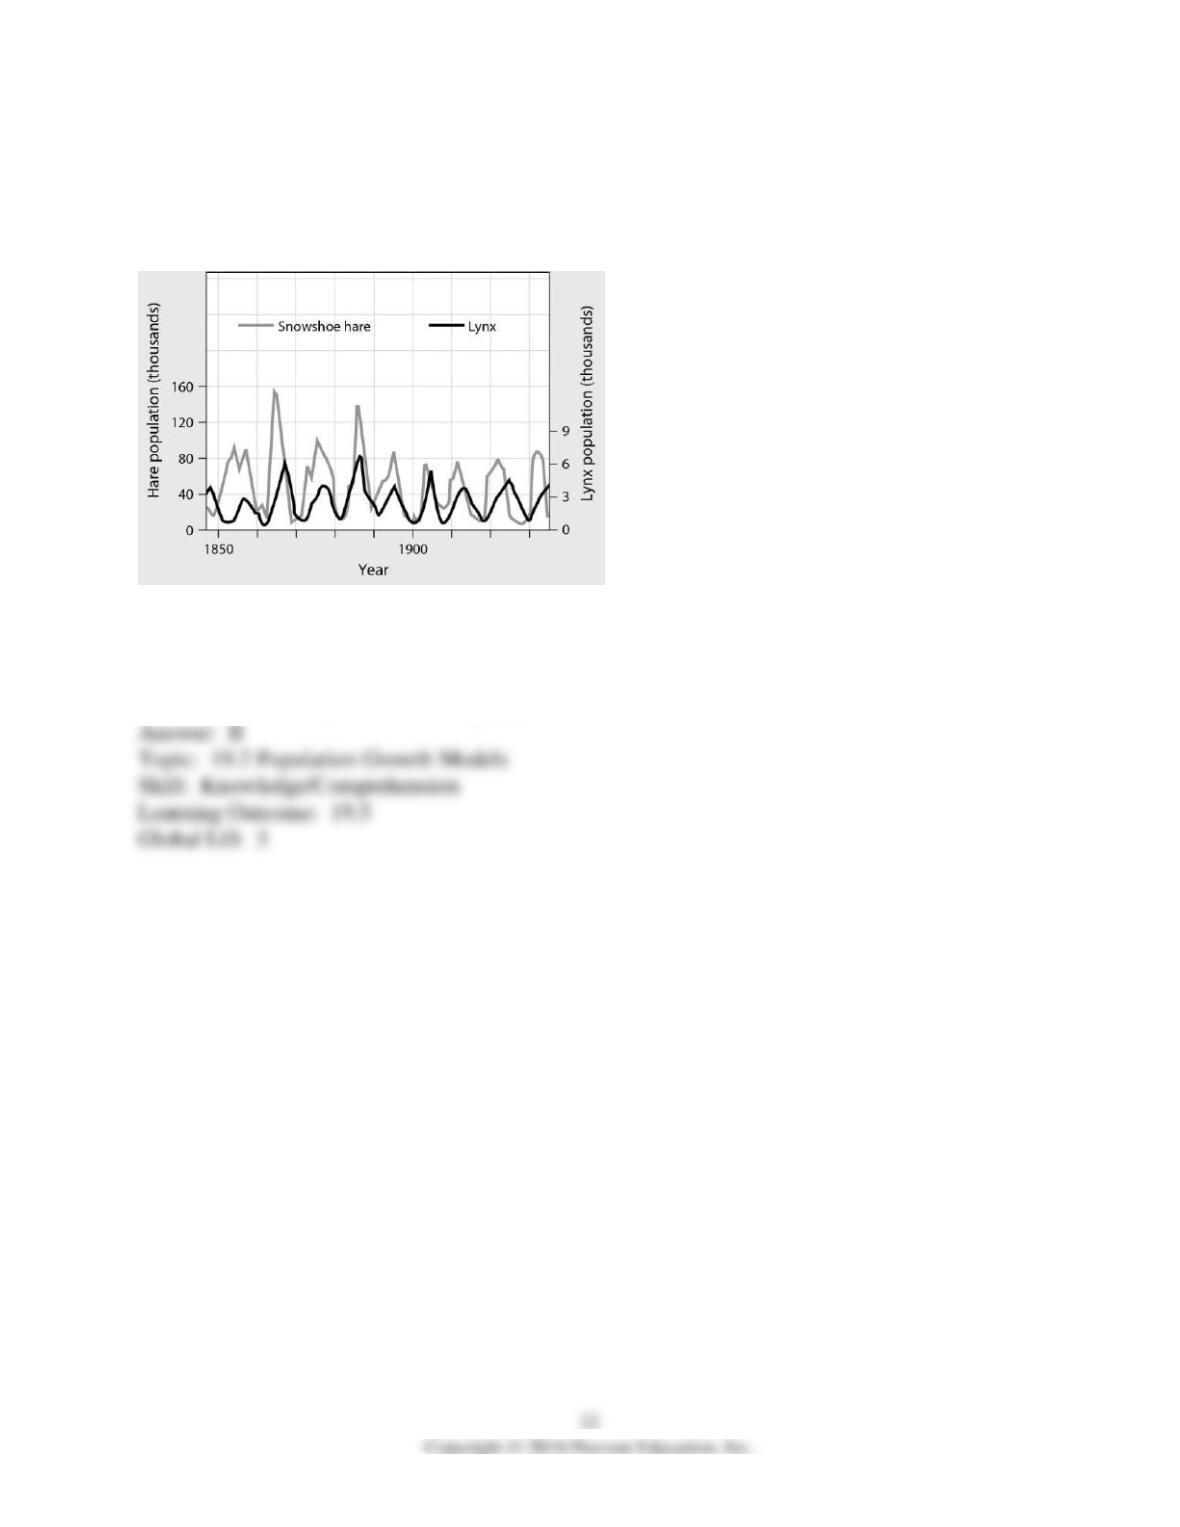
1) The figure below shows population cycles of snowshoe hare and lynx. Recent field studies
suggest that the most likely explanation for these cycles is ________.
A) periodic winter storms
B) excessive predation of snowshoe hares
C) nearly unlimited food for hares during the summers
D) boom-and-bust cycles in lemming populations
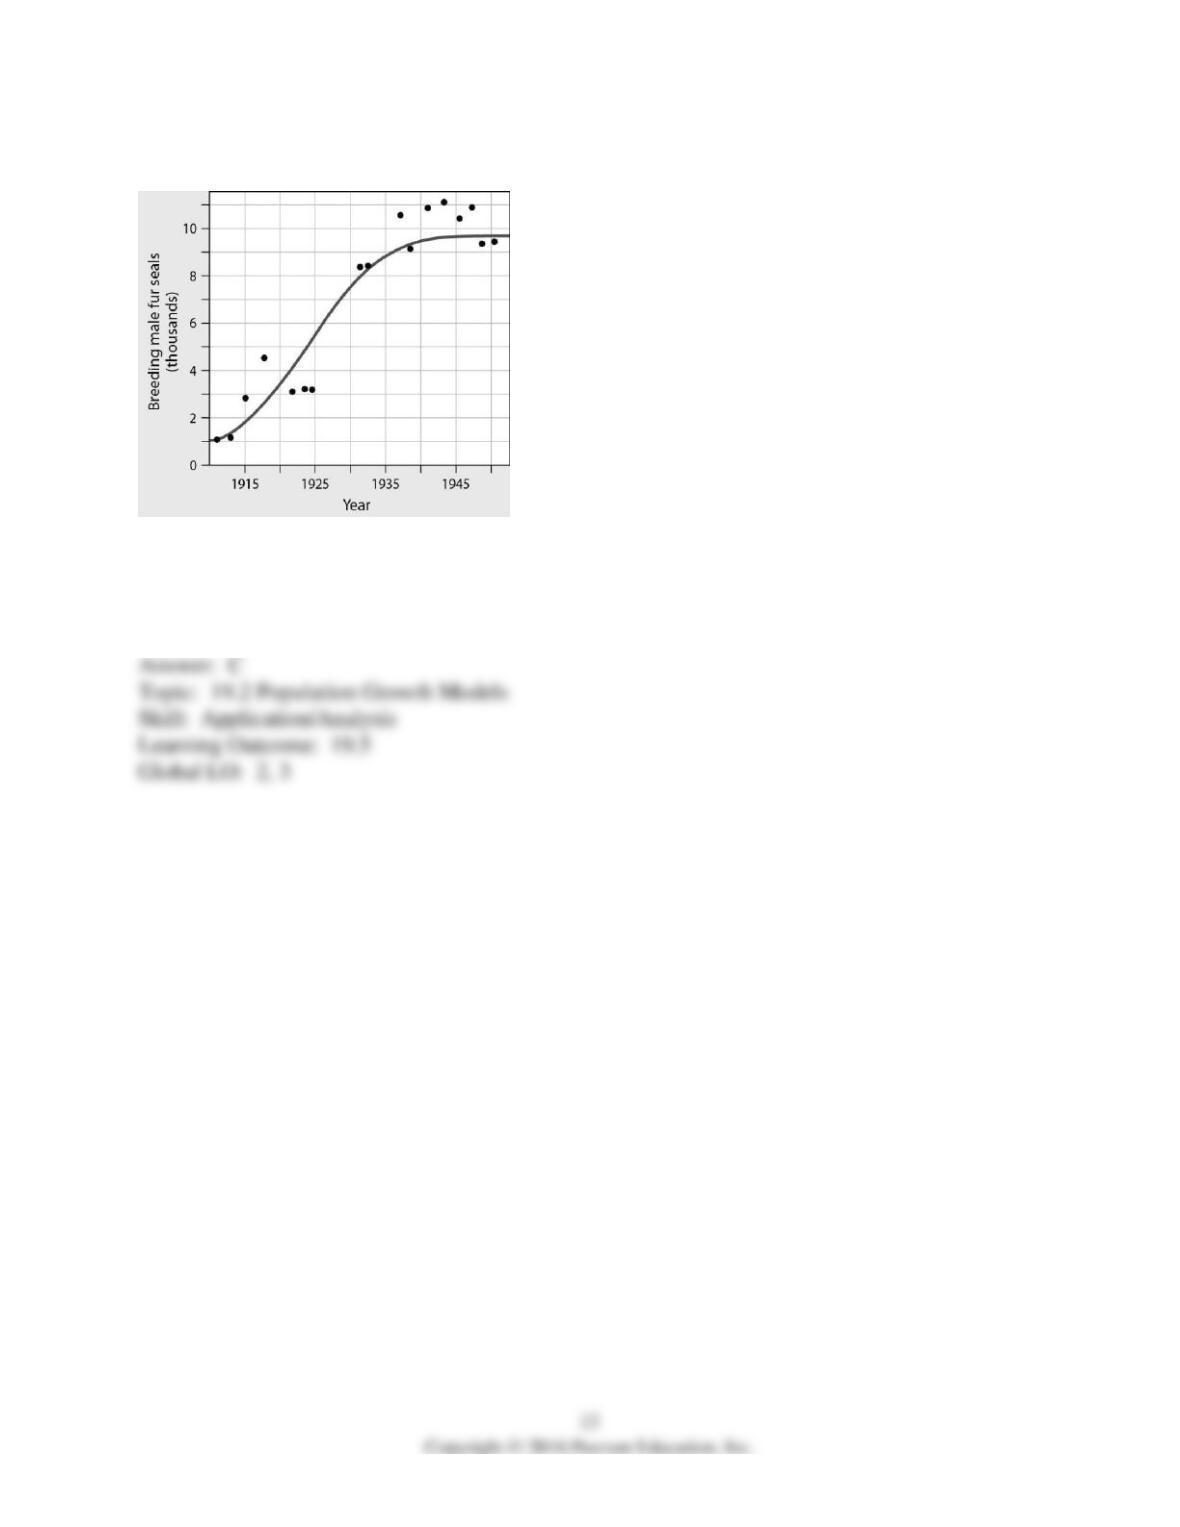
2) When did male fur seals reach carrying capacity?
A) 1915
B) 1930
C) 1940
D) 1950
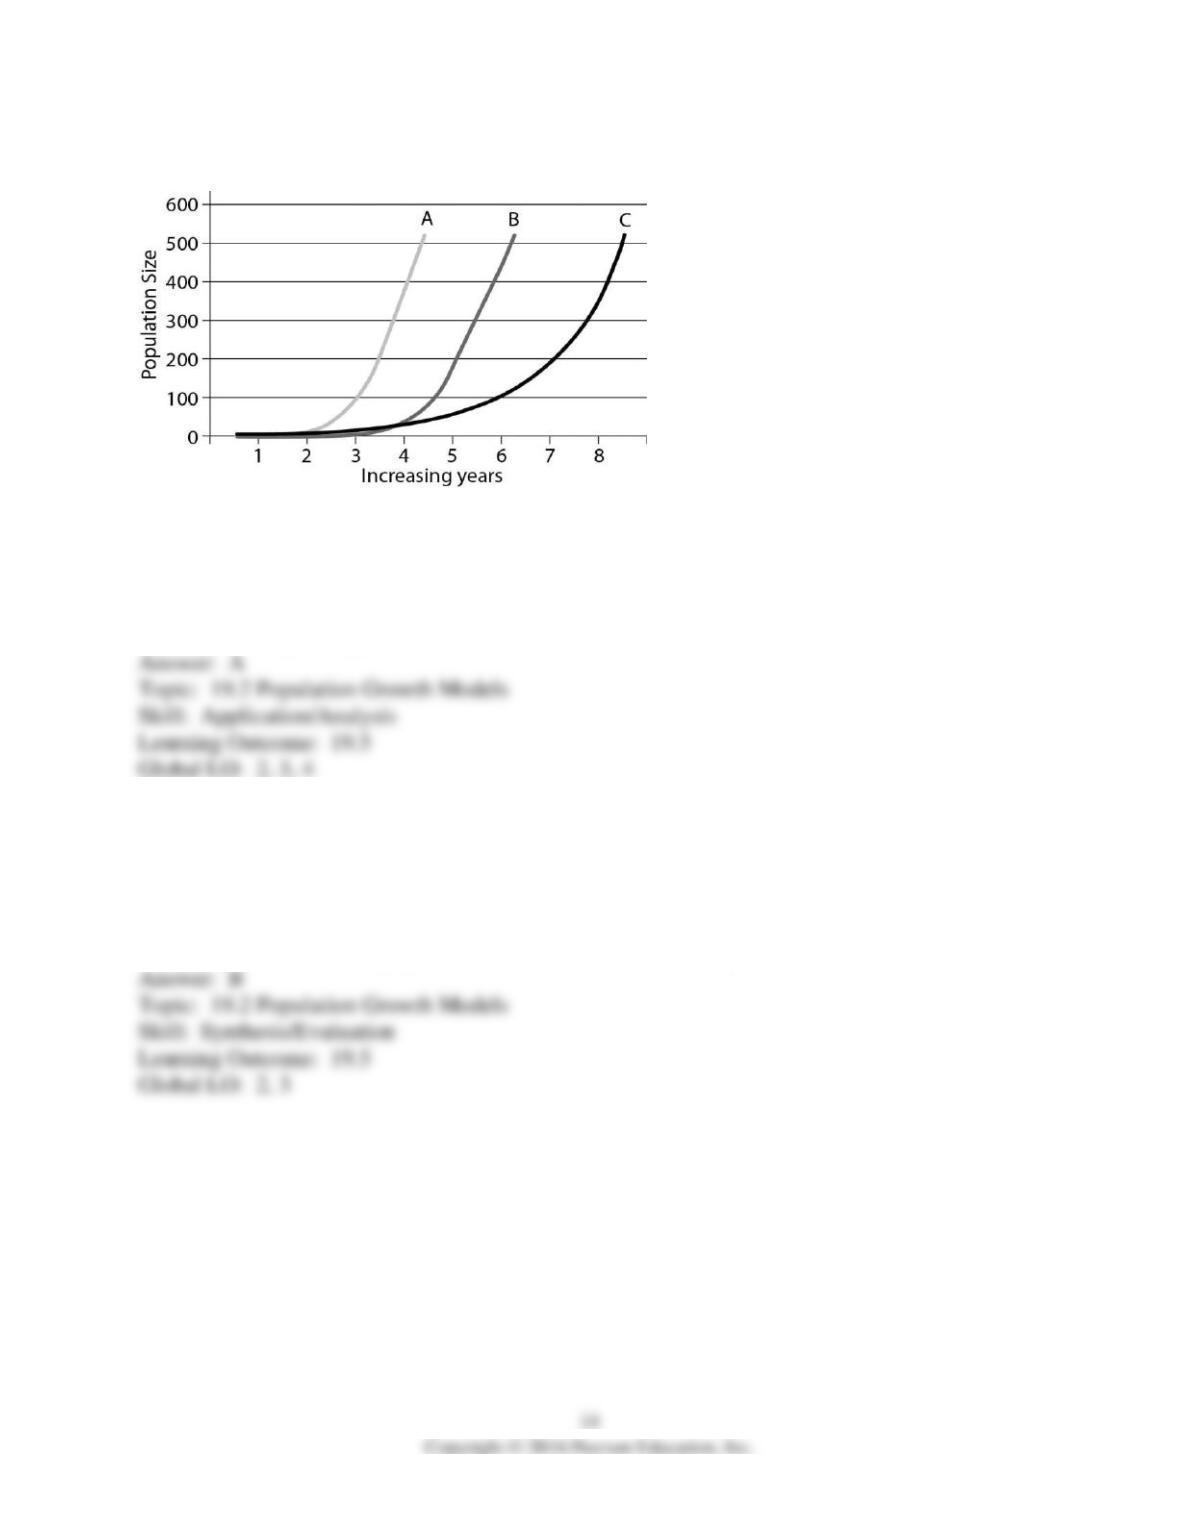
This graph represents three different populations. Use it to answer the following questions.
3) Which population is growing at the fastest rate?
A) Population A
B) Population B
C) Population C
D) They are all growing at the same rate.
4) If all populations occupy different areas that are approximately the same size, which
population will have the lowest density after 3 years?
A) Population A
B) Population B
C) Population C
D) After 3 years, all three populations will have the same density.
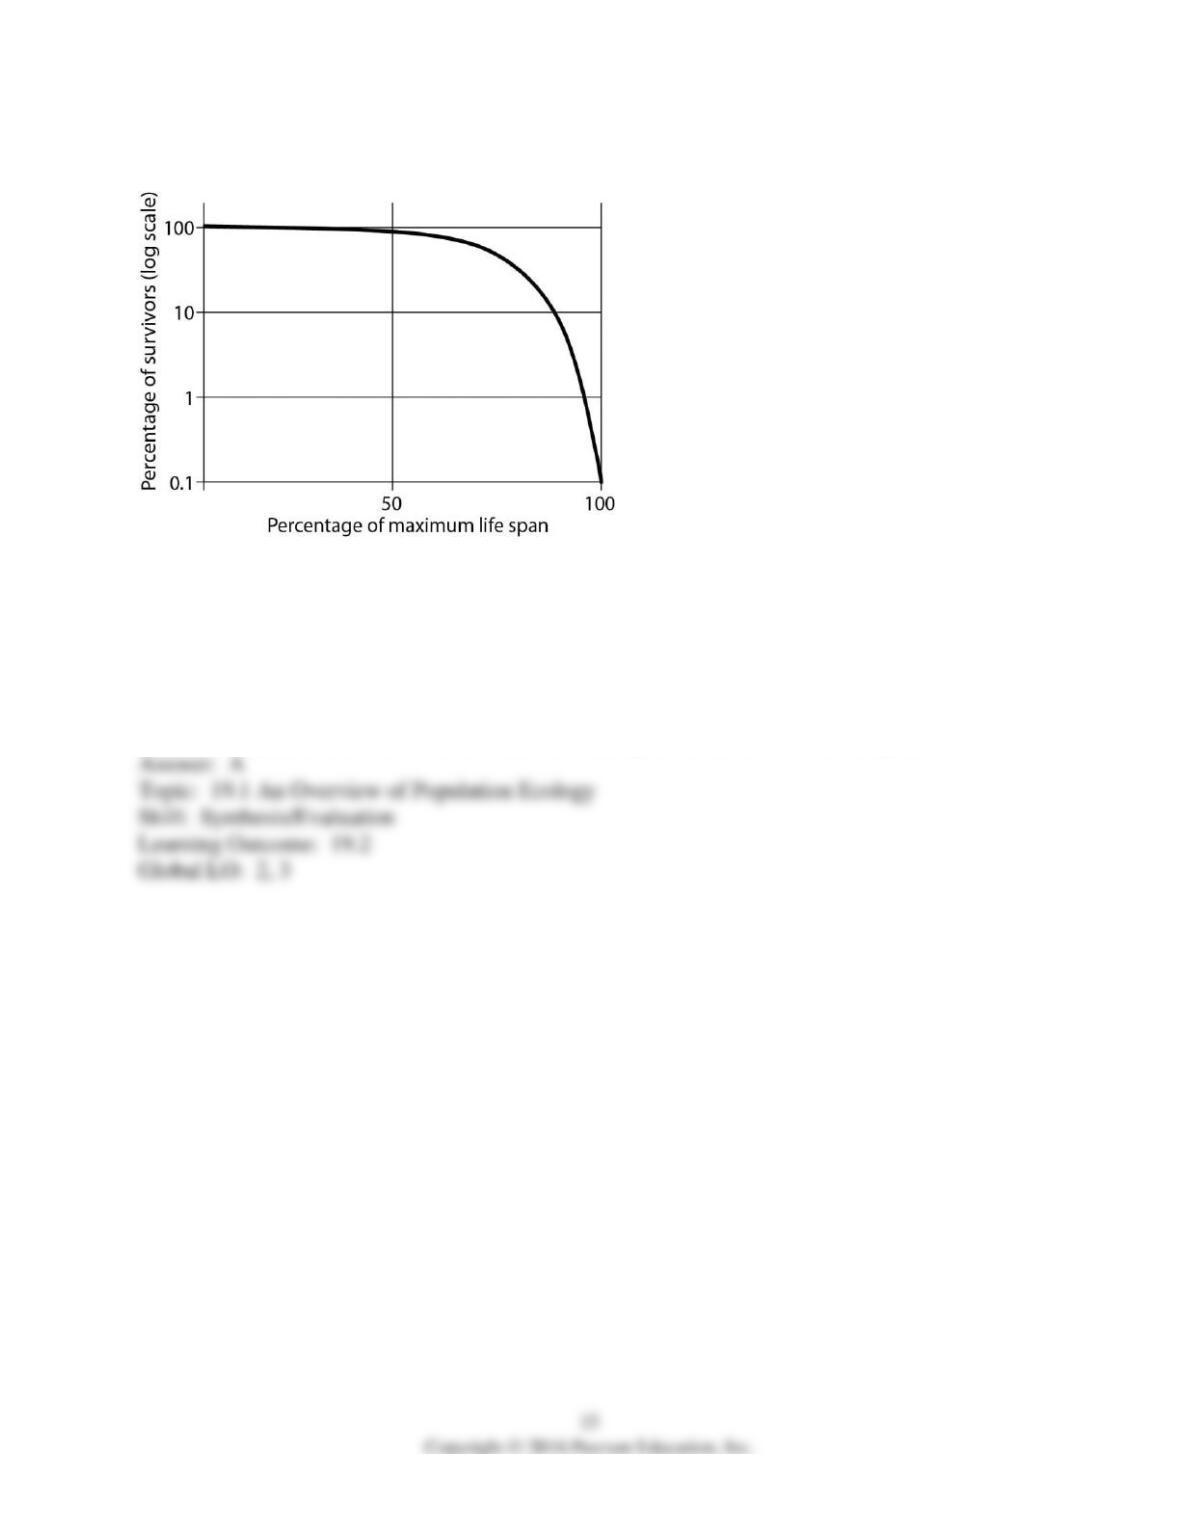
5) Which of the following choices matches this figure?
A) Dolphins produce only single offspring at a time and provide parental care for many months.
B) During “mating frenzies,” male and female squid aggregate and release hundreds of eggs and
sperm into the water column. The fertilized eggs are often quickly preyed on by fish.
C) The century plant grows for many years and reproduces and releases hundreds of seeds just
once before it withers and dies. Because of the dry desert environment in which it lives, many of
the seeds do not survive or are eaten.
D) In some species of lizards and rodents, survivorship is constant over the life span.
19.3 Scenario Questions
Please read the following scenario to answer the following questions.
Michigan’s Isle Royale is an island located in Lake Superior that is 45 miles long and 9 miles
wide. Ecologists estimate that the moose population on the island has been there since around
1900. The wolf population on the island, on the other hand, has been there only since the winter
of 1949. Weather conditions had to be calm and cold enough for the lake to freeze and the first
wolves to make the passage over to the island. When the wolves arrived, they were greeted with
a large moose population that had no predators. The moose population was at a dangerously high
level, but was kept in check by the arrival of the wolves. This “harmonious” pattern continued
for at least 20 years.
In 1982, the wolf population suddenly crashed. The problem was a new canine virus. This virus
surfaced around the world in 1978 and spread rapidly in about 6 months. Infected animals can
survive, but they have to be treated immediately. Ecologists hypothesized that the virus arrived
on the island carried on the shoe of a human traveler. The wolf population decreased from 50 to
14 individuals in a year. While the wolf population dropped, the moose population increased.
However, the winter of 1996 was extremely harsh and the moose population experienced a major
crash. More than 500 animals died during the winter months, reducing the population to less than
800 animals.
1) What most likely happened when the wolves first arrived on the island?
A) The wolf population increased exponentially.
B) The wolf population was at its carrying capacity.
C) The moose population crashed because of the introduction of a predator.
D) The moose population increased exponentially.
2) The virus introduced to the island in 1982 that reduced the wolf population is an example of
________.
A) a density-independent factor
B) a density-dependent factor
C) biological control
D) intraspecific competition
3) The harsh winter that led to the death of many moose in 1996 is an example of ________.
A) a density-dependent factor
B) biological control
C) a density-independent factor
D) a trigger for logistic growth
4) During a 1-year study, a graduate student attempted to count the wolves and moose on the
island. He estimated that there were 950 moose and 120 wolves. How many organisms,
populations, and species were included in this study?
A) organisms = 2; populations = 1; species = 2
B) organisms = 1,070; populations = 1; species = 2
C) organisms = 2; populations = 2; species = 1,070
D) organisms = 1,070; populations = 2; species = 2
Please read the following scenario to answer the following questions.
In May 2014, the European Union (EU) published a report of population structure and aging data
that described growing trends of low birth rates and longer life expectancies in the EU. In their
report, the EU described that, due to these trends, some EU member states are beginning to
demonstrate a population structure with many much-older individuals.
5) If this trend continues, what do you predict that the populations will look like decades from
2014?
A) There will be more older individuals than working-age individuals.
B) There will be more children than older individuals.
C) There will be more older individuals than children.
D) There will be more working-age individuals than older ones.
6) Why might this changing population structure be a concern for EU leaders?
A) Eventually greater resources will be needed to support a much larger and older generation,
and this burden will fall on an increasingly smaller workforce.
B) Eventually the EU population will exhibit a Type III survivorship curve.
C) Eventually intraspecific competition for resources amongst the older members of the
population will lead to a decrease in food and water availability.
D) Eventually individuals of reproductive age will face a boom-and-bust population cycle.