Microbiology: An Introduction, 13e (Tortora et al.)
Chapter 14 Principles of Disease and Epidemiology
14.1 Multiple-Choice Questions
1) A commensal bacterium
A) does not receive any benefit from its host.
B) is beneficial to its host.
C) may also be an opportunistic pathogen.
D) isn’t capable of causing disease in its host.
E) always causes disease in its host.
2) Which of the following statements is TRUE?
A) Both members are harmed in a symbiotic relationship.
B) Members of a symbiotic relationship cannot live without each other.
C) A parasite is not in symbiosis with its host.
D) Symbiosis always refers to different organisms living together and benefiting from each
other.
E) At least one member must benefit in a symbiotic relationship.
3) A healthcare-associated infection (traditionally known as a nosocomial infection) is
A) always present, but is inapparent at the time of hospitalization.
B) acquired during the course of hospitalization.
C) always caused by medical personnel.
D) only a result of surgery.
E) always caused by pathogenic bacteria.
4) The major significance of Robert Koch’s work is that
A) microorganisms are present in a diseased animal.
B) diseases can be transmitted from one animal to another.
C) microorganisms can be cultured.
D) microorganisms cause disease.
E) microorganisms are the result of disease.
5) Which of the following is NOT a verified exception in the use of Koch’s postulates?
A) Some diseases have poorly defined etiologies.
B) Some pathogens can cause several disease conditions.
C) Some human diseases have no other known animal host.
D) Some diseases are not caused by microbes.
E) Some diseases are noncommunicable.
6) Which of the following diseases is NOT spread by droplet infection?
A) botulism
B) tuberculosis
C) measles
D) the common cold
E) diphtheria
7) Biological transmission differs from mechanical transmission in that biological transmission
A) occurs when a pathogen is carried on the feet of an insect.
B) involves fomites.
C) involves reproduction of a pathogen in an arthropod vector prior to transmission.
D) requires direct contact.
E) works only with noncommunicable diseases.
8) Which of the following definitions is INCORRECT?
A) endemic: a disease that is constantly present in a population
B) epidemic: a disease that is constantly present across the world
C) pandemic: a disease that affects a large number of people in the world in a short time
D) sporadic: a disease that affects a population occasionally
E) incidence: number of new cases of a disease
9) Focal infections initially start out as
A) sepsis.
B) bacteremia.
C) local infections.
D) septicemia.
E) systemic infections.
10) The rise in herd immunity amongst a population can be directly attributed to
A) increased use of antibiotics.
B) improved handwashing.
C) vaccinations.
D) antibiotic-resistant microorganisms.
E) None of the answers is correct.
11) Koch observed Bacillus anthracis multiplying in the blood of cattle. What is the condition
specifically called when bacteria are multiplying in the blood?
A) bacteremia
B) focal infection
C) local infection
D) septicemia
E) systemic infection
12) Which one of the following does NOT contribute to the incidence of healthcare-associated
infections?
A) antibiotic resistance
B) lapse in aseptic techniques
C) gram-negative cell walls
D) lack of handwashing
E) lack of disinfecting surfaces
13) Transient microbiota differ from normal microbiota in that transient microbiota
A) cause diseases.
B) are found in a certain location on the host.
C) are always acquired by direct contact.
D) are present for a relatively short time.
E) never cause disease.
14) Which of the following statements about healthcare-associated infections is FALSE?
A) They occur in compromised patients.
B) They may be caused by opportunists.
C) They may be caused by drug-resistant bacteria.
D) They may be caused by normal microbiota.
E) The patient was infected before hospitalization.
15) One effect of washing regularly with antibacterial agents is the removal of normal
microbiota. This can result in
A) body odor.
B) fewer diseases.
C) increased susceptibility to disease.
D) normal microbiota returning immediately.
E) no bacterial growth because washing removes their food source.
16) Which of the following is NOT a reservoir of infection?
A) a sick person
B) a healthy person
C) a sick animal
D) a hospital
E) None of the answers is correct; all of these can be reservoirs of infection.
17) Which of the following is NOT a communicable disease?
A) malaria
B) AIDS
C) tuberculosis
D) tetanus
E) typhoid fever
18) Which of the following is a fomite?
A) water
B) droplets from a sneeze
C) pus
D) insects
E) a hypodermic needle
19) Which of the following statements about biological transmission is FALSE?
A) The pathogen reproduces in the vector.
B) The pathogen may enter the host in the vector’s feces.
C) Houseflies are an important vector.
D) The pathogen may be injected by the bite of the vector.
E) The pathogen may require the vector as a host.
20) Which of the following definitions is INCORRECT?
A) acute: a short-lasting primary infection
B) inapparent: infection characteristic of a carrier state
C) chronic: a disease that develops slowly and lasts for months
D) primary infection: an initial illness
E) secondary infection: a long-lasting illness
21) Symptoms of disease differ from signs of disease in that symptoms
A) are changes felt by the patient.
B) are changes observed by the physician.
C) are specific for a particular disease.
D) always occur as part of a syndrome.
22) The science that deals with when diseases occur and how they are transmitted is called
A) ecology.
B) epidemiology.
C) communicable disease.
D) morbidity and mortality.
E) public health.
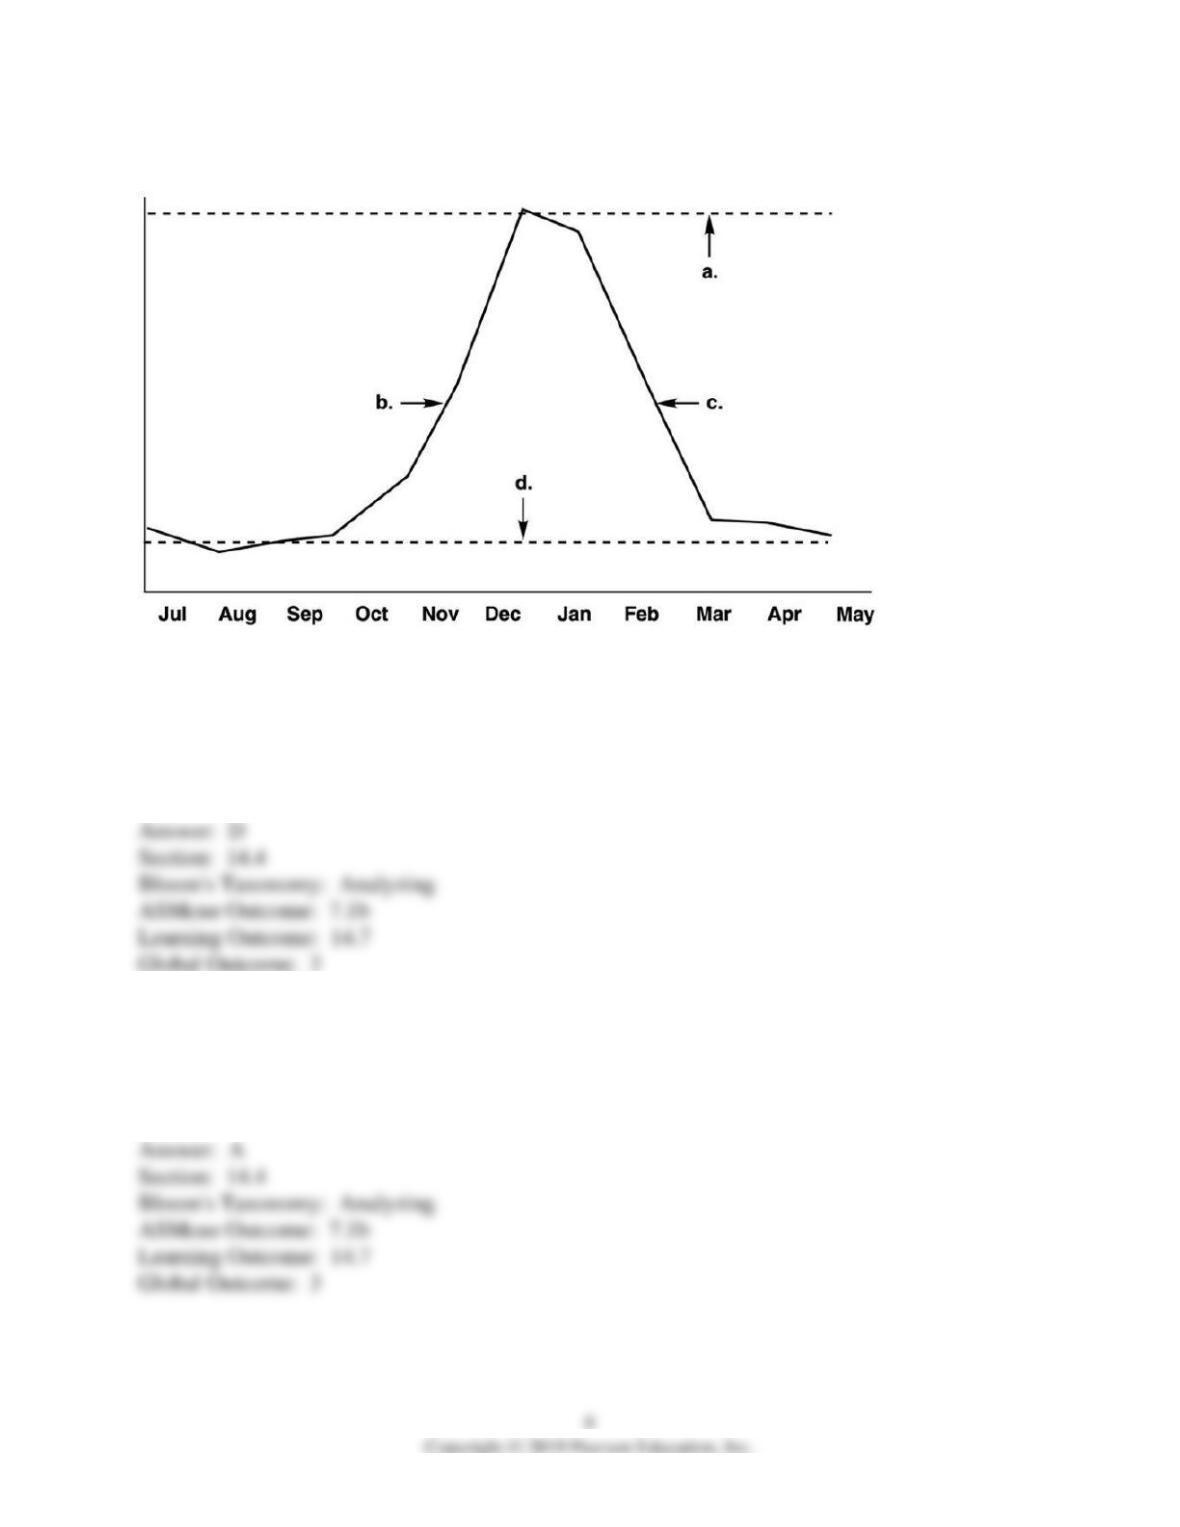
Refer to figure 14.1
23) Figure 14.1 shows the incidence of influenza during a typical year in the northern
hemisphere. Which letter on the graph indicates the endemic level?
A) a
B) b
C) c
D) d
24) In Figure 14.1, which letter on the graph indicates the epidemic level?
A) a
B) b
C) c
D) d
25) In Figure 14.1, which letter indicates the gradual end of the epidemic outbreak?
A) a
B) b
C) c
D) d
26) Would you expect the graph to change if this was for the southern hemisphere, rather than
the northern hemisphere? If so, how?
A) No, the graph would not change. Influenza epidemics occur at the same time each year.
B) Yes, because the population in the northern hemisphere is less than that in the southern
hemisphere, the peak of the graph would be higher.
C) Yes, because the weather is hotter in the southern hemisphere than in the northern
hemisphere, you could expect to see less cases overall in the graph, leading to a lower peak.
D) Yes, because the seasons are reversed in the southern hemisphere. While weather doesn’t
directly cause influenza outbreaks, the cold, dry air and human crowding indoors contribute to
increased cases. The southern hemisphere would still have a peak, but it would be at a different
time of year than the northern hemisphere.
27) Emergence of infectious diseases can be attributed to all of the following EXCEPT
A) antibiotic resistance.
B) climatic changes.
C) new strains of previously known agents.
D) ease of travel.
E) The emergence of infectious diseases can be attributed to all of these.
28) Which of the following pairs is mismatched?
A) malaria – foodborne transmission
B) salmonellosis – vehicle transmission
C) syphilis – direct contact
D) influenza – droplet infection
29) Which of the following can contribute to postoperative infections?
A) using syringes more than once
B) normal microbiota on the operating room staff
C) errors in aseptic technique
D) antibiotic resistance
E) All of the answers are correct.
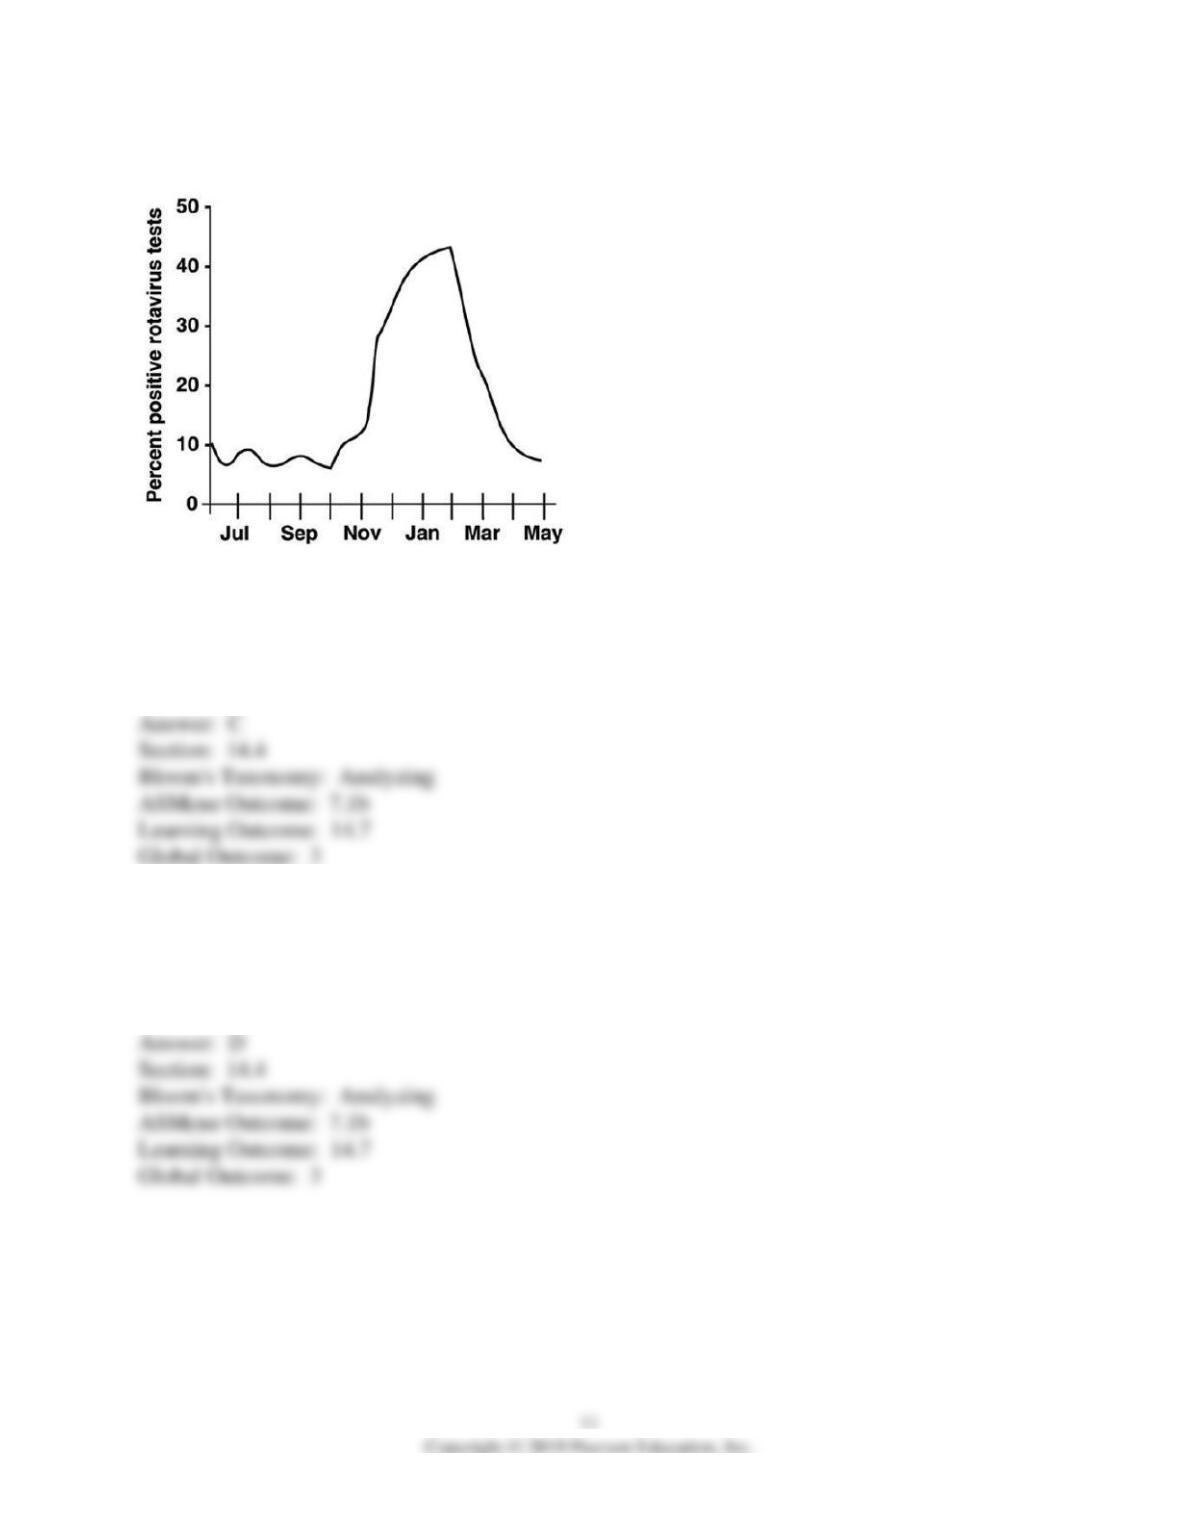
Refer to Figure 14.2
30) In Figure 14.2, when is the prevalence the highest?
A) July
B) January
C) February
D) March
31) In Figure 14.2, which one of the following choices has the highest morbidity rate?
A) July
B) October
C) November
D) December