
Carcinoma cells that have acquired malignancy and started local invasiveness to begin
metastasis …
A.decrease the expression of E-cadherin and undergo mesenchymal-epithelial
transition.
B.increase the expression of E-cadherin and undergo mesenchymal-epithelial transition.
C.decrease the expression of E-cadherin and undergo epithelial-mesenchymal
transition.
D.increase the expression of E-cadherin and undergo epithelial-mesenchymal transition.
A protein is covalently attached to glycosylphosphatidylinositol. Which of the
following is typically NOT true regarding this protein?
A.The linkage of the anchor to the C-terminus of the protein occurs in the ER.
B.The attachment of the anchor coincides with cleavage of a C-terminal transmembrane
segment of the protein precursor.
C.The protein is likely to be an ER resident, helping with the folding of nascent
imported proteins.
D.A phospholipase can cleave the protein from the membrane.
E.The anchor affects the localization of the protein in the membrane.
You have isolated five mutations (1 to 5) in the yeast Saccharomyces cerevisiae that
make the haploid cells unable to grow in the absence of histidine. Each haploid mutant
can be mated with any of the other ones, forming diploid cells that either can (+) or
cannot (-) grow in the absence of histidine, as indicated in the following
complementation table. How many complementation groups do these mutations
represent? Each complementation group typically corresponds to a separate gene.

A.1
B.2
C.3
D.4
E.5
Sort the following events to reflect the order in which they occur during vesicle docking
onto a target membrane, starting with an inactive Rab in the cytosol. Your answer
would be a four-letter string composed of letters A to D only, e.g. DACB.
(A)Rab is bound to its effector (tethering protein) on the target membrane.
(B)Rab is bound to its Rab-GDI.
(C)Rab is bound to the membrane in its GTP-bound form.
(D)Rab dissociates from the membrane.
Which of the following is NOT common between long-term potentiation and long-term
depression?
A.They are both important for synaptic plasticity in normal individuals.
B.They both require the activation of the glutamate-gated NMDA receptors.
C.They both require a rise in the intracellular concentration of Ca2+.
D.They both result in an enhanced postsynaptic response.
E.They can both last for a long time.

Mitochondria and chloroplasts are thought to have evolved from free-living aerobic
bacteria that were engulfed by an ancestral anaerobic cell and established a mutually
beneficial (symbiotic) relationship with it. Which of the following statements is NOT
true about these organelles?
A.They are similar in size to small bacteria.
B.They have their own circular genomic DNA.
C.They have their own ribosomes.
D.They have their own transfer RNAs.
E.They are found in all eukaryotes.
Protein A can bind to each of the proteins B or C. The association rate constants are the
same for forming the AB and the AC complexes. However, the dissociation rate
constant for AB is 100 times higher than that for AC. Given that every tenfold increase
in the equilibrium constant (of the association reaction) corresponds to about -5.9
kJ/mole difference in the standard free-energy change for the reaction ( G°), what is
the value of ( G°AB – G°AC) in kJ/mole?
A.-11.8
B.-5.9
C.0
D.+5.9
E.+11.8
You have prepared actin filament seeds in a microfluidic chamber through which you
then pass either unlabeled or fluorescently labeled actin subunits in alternation several
times, keeping the total monomer concentration constant. You then observe the
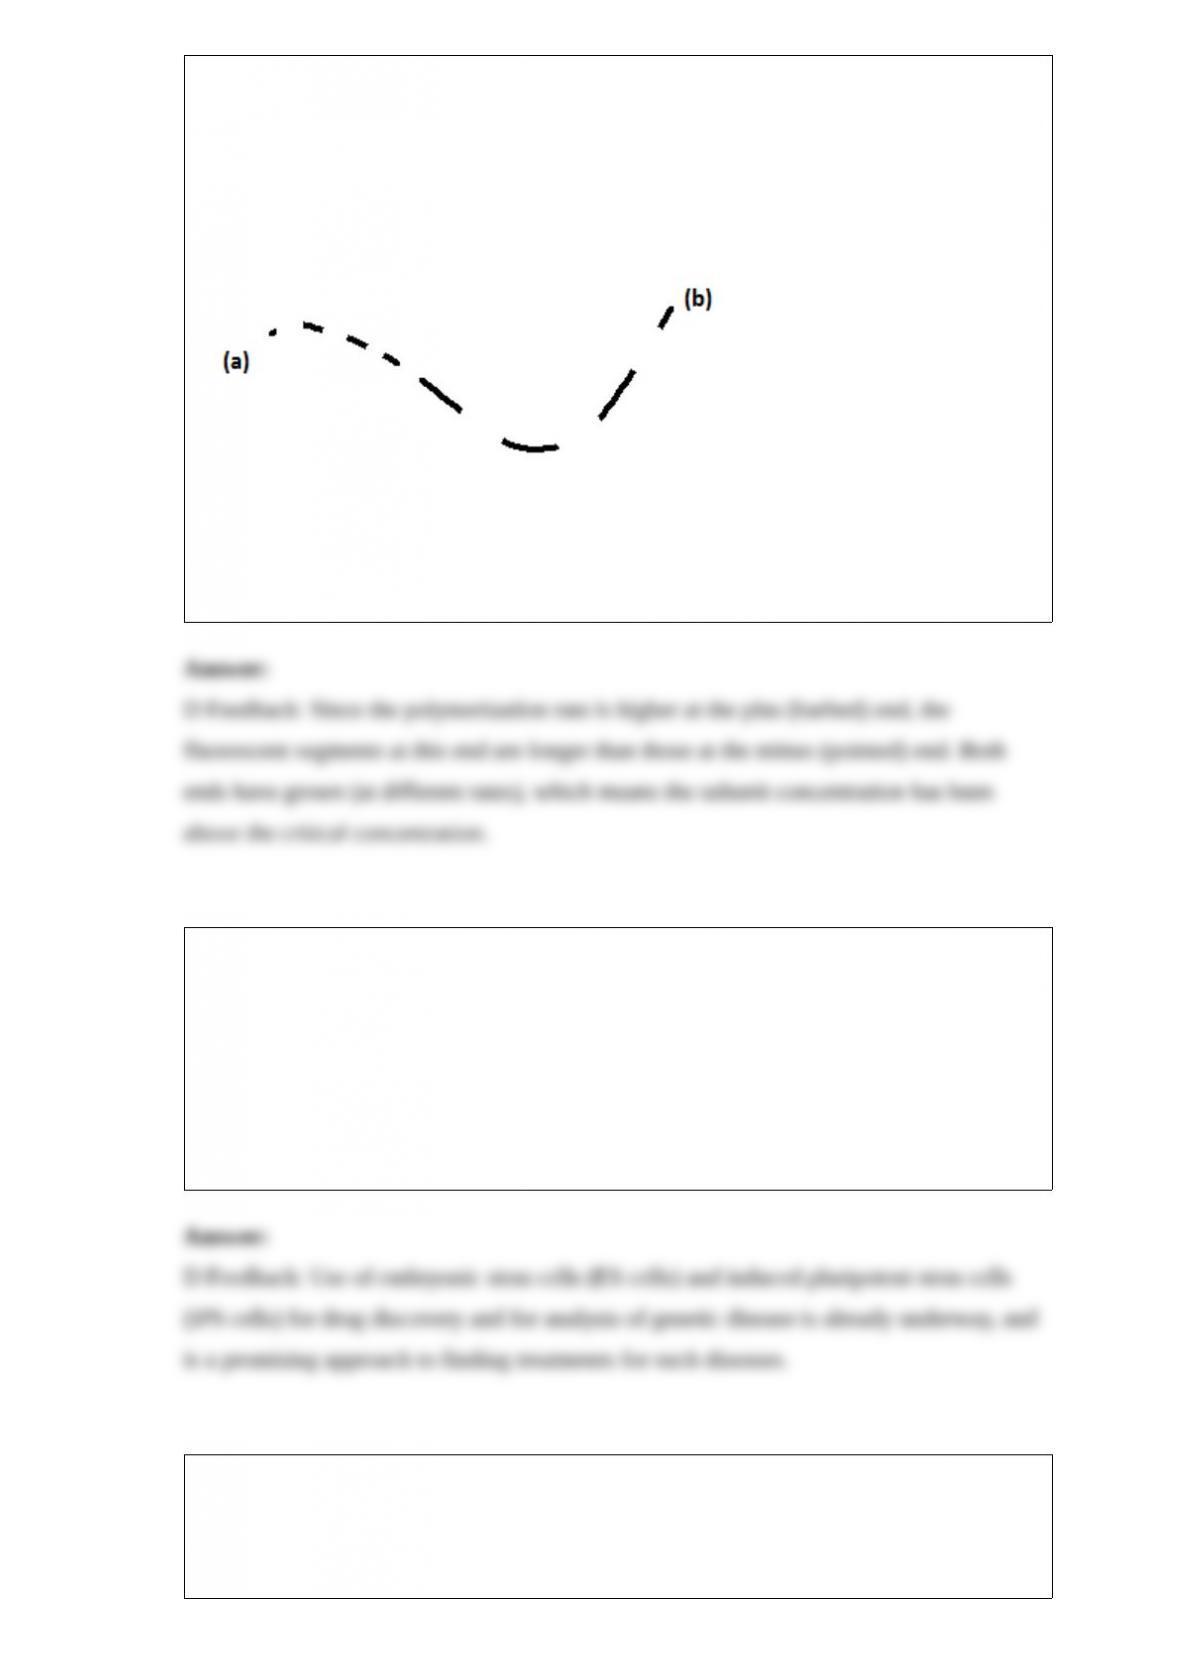
resulting filaments under a fluorescence microscope. If the filaments appear as drawn
schematically in the example below (in which fluorescence is indicated by black color),
which end do you think is the plus end-(a) or (b)? Was the concentration of free actin
subunits below or above the critical concentration (Cc) for polymerization at the barbed
end?
A.(a); below
B.(b); below
C.(a); above
D.(b); above
Which of the following tasks is possible with current stem-cell and reprogramming
technology?
A.Guiding ES cells to generate any desired adult cell type.
B.Generating functional whole organs from iPS cells for transplantation.
C.Forcing transdifferentiation of any terminally differentiated cell into another cell.
D.In vitro screening for drug discovery using patient-specific iPS-derived cells as
disease models.
E.All of the above.
You have discovered a mutant protein that forms promiscuous disulfide bonds with
many other cellular proteins in the endoplasmic reticulum. Using an antibody against
the protein, you immunoprecipitate proteins that interact with it. You then separate these
proteins using a special type of two-dimensional polyacrylamide-gel electrophoresis
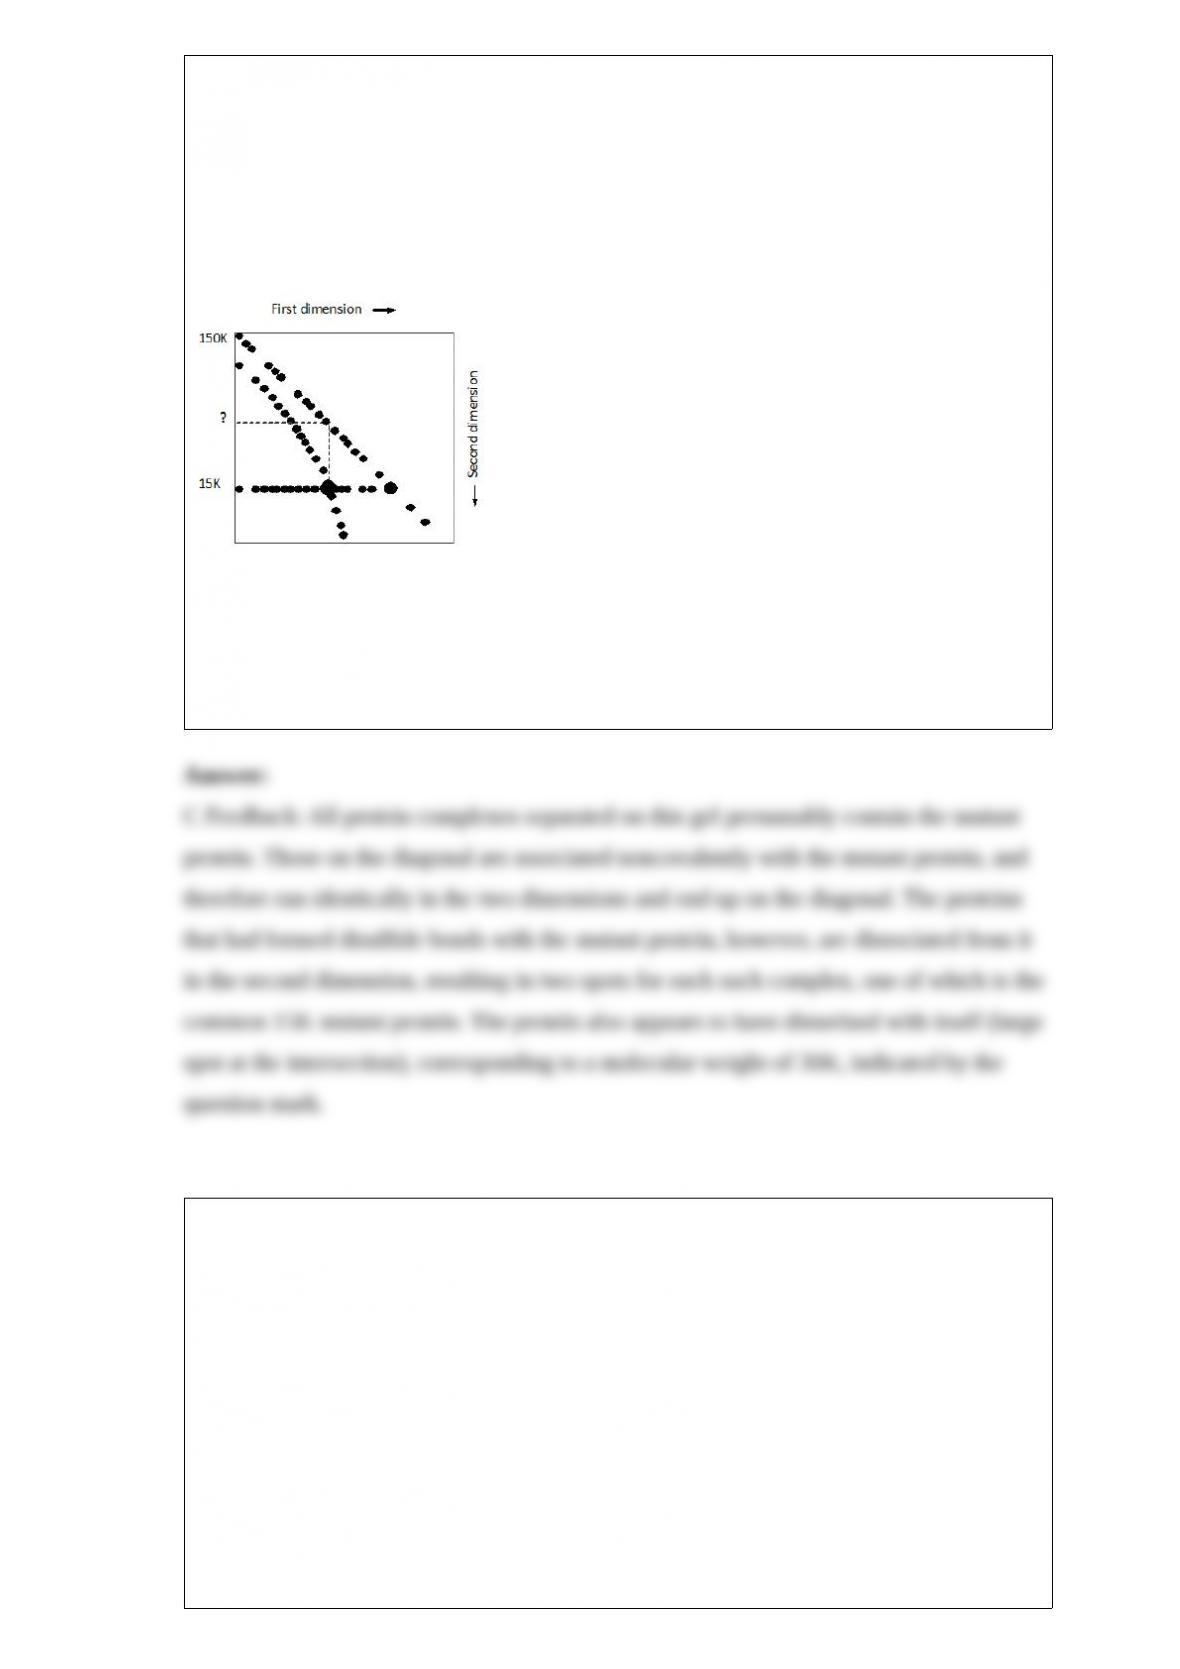
(PAGE): in this method, separation in the first dimension is carried out by SDS-PAGE
in the absence of ²-mercaptoethanol, while separation in the second dimension is carried
out by SDS-PAGE in the presence of ²-mercaptoethanol. The result is shown in the
following schematic drawing. Apparent molecular weights are indicated on the left.
What do you think is the molecular weight of the mutant protein? What is the molecular
weight represented by the question mark?
A.15K, 45K
B.30K, 45K
C.15K, 30K
D.30K, 30K
E.30K, 60K
The immortalized non-malignant mouse cell line NIH-3T3 was derived from normal
mouse fibroblasts in the early 1960s. These cells are able to readily take up exogenous
DNA and are prone to transformation by cancer-causing agents, including some
retroviruses. DNA extracted from a human bladder carcinoma line is able to transform
these cells, as judged by a significant increase in the number of foci (cell clumps) in the
cell-culture plates when the DNA is added. The malignant cells contain human DNA,
and the DNA can be shown by sequence analysis to contain a single mutant gene that is
present in the original bladder carcinoma cell line. The gene codes for a monomeric G
protein and was one of the first cancer-critical genes to be identified in this way. The
protein encoded by this gene is …
A.Src
B.Ras
C.Myc

D.p53
E.Apc
v-FLIPs are viral proteins that were first identified as modulators of apoptosis; they
contain two death effector domains, which are also found in some initiator caspases
such as procaspase-8. These v-FLIP proteins can be recruited to the DISC through the
binding of the death effector domain to similar domains in the adaptor proteins, but are
otherwise catalytically inactive. What do you think is the effect of v-FLIP expression in
the host cell?
A.It promotes apoptosis mainly via the extrinsic pathway.
B.It inhibits the extrinsic pathway of apoptosis.
C.It activates only the mitochondrial pathway of apoptosis.
D.It inhibits the intrinsic pathway of apoptosis.
E.It enhances the caspase cascades in both the intrinsic and extrinsic pathways.
Upon heavy damage to the cell’s DNA, the normal replicative DNA polymerases may
stall when encountering damaged DNA, triggering the use of backup translesion
polymerases. These backup polymerases ___
A.lack 3′-to-5′ exonucleolytic proofreading activity.
B.are replaced by the replicative polymerases after adding only a few nucleotides.
C.can create mutations even on undamaged DNA.
D.may recognize specific DNA damage and add the appropriate nucleotide to restore
the original sequence.
E.All of the above.

Myelination of axons in the peripheral nervous system ___
A.is carried out by Schwann cells.
B.insulates the axons to reduce current leakage.
C.increases the speed of action potential propagation through saltatory conduction.
D.conserves energy because the active excitations are restricted to the nodes of Ranvier.
E.All of the above.
Which of the following is NOT part of a negative feedback mechanism in adaptation to
light in retinal rod cells?
A.Phosphorylation of G-protein-coupled receptor
B.Binding of arrestin to G protein
C.Stimulation of guanylyl cyclase by decreased Ca2+ levels
D.Binding of regulator of G protein signaling to transducin
If the concentration of free subunits is C, under which condition does the growth of a
cytoskeletal filament proceed spontaneously?
A.C > 1/kon
B.C < 1/koff
C.C > kon/koff
D.C > koff/kon
E.C > Ccxkon/koff

During branching morphogenesis in lung development, …
A.FGF10 is secreted by epithelial cells at the tip of the growing epithelial tubes.
B.FGF10 inhibits Shh production by the epithelial cells at the tip of the growing
epithelial tubes.
C.Shh inhibits FGF10 production by the epithelial cells at the tip of the growing
epithelial tubes.
D.Shh is produced by epithelial cells at the tip of the growing epithelial tubes.
E.None of the above.
In the active state of the integrin dimer, …
A.both intracellular and extracellular binding sites are exposed.
B.the intracellular binding sites are inaccessible, while the extracellular binding sites
are exposed.
C.the intracellular binding sites are exposed, while the extracellular binding sites are
inaccessible.
D.both intracellular and extracellular binding sites are inaccessible.
The regions of synteny between the chromosomes of two species can be visualized in
dot plots. In the example shown in the following graph, a chromosome of a hypothetical
species A has been aligned with the related chromosome in species B. Each dot in the
plot represents the observation of high sequence identity between the two aligned
chromosomes in a window located at the two corresponding chromosome positions. A
series of close dots can make a continuous line. Choosing a sufficiently large window
size allows a “clean” dot plot with solid lines that show only the long stretches of
identity, allowing ancient large-scale rearrangements to be identified. Several
chromosomal events can be detected in such dot plots. Indicate which feature (a to g) in
the dot plot is best explained by each of the following events. Your answer would be a
seven-letter string composed of letters a to g only, e.g. cdbagef. Each letter should be
used only once.
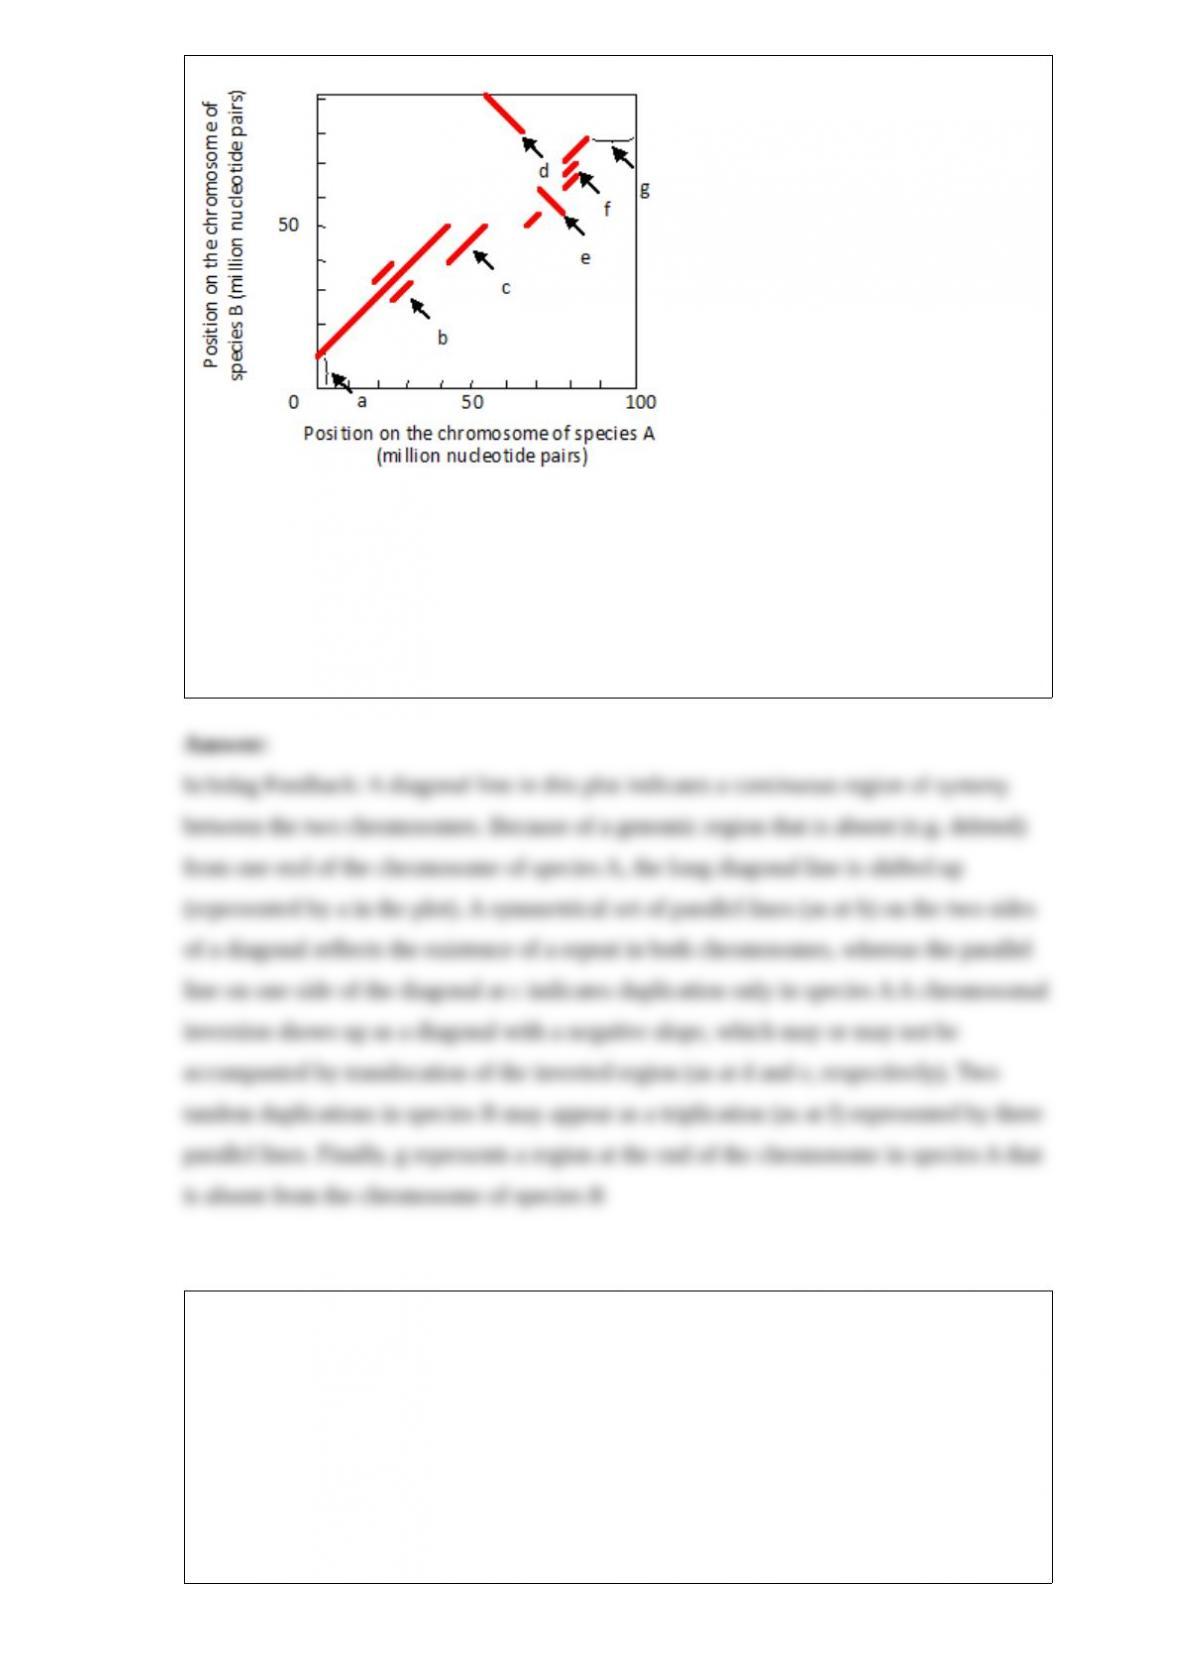
( )A duplication that exists in both species
( )A duplication in species A only
( )A triplication in species B only
( )An inversion without relocation
( )An inversion combined with relocation
( )A deletion in species A
( )A translocation in species A from a different chromosome
Indicate if each of the following descriptions applies to (1) EB1, (2) kinesin-1, (3)
kinesin-13, or (4) katanin. Your answer would be a four-digit number composed of
digits 1 to 4 only, e.g. 1432.
( )This is a microtubule-severing protein that can release microtubules from the
microtubule-organizing centers.
( )It increases the frequency of catastrophe by deforming microtubule protofilaments.
( )This is a conventional motor protein that moves toward the plus end of a microtubule.
( )It recognizes the structure of a growing microtubule end and binds to it, helping other
proteins to also bind to the plus end.

Indicate whether each of the following mutations would likely promote (P) or inhibit (I)
apoptosis in cells harboring the mutation(s). Your answer would be a four-letter string
composed of letters P and I only, e.g. PPPI.
( )Mutations in the pro-apoptotic effector Bcl2 family proteins Bax and Bak that
prevent their association with the outer mitochondrial membrane.
( )A mutation in the BIR domain of the IAP protein DIAP1 that prevents binding to
either caspases or anti-IAP proteins.
( )A mutation in the anti-IAP protein Reaper that prevents its binding to the IAP
proteins.
( )A mutation in the CARD domain of caspase-9 that prevents its binding to Apaf1.
Indicate true (T) and false (F) statements below regarding mRNA stability and
degradation. Your answer would be a four-letter string composed of letters T and F only,
e.g. TTFT.
( )Any factor that affects the translation efficiency of an mRNA tends to have the
opposite effect on its degradation.
( )Decapping of mRNA normally occurs after poly-A tail shortening removes the
poly-A tail and starts chewing into the 3′-UTR.
( )Most mRNA decay in the cells generally proceeds via endonucleolytic cleavage.
( )As a general rule, eukaryotic mRNAs have a shorter half-life compared to bacterial
mRNAs.

Indicate true (T) and false (F) statements below regarding the formation of orderly
neural maps in the mammalian brain. Your answer would be a four-letter string
composed of letters T and F only, e.g. FFFF.
( )As a general rule, neurons that fire together avoid each other.
( )In the tonotopic map of the auditory system, brain neurons are arranged in the
auditory cortex according to the pitch of the sound they respond to, like the keys of a
piano.
( )In the optic tectum in the midbrain, brain neurons are arranged along the
anterior-posterior axis according to the frequency of light they respond to, like the
colors of a rainbow.
( )If the optic nerve of a frog is cut and the eye is rotated 180° in its socket, the retinal
ganglion cells reconnect to their original targets in the optic tectum, therefore creating
an inverted map.
Indicate true (T) and false (F) statements below regarding viral cell entry. Your answer
would be a four-letter string composed of letters T and F only, e.g. FFTF.
( )Endocytosis inhibitors can block HIV entry but not influenza virus entry.
( )Adenovirus infection is blocked by membrane-fusion inhibitors.
( )Individuals with a defective CCR5 gene are more susceptible to HIV infection.
( )Most viruses enter the host cell by phagocytosis.

Indicate true (T) and false (F) statements below regarding lymphocytes in the adaptive
immune system. Your answer would be a four-letter string composed of letters T and F
only, e.g. TTFF.
( )To induce an adaptive immune response, an invading pathogen must invade a
peripheral lymphoid organ.
( )Lymphocytes continuously circulate between central and peripheral lymphoid organs.
( )Upon encountering its specific antigen in a peripheral lymphoid organ, a lymphocyte
remains there to proliferate and differentiate into effector and memory cells.
( )Memory B and T cells do not recirculate, but rather remain in the peripheral
lymphoid organ in which they develop.
Indicate whether each of the following descriptions better applies to B cells (B) or T
cells (T) of the adaptive immune system. Your answer would be a four-letter string
composed of letters B and T only, e.g. BTTT.
( )Their effector cells act mainly at short range.
( )Their receptors recognize protein fragments that have been processed in
antigen-presenting cells.
( )They do NOT normally express CD8 protein on their surface.
( )They can become “killer” cells.
The anticodon sequence of a phenylalanine-specific tRNA is 5′-GAA-3′. Given the
wobble base-pairing rules presented in the following table, how many different codons
can be “read” by this tRNA? Write down your answer in digits, e.g. 12

Indicate true (T) and false (F) statements below regarding the Ras€MAP-kinase
signaling pathway. Your answer would be a four-letter string composed of letters T and
F only, e.g. TTTF.
( )The immediate early genes turn on a few hours after activation of the RTK.
( )Ras-GTP binds directly to, and activates, the upstream kinase in the MAP kinase
module.
( )Signal transduction through the Ras€MAP-kinase pathway only leads to a transient
response.
( )In the MAP kinase module, Raf can be phosphorylated by Erk to create a negative
feedback loop.