Appendix to Chapter 1—Applying Graphs to Economics
MULTIPLE CHOICE
1. A direct relationship exists when:
a.
there is no association between two variables.
b.
one variable increases and there is no change in the other variable.
c.
one variable increases and the other variable increases.
d.
one variable increases and the other variable decreases.
2. An upward-sloping line or curve is used to illustrate:
a.
a direct relationship.
c.
two unrelated variables.
b.
an inverse relationship.
d.
the ceteris paribus assumption.
3. Suppose two variables are directly related. If one variable rises, then the other variable:
a.
also rises.
c.
remains unchanged.
b.
falls.
d.
reacts unpredictably.
4. Which of the following pairs is the most likely to exhibit a direct relationship?
a.
The price of gasoline and the amount of gasoline that people purchase.
b.
Cholesterol levels and the likelihood of developing heart disease.
c.
Outdoor temperature and heating oil sales.
d.
Annual income and weekly pawn shop visits.
5. A direct relationship is expressed graphically as a:
a.
positively sloped line or curve.
c.
horizontal line.
b.
negatively sloped line or curve.
d.
vertical line.
6. An inverse relationship exists when:
a.
there is no association between two variables.
b.
one variable increases and there is no change in the other variable.
c.
one variable increases and the other variable increases.
d.
one variable increases and the other variable decreases.
7. Which of the following pairs is the most likely to exhibit an inverse relationship?
a.
The amount of time you study and your grade point average.
b.
People’s annual income and their expenditure on personal computers.
c.
Baseball players’ salaries and their batting averages.
d.
The price of a concert and the number of tickets people purchase.
8. When an inverse relationship is graphed, the resulting line or curve is:
a.
horizontal.
c.
upward-sloping.
b.
vertical.
d.
downward-sloping.
9. The slope of a line parallel to the vertical axis is:
a.
1.
b.
0.
c.
infinite.
d.
undefined.
10. The slope of a line parallel to the horizontal axis is:
a.
1.
b.
0.
c.
infinite.
d.
undefined.
11. Measured between two points on a curve, the ratio of the change in the variable on the vertical axis to
the change in the variable on the horizontal axis is the:
a.
axis.
c.
dependent curve.
b.
slope.
d.
independent curve.
12. Which of the following statements is correct?
a.
Slope is the ratio of the vertical change (the rise or fall) to the horizontal change (the run).
b.
A direct relationship is one in which two variables change in the same direction.
c.
An inverse relationship is one in which two variables change in opposite directions.
d.
An independent relationship is one in which two variables are unrelated.
e.
All of these.
13. Which of the following is used to illustrate an independent relationship between two variables?
a.
An upward-sloping curve
c.
A hill-shaped curve
b.
A downward-sloping curve
d.
A horizontal or vertical line
14. A line that has a different slope at each point is a:
a.
curve.
c.
vertical line.
b.
straight line.
d.
horizontal line.
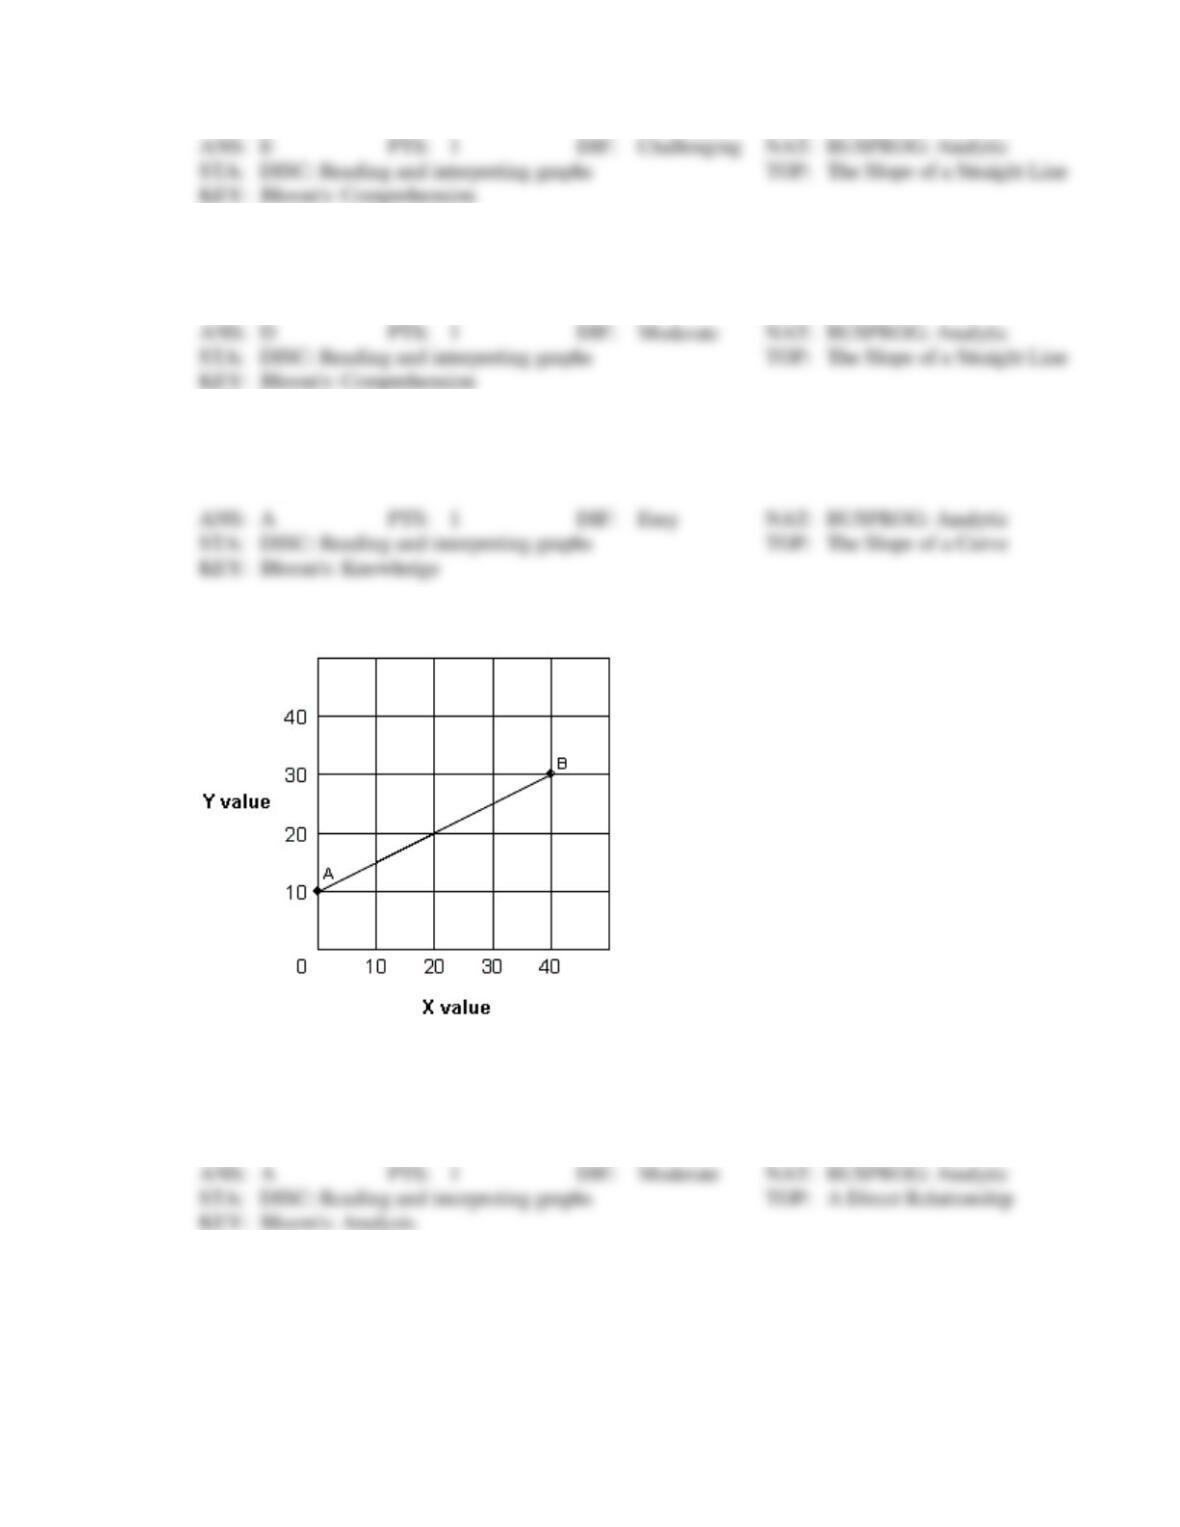
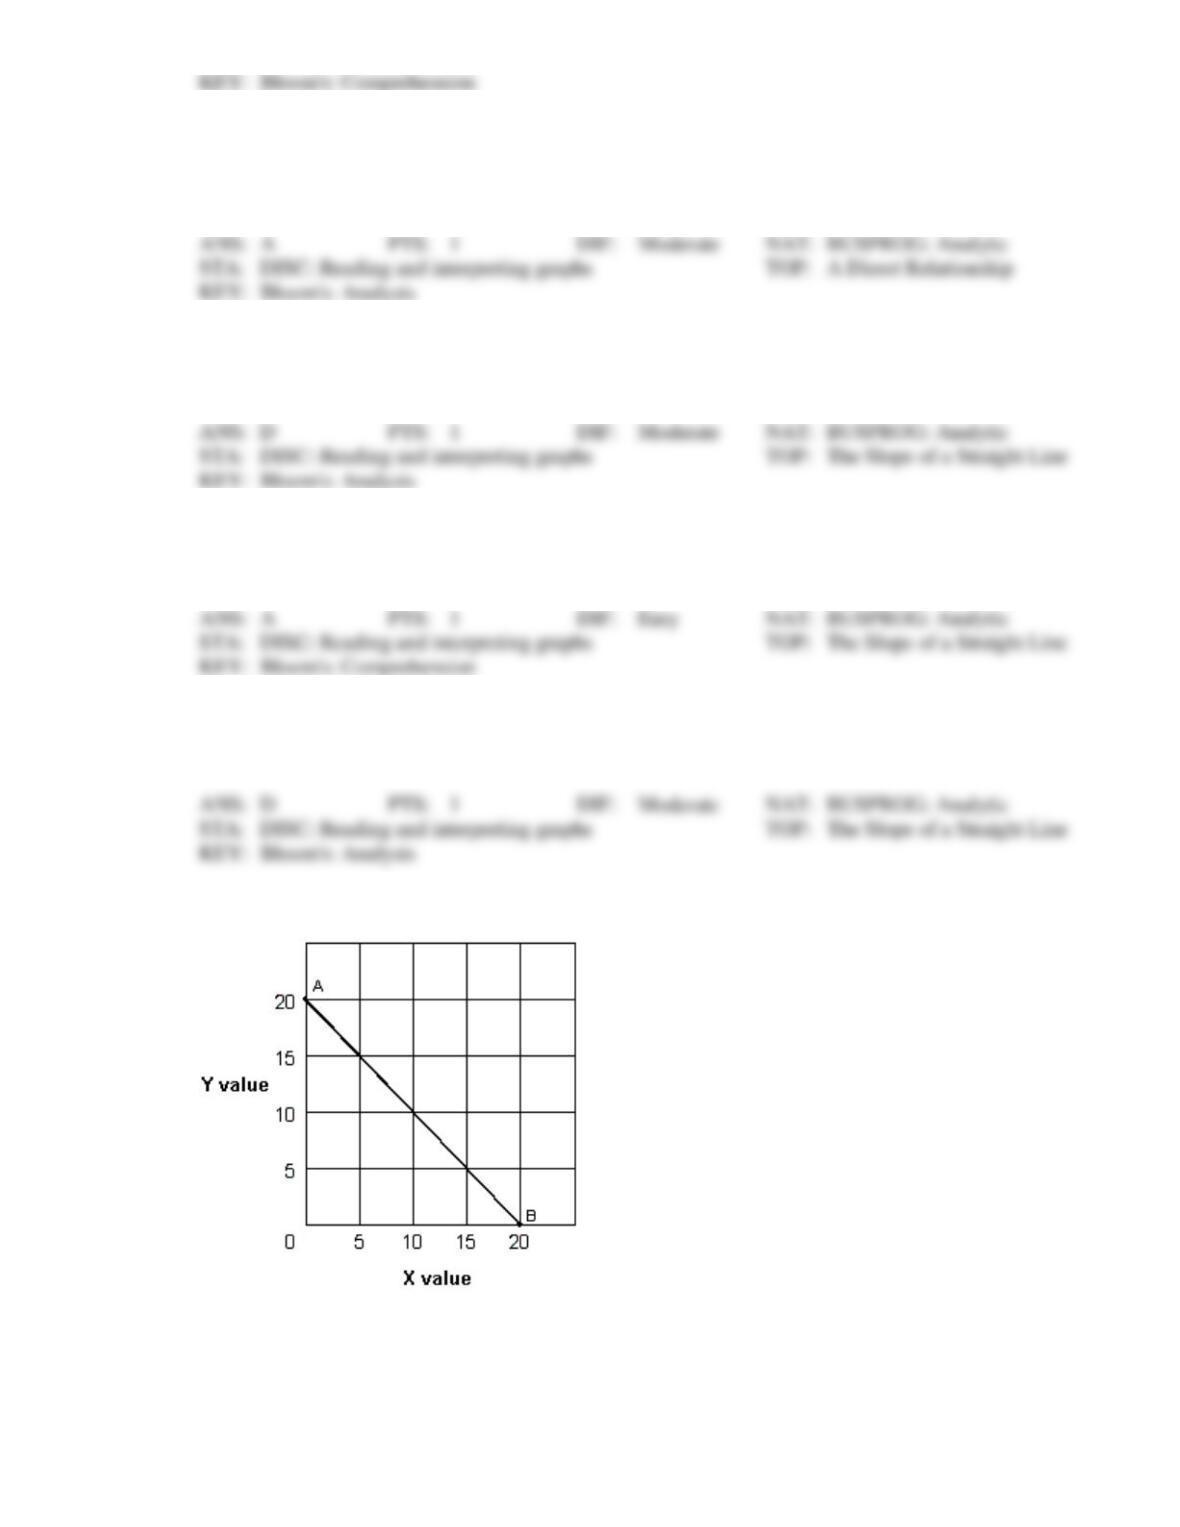
Exhibit 1A-1 Straight line
15. In Exhibit 1A-1, as X increases along the horizontal axis, corresponding to points A-B on the line, the
Y values increase. The relationship between the X and Y variables is:
a.
direct.
c.
independent.
b.
inverse.
d.
variable.
16. Straight line AB in Exhibit 1A-1 shows that:
a.
increasing values for X will decrease the values of Y.
b.
decreasing values for X will increase the values of Y.
c.
there is a direct relationship between X and Y.
d.
all of these.
17. In Exhibit 1A-1, the slope of straight line AB is:
a.
positive.
c.
negative.
b.
zero.
d.
variable.
18. In Exhibit 1A-1, the slope of straight line AB is:
a.
1.
c.
1/2.
b.
5.
d.
−1.
19. As shown in Exhibit 1A-1, the slope of straight line AB:
a.
decreases with increases in X.
c.
increases with decreases in X.
b.
increases with increases in X.
d.
remains constant with changes in X.
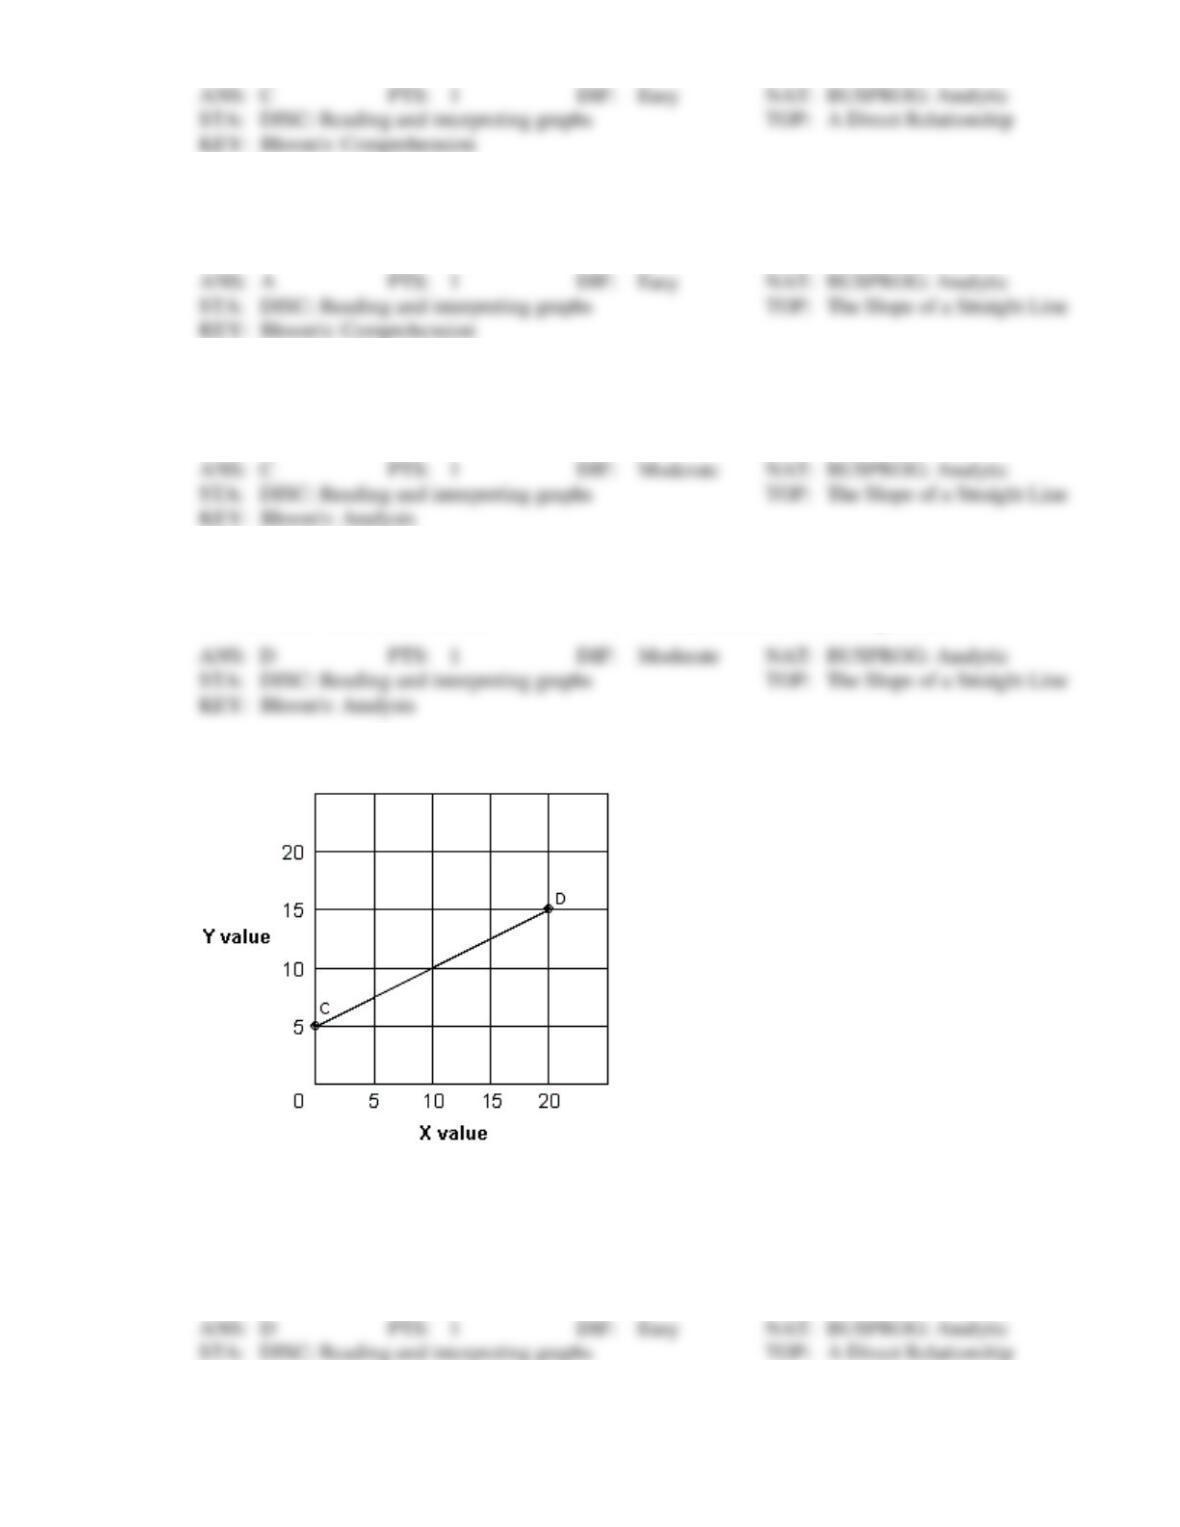
Exhibit 1A-2 Straight line
20. Straight line CD in Exhibit 1A-2 shows that:
a.
increasing values for X will increase the value of Y.
b.
decreasing values for X will decrease the value of Y.
c.
there is a direct relationship between X and Y.
d.
all of these.
21. In Exhibit 1A-2, as X increases along the horizontal axis, corresponding to points C-D on the line, the
Y values increase. The relationship between the X and Y variables is:
a.
direct.
c.
independent.
b.
inverse.
d.
variable.
22. In Exhibit 1A-2, the slope of straight line CD is:
a.
3.
c.
−1.
b.
1.
d.
1/2.
23. In Exhibit 1A-2, the slope of straight line CD is:
a.
positive.
c.
negative.
b.
zero.
d.
variable.
24. As shown in Exhibit 1A-2, the slope of straight line CD:
a.
decreases with increases in X.
c.
increases with decreases in X.
b.
increases with increases in X.
d.
remains constant with changes in X.
Exhibit 1A-3 Straight line
25. Straight line AB in Exhibit 1A-3 shows that:
a.
increasing values for X reduces the value of Y.
b.
decreasing values for X increases the value of Y.
c.
there is an inverse relationship between X and Y.
d.
all of these.
26. In Exhibit 1A-3, as X increases along the horizontal axis, corresponding to points A-B on the line, the
Y values decrease. The relationship between the X and Y variables is:
a.
direct.
c.
independent.
b.
inverse.
d.
variable.
27. As shown in Exhibit 1A-3, the slope of straight line AB:
a.
decreases with increases in X.
c.
increases with decreases in X.
b.
increases with increases in X.
d.
remains constant with changes in X.
28. In Exhibit 1A-3, the slope for straight line AB is:
a.
3.
c.
−1.
b.
1.
d.
−5.
29. In Exhibit 1A-3, the slope of straight line AB is:
a.
positive.
c.
negative.
b.
zero.
d.
variable.
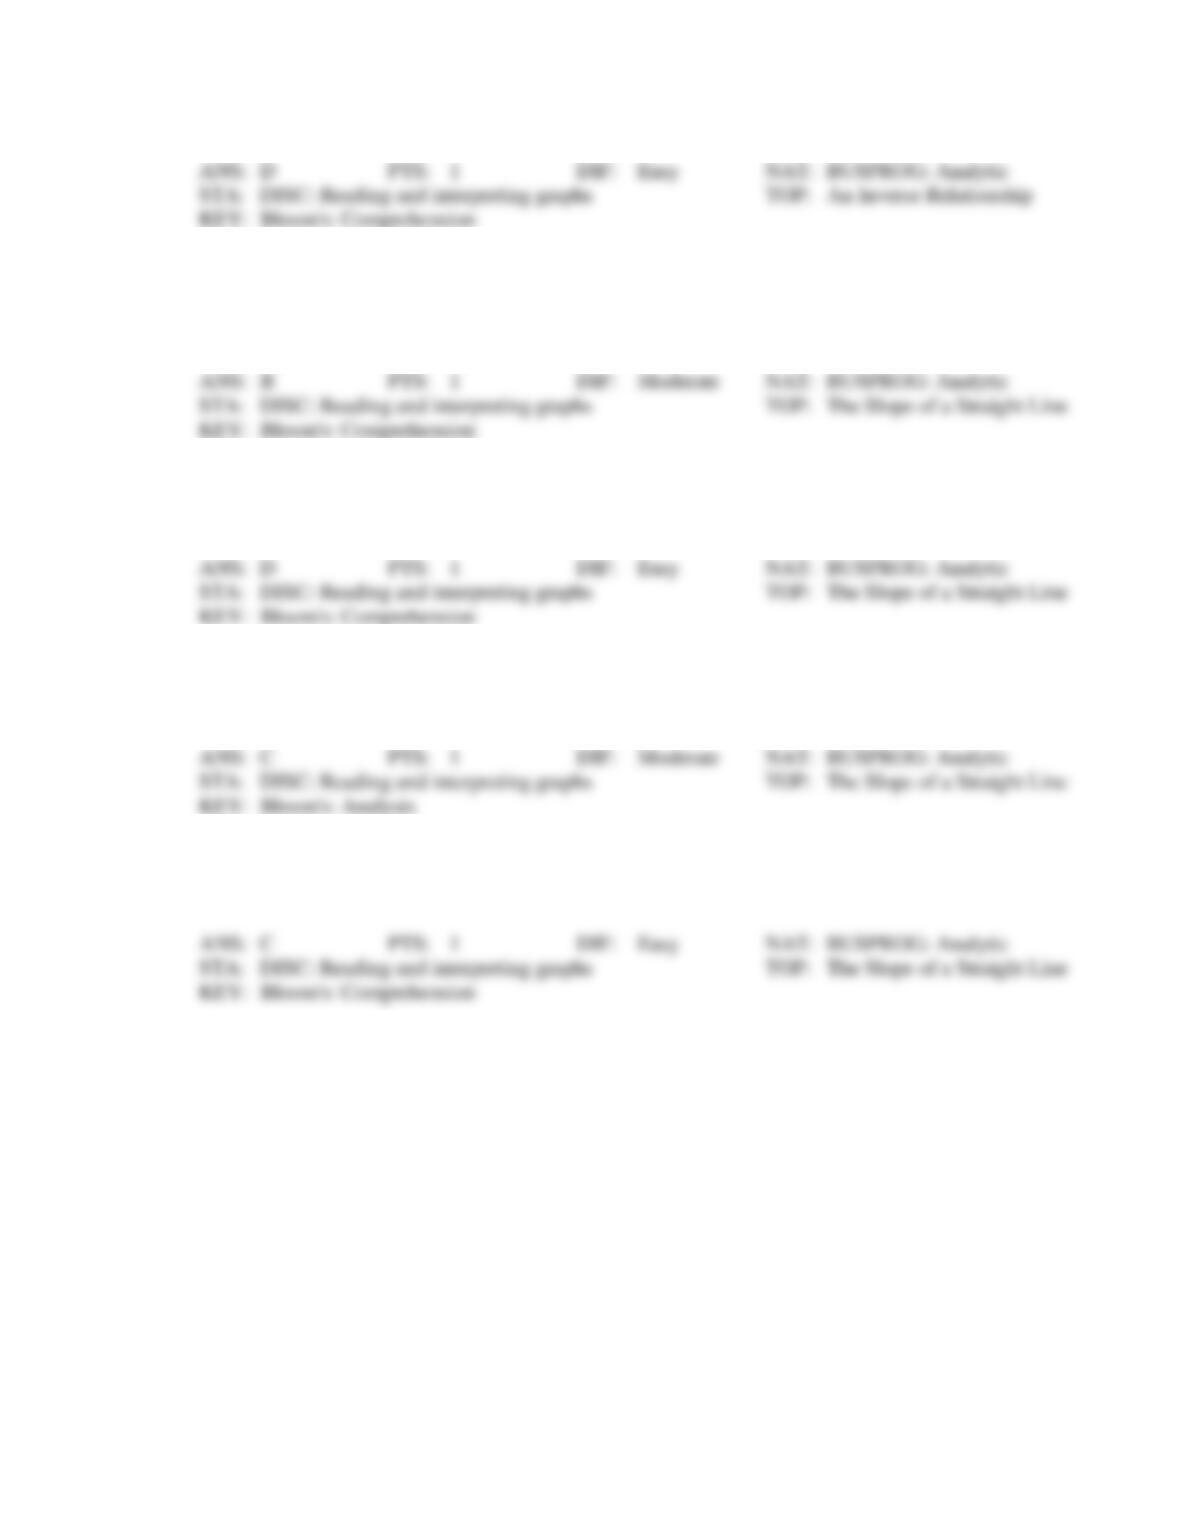
Exhibit 1A-4 Straight line
30. In Exhibit 1A-4, the slope of the straight line A-D is:
a.
0.
c.
1/2.
b.
1.
d.
−1.
31. Straight line A-D in Exhibit 1A-4 shows that:
a.
increasing value for X will increase the value of Y.
b.
increasing value for X will decrease the value of Y.
c.
increasing values for X do not affect the value of Y.
d.
all of these.
32. In Exhibit 1A-4, the slope of straight line A-D is:
a.
positive.
c.
negative.
b.
zero.
d.
variable.
33. In Exhibit 1A-4, as X increases along the horizontal axis, corresponding to points A-D on the line, the
Y value remains unchanged at 40 units. The relationship between the X and Y variables is:
a.
direct.
c.
independent.
b.
inverse.
d.
undefined.
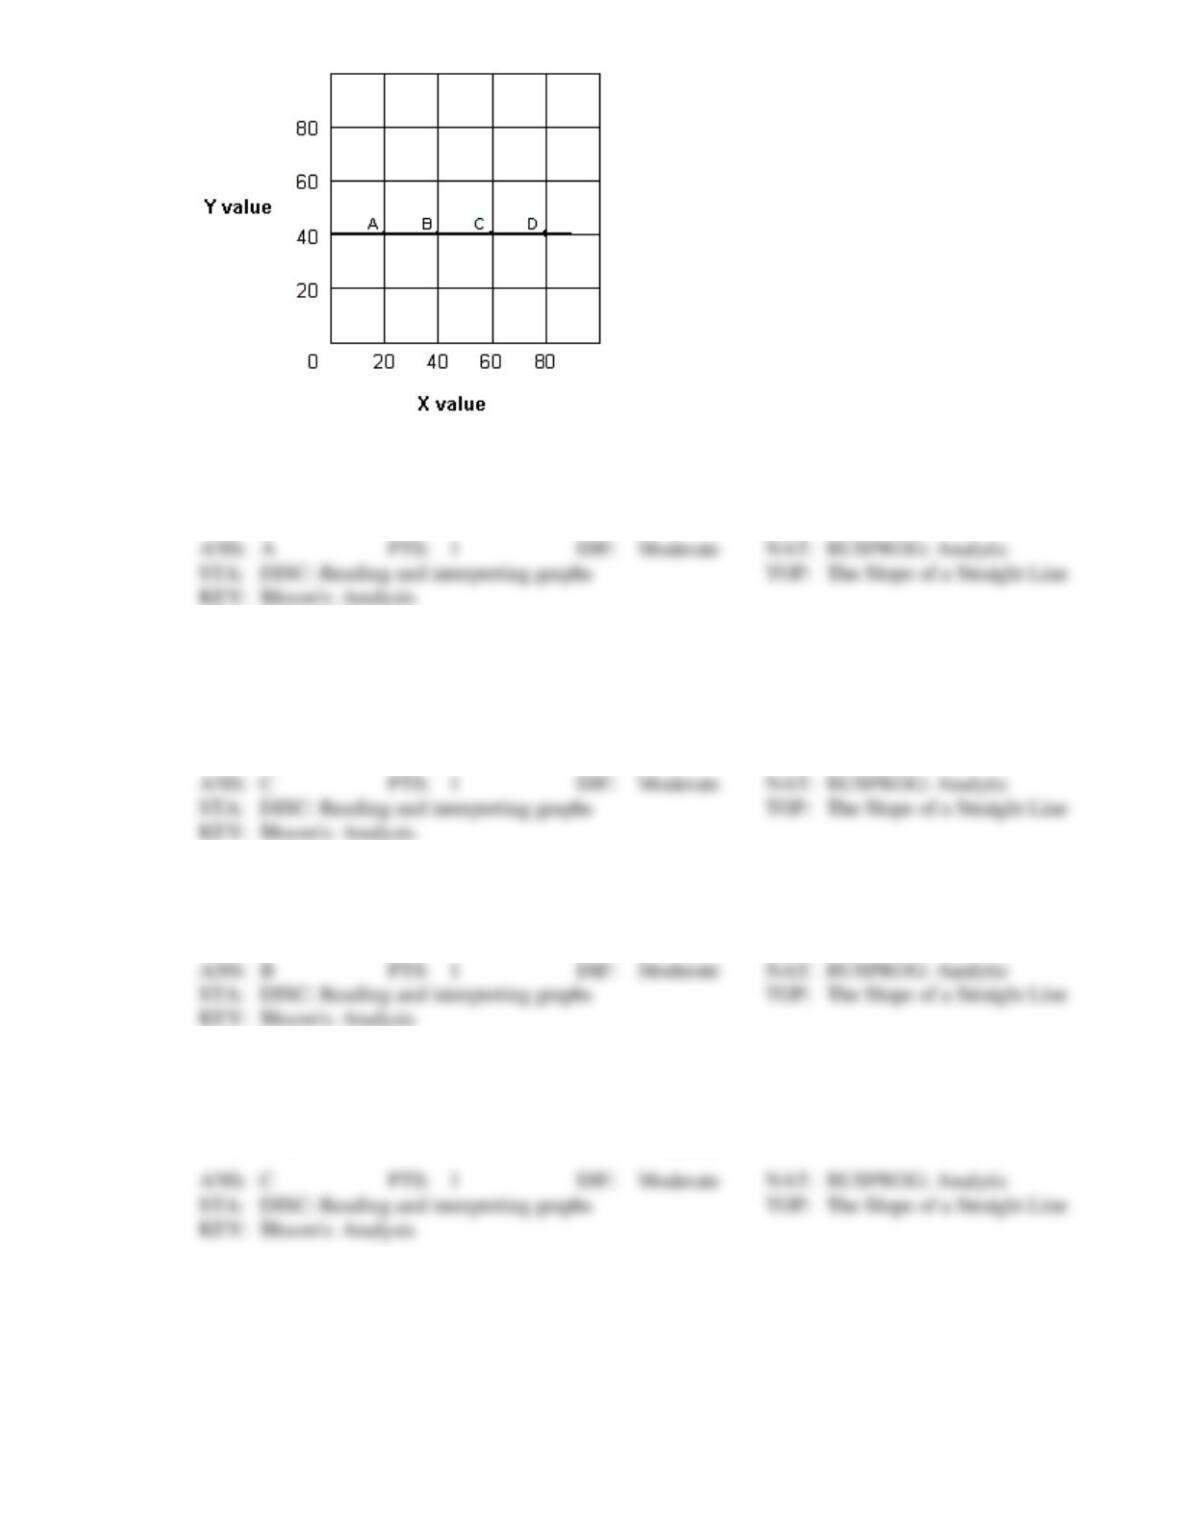
Exhibit 1A-5 Straight line
34. Straight line CD in Exhibit 1A-5 shows that:
a.
increasing values for X increases the value of Y.
b.
decreasing values for X decreases the value of Y.
c.
there is an inverse relationship between X and Y.
d.
all of these.
35. In Exhibit 1A-5, as X increases along the horizontal axis, corresponding to points C-D on the line, the
Y values decrease. The relationship between the X and Y variables is:
a.
direct.
c.
independent.
b.
inverse.
d.
variable.
36. In Exhibit 1A-5, the slope of straight line CD is:
a.
positive.
c.
negative.
b.
zero.
d.
variable.
37. In Exhibit 1A-5, the slope for straight line CD is:
a.
5.
c.
−1.
b.
1.
d.
−5.
38. As shown in Exhibit 1A-5, the slope of straight line CD:
a.
decreases with increases in X.
c.
increases with decreases in X.
b.
increases with increases in X.
d.
remains constant with changes in X.
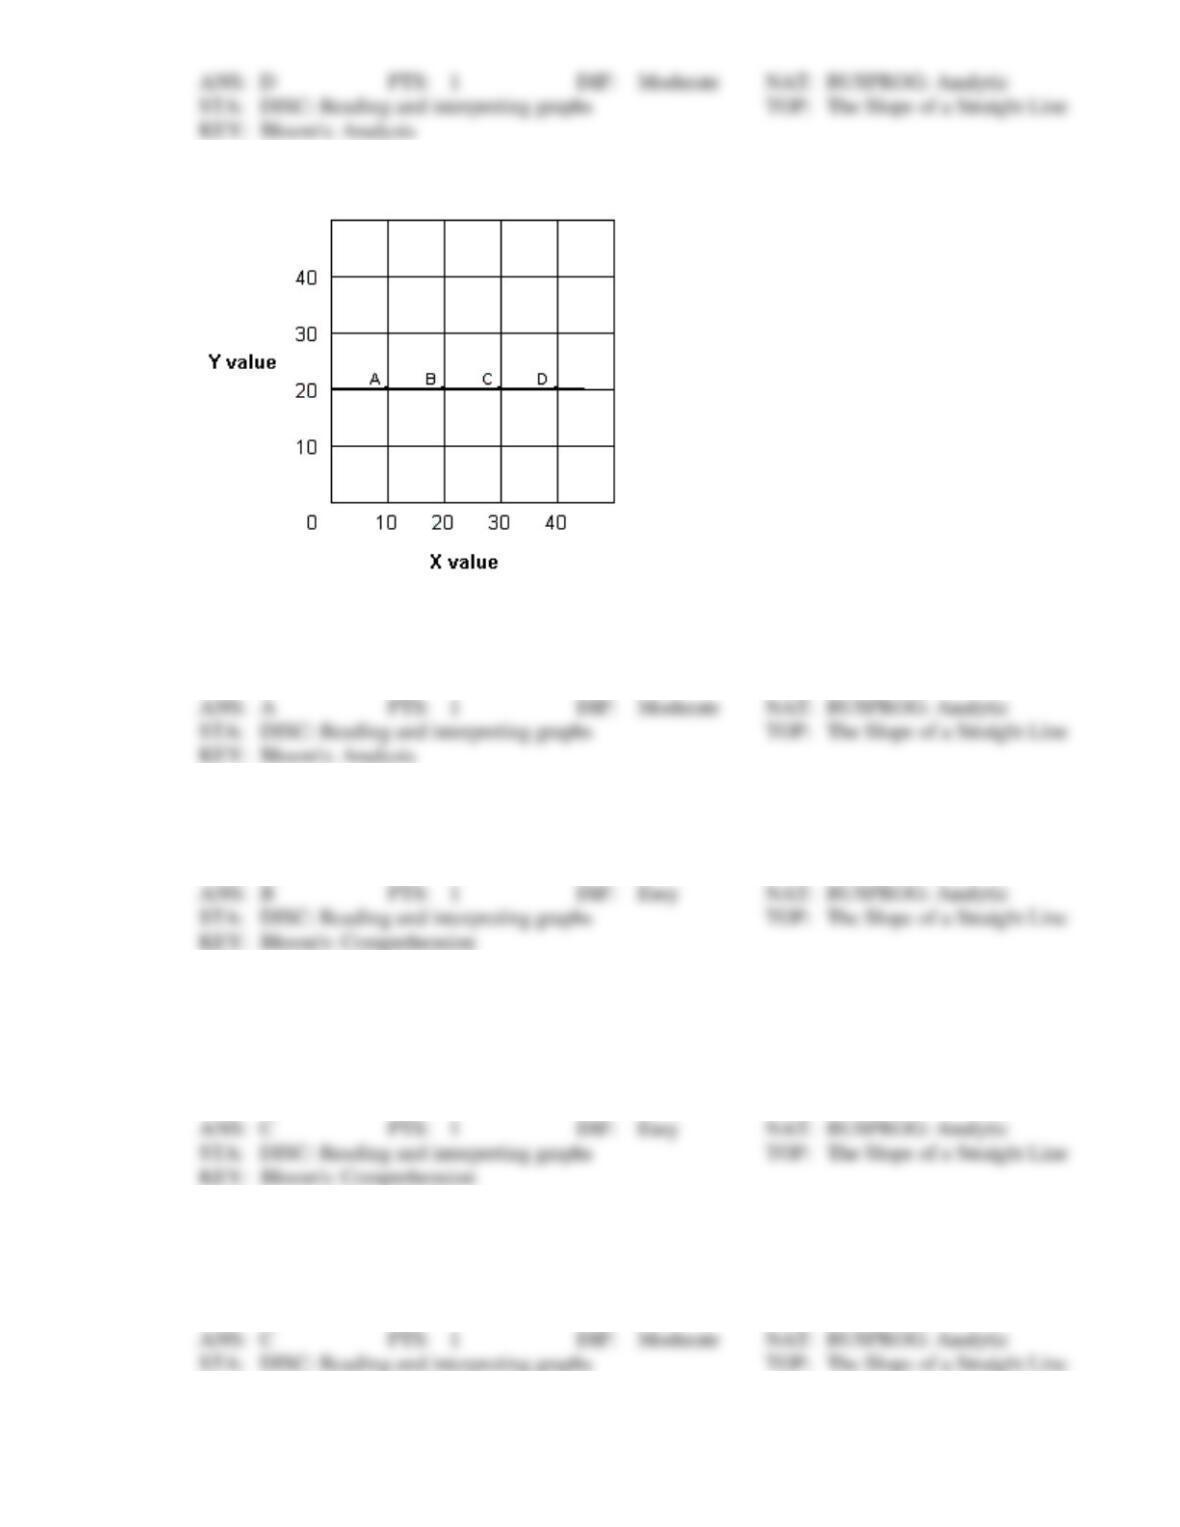
Exhibit 1A-6 Straight line
39. In Exhibit 1A-6, the slope of the straight line A-D is:
a.
0.
c.
1/2.
b.
1.
d.
−1.
40. In Exhibit 1A-6, the slope of straight line A-D is:
a.
positive.
c.
negative.
b.
zero.
d.
variable.
41. Straight line A-D in Exhibit 1A-6 shows that:
a.
increasing value for X will increase the value of Y.
b.
increasing value for X will decrease the value of Y.
c.
increasing values for X does not affect the value of Y.
d.
all of these.
42. In Exhibit 1A-6, as X increases along the horizontal axis, corresponding to points A-D on the line, the
Y values remain unchanged at 20 units. The relationship between the X and Y variables is:
a.
direct.
c.
independent.
b.
inverse.
d.
undefined.
43. In Exhibit 1A-6, the slope of straight line A-D is:
a.
greater than 1.
c.
less than 1.
b.
equal to 1.
d.
zero.
44. In a graphic relationship, shifts in a curve are caused by a change in:
a.
the slope of the curve.
b.
a factor not measured on the axes of the graph.
c.
one of the factors measured on either axes of the graph.
d.
any factor, whether measured on the axes of the graph of not.
45. A shift in a curve represents a change in:
a.
the variable on the horizontal axis.
b.
the variable on the vertical axis.
c.
a third variable that is not on either axis.
d.
any variable that is relevant to the relationship being graphed.
46. A change in a third variable not on either axis of a graph is illustrated with a:
a.
horizontal or vertical line.
c.
shift of a curve.
b.
movement along a curve.
d.
point of intersection.
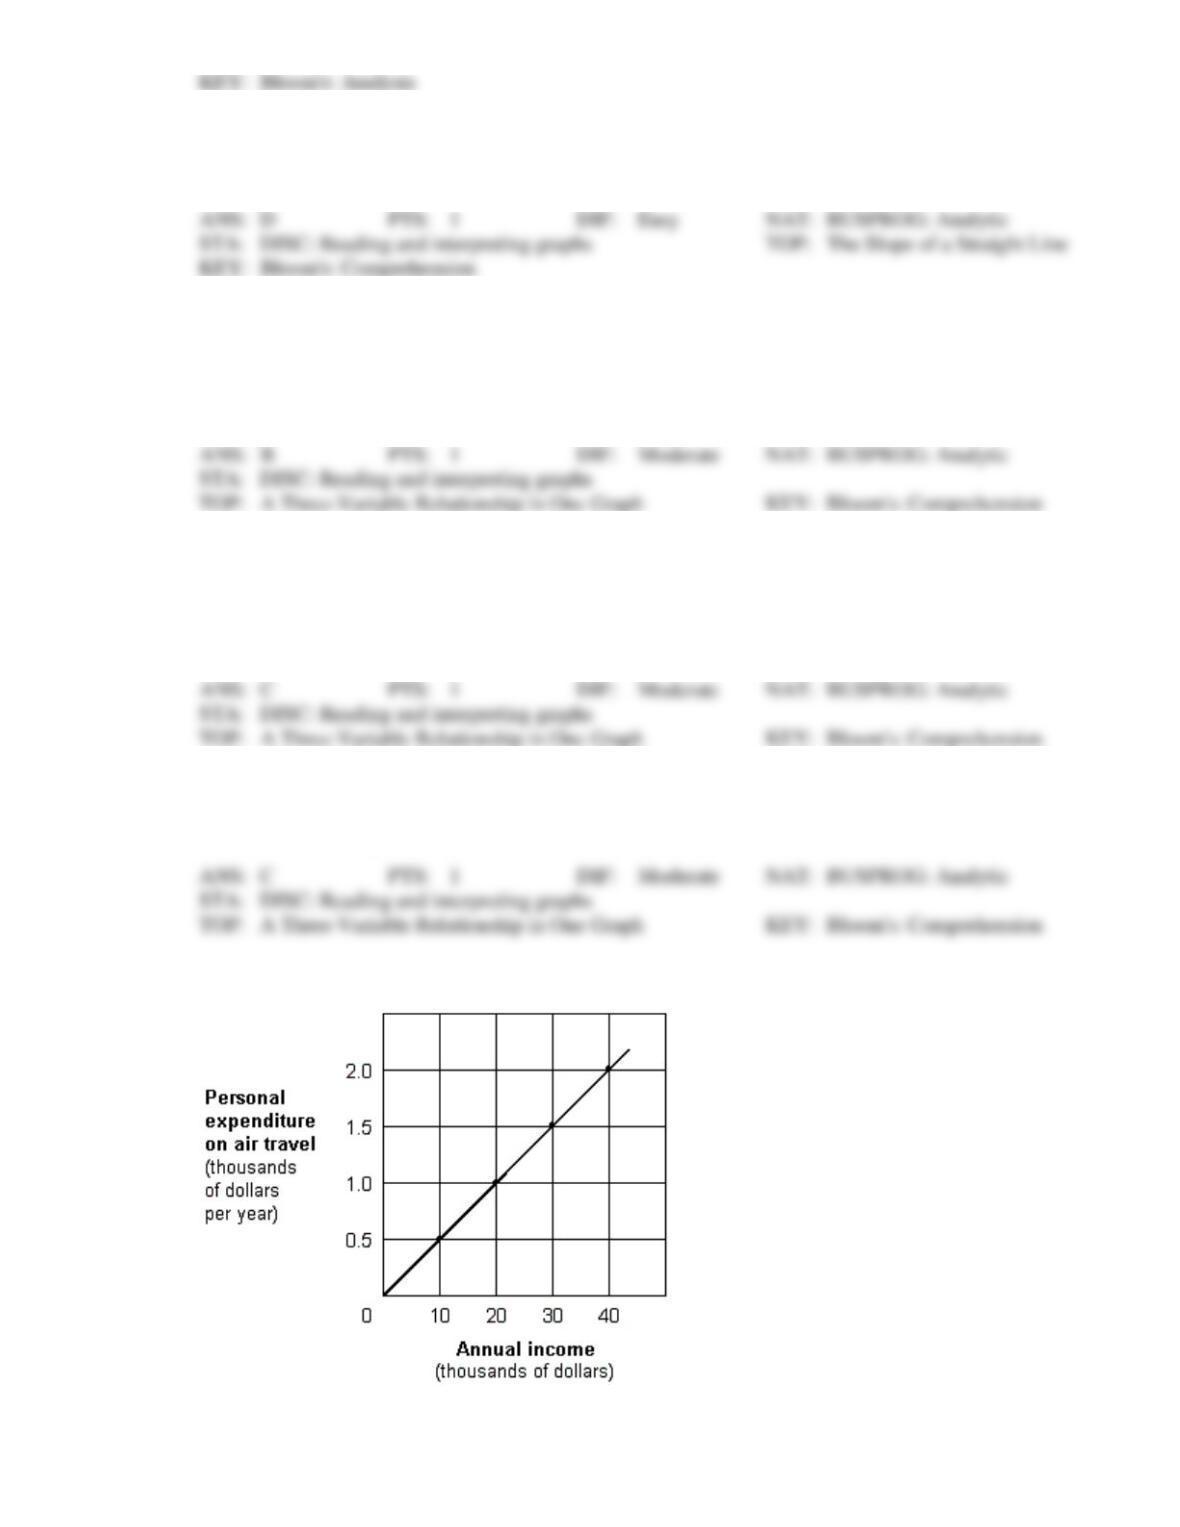
Exhibit 1A-7 Straight line relationship
47. According to Exhibit 1A-7, the relationship between annual income and air-travel expenditures is:
a.
direct.
c.
complex.
b.
inverse.
d.
independent.
48. What is the slope of the line shown in Exhibit 1A-7?
a.
1/20.
c.
1/5.
b.
1/10.
d.
1/2.
49. Which of the following would cause a shift in the relationship shown in Exhibit 1A-7?
a.
A rise in people’s annual income.
b.
A rise in people’s expenditure on air travel.
c.
A rise in the price of air travel.
d.
All of these would shift the line in the graph.
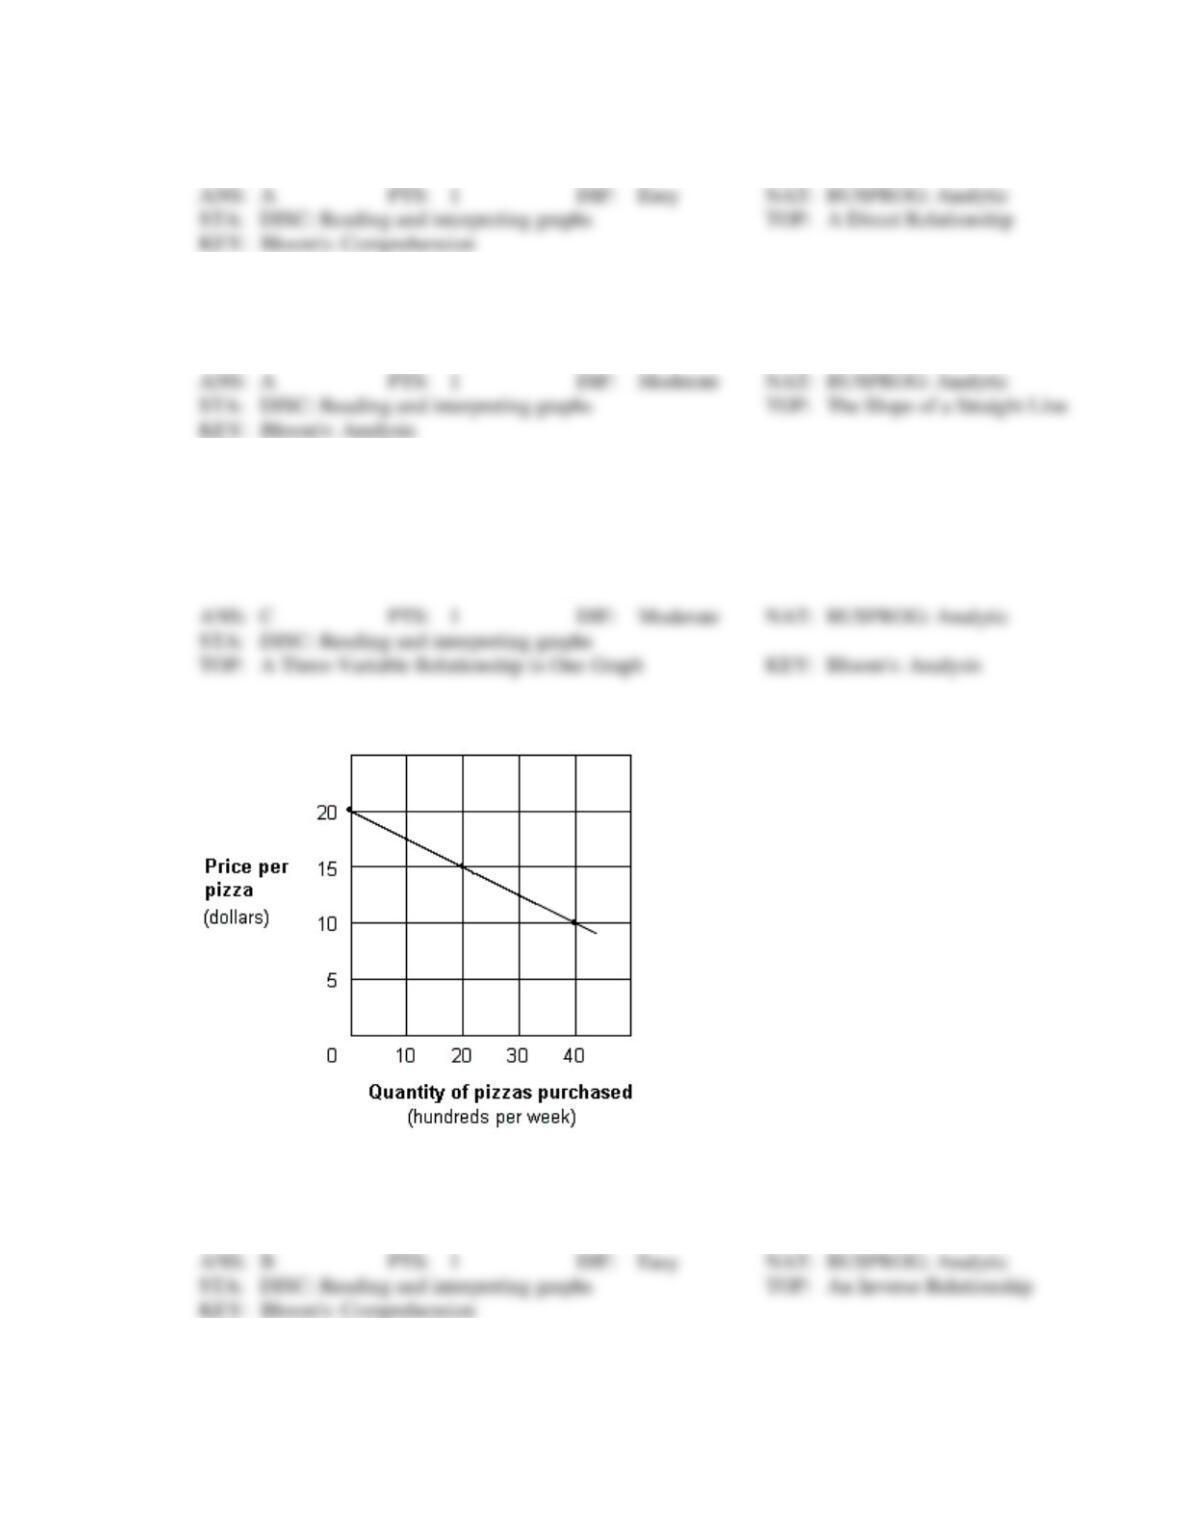
Exhibit 1A-8 Straight line relationship
50. According to the Exhibit 1A-8, the relationship between the price and quantity purchased of pizza is:
a.
direct.
c.
complex.
b.
inverse.
d.
independent.
51. What is the slope of the line shown in Exhibit 1A-8?
a.
−1.
c.
−1/4.
b.
−1/2.
d.
0.
52. Which of the following would cause a shift in the relationship shown in Exhibit 1A-8?
a.
A fall in household incomes.
b.
A fall in the price of pizza.
c.
A fall in the quantity of pizza that people wish to purchase.
d.
All of these would shift the line in the graph.
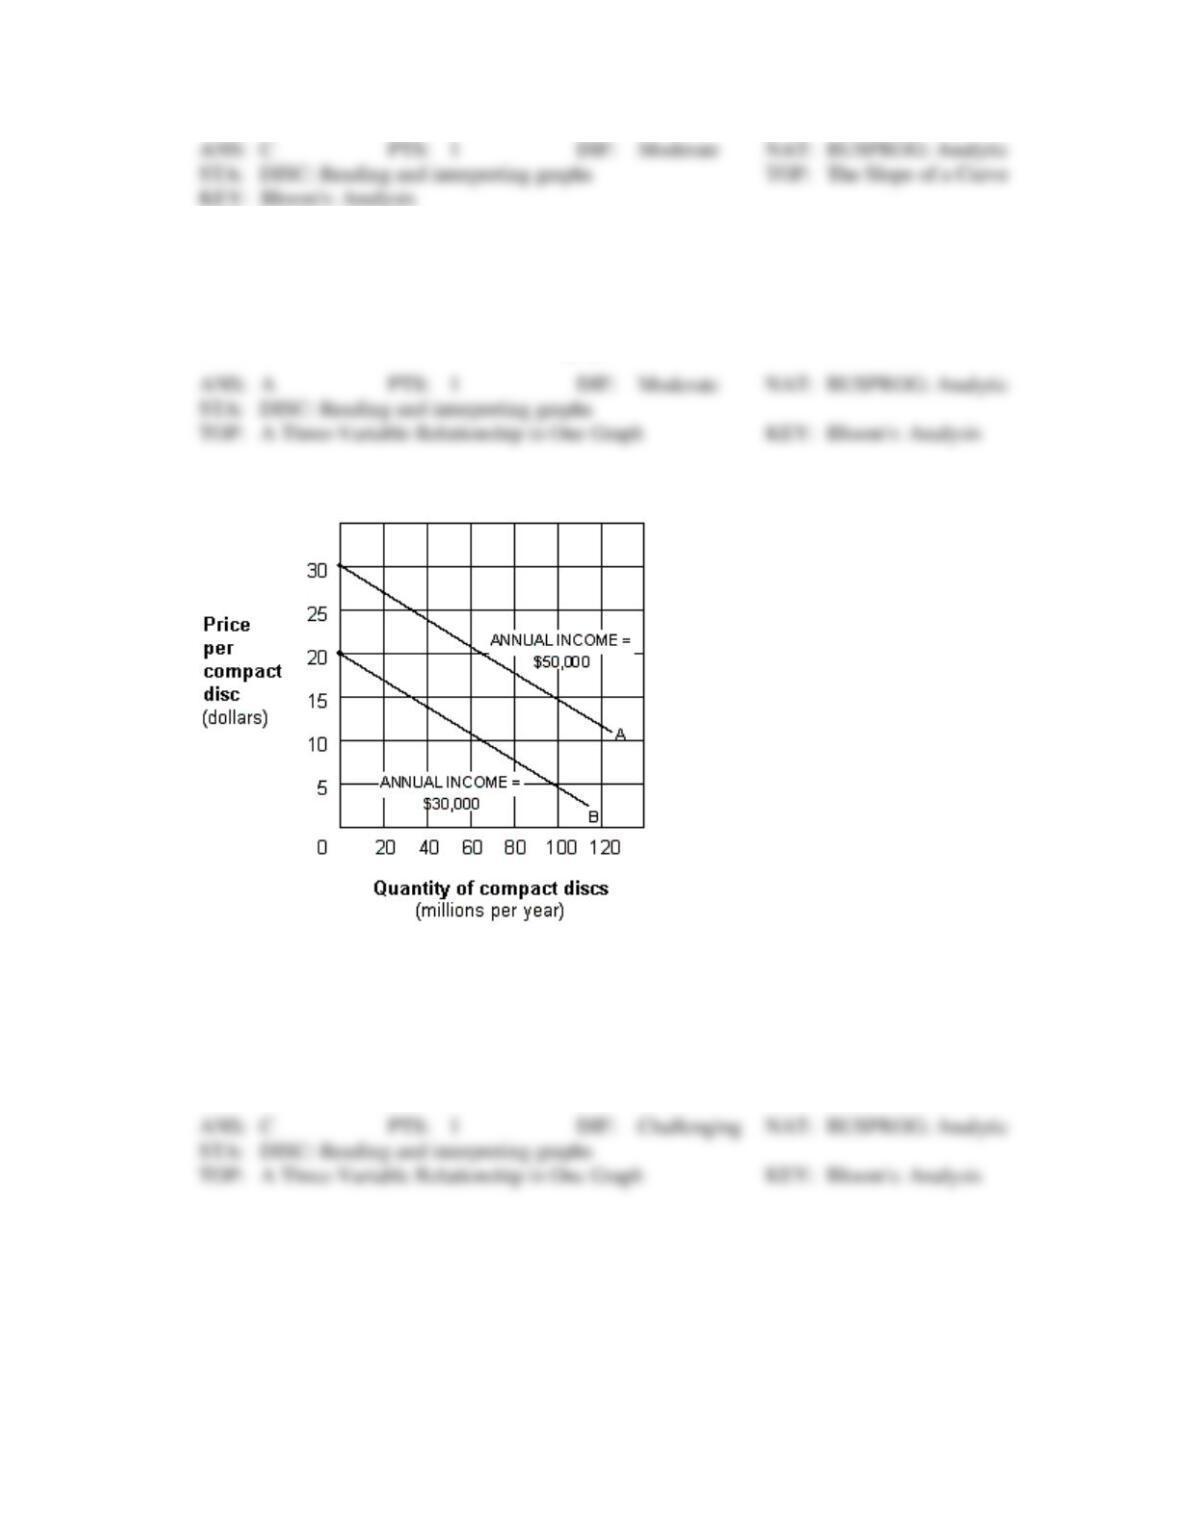
Exhibit 1A-9 Multi-curve graph
53. Exhibit 1A-9 represents a three-variable relationship. As the annual income of consumers falls from
$50,000 (line A) to $30,000 (line B), the result is a:
a.
rightward movement along each curve.
b.
leftward movement along each curve,.
c.
leftward shift in curve A to curve B.
d.
rightward shift in curve A to curve B.
Exhibit 1A-10 Multi-curve graph
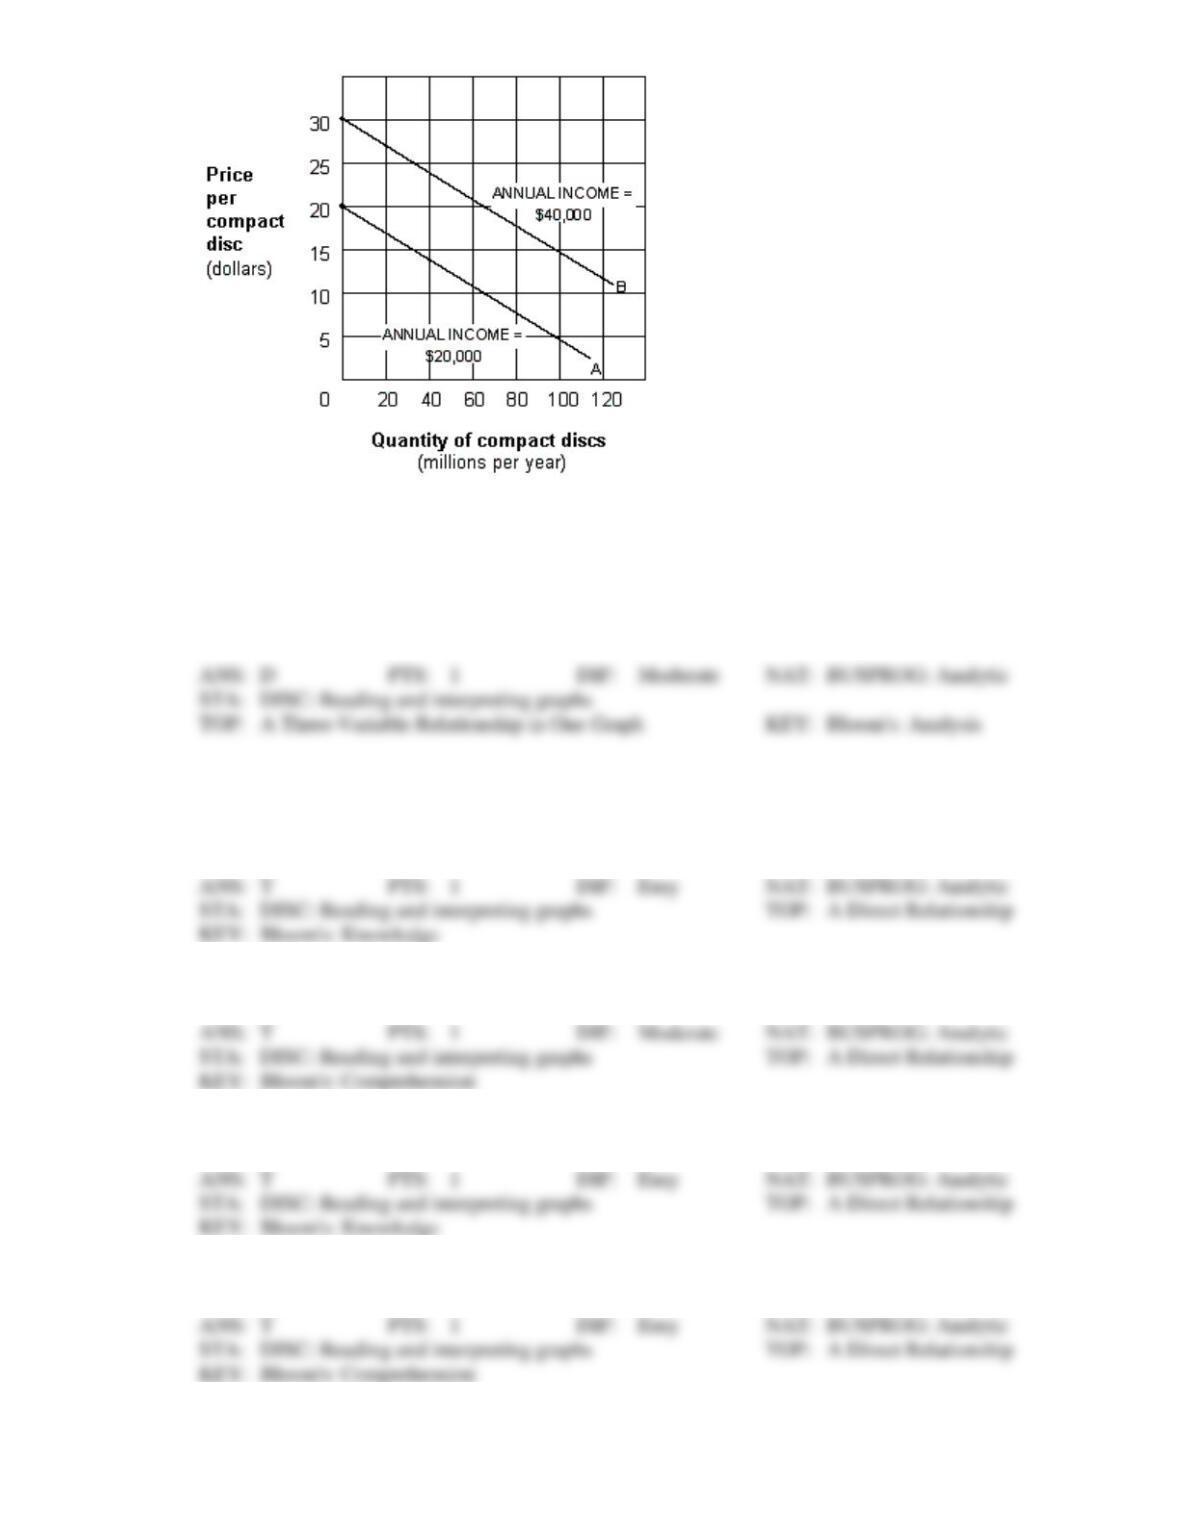
54. Exhibit 1A-10 represents a three-variable relationship. As the annual income of consumers rises from
$20,000 (line A) to $40,000 (line B), the result is a:
a.
rightward movement along each curve.
b.
leftward movement along each curve.
c.
leftward shift in curve B to curve A.
d.
leftward shift in curve A to curve B.
TRUE/FALSE
1. A graph is one method of expressing a model.
2. Direct relationships are illustrated using upward-sloping lines and curves.
3. The graph of a direct relationship will have a positive slope.
4. An upward-sloping straight line exhibits a direct relationship between two variables.
5. A downward-sloping straight line exhibits a direct relationship between two variables.
6. If two variables are inversely related, then they change in the same direction.
7. Two variables that are inversely related tend to move in opposite directions.
8. The slope of a line is calculated as the ratio of the “rise” over the “run”.
9. A horizontal line has an infinite slope.
10. A downward-sloping line has a negative slope.
11. A straight line or curve can shift when a factor not included on the vertical axis or horizontal axis
changes.
12. A graph can be used to illustrate the relationship between the price of compact discs and the quantity
of compact discs demanded. If there is evidence that buyers’ income also influences the demand for
compact discs, then a movement along the curve can be caused by a change in the price of compact
discs.
ESSAY
1. Distinguish a direct and an inverse or negative relationship. Provide an example of each type of
relationship.
2. Graphically express a direct and an inverse or negative relationship. What could cause a shift in a line
or curve expressing a relationship between two variables?