
OM5 Test Bank Supplementary Chapter D 1
Supplementary Chapter D — Simulation
TRUE/FALSE
1. In general, as the number of probabilistic components of a system increases, the more likely it is that
simulation will be the best analysis approach.
2. A disadvantage of a simulation model is that its structuring is highly dependent on the expertise of
the modeler.
3. The queuing model’s operating characteristic formulas only characterize short-term average results
and, in many practical situations, managers are interested in understanding long-term dynamic
behaviors of queuing systems.
4. The Excel function RAND( ) generates random numbers that provide a continuous range of values.
Unlike those for two-digit numbers, these values are not limited to probability increments of 0.01.
5. Balking means a customer will join the waiting line if it is too long.
6. With a fixed-time-increment simulation model, detailed information is lost.
7. If variable demand were the only source of uncertainty, the order-quantity and reorder-point
decision could be based on a single-period inventory model.
8. There is no single test to prove that a model is 100 percent valid.
9. Face validity means the programmers agree to a model’s logic.
10. Face validity can be strengthened by maintaining good communication with the user during the
model development stages.
11. Spreadsheets are extremely strong in their ability to conduct dynamic simulation analysis.

OM5 Test Bank Supplementary Chapter D 2
12. A simulator is a general-purpose simulation model.
13. Simulation can guarantee an optimal solution.
MULTIPLE CHOICE
1. A _____ traces the detailed logic or actions that occur in a system in a step-by-step fashion over
time.
a.
current-event time model
b.
variable-time-increment model
c.
system simulation model
d.
static regression model
2. Which of the following is NOT an advantage of simulation?
a.
It provides a convenient experimental laboratory.
b.
It can perform “what-if” studies.
c.
It does not disrupt the current process.
d.
It guarantees accuracy of outputs.
3. All of the following are disadvantages of simulation EXCEPT difficulty of:
a.
performing “what-if” studies.
b.
collecting the appropriate input data.
c.
selecting the correct probability distribution.
d.
producing accurate outputs.
4. Using two-digit random numbers, the interval 55–79 represents the probability of _____.
a.
0.55 to 0.79
b.
0.25
c.
0.24
d.
0.67
5. Which of the following statements is TRUE regarding next-event simulation models?
a.
They are used less commonly in practice than fixed-time simulation models.
b.
They are the basis for most commercial simulation software.
c.
They increment time by the occurrence of the preceding event.
d.
They are less accurate than fixed-time-increment simulation models.
6. Needing the actual time of arrival and actual time of serving relates best with:

OM5 Test Bank Supplementary Chapter D 3
a.
fixed-time-increment simulation models.
b.
next-event simulation models.
c.
random numbers.
d.
queuing formulas.
7. Which of the following statements is CORRECT regarding a simulation model for inventory
management?
a.
Only demand varies, while the lead time remains constant.
b.
The goal is to minimize waiting time.
c.
It looks at a combination of order quantity and reorder point.
d.
It does not allow backorders of stockouts.
8. With regard to a simulation model for inventory management, all of the following are correct
EXCEPT:
a.
it results in an optimal solution with a large simulation.
b.
many days of simulation run are needed to obtain meaningful results.
c.
lead time can vary.
d.
it assumes that a specific reorder point and order quantity have been selected.
9. A computer implementation free from logical errors and bugs refers to:
a.
verification.
b.
validation.
c.
customization.
d.
estimation.
10. Validation consists of all of the following EXCEPT:
a.
developing a model with high face validity.
b.
validating model assumptions.
c.
developing logical flowcharts.
d.
validating model output.
11. All of the following are verification techniques EXCEPT:
a.
developing logical flowcharts.
b.
developing a model with high face validity.
c.
conceptualizing a problem into smaller pieces or modules.
d.
enabling people other than the programmer to check codes.
12. All of the following are simulation languages EXCEPT:
a.
Arena.
b.
GPSS (General Purpose Systems Simulator).
c.
ProcessModel.
d.
SystemModel.
OM5 Test Bank Supplementary Chapter D 4
SHORT ANSWER
1. Define simulation and give some operations management examples.
2. Discuss two advantages and three disadvantages of simulation models.
3. Explain the major differences between a fixed-time and a next-event simulation model.
4. When would an analytical queuing model be used? When would a simulation model be used?
5. Differentiate between verification and validation. Discuss the most objective and scientific means of
validation.
6. Discuss a simulator. Provide appropriate examples.
PROBLEM
1. The table below shows the frequency of service times for a drive-through window.
Service Time (minutes)
Frequency
1
2
2
6
3
8
4
13
5
13
6
7
7
1
a. If the first category (service time of 1 minute) started with random number 00, determine the
random numbers for a service time for Category 5, five minutes.
b. Determine the random numbers for a service time of seven minutes if the first category starts at
random number 00.
2. A lumber company sells 8-foot 2×4’s to construction companies in three states. They have historical
sales demand (in thousands) for the past 26 weeks, as shown below:
Historical
Number of
Relative
Sales ($000)
Weeks Sold
Frequency
5–10
5
.19
11–20
7
.27
21–30
8
.31
31–40
6
.23
They are interested in determining the average number of sales per category for the next five weeks
using simulation. They generated the following random numbers for weeks 1-5 respectively: 63, 13,
67, 50, and 71.
a. Based on a scale of 0–99, what random number range should be allocated to sales category of 11–
20?
b. What is the average sales corresponding to week 2?
c. What is the average sales over all five weeks?
Sales
OM5 Test Bank Supplementary Chapter D 7
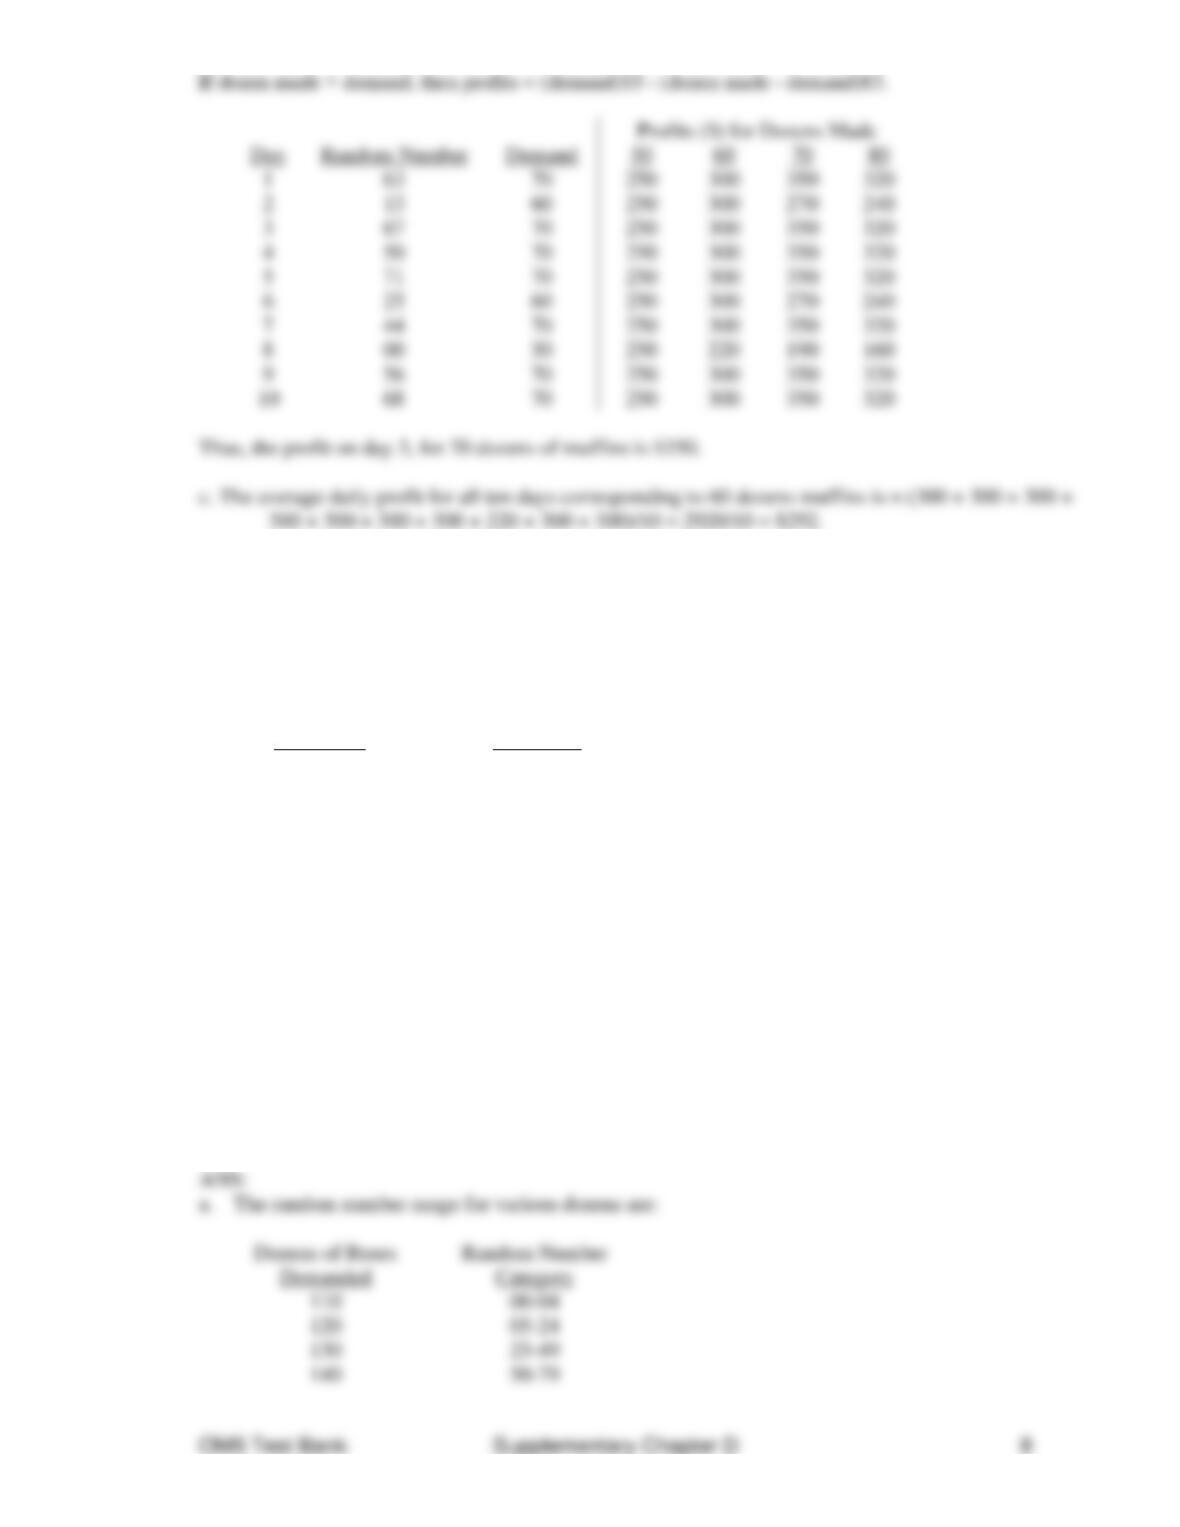
3. A pastry store wants to know how many dozens of muffins to bake each day. Every dozen they sell
fresh in the shop returns a profit of $5.00. Every dozen they bake but do not sell on the day they are
baked is given to a local charity at a loss of $3.00 a dozen. The business is fairly stable in that they
never sell less than 50 dozen nor more than 80 dozen muffins. Their sales history, rounded to the near-
est ten dozen muffins is as shown:
Dozens of
Number of Days
Muffins Sold
That Many Sold
50
12
60
37
70
45
80
18
Dozens of
They want to run a ten-day simulation for production rates of 50, 60, 70, and 80 muffins to determine
the profit (loss) for each. They generated the following random numbers for days 1–10 respectively:
63, 13, 67, 50, 71, 25, 44, 00, 56, and 68.
a. What range of random numbers corresponds to 70 muffins sold?
b. What is the profit for day 3 if they make 70 dozen muffins?
c. What is the average daily profit (for all ten days) corresponding to 60 dozen muffins made?
140
4. The Rose Warehouse buys roses each week from Panama. A toll-free long distance call is made on
Saturday night, and early Monday morning roses arrive at the airport in a box refrigerated with dry ice.
The roses cost $8 a dozen and are sold on a cash-and-carry basis for $28 a dozen. Roses left over at the
end of the week are put in a trash collector in an alley behind the store. Past sales (rounded to the near-
est ten dozen) are as follows:
Dozens of Roses
Relative
Demanded
Frequency
110
5
120
20
130
25
140
30
150
20
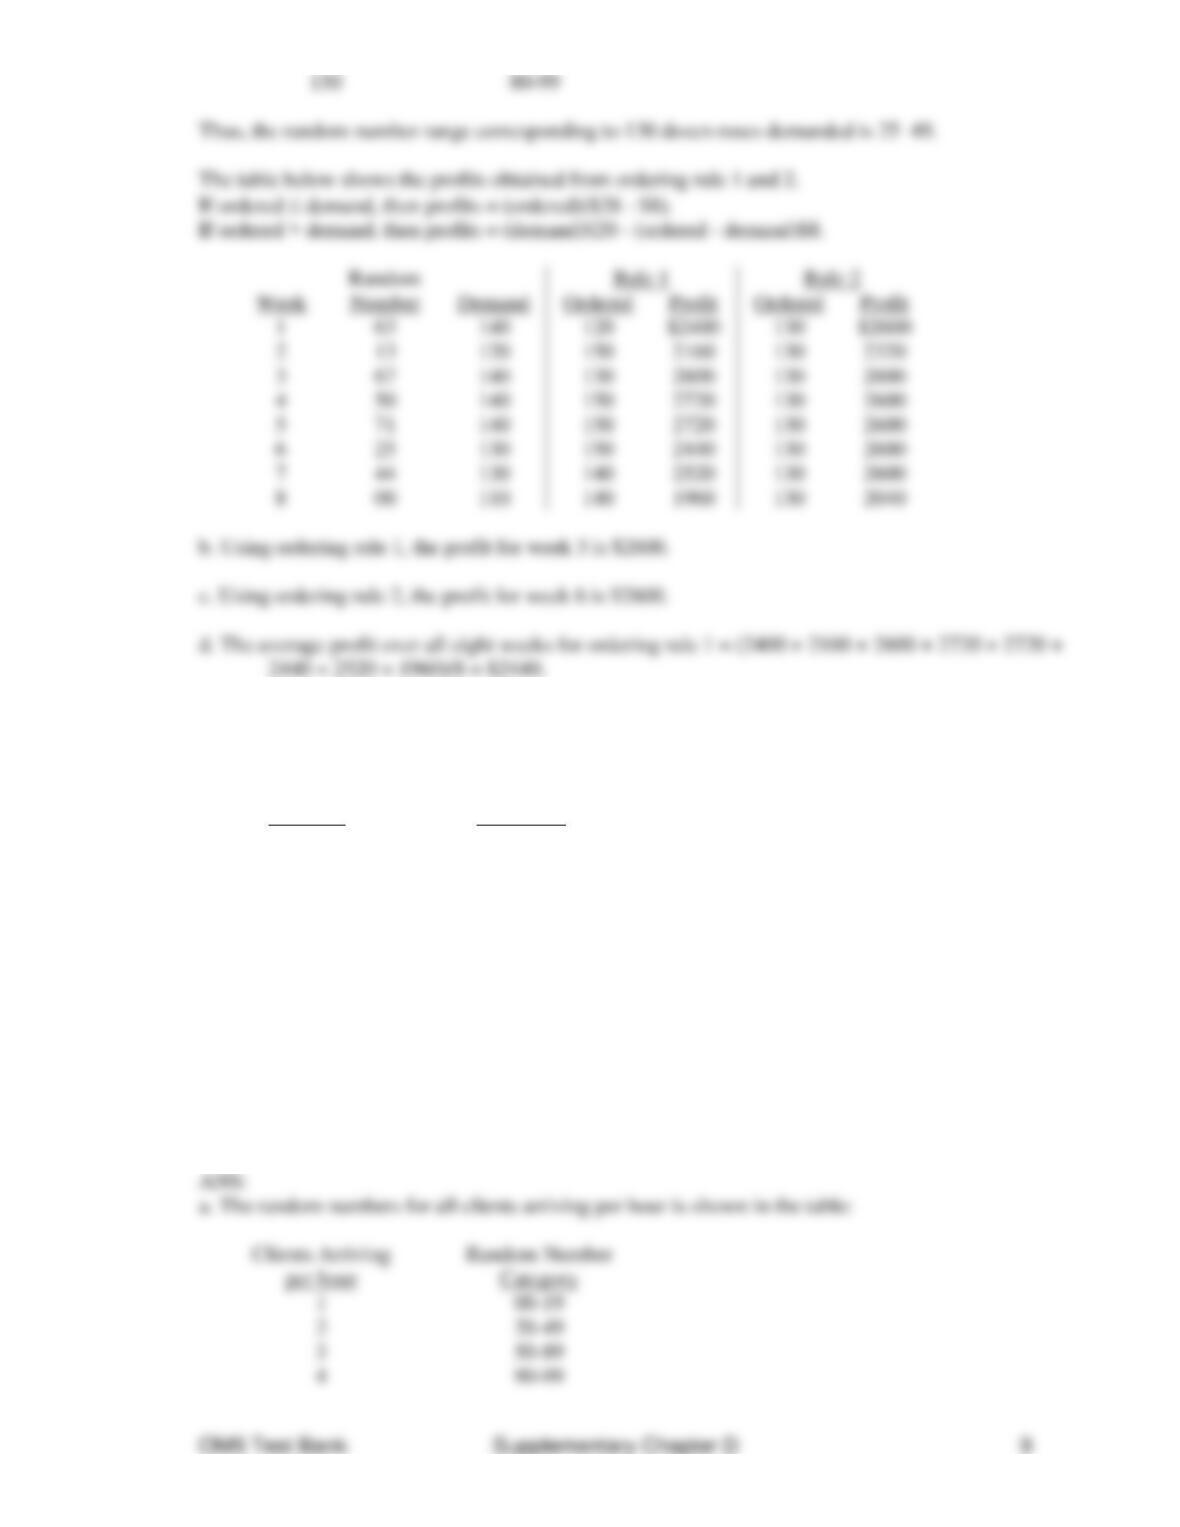
The owner of the Rose Warehouse wants to compare two ordering rules for ordering roses: (1) order
last week’s demand plus 10 dozen extra (as safety stock), (2) order 130 dozen every week. He wants to
run an eight-week simulation to compare the average weekly profit for the two rules. Last week’s de-
mand was for 110 dozen. He generated the following random numbers for weeks 1-8, respectively: 63,
13, 67, 50, 71, 25, 44, and 00.
a. What is the random number range corresponding to 130 dozen roses demanded?
b. Using ordering rule 1, what is the profit for week 3?
c. Using ordering rule 2, what is the profit for week 6?
d. What is the average profit over all eight weeks for ordering rule 1?
5. A local legal aid office provides basic legal assistance to walk-in clients. The historical arrival fre-
quency is as shown below:
Clients Arriving Relative
Per Hour Frequency
1 20%
2 30%
3 40%
4 10%
Service times are characterized by a normal distribution with a mean of 10 minutes and a standard de-
viation of 4 minutes. They are interested in using simulation to find the total amount of service time
for each hour of a six-hour working day. They generated the following random numbers for hours 1–6
respectively: 63, 13, 67, 50, 71, and 25.
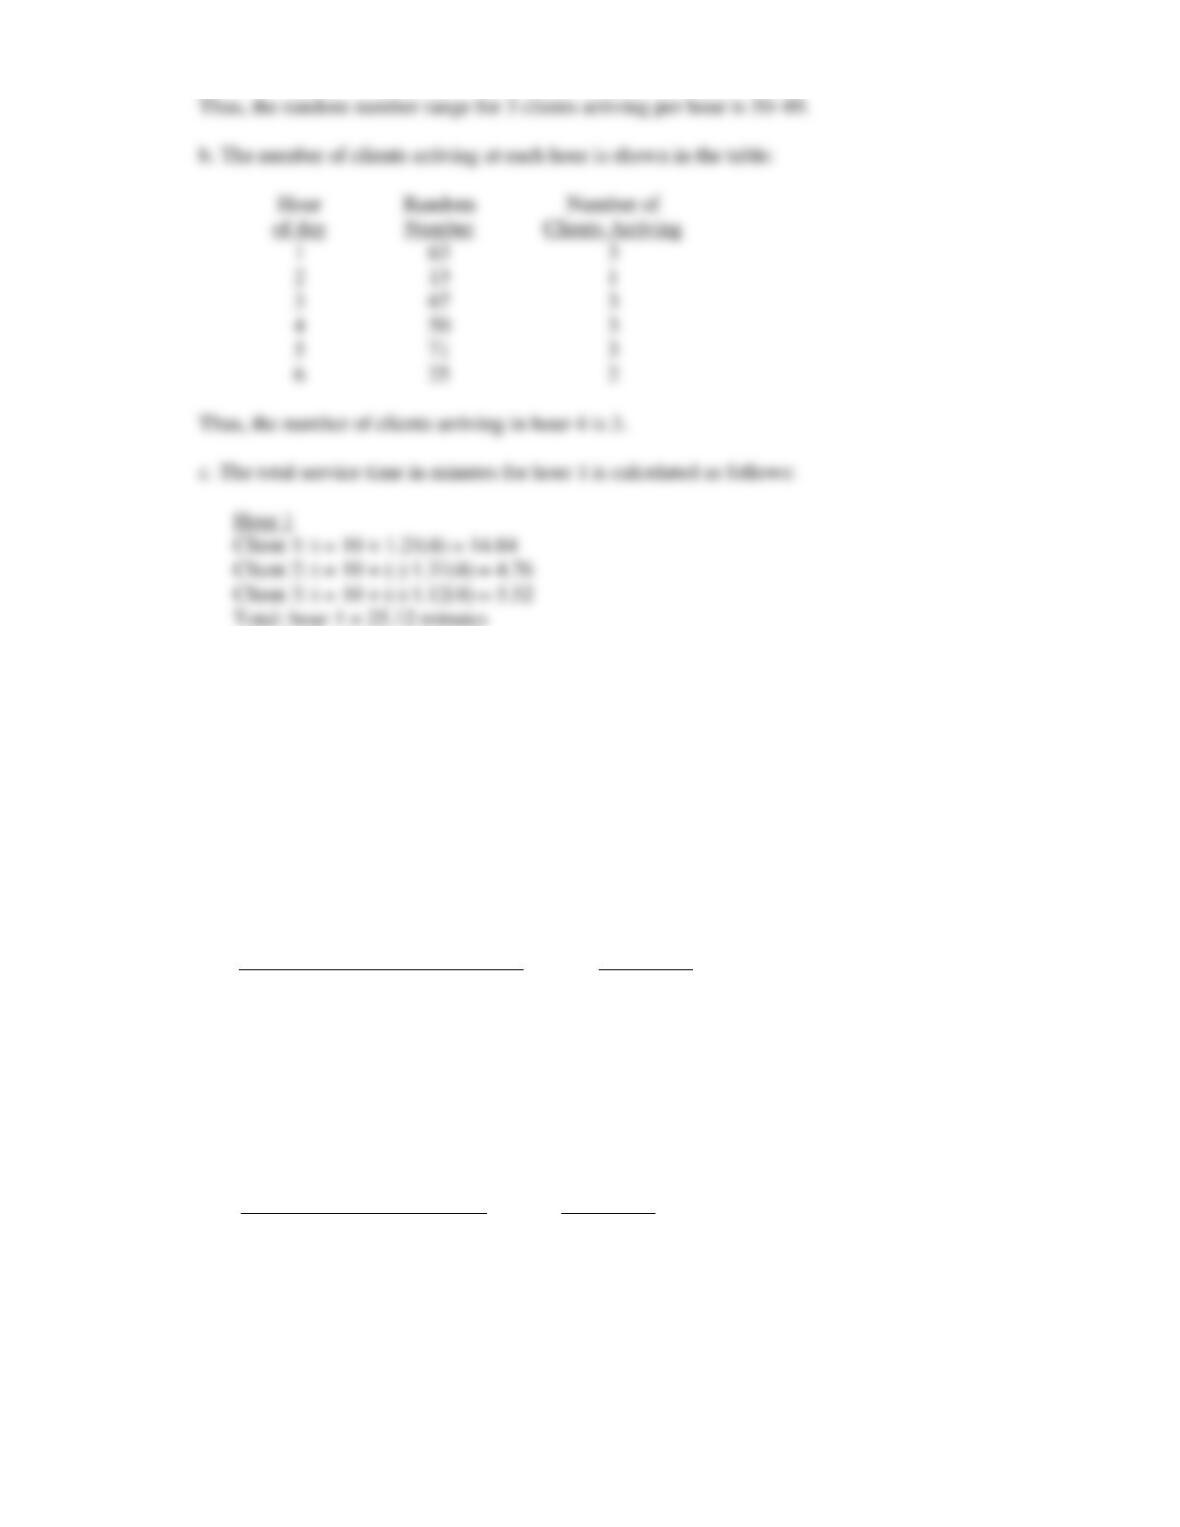
a. On a scale of 00-99, what random number range corresponds to 3 clients arriving per hour?
b. What is the number of clients arriving in hour 4?
c. What is the total service time in minutes for hour 1?
OM5 Test Bank Supplementary Chapter D 10
6. An administrator in a comprehensive hospital believes certain departments are overstaffed and
others are understaffed. In many departments, a patient’s arrival is quite variable and the time required
to treat that patient is also quite variable. In fact, the administrator does not believe there is a
mathematical relationship between arrivals and treatment time.
Like most hospitals, this one has kept extensive records for each patient. It uses this data for a
simulation to determine proper staffing levels for its various departments. The administrator decides to
test the procedure with data from the Maternity Center. The following table represents the best
probability forecast of Maternity Center arrivals.
Time Between Arrivals (minutes)
Probability
30
0.20
60
0.40
90
0.30
120
0.10
Historic data also indicates that 90% of Maternity Center arrivals are admitted and 10% are sent home
due to false labor. The following table represents the historic frequency distribution for the time a
patient spends in the labor room.
Time in Labor Room (hours)
Probability
0.5
0.10
1.0
0.10
2.0
0.30
4.0
0.30
5.0
0.20
The administrator now believes the use of past data is an excellent indicator of future conditions.
OM5 Test Bank Supplementary Chapter D 11
a. Determine the third patient’s arrival time given the following random numbers: 12, 77, 53, 07, 01,
34, 76, 20, 19, and 85. The simulation starts at 8:00 a.m. with the first arrival coming after 8:00
a.m.
b. Determine the eighth patient’s arrival time given the following random numbers: 12, 77, 53, 07,
01, 34, 76, 20, 19, and 85. The simulation starts at 8:00 a.m. with the first arrival coming after 8:00
a.m.
c. 90% of Maternity Center patients are admitted to the hospital and 10% are sent home (see the table
below). Given this information, determine the number of patients admitted using the following
random numbers: 89, 50, 03, 52, 79, 38, 24, 61, 28, and 27.
d. Determine when the third patient will leave the labor room using the following random numbers:
97, 49, 13, 41, 82, 38, 16, 82, 13, and 22 for labor room stays.
e. Determine when the eighth patient will leave the labor room using the following random numbers:
97, 49, 13, 41, 82, 38, 16, 82, 13, and 22 for labor room stays.
f. Determine the average time a woman spends in the labor room using the following random
numbers: 97, 49, 13, 41, 82, 38, 16, 82, 13, and 22 for labor room stays.
7. A busy municipal golf driving range prepares 300 hotdogs daily. For a variety of reasons, the daily
demand for hotdogs varies as follows:
Demand Units
Probability
150
0.15
200
0.20
250
0.60
300
0.05
a. If the hotdogs sell for $1.50 each and cost $0.80 each, determine the range’s profit or loss on
hotdogs for day three using the following random numbers: 00, 59, 02, 97, 69, 98, 93, 49, 51,
and 92.
b. If the hotdogs sell for $1.50 each and cost $0.80 each, determine the range’s profit or loss on
hotdogs for day eight using the following random numbers: 00, 59, 02, 97, 69, 98, 93, 49, 51,
and 92.
c. If the hotdogs sell for $1.50 each and cost $0.80 each, determine the average daily demand for
hotdogs using the following random numbers: 00, 59, 02, 97, 69, 98, 93, 49, 51, and 92.
8. Larry sells sweatshirts at football games. The quantity supplied to him is sometimes less than he
ordered. The probability distribution below shows the probability of these shortages.
Sweatshirts (units short)
Probability
0
0.5
100
0.3
200
0.2
Simulate the average number of shortages for 15 consecutive orders, using the following single digit
random numbers: 1, 6, 8, 3, 4, 5, 7, 0, 3, 8, 9, 3, 2, 4, and 2.
9. Given the table below with information on lead time, followed by a set of six random numbers,
determine the average lead time.
Lead Time (days)
Frequency
3
20%
4
70%
5
10%
RANDOM NUMBERS: 90, 52, 54, 47, 56, and 95