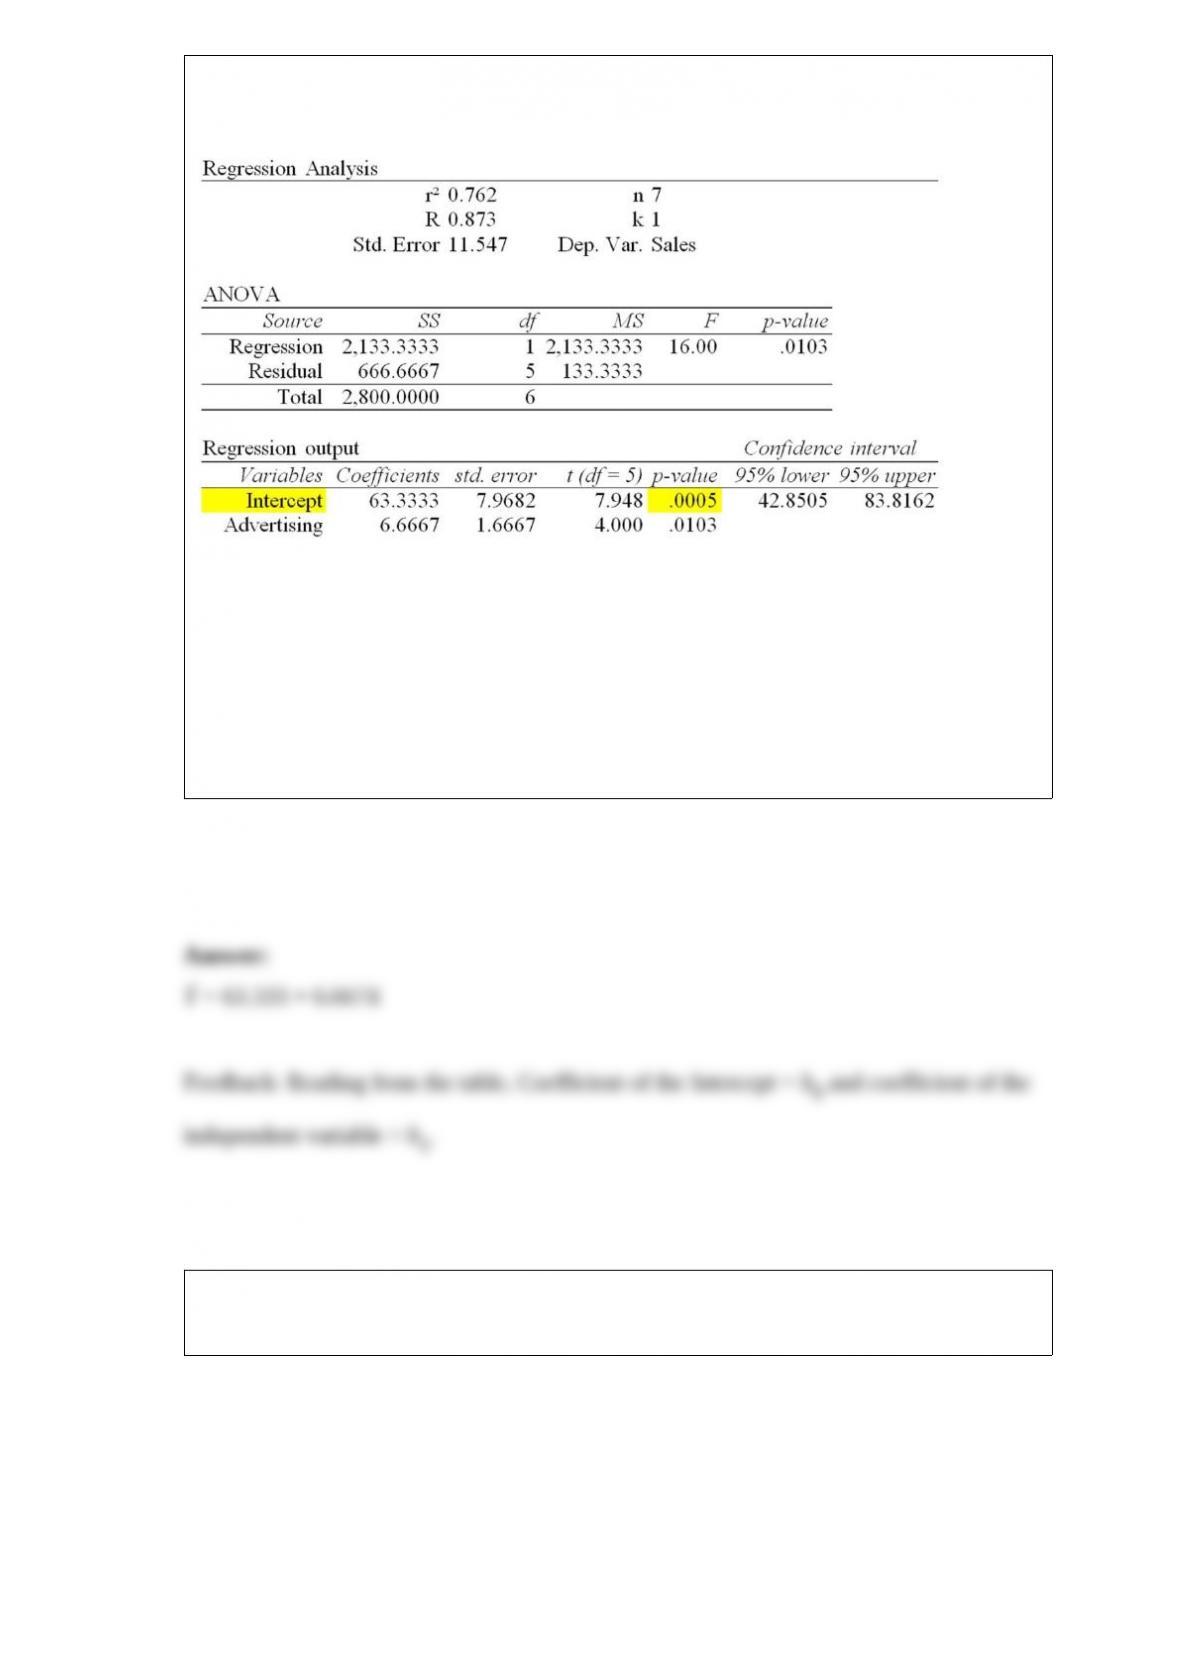
The local grocery store wants to predict its daily sales in dollars. The manager believes
that the amount of newspaper advertising significantly affects sales. He randomly
selects 7 days of data consisting of daily grocery store sales (in thousands of dollars)
and advertising expenditures (in thousands of dollars). The Excel/MegaStat output
given above summarizes the results of the regression model.
What is the estimated simple linear regression equation?
The local grocery store wants to predict its daily sales in dollars. The manager believes
that the amount of newspaper advertising significantly affects sales. He randomly
selects 7 days of data consisting of daily grocery store sales (in thousands of dollars)
and advertising expenditures (in thousands of dollars). The Excel/MegaStat output
given above summarizes the results of the regression model.
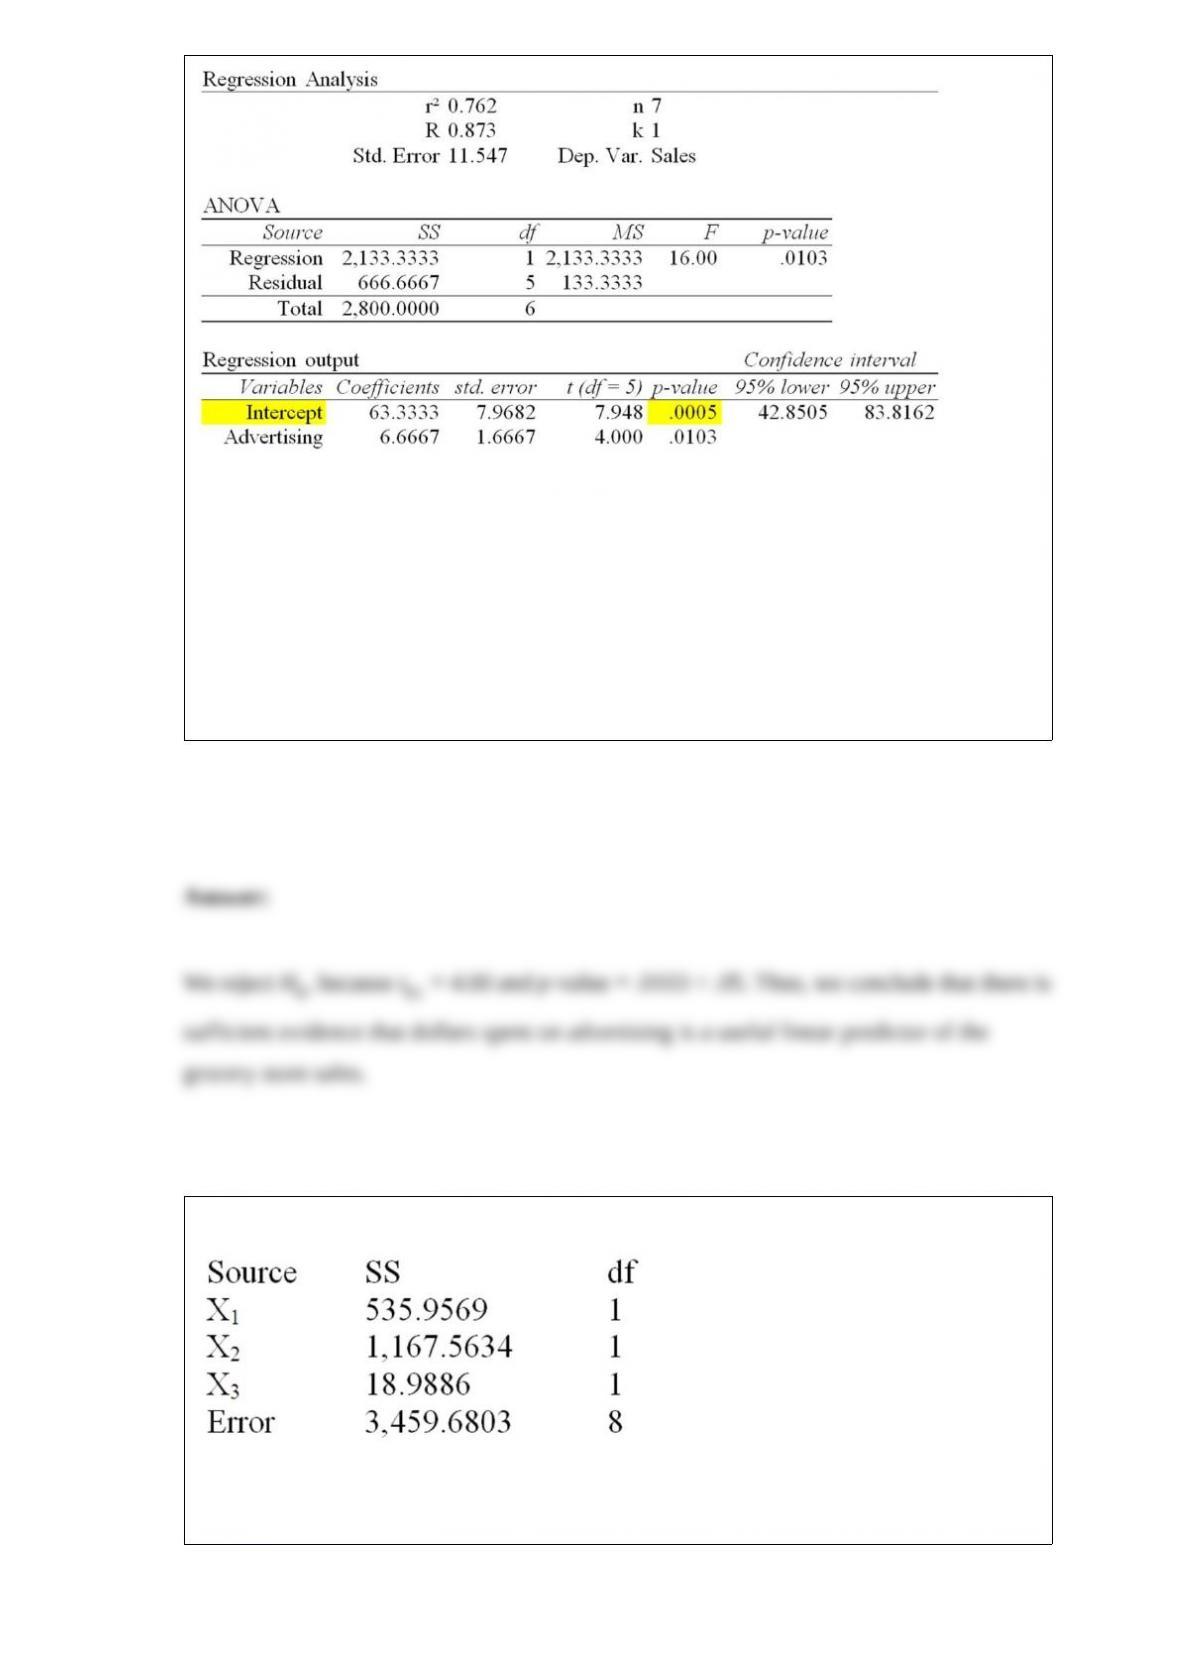
At a significance level of .05, test the significance of the slope and state your
conclusion.
Below is a partial multiple regression ANOVA table.
Test the overall usefulness of the model at α = .01. Calculate F and make your decision
about whether the model is useful for prediction purposes.
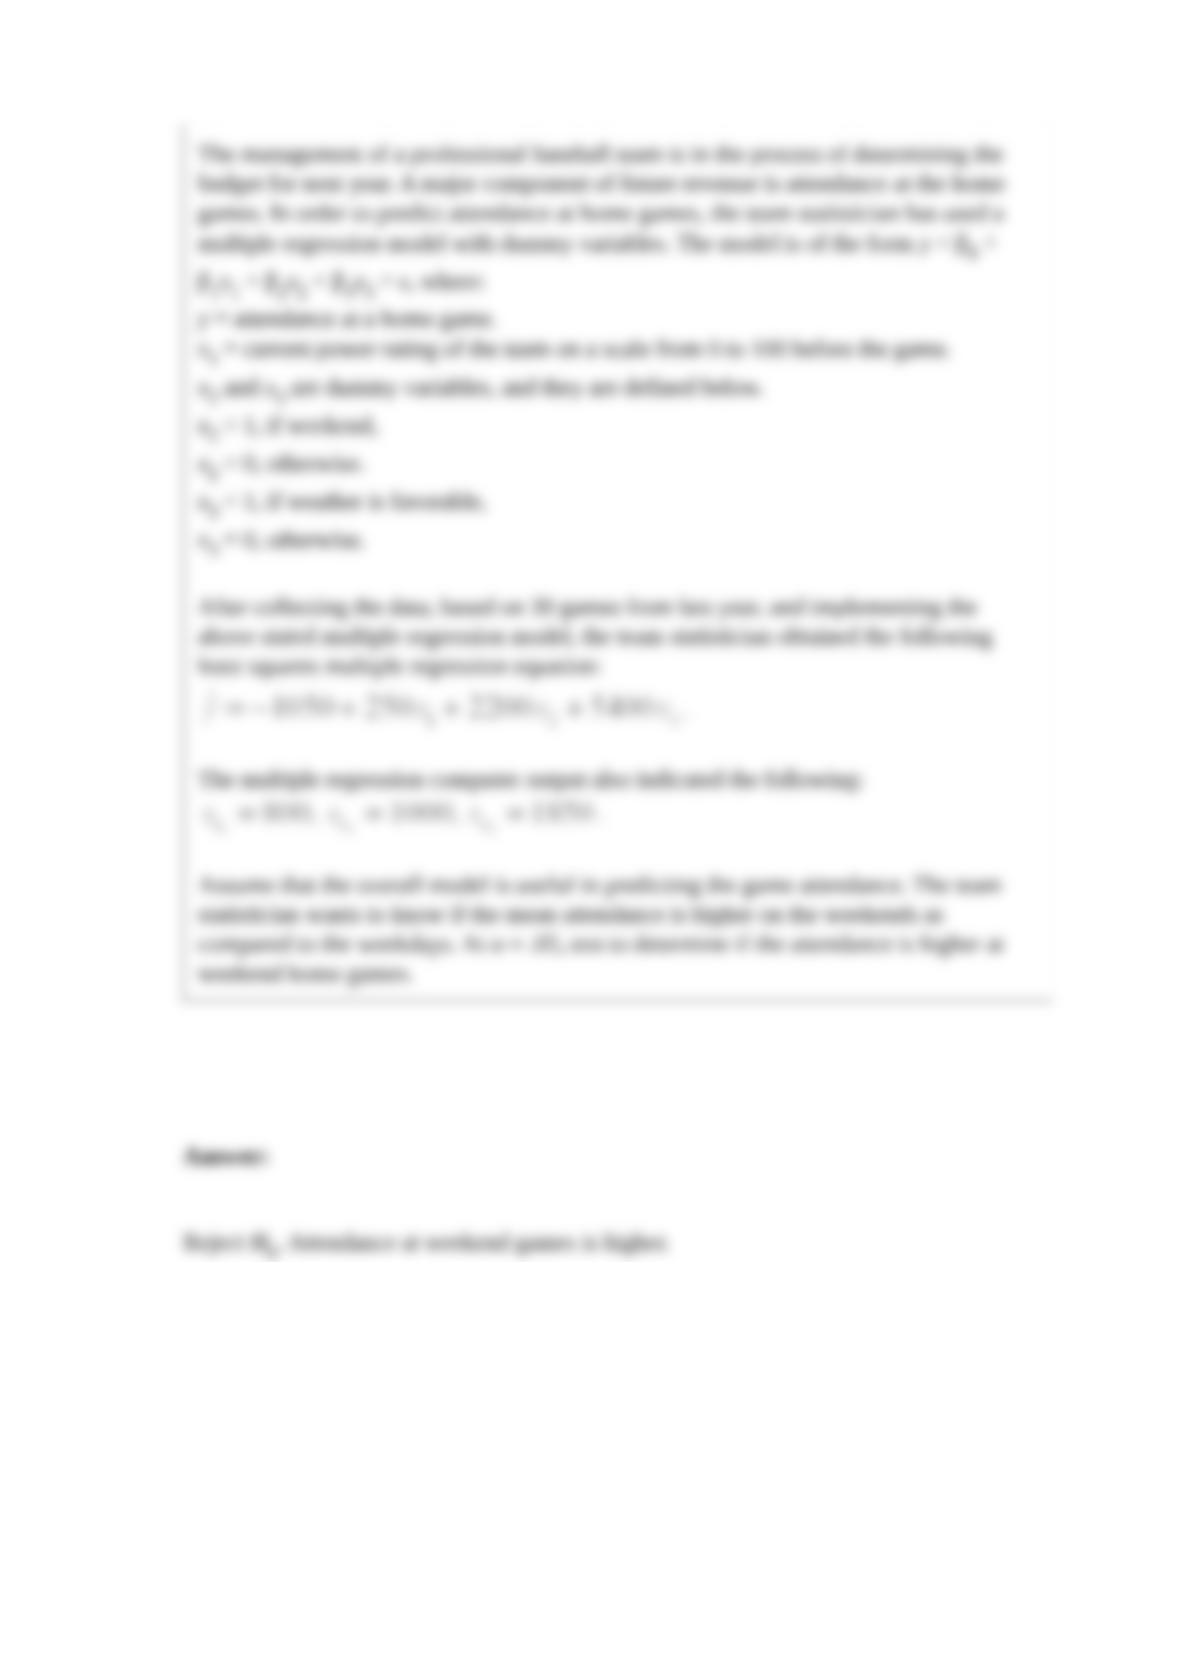
The management of a professional baseball team is in the process of determining the
budget for next year. A major component of future revenue is attendance at the home
games. In order to predict attendance at home games, the team statistician has used a
multiple regression model with dummy variables. The model is of the form y = β0 +
β1x1 + β2x2 + β3x3 + ε, where:
y = attendance at a home game.
x1 = current power rating of the team on a scale from 0 to 100 before the game.
x2 and x3 are dummy variables, and they are defined below.
x2 = 1, if weekend,
x2 = 0, otherwise.
x3 = 1, if weather is favorable,
x3 = 0, otherwise.
After collecting the data, based on 30 games from last year, and implementing the
above stated multiple regression model, the team statistician obtained the following
least squares multiple regression equation:
The multiple regression computer output also indicated the following:
Assume that the overall model is useful in predicting the game attendance. The team
statistician wants to know if the mean attendance is higher on the weekends as
compared to the weekdays. At α = .05, test to determine if the attendance is higher at
weekend home games.

An experiment was performed on a certain metal to determine if the strength is a
function of heating time. Results based on 10 metal sheets are given below. Use the
simple linear regression model.
Determine the standard error.
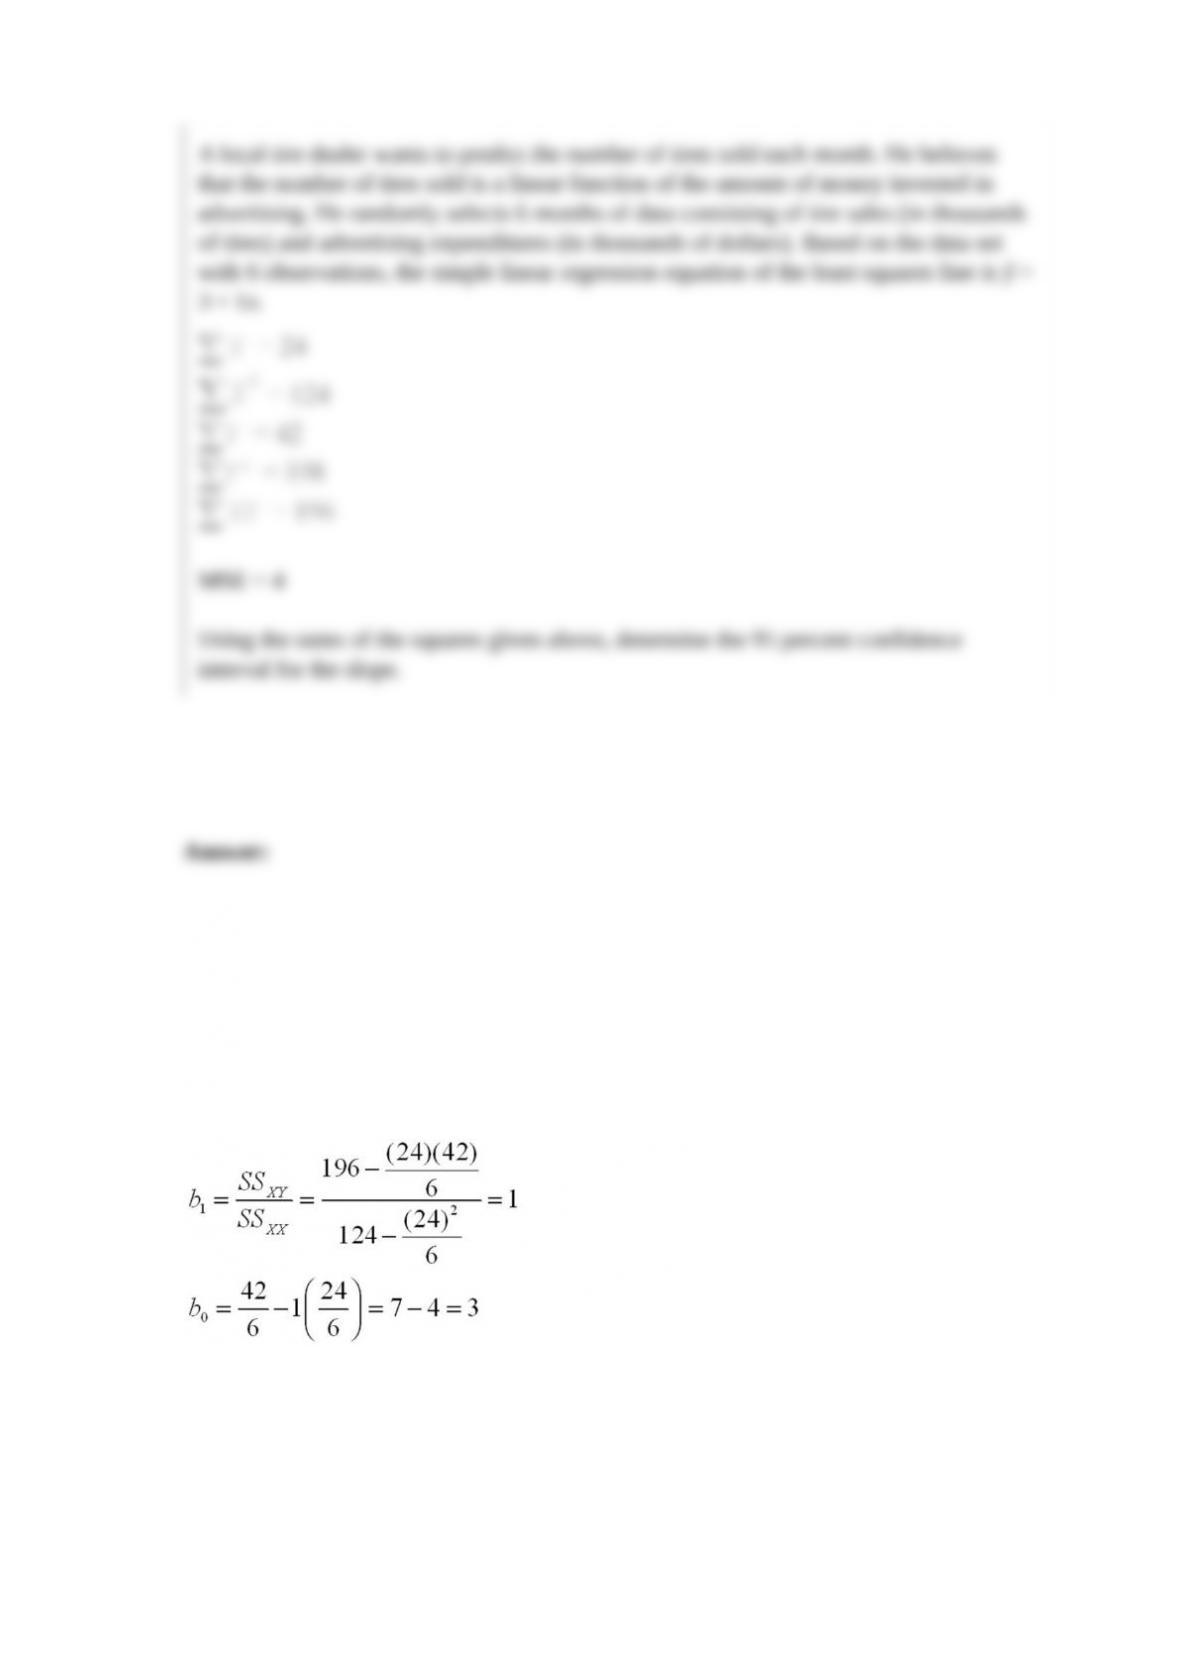
A local tire dealer wants to predict the number of tires sold each month. He believes
that the number of tires sold is a linear function of the amount of money invested in
advertising. He randomly selects 6 months of data consisting of tire sales (in thousands
of tires) and advertising expenditures (in thousands of dollars). Based on the data set
with 6 observations, the simple linear regression equation of the least squares line is ŷ =
3 + 1x.
MSE = 4
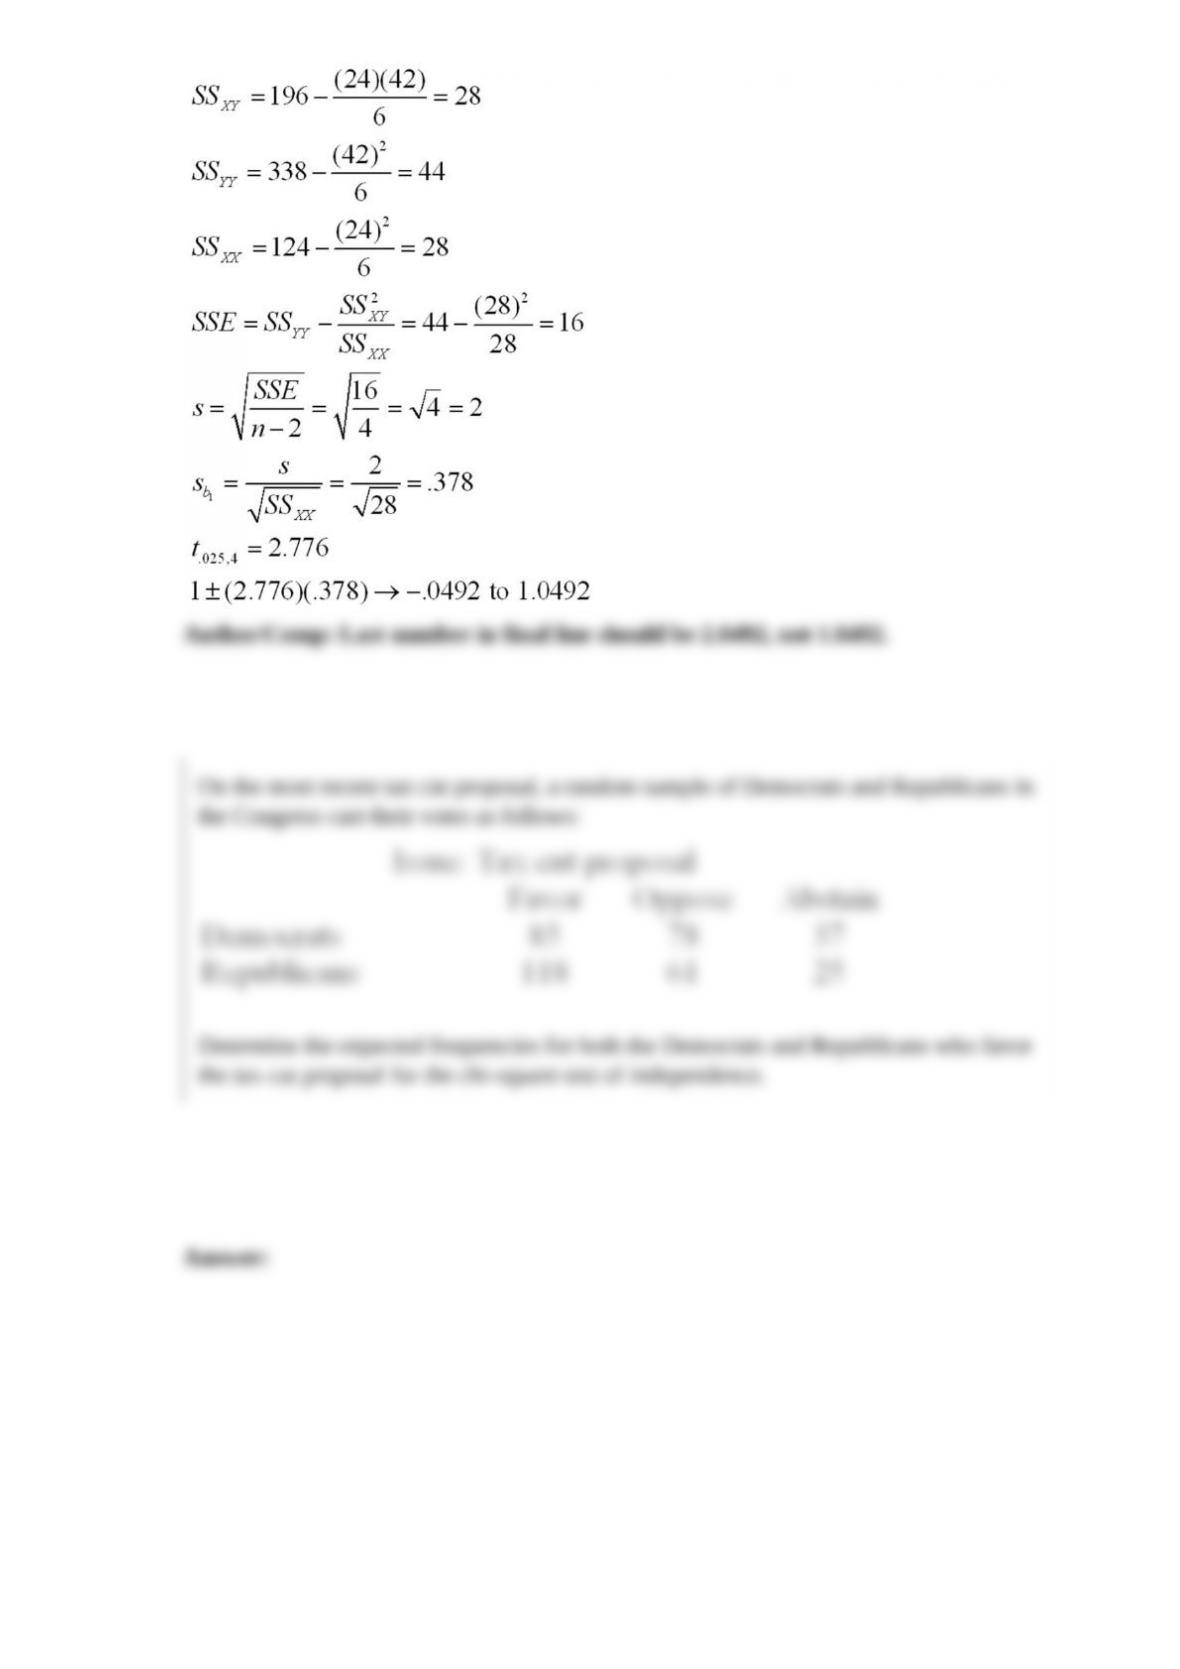
Using the sums of the squares given above, determine the 95 percent confidence
interval for the slope.
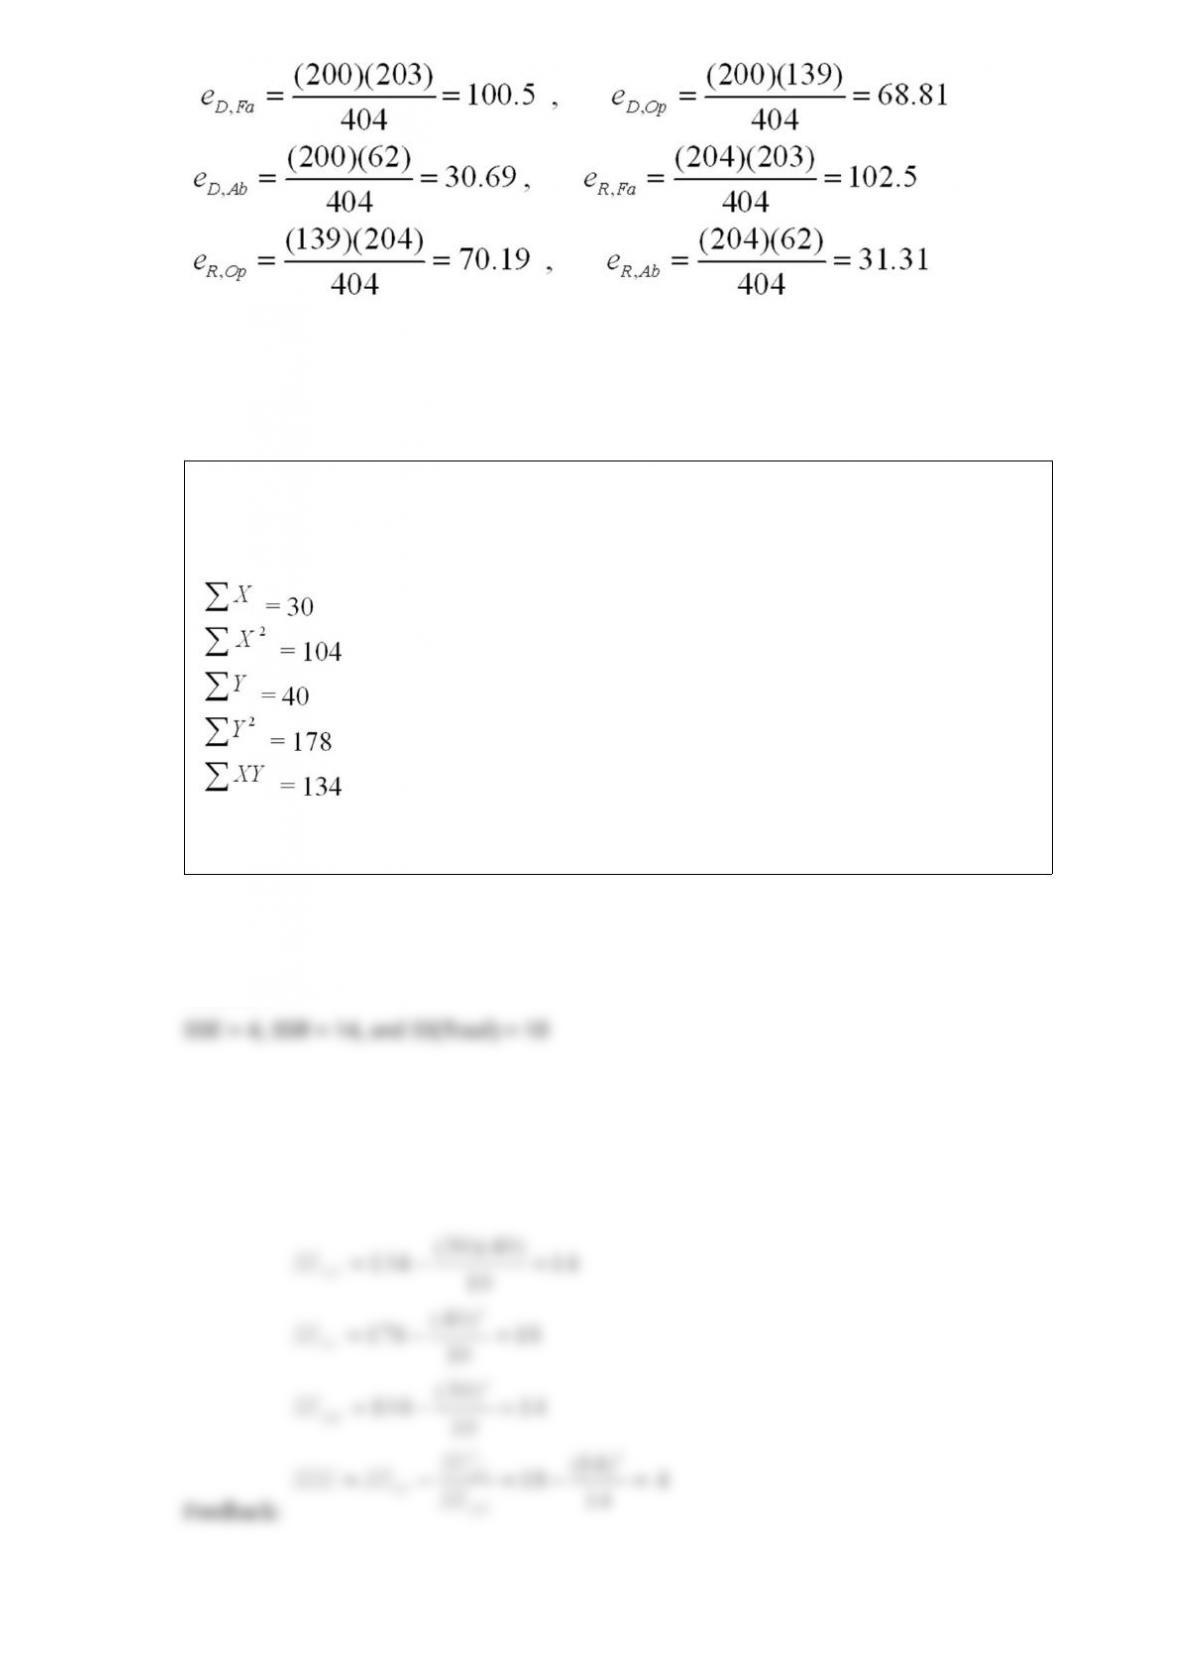
On the most recent tax cut proposal, a random sample of Democrats and Republicans in
the Congress cast their votes as follows:
Determine the expected frequencies for both the Democrats and Republicans who favor
the tax cut proposal for the chi-square test of independence.
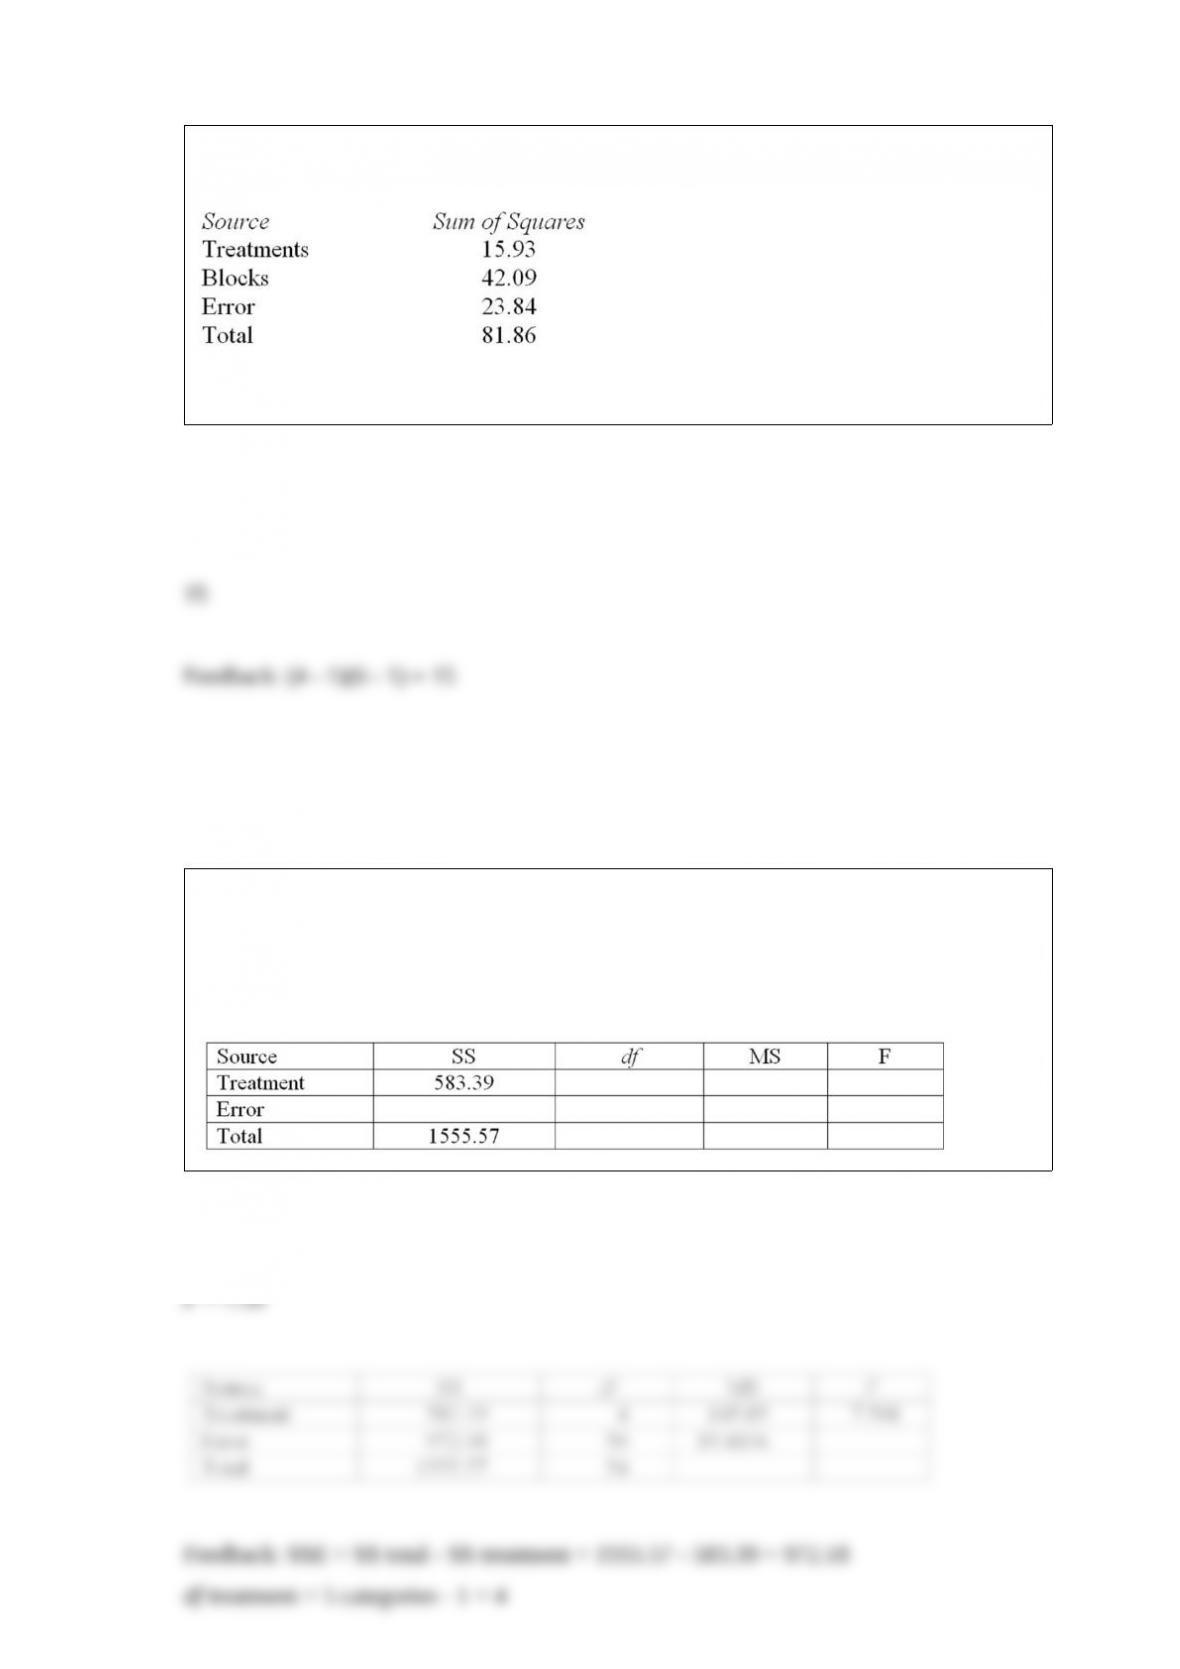
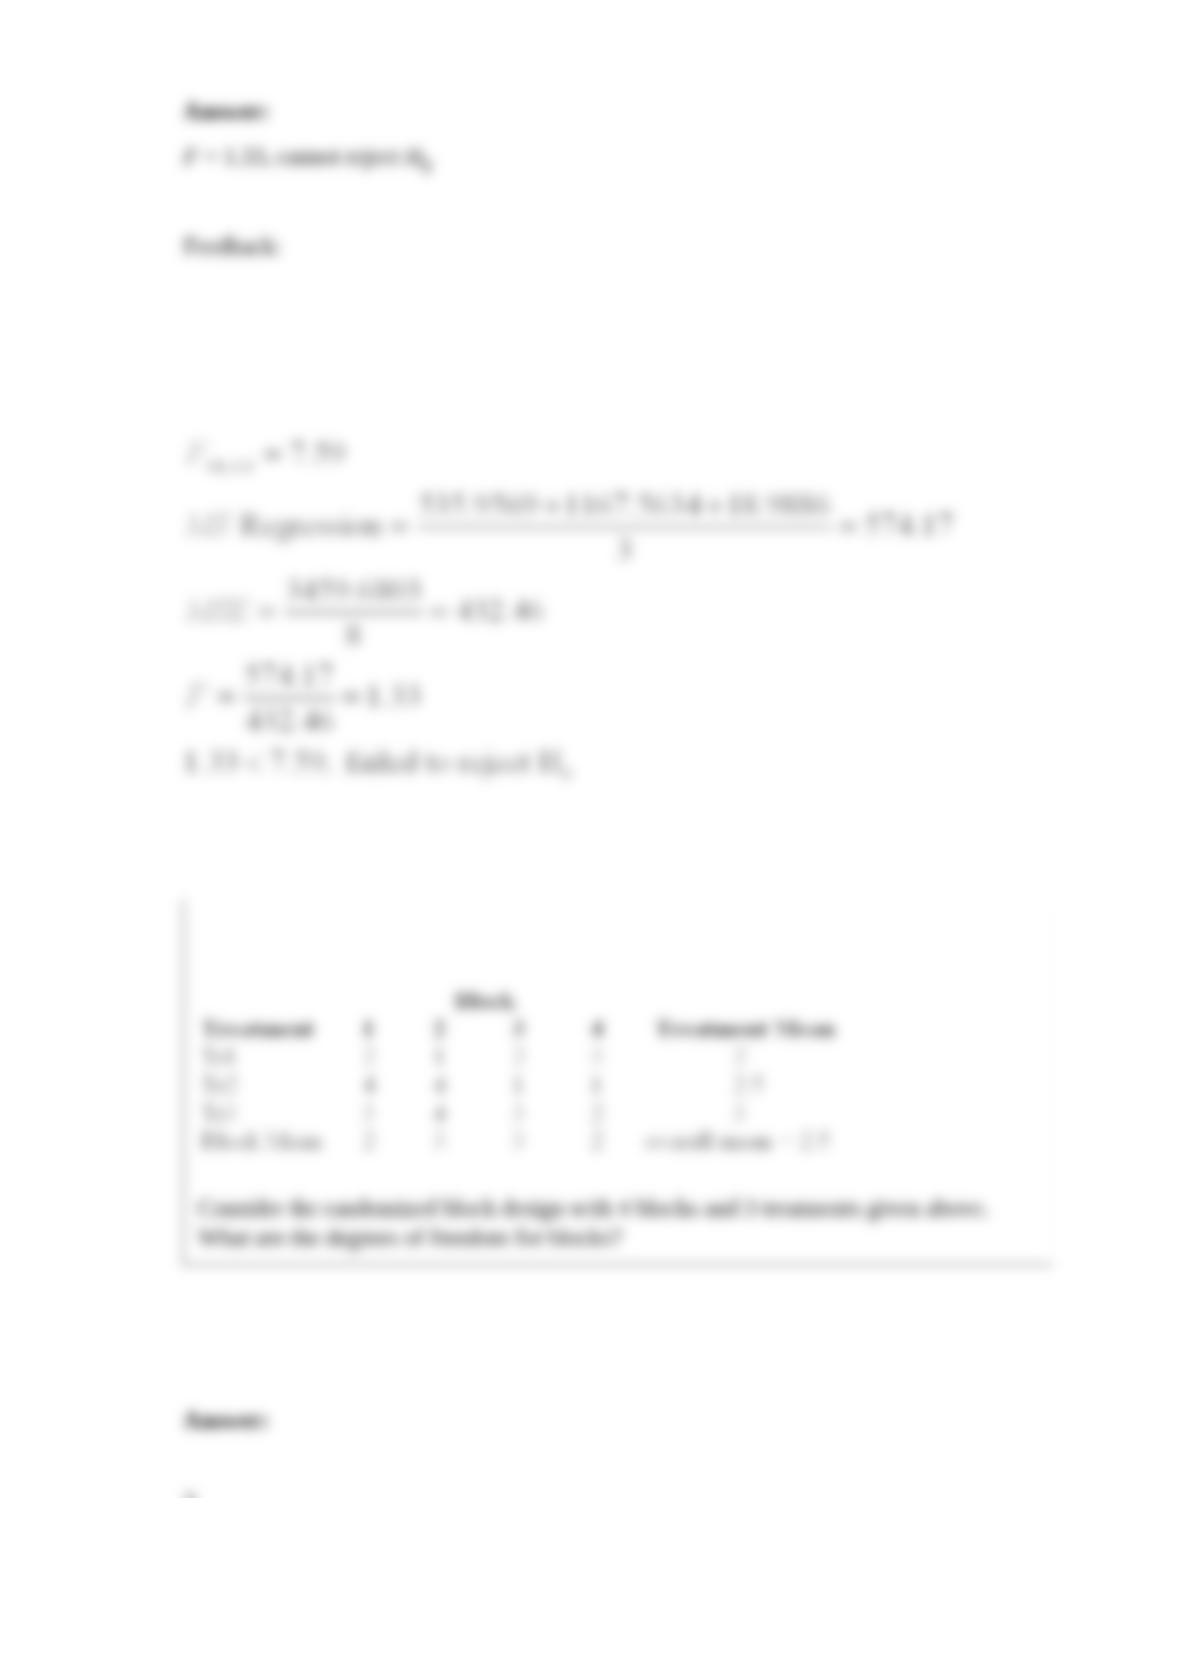
Consider the following partial analysis of variance table from a randomized block
design with 6 blocks and 4 treatments.
Determine the degrees of freedom for error.
Suppose you are a researcher investigating the annual sales differences among five
categories of businesses. The study looks at a total of 55 companies equally divided
among category groups A, B, C, D, and E.
Complete the following ANOVA table and determine the value of the F statistic.
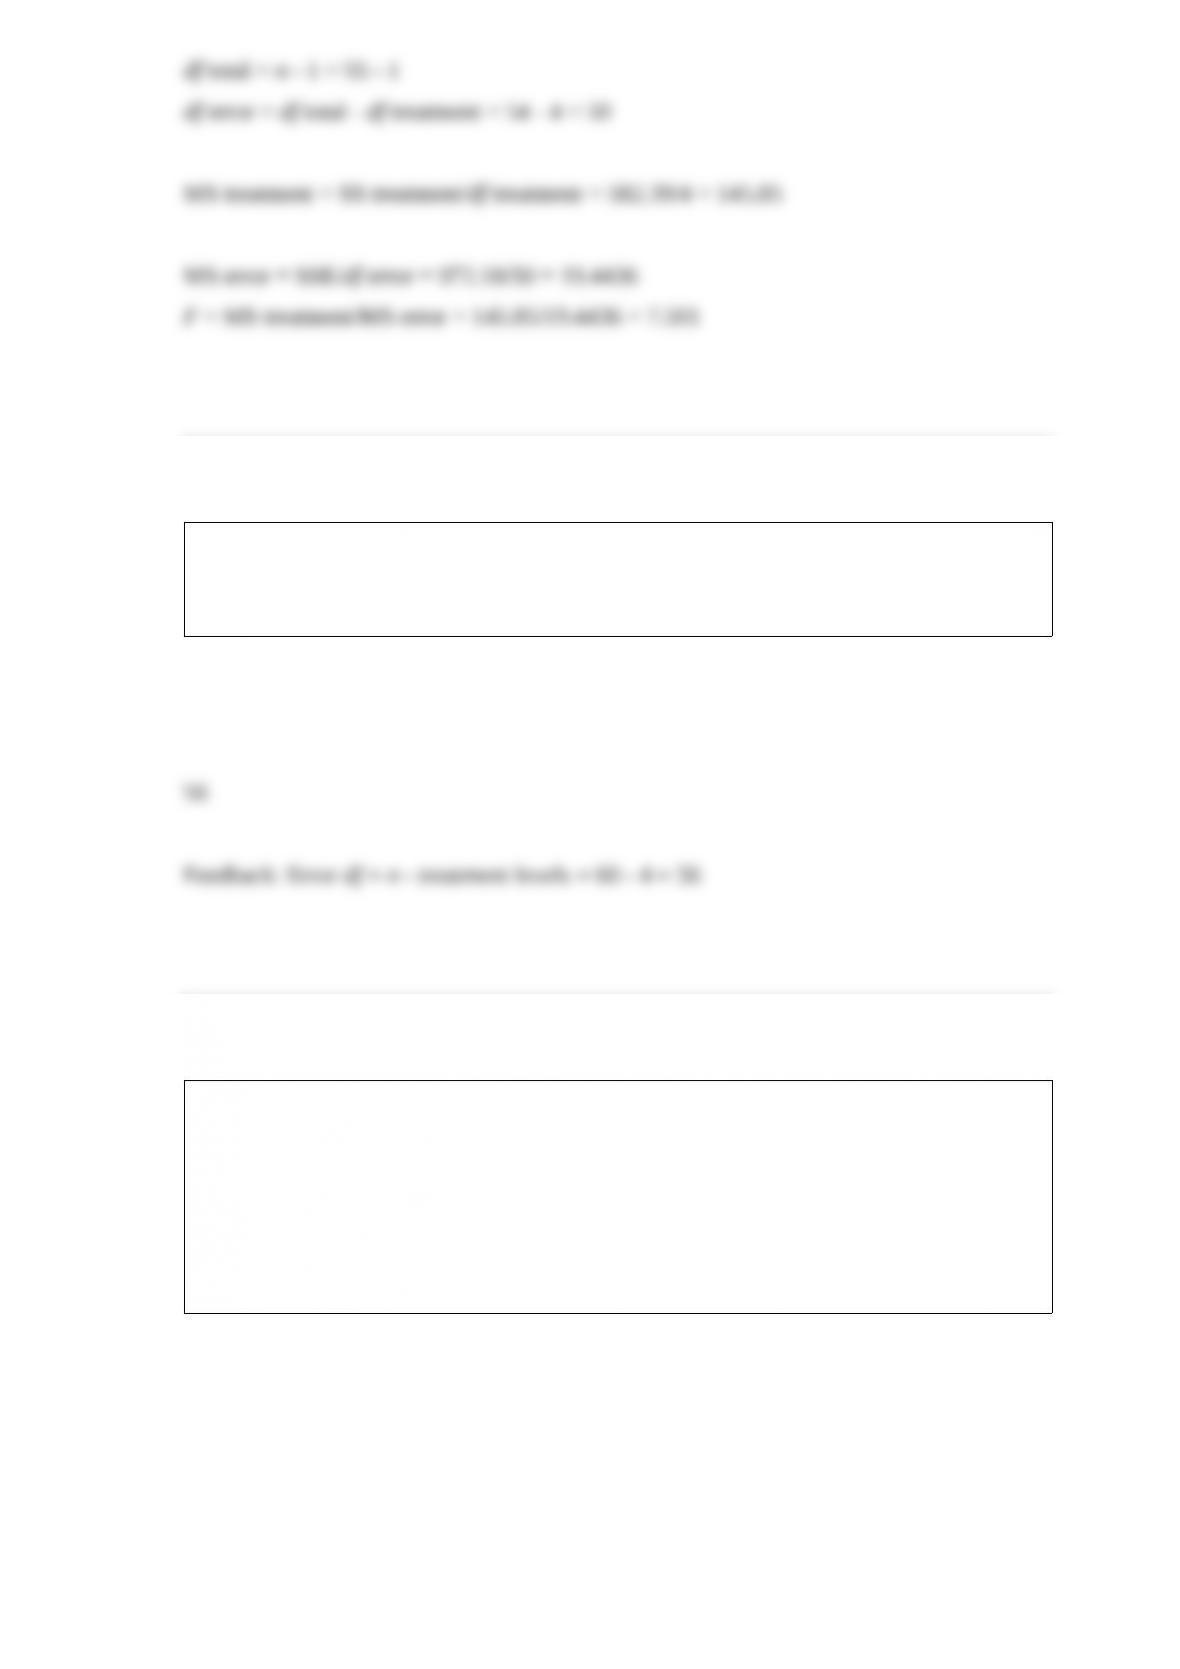
What is the degrees of freedom error (within-group variation) of a completely
randomized design (one-way) ANOVA test with 4 groups and 15 observations per each
group?
A U.S.-based Internet company offers an online proficiency course in basic accounting.
Completing this online course satisfies the Fundamentals of Accounting course
requirement in many MBA programs. In the first semester, 315 students have enrolled
in the course. The marketing research manager divided the country into seven regions
of approximately equal population. The course enrollment values for each of the seven
regions are given below. The management wants to know if there is equal interest in the
course across all regions.
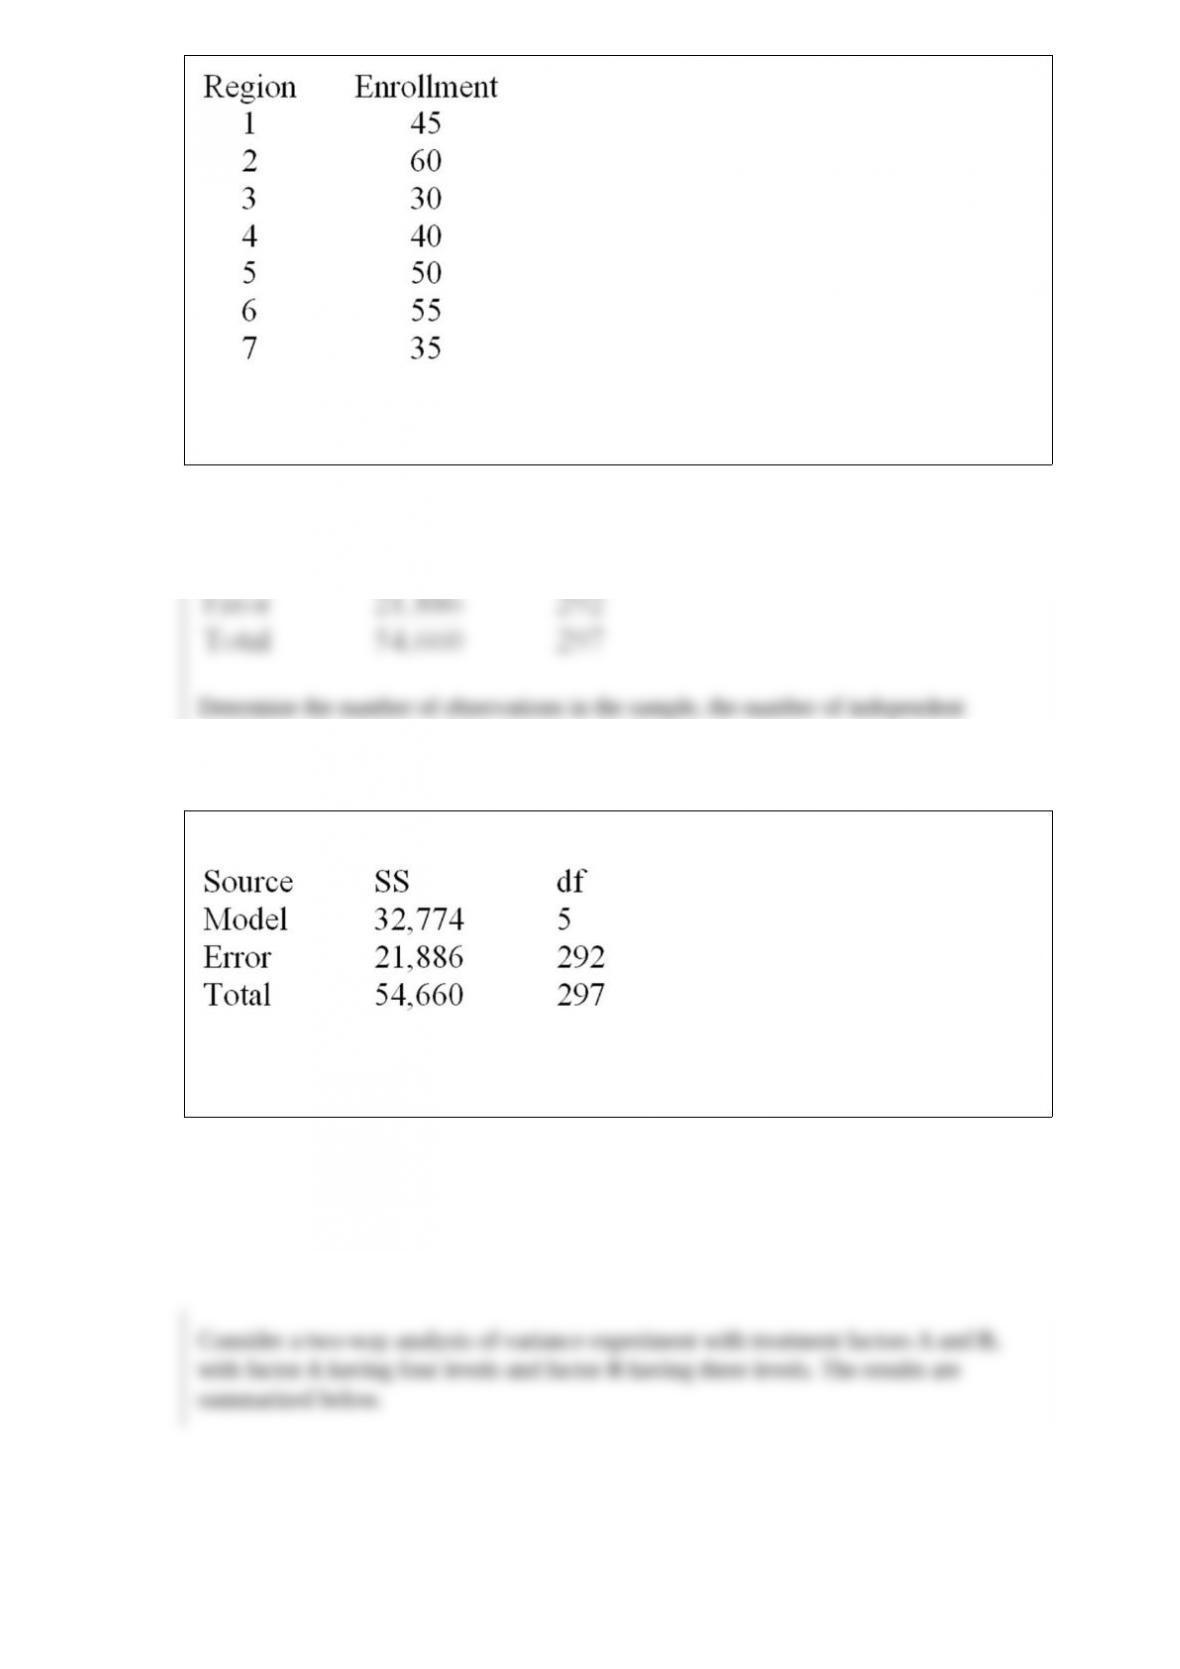
How many degrees of freedom are associated with the chi-square test? Also, at α = .05,
determine the rejection point condition of the chi-square statistic.
Below is a partial multiple regression computer output.
Determine the number of observations in the sample, the number of independent
variables in the model, and the mean squared error.
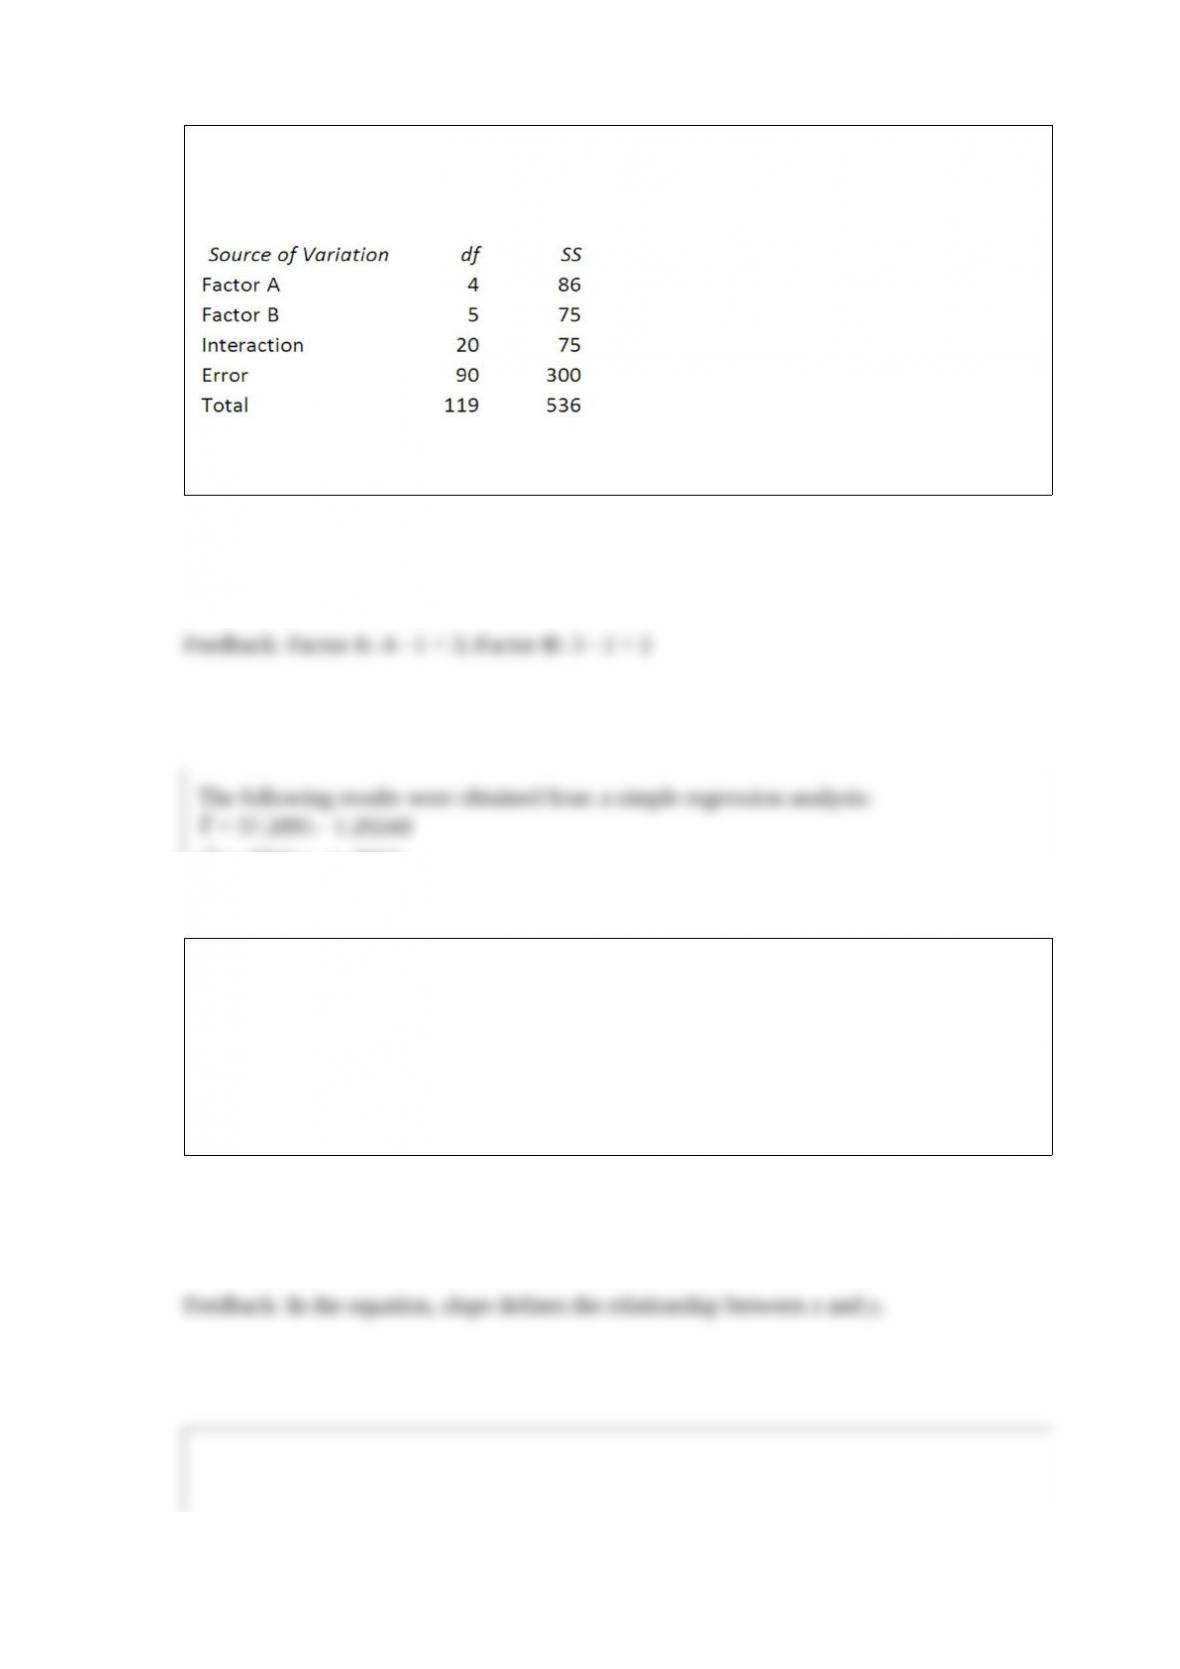
Consider a two-way analysis of variance experiment with treatment factors A and B,
with factor A having four levels and factor B having three levels. The results are
summarized below.
Calculate the degrees of freedom for factor A and factor B.
The following results were obtained from a simple regression analysis:
Ŷ = 37.2895 – 1.2024X
r2 = .6744 sb = .2934
For each unit change in X (independent variable), what is the estimated change in Y
(dependent variable)?
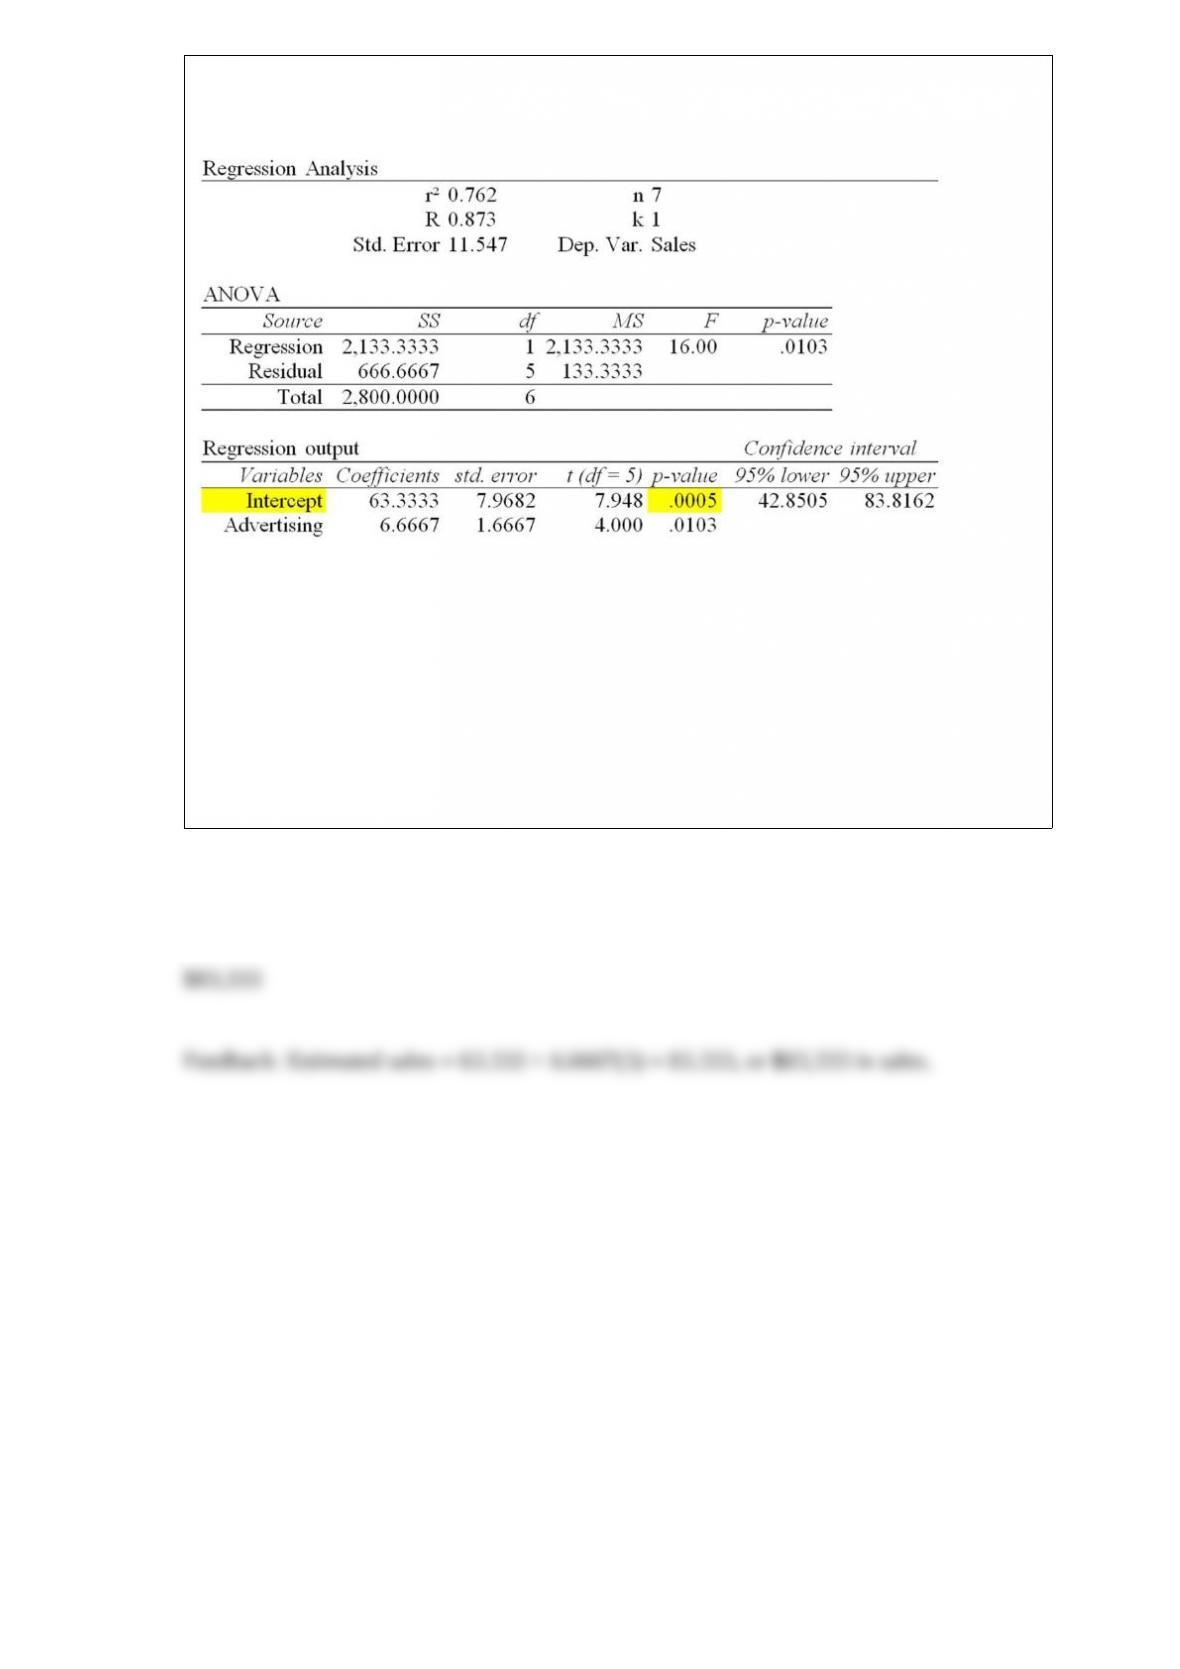
The local grocery store wants to predict its daily sales in dollars. The manager believes
that the amount of newspaper advertising significantly affects sales. He randomly
selects 7 days of data consisting of daily grocery store sales (in thousands of dollars)
and advertising expenditures (in thousands of dollars). The Excel/MegaStat output
given above summarizes the results of the regression model.
If the manager decides to spend $3000 on advertising, based on the simple linear
regression results given above, what are the estimated sales?