An experiment was performed on a certain metal to determine if the strength is a
function of heating time. The sample size consists of 10 metal sheets. The simple linear
regression equation is
The time is in minutes and the strength is measured in pounds per square inch. One of
the 10 metal sheets was heated for 4 minutes and the resulting strength was 6 lbs. per
square inch. Calculate the value of the residual for this observation.
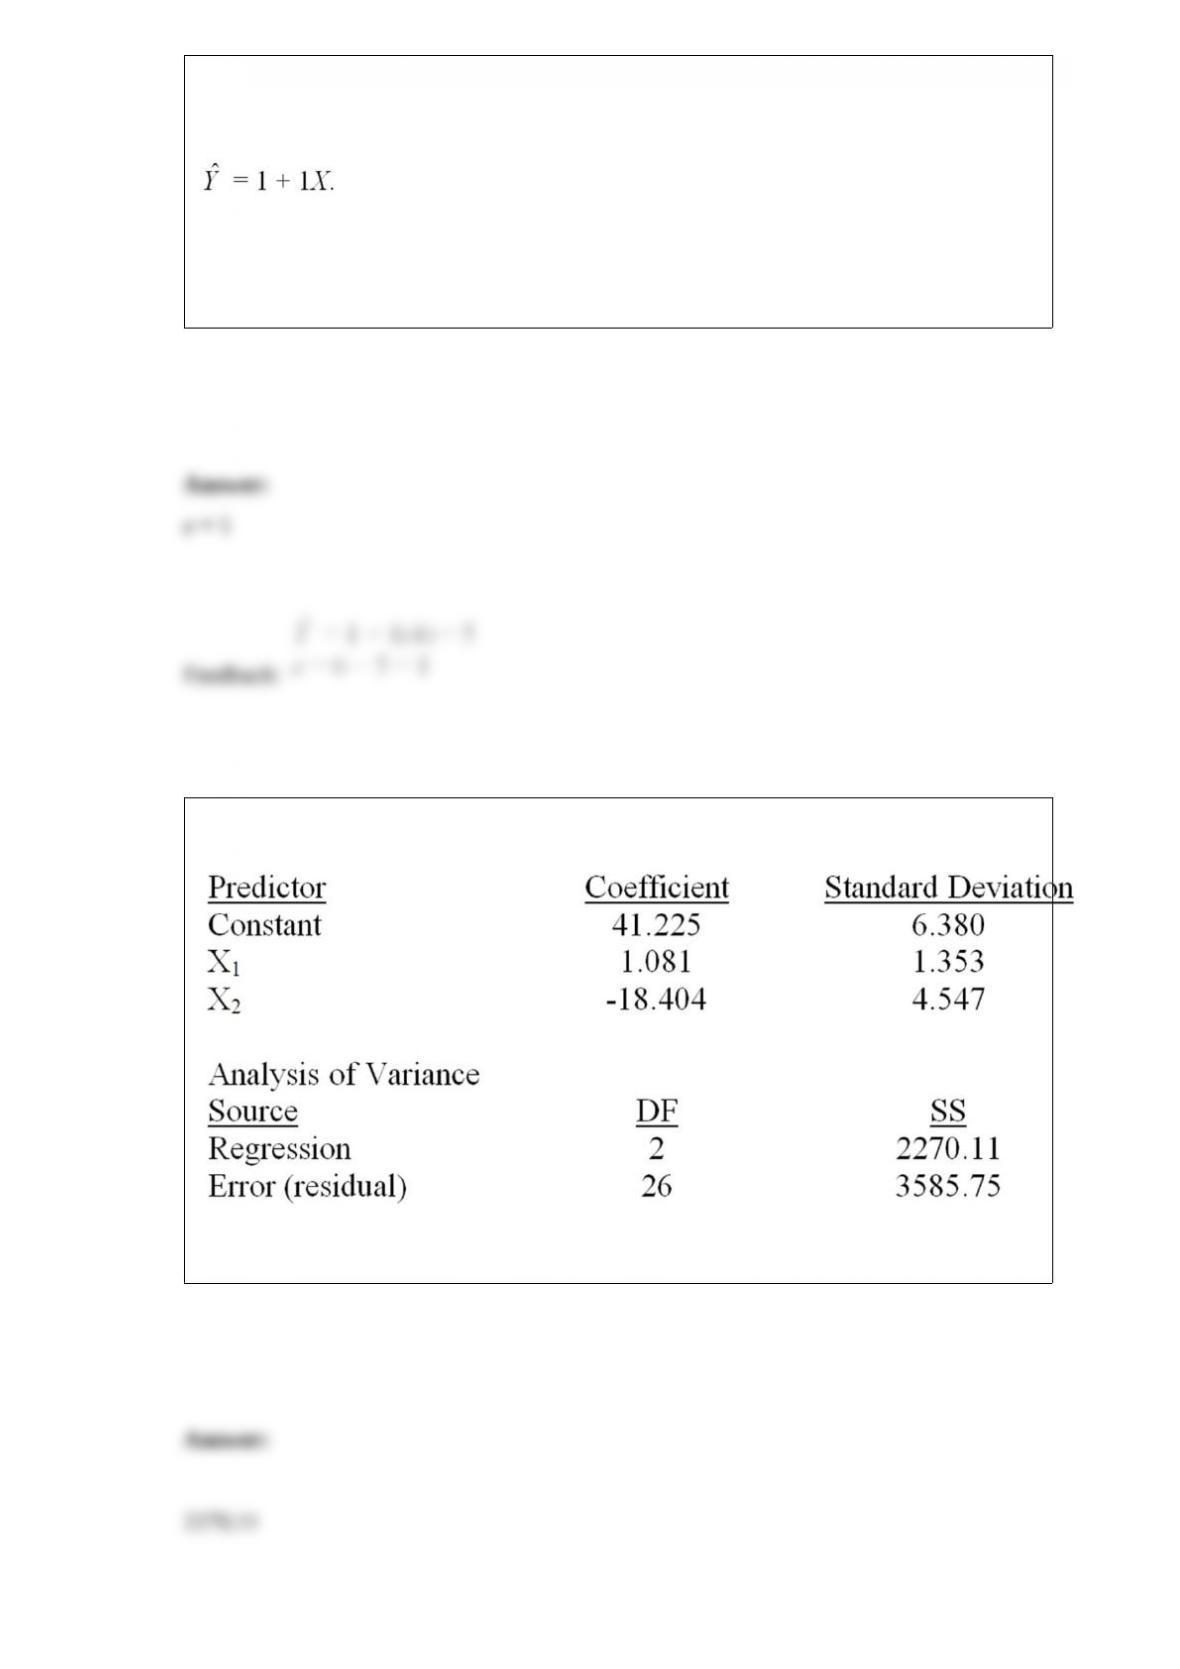
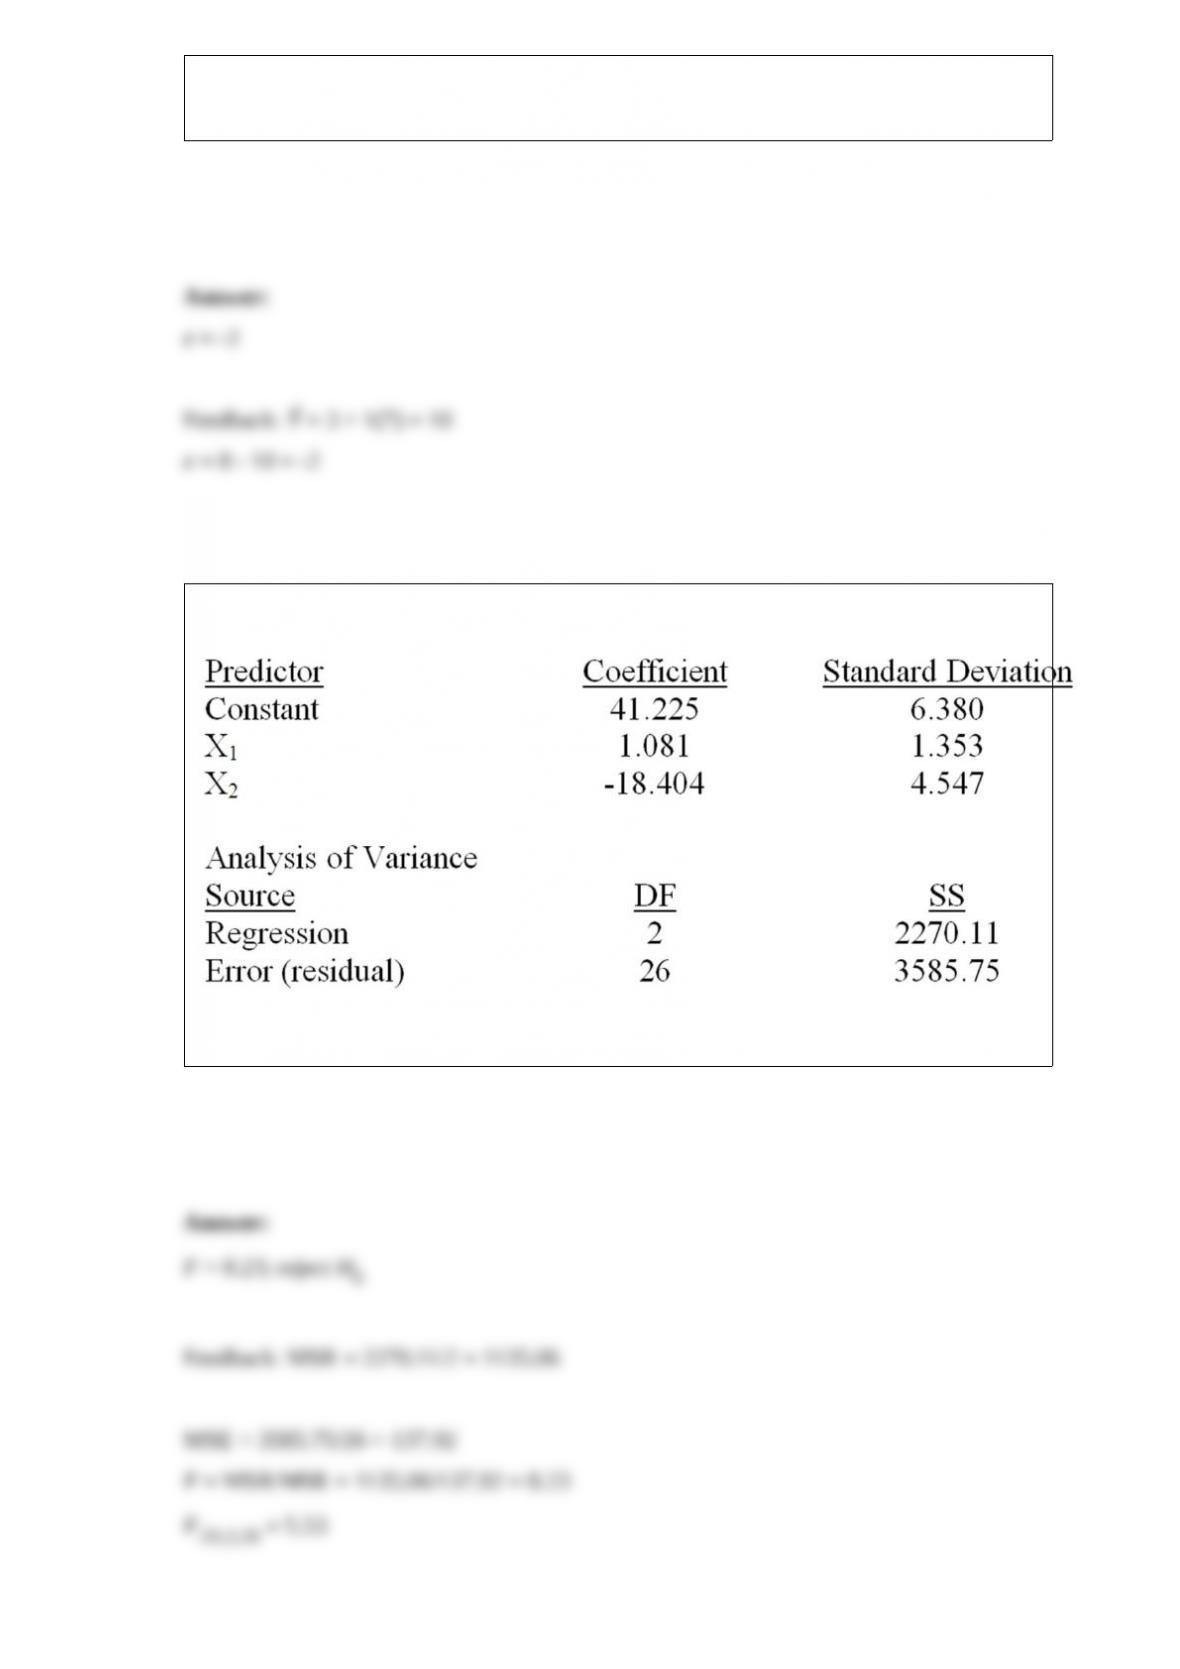
Consider the following partial computer output for a multiple regression model.
What is the explained variation?
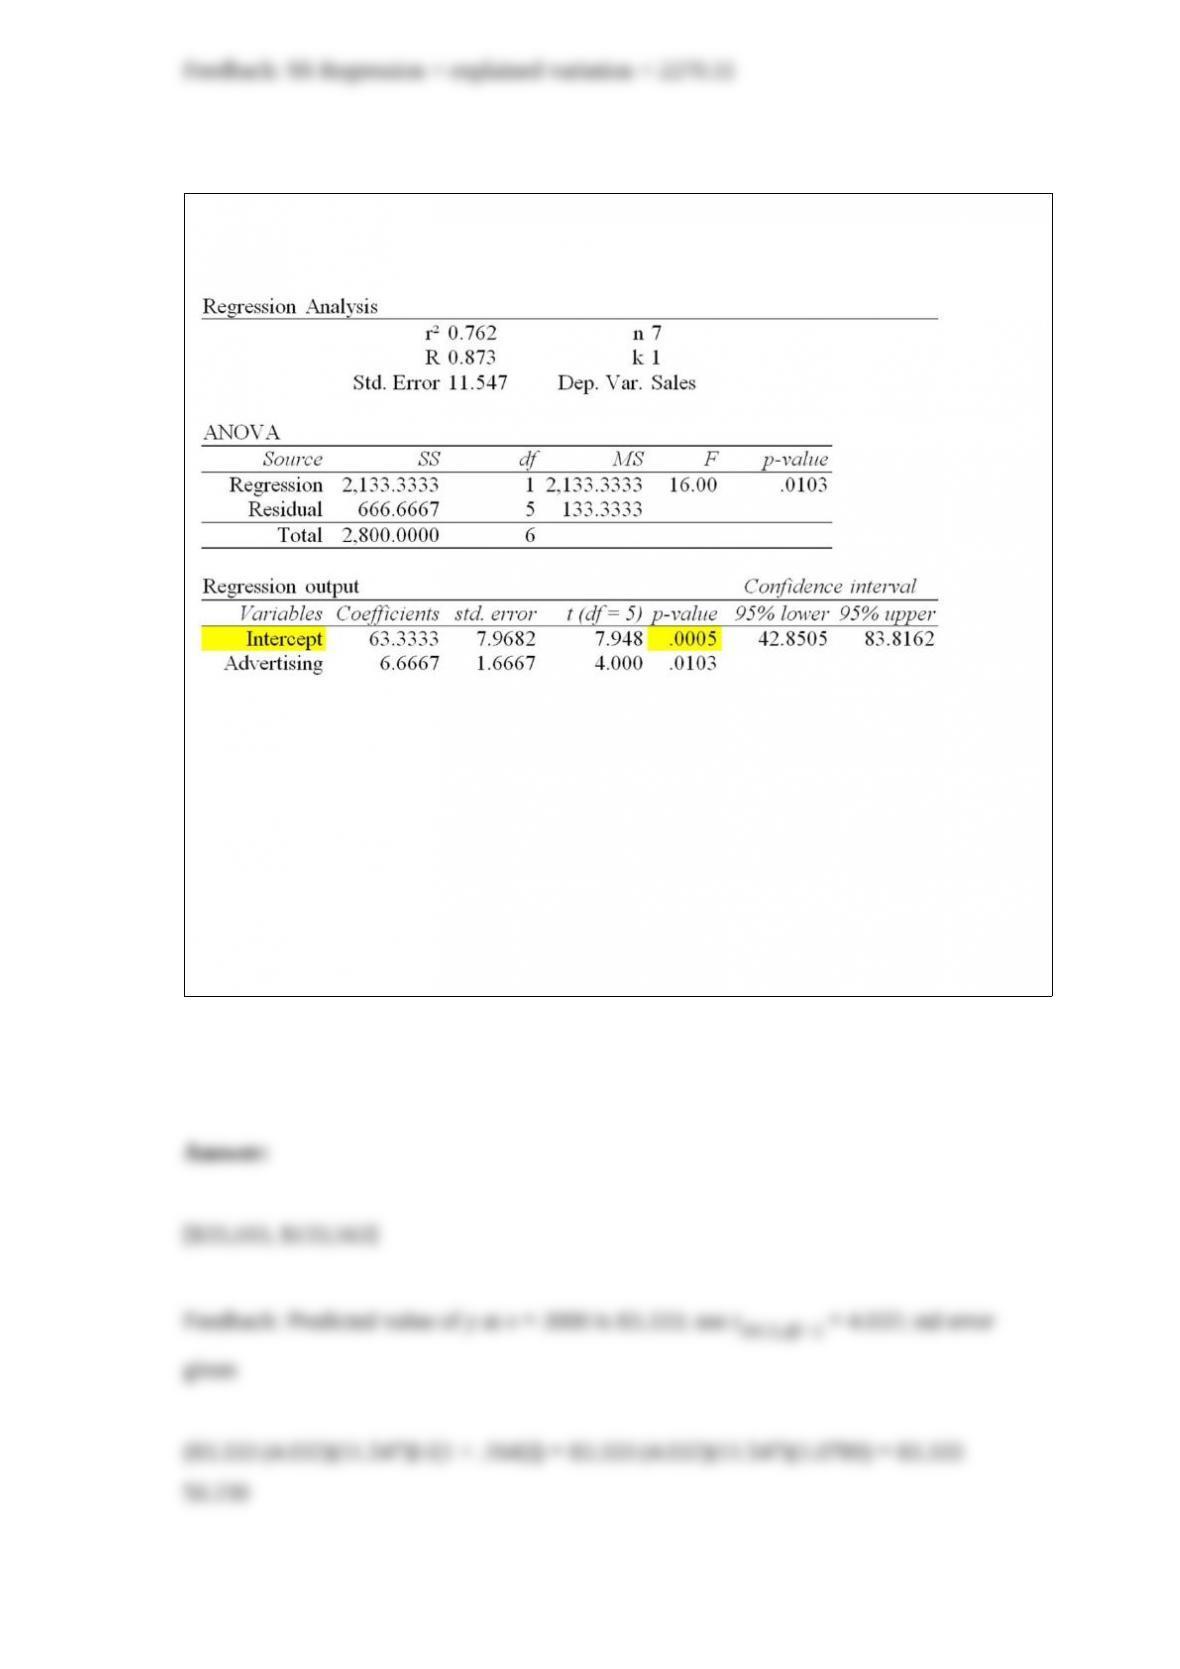
The local grocery store wants to predict its daily sales in dollars. The manager believes
that the amount of newspaper advertising significantly affects sales. He randomly
selects 7 days of data consisting of daily grocery store sales (in thousands of dollars)
and advertising expenditures (in thousands of dollars). The Excel/MegaStat output
given above summarizes the results of the regression model.
What are the limits of the 99 percent prediction interval of the daily sales in dollars of
an individual grocery store that has spent $3000 on advertising expenditures? The
distance value for this particular prediction is reported as .164.
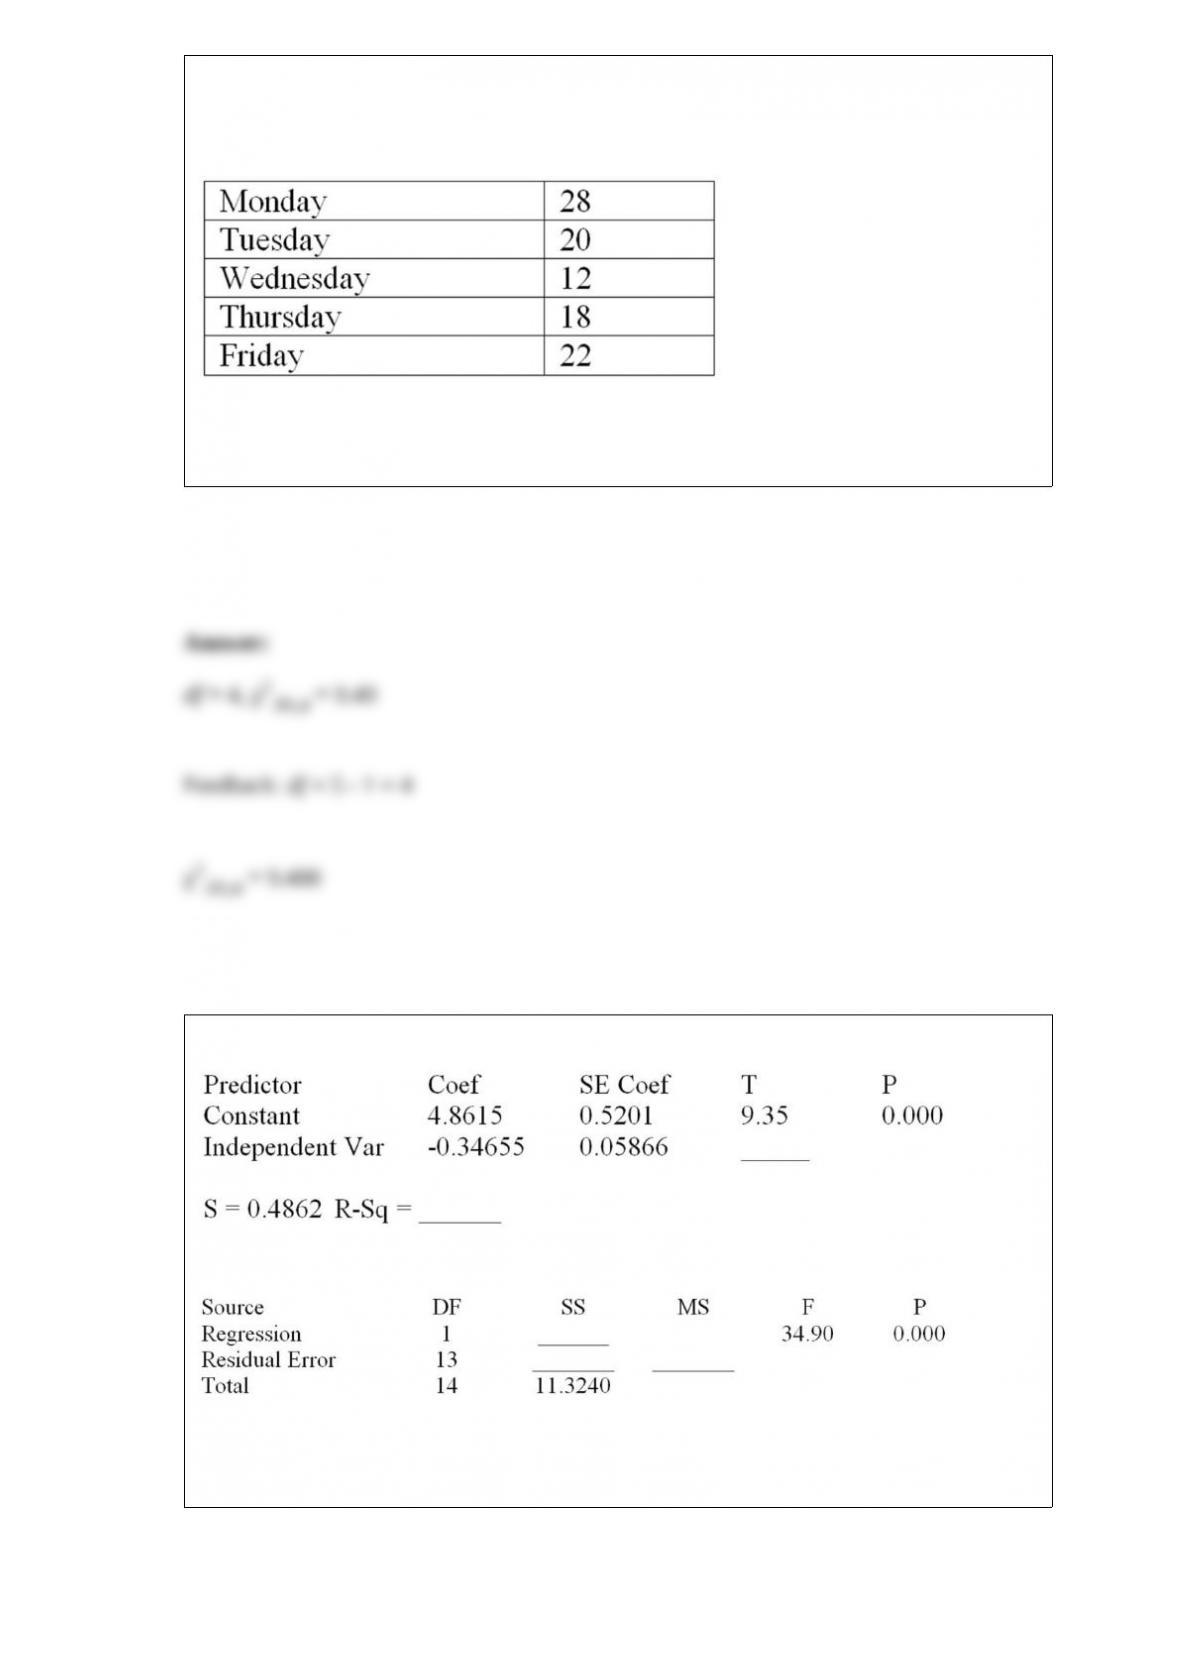
A human resource manager is interested in whether absences occur during the week
with equal frequency. The manager took a random sample of 100 absences and created
the following table:
How many degrees of freedom are associated with the chi-square test? Use α = .05 and
determine the rejection point condition of the chi-square statistic.
Consider the following partial computer output from a simple linear regression analysis.
Analysis of Variance
Determine the 95 percent prediction interval for the mean value of y when x = 9.00.
Givens: ∑x = 129.03, ∑x2 = 1178.547
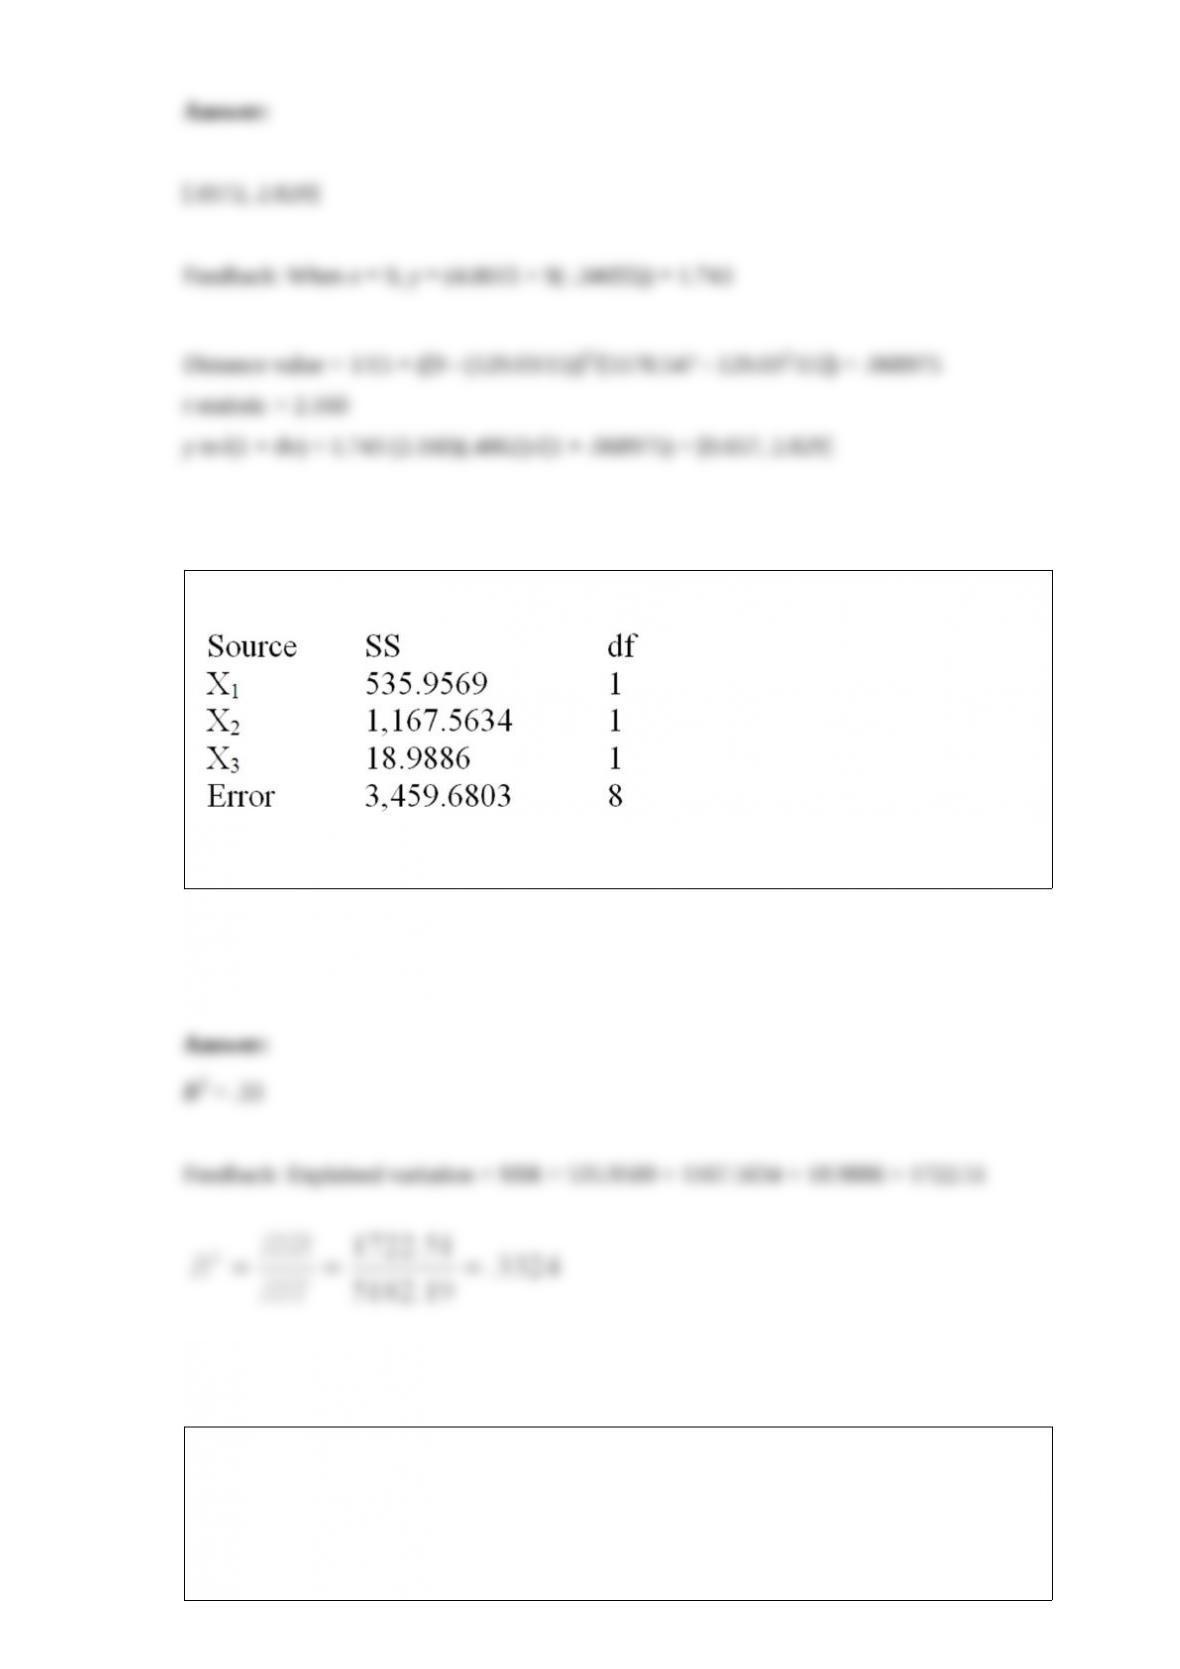
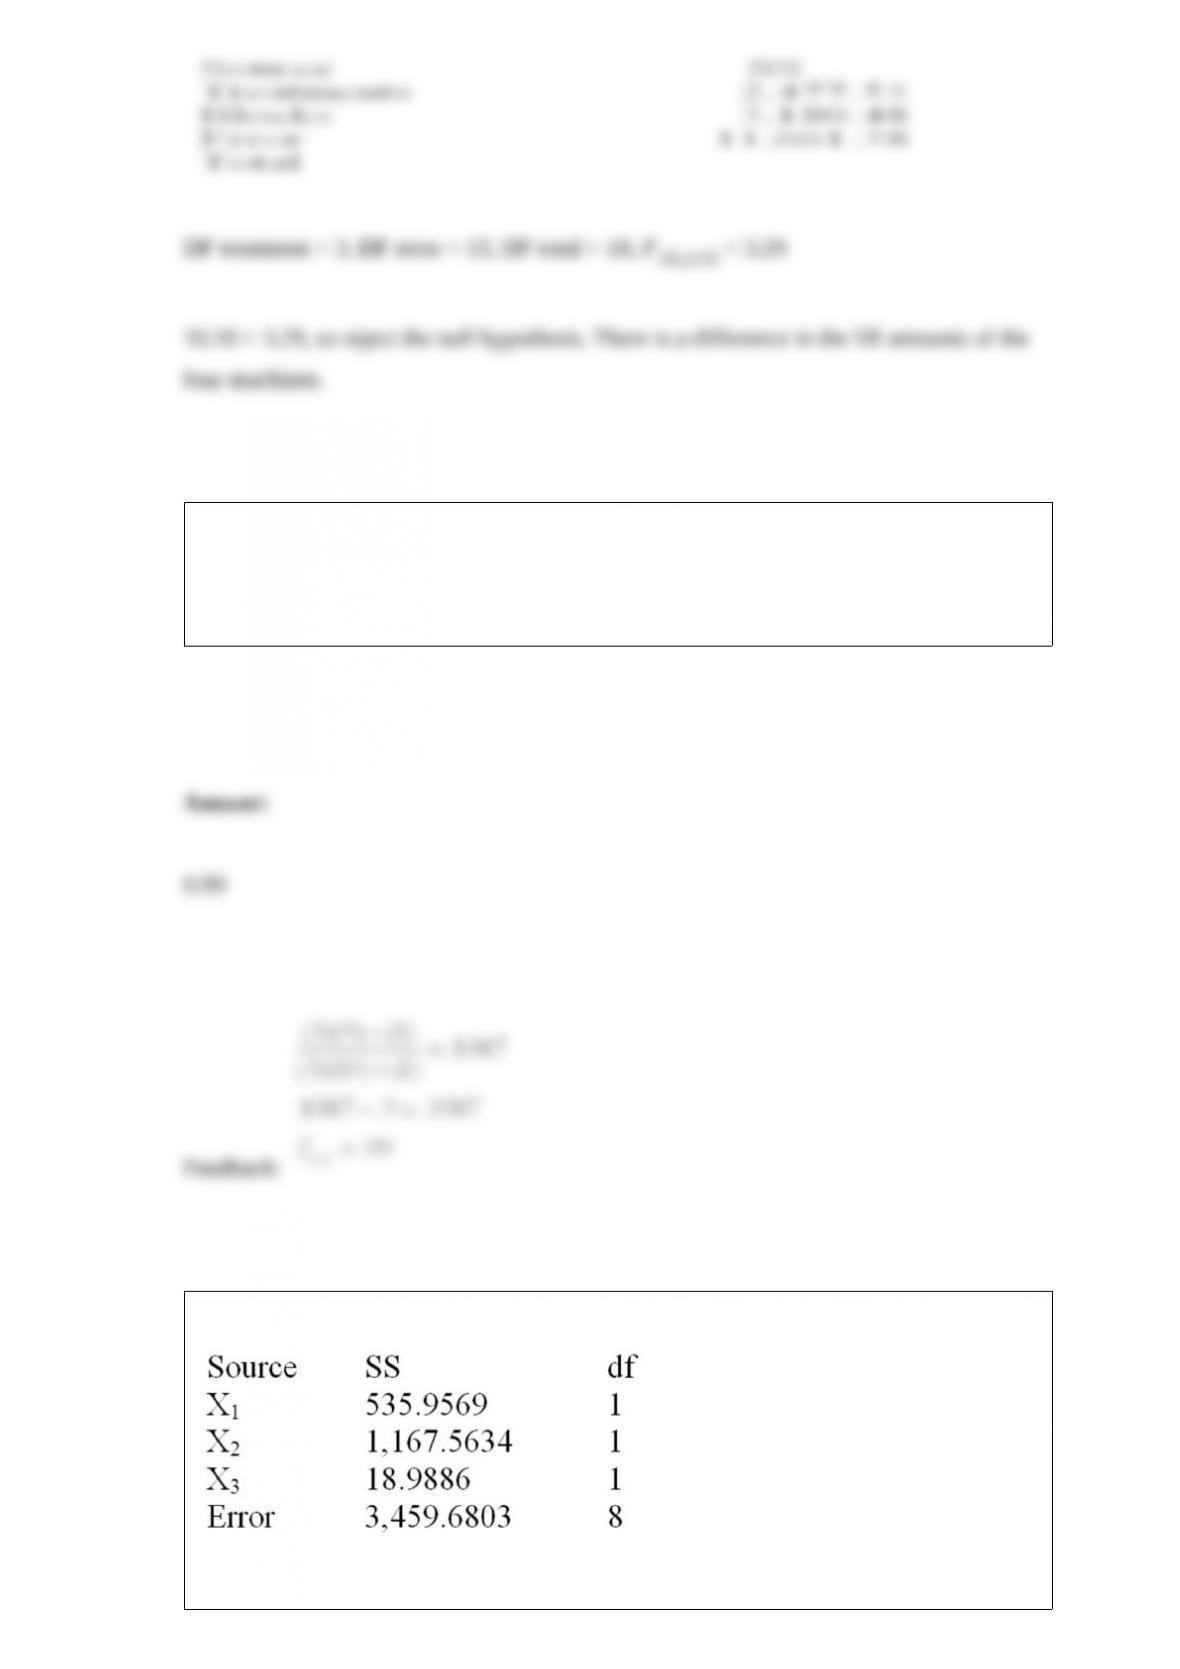
Below is a partial multiple regression ANOVA table.
Calculate the proportion of the variation explained by the multiple regression model.
A local tire dealer wants to predict the number of tires sold each month. He believes
that the number of tires sold is a linear function of the amount of money invested in
advertising. He randomly selects 6 months of data consisting of monthly tire sales (in
thousands of tires) and monthly advertising expenditures (in thousands of dollars). The
simple linear regression equation is ŷ = 3 + 1x. The dealer randomly selects one of the
six observations, with a monthly sales value of 8000 tires and monthly advertising
expenditures of $7000. Calculate the value of the residual for this observation.
Consider the following partial computer output for a multiple regression model.
Test the overall usefulness of the model at α = .01. Calculate F and make your decision.
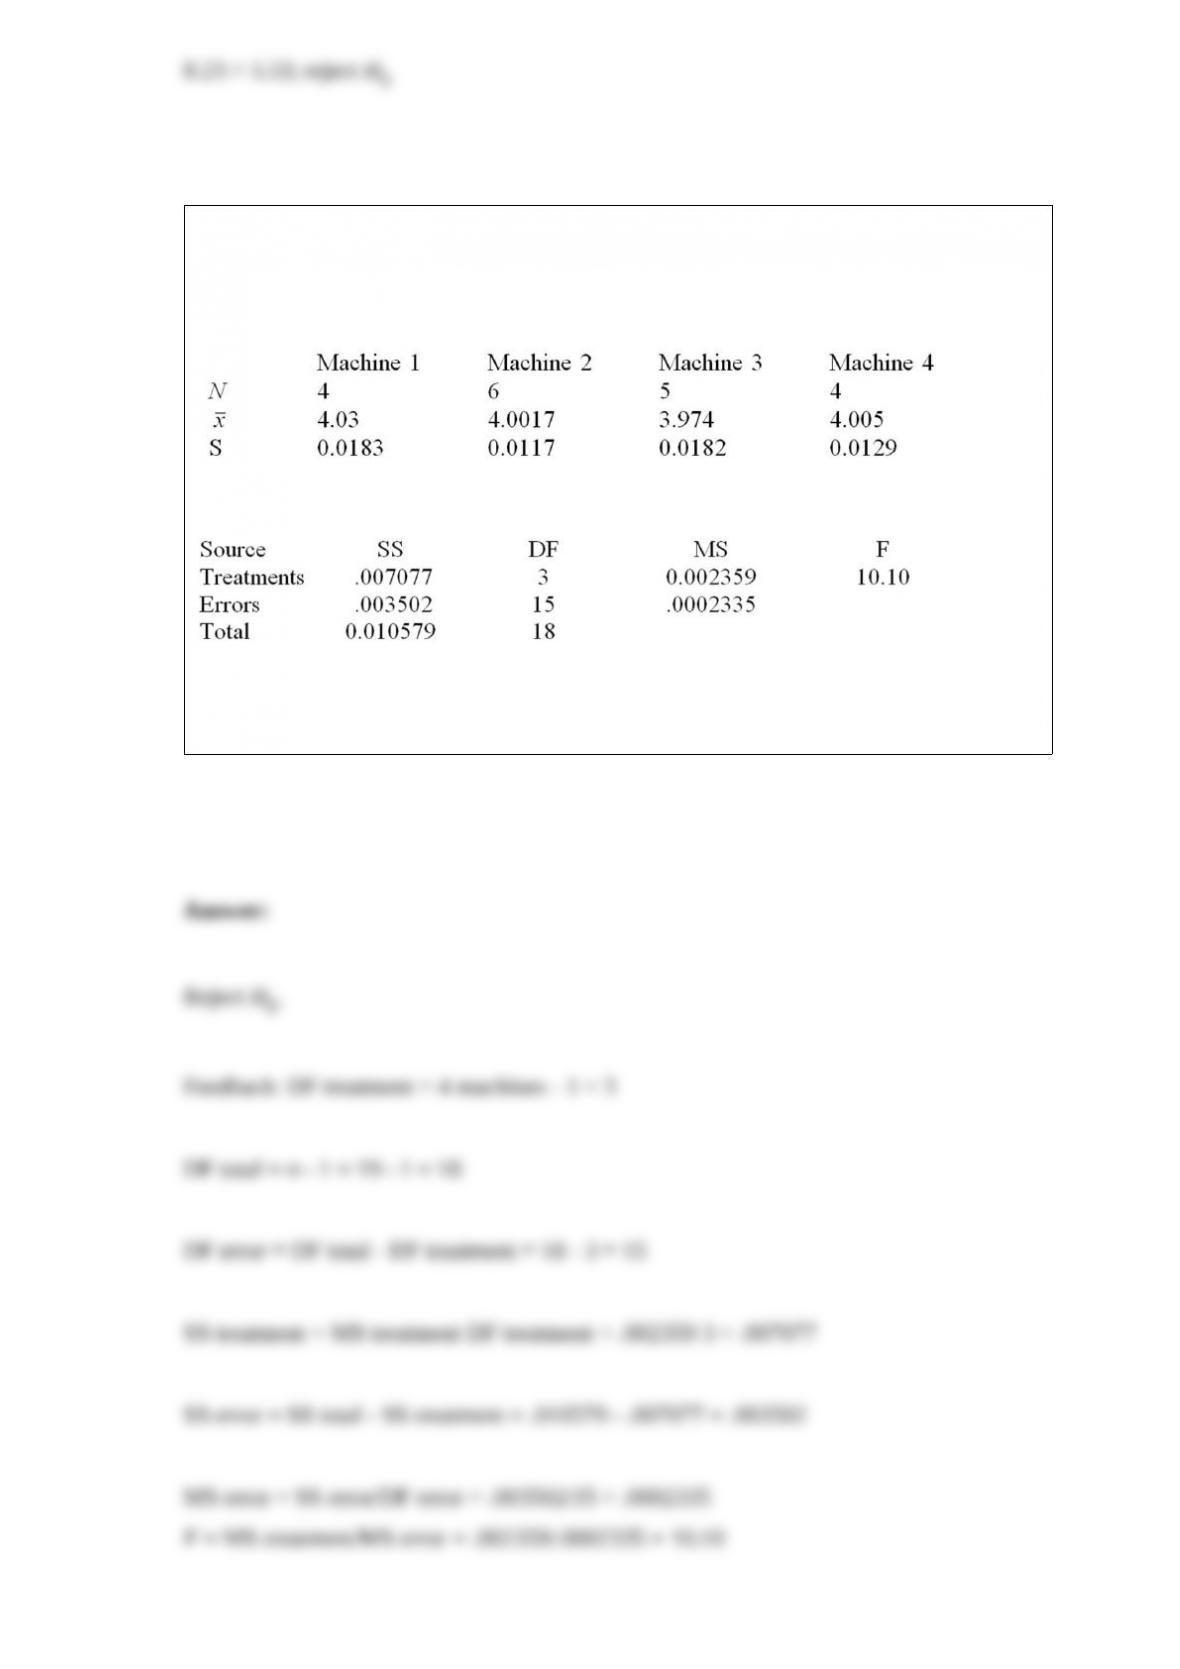
A company that fills gallon containers of water has four machines. The quality control
manager needs to determine whether the average fill for these machines is the same.
Looking at 19 one-gallon containers, we have the following data of fill measures (x) in
quarts.
And the following partial ANOVA table.
Is there a significant difference in the fill amounts of the four machines at α = .05 to
reject the null hypothesis?
An experiment was performed on a certain metal to determine if the strength is a
function of heating time. The sample size consists of 10 metal sheets. Residuals are
calculated for all 10 metal sheets and ordered from smallest to largest. Determine the
normal point for the second largest residual (ninth residual in the ordered array).
Below is a partial multiple regression ANOVA table.
How many observations were in the sample?

An experiment was performed on a certain metal to determine if the strength is a
function of heating time. Results based on 10 metal sheets are given below. Use the
simple linear regression model.
Find the t statistic and test H0: b1 ≤ 0 vs. Ha: b1 > 0 at α = .05.

A data set with 7 observations yielded the following. Use the simple linear regression
model.
SSE = 1.117
Calculate the correlation coefficient.
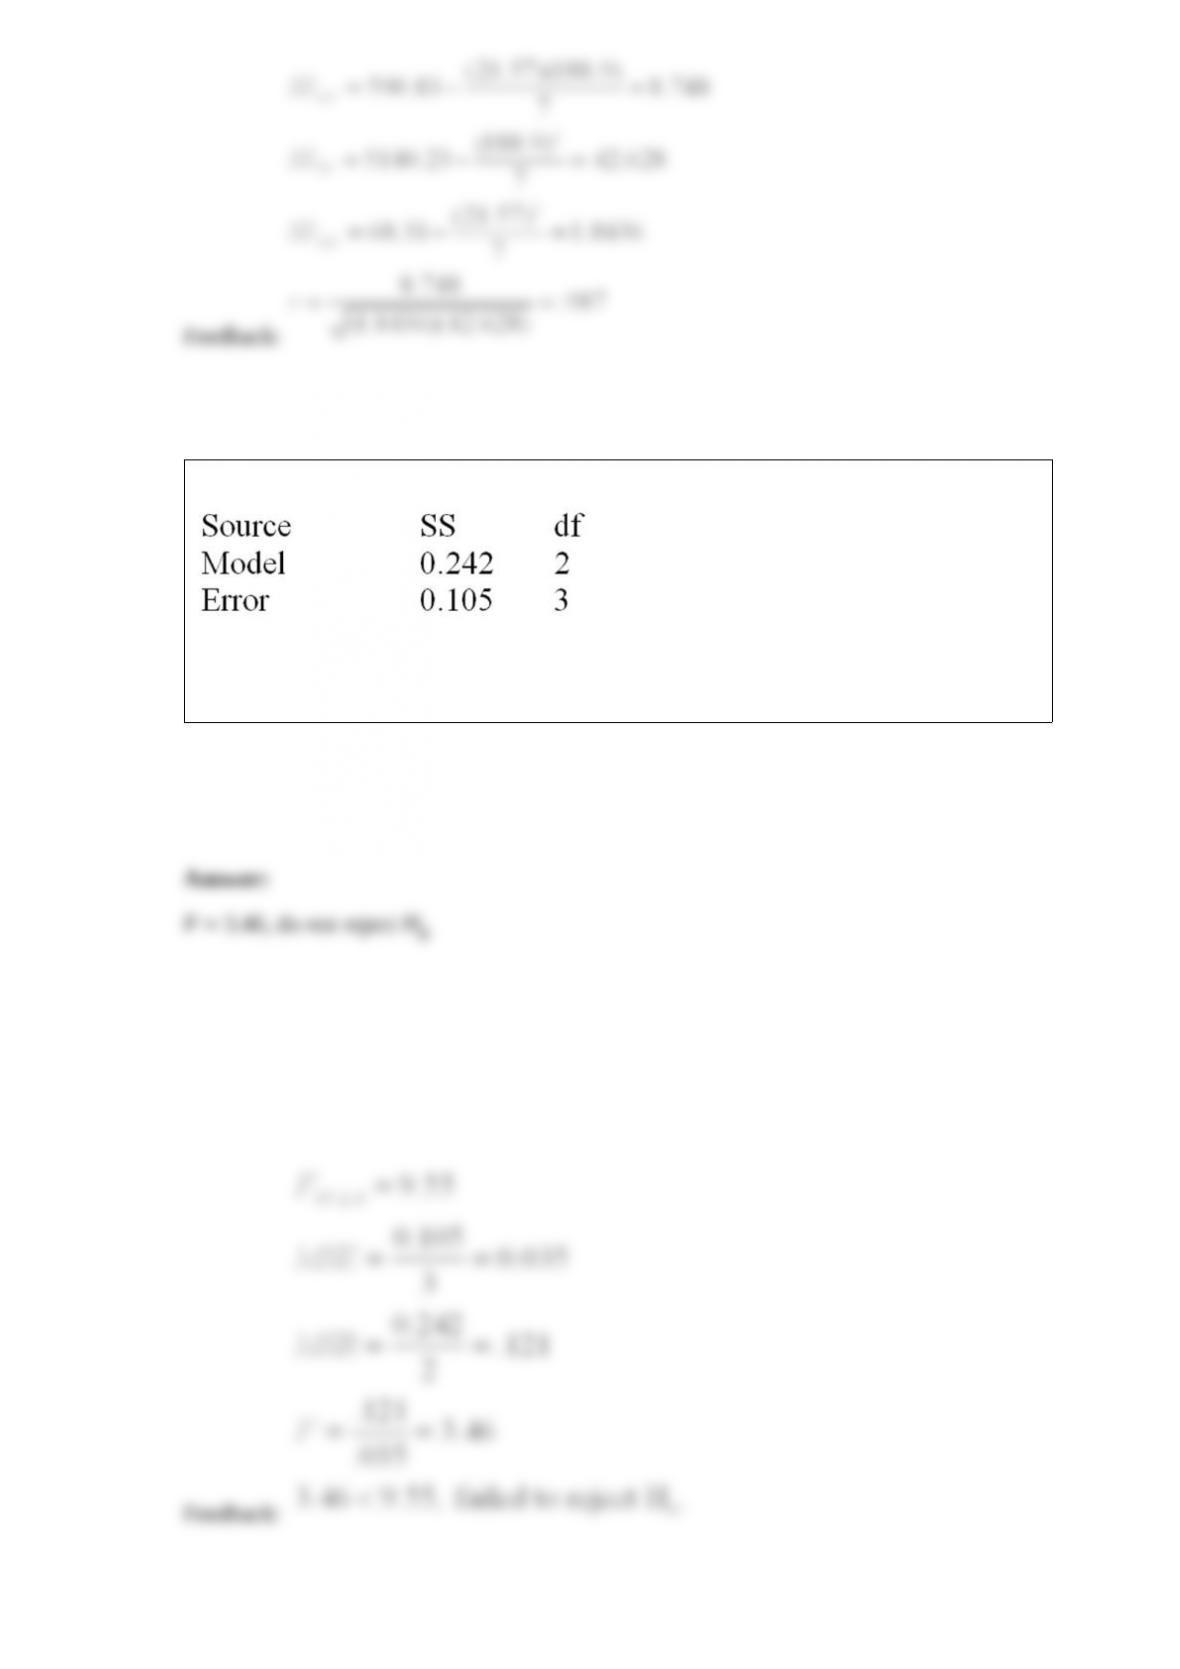
Below is a partial multiple regression ANOVA table.
Test the overall usefulness of the model at α = .05. Calculate the F statistic and make
your decision.
Consider the following calculations for a one-way analysis of variance from a
completely randomized design with 20 total observations.
Compute a 95 percent confidence interval for the second treatment mean.
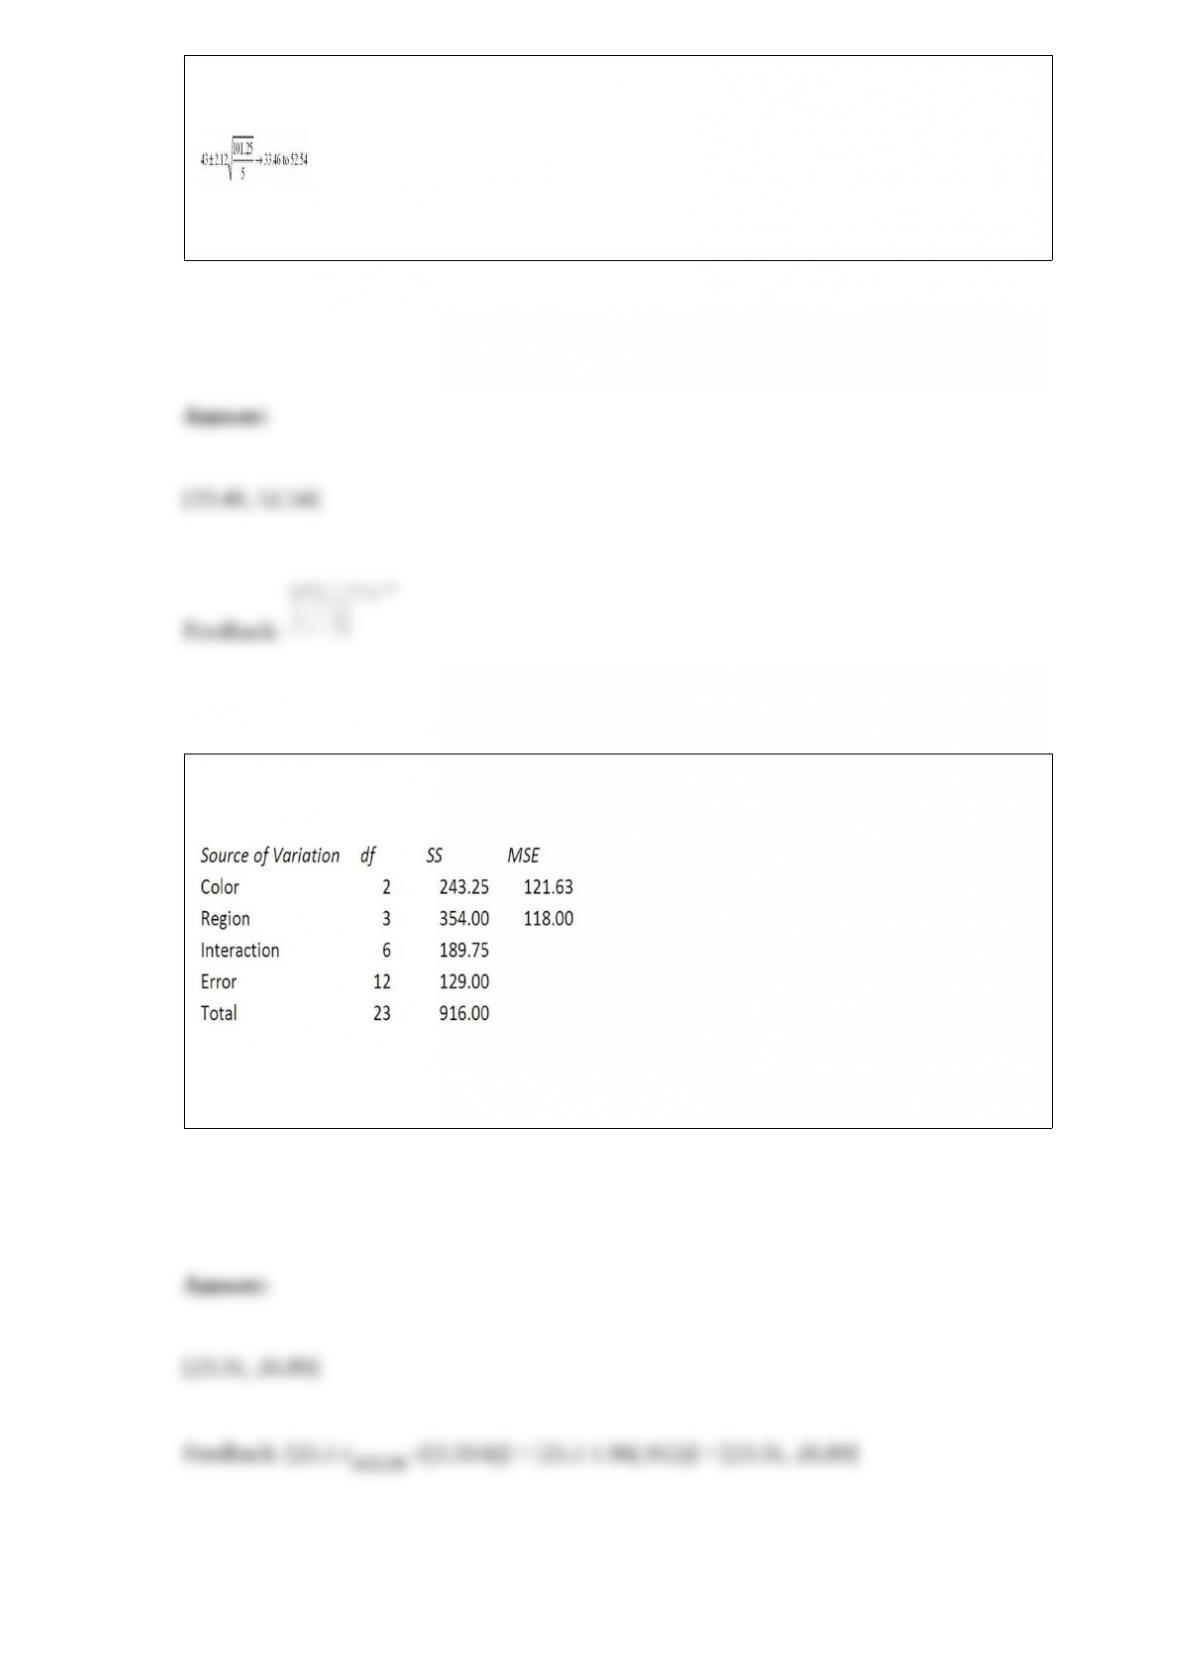
Consider a two-way analysis of variance experiment with treatment factors A and B.
The results are summarized below:
Find an individual 95 percent confidence interval of the mean response of 25.1 obtained
when using level 1 of factor A and level 2 of factor B.
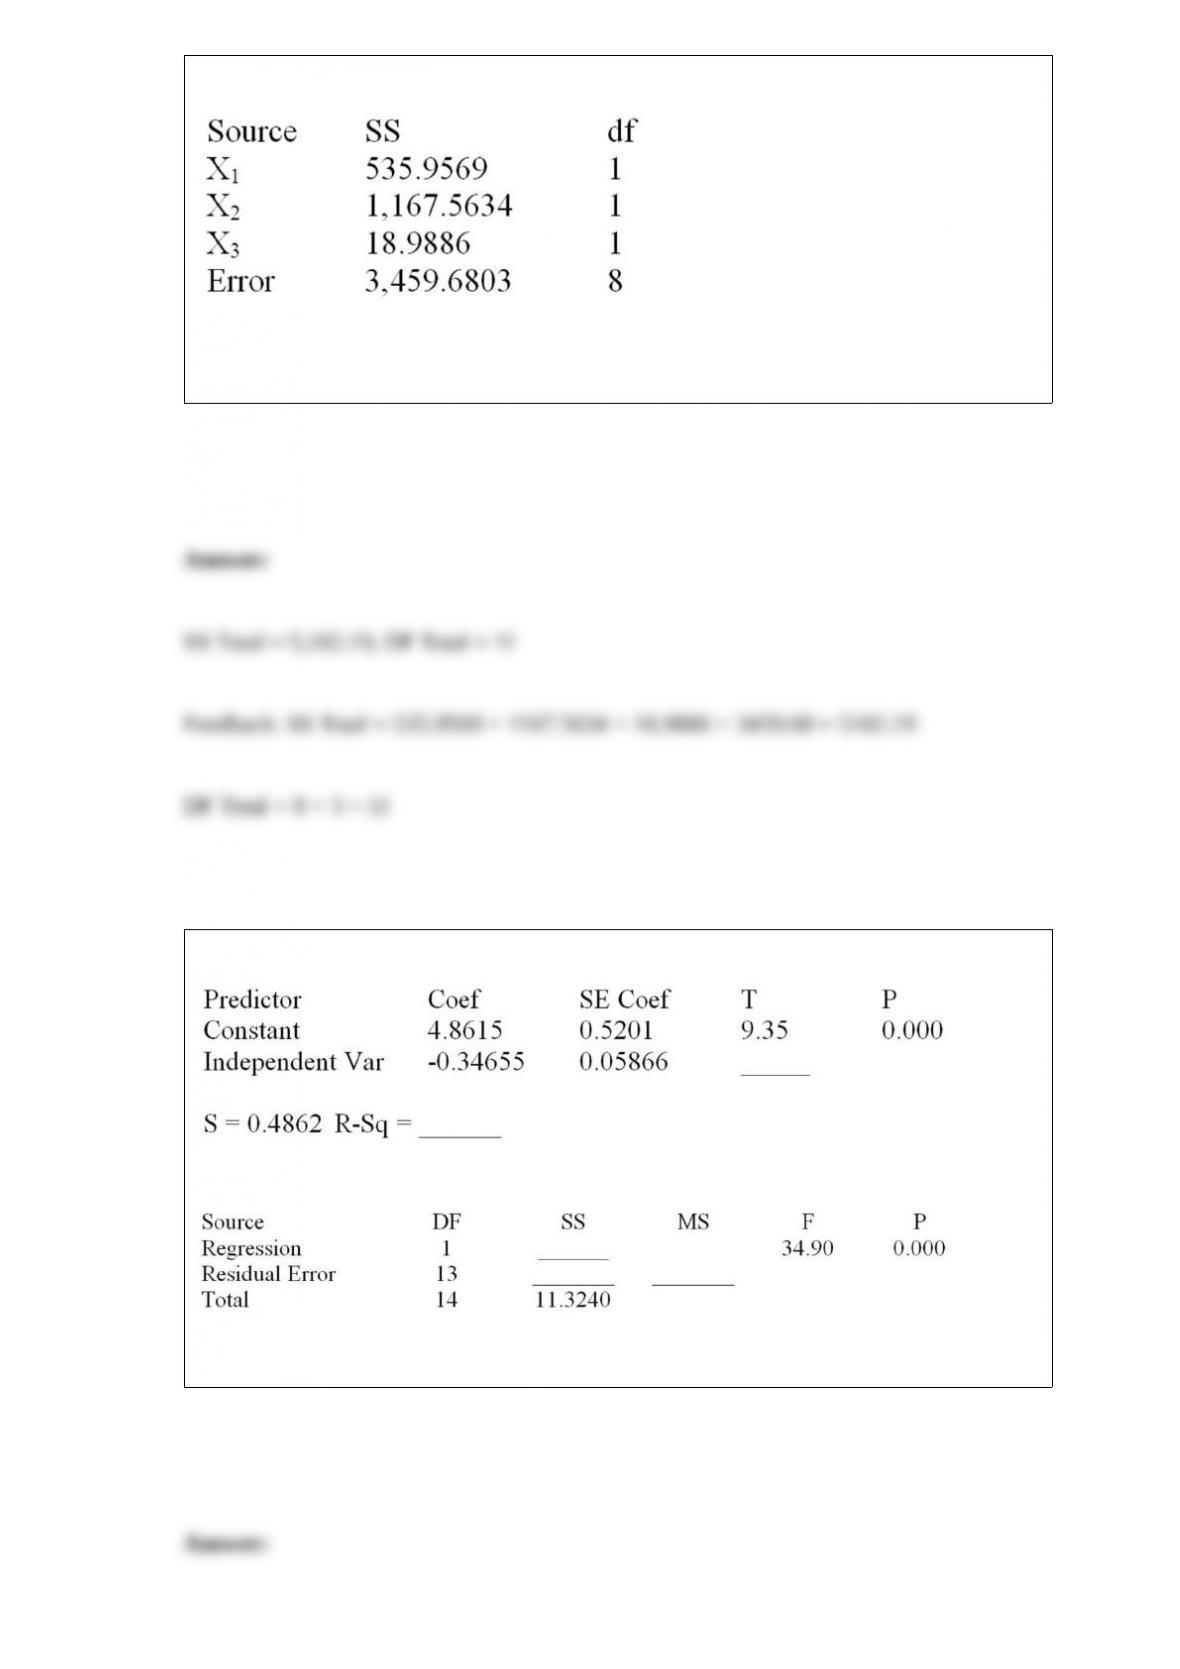
Below is a partial multiple regression ANOVA table.
What is the total sum of squares and the degrees of freedom for the total sum of
squares?
Consider the following partial computer output from a simple linear regression analysis.
Analysis of Variance
Calculate the MSE.