A ___________ is a set of process observations that are examined for the purpose of
constructing control charts.
A. Subgroup
B. Sample
C. Zone
D. List of common causes
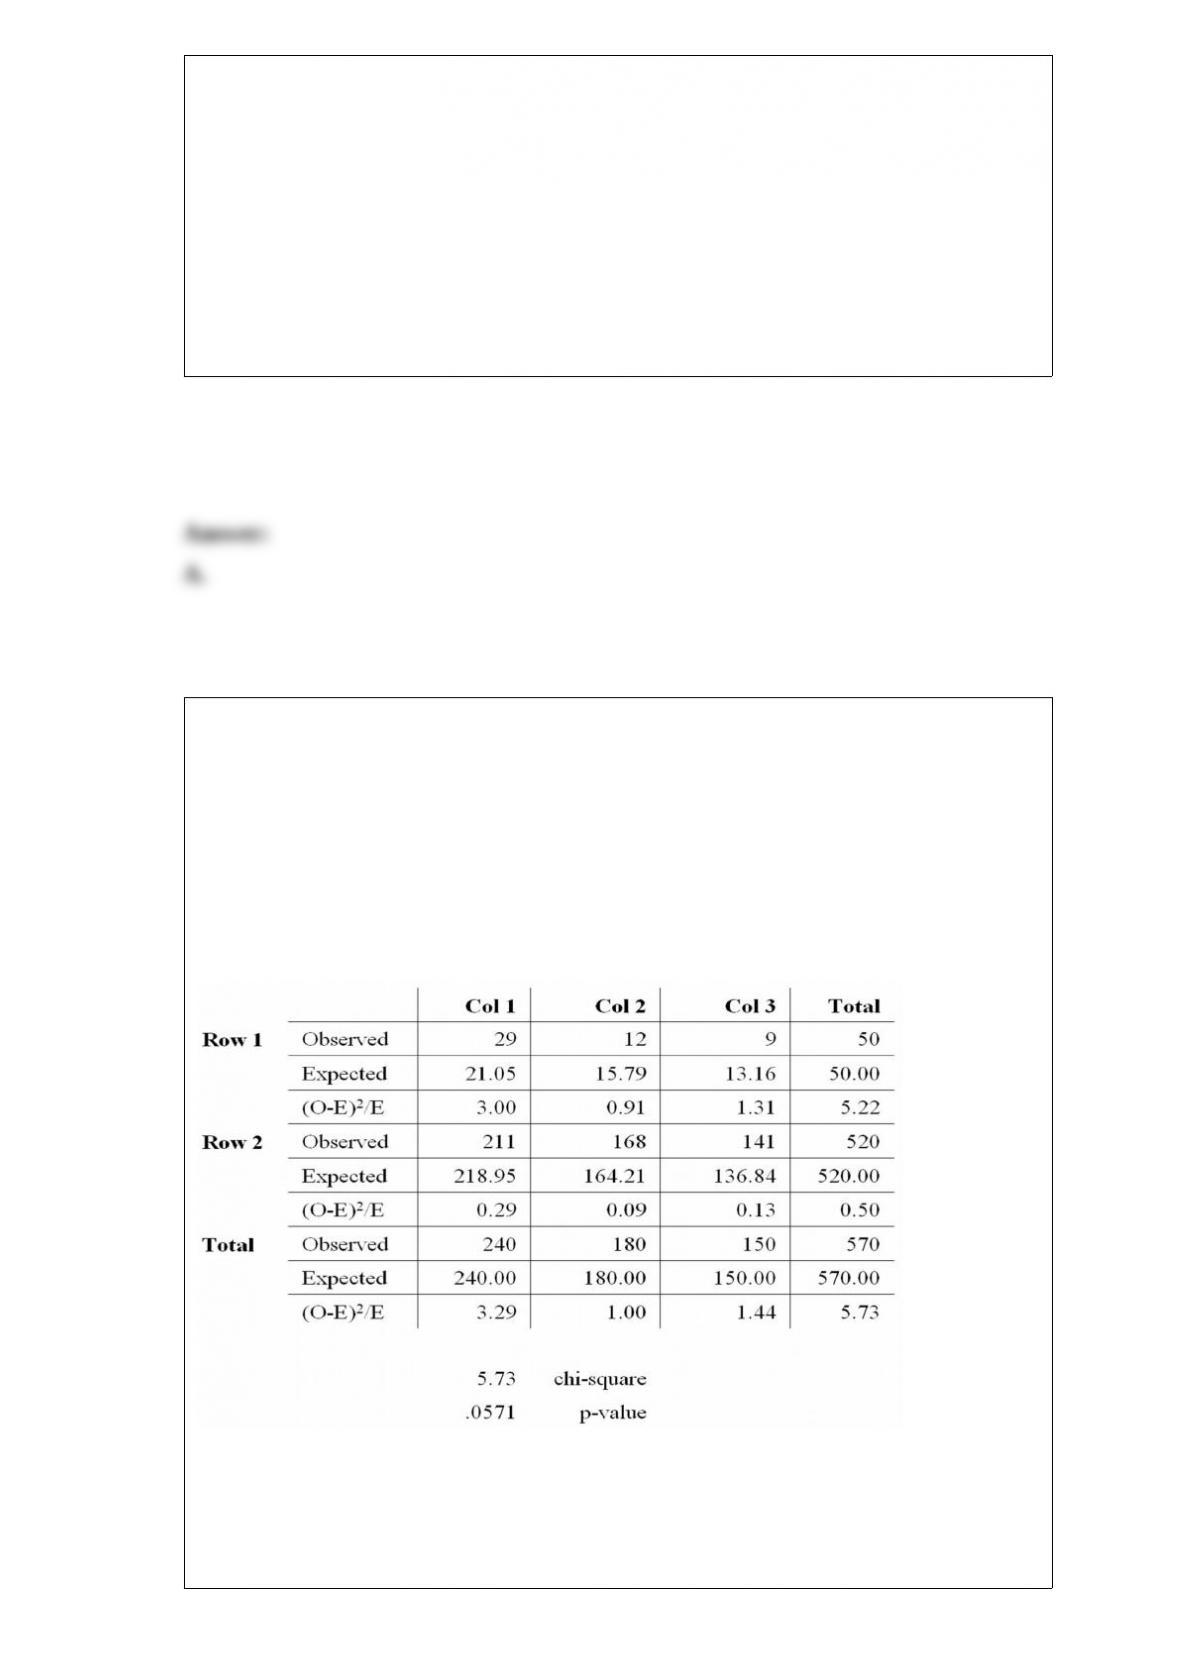
A manufacturing company produces part A732 for the aerospace industry. This
particular part can be manufactured using 3 different production processes. The
management wants to know if the quality of the units of part A732 is the same for all
three processes. The production supervisor obtained the following data: Process 1 had
29 defective units in 240 items, Process 2 produced 12 defective units in 180 items, and
Process 3 manufactured 9 defective units in 150 items.
Chi-Square Contingency Table Test for Independence
At a significance level of .10, the management wants to perform a hypothesis test to
determine if the quality of the items produced appears to be independent of the
production process used. Based on the results summarized in the MegaStat/Excel output
provided in the table above, we:

A. Reject H0 and conclude that the quality of the product is not the same for all
processes.
B. Reject H0 and conclude that the quality of the product is dependent on the
manufacturing process.
C. Do not reject H0, and conclude that the quality of the product does not significantly
differ among the three processes.
D. Reject H0 and conclude that the quality of the product is independent of the
production process utilized.
E. Both reject H0 and conclude that the quality of the product is not the same for all
processes and reject H0 and conclude that the quality of the product is dependent on the
manufacturing process are correct.
The number of degrees of freedom associated with a chi-square test for independence
based upon a contingency table with 4 rows and 3 columns is _____.
A. 7
B. 12
C. 5
D. 6
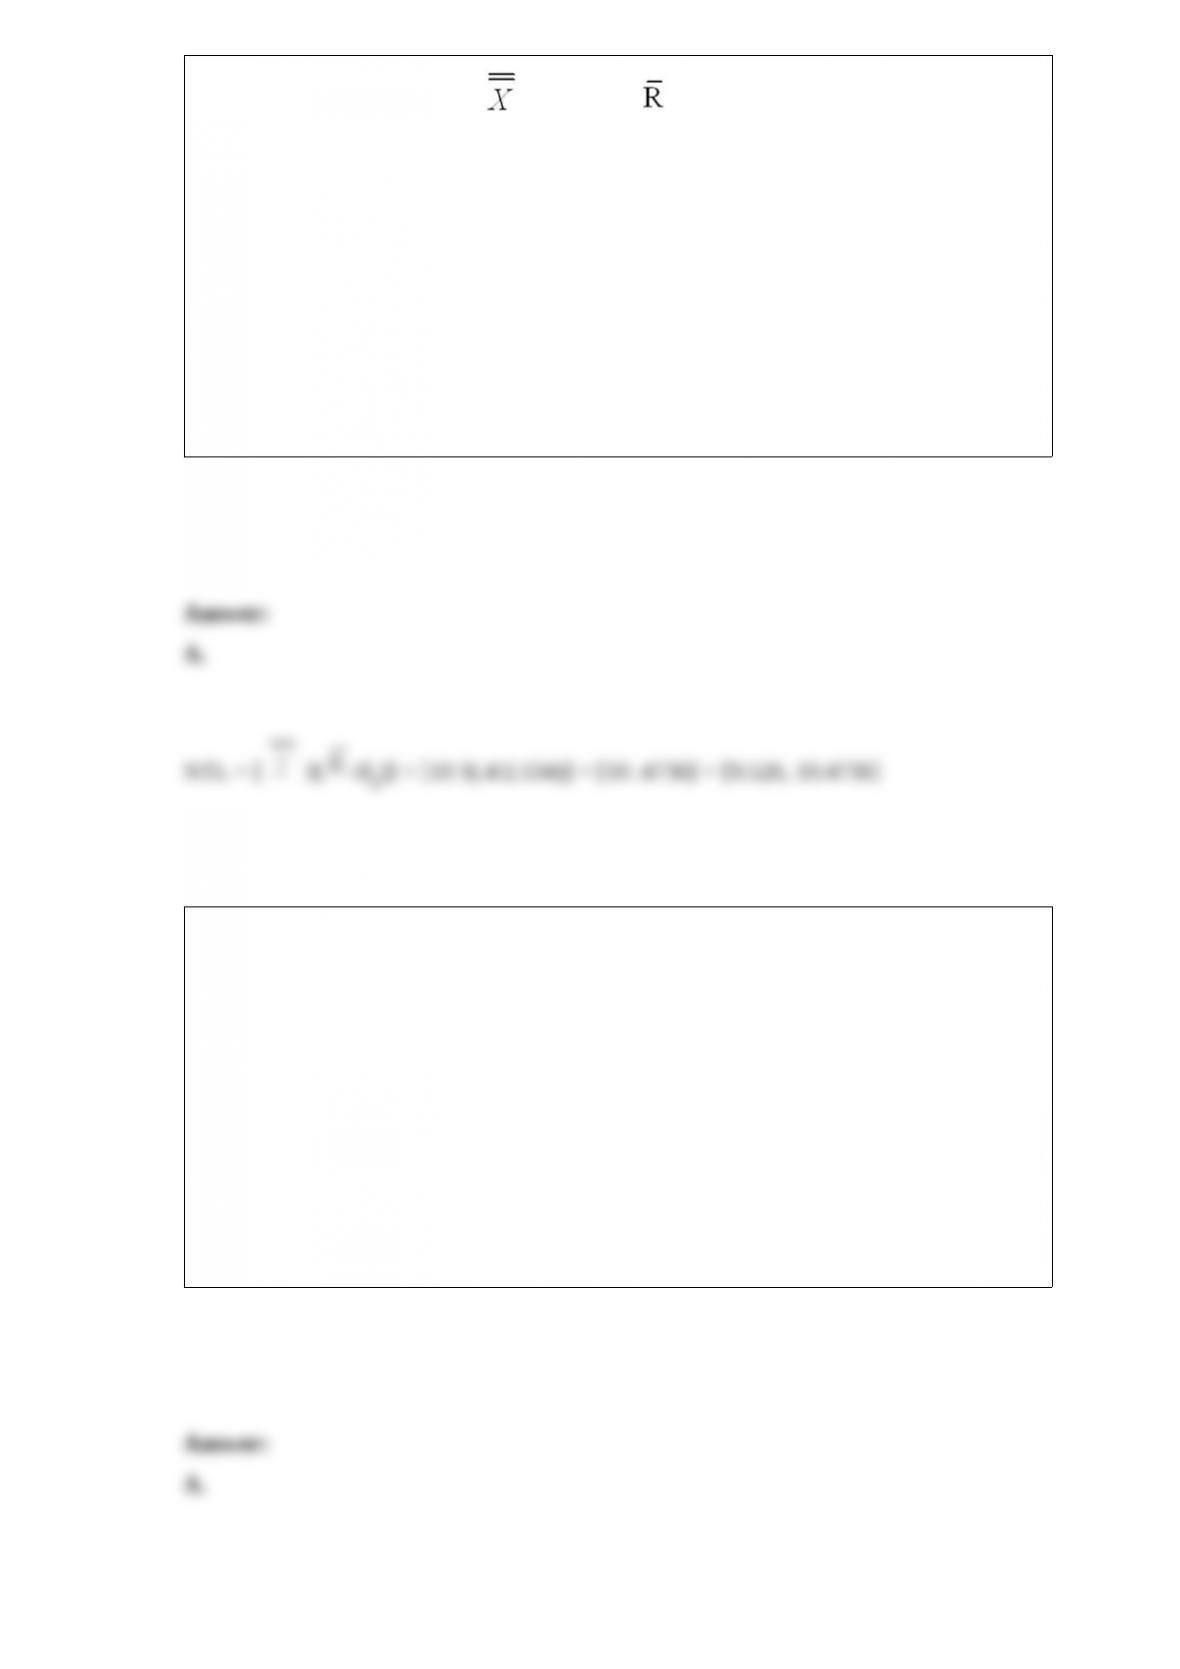
For a manufacturing process, = 10 inches, = .4 inches, and the subgroup sample
size is 6 units. Calculate the natural tolerance limits for this process.
A. [9.526, 10.474]
B. [9.510, 10.490]
C. [9.484, 10.516]
D. [9.807, 10.193]
E. [9.769, 10.231]
A sum of squares that measures the variability among the sample means is referred to as
the:
A. Treatment sum of squares.
B. Error sum of squares.
C. Sum of squares within-treatment.
D. Total sum of squares.
E. Interaction sum of squares.
A multiple regression analysis with 20 observations on each of three independent
variables and the dependent variable would yield ______ and _______ degrees of
freedom, respectively, for regression (explained) and error.
A. 3, 17
B. 3, 16
C. 4, 16
D. 3, 19
E. 3, 20
When computing a confidence interval for the difference between two means, the width
of the (1 – α) confidence interval based on the Tukey procedure will be __________ the
width of the (1 – α) individual confidence interval based on the t statistic.
A. Greater than
B. Less than
C. The same as
D. Sometimes greater than, sometimes less than
In a multiple regression analysis, the current model has three independent variables.
The analyst decides to add another (fourth) independent variable while retaining the

other three independent variables. As a result of this addition, the value of MSE will
____________ decrease.
A. Always
B. Sometimes
C. Never
When we carry out a chi-square goodness-of-fit test for a normal distribution, the null
hypothesis states that the population:
A. Does not have a normal distribution.
B. Has a normal distribution.
C. Has a chi-square distribution.
D. Does not have a chi-square distribution.
E. Has k – 3 degrees of freedom.
A study of car accidents and drivers who use cell phones collects the following sample
data.
Use a significance level of 0.05 and determine if the use of a cell phone and having an
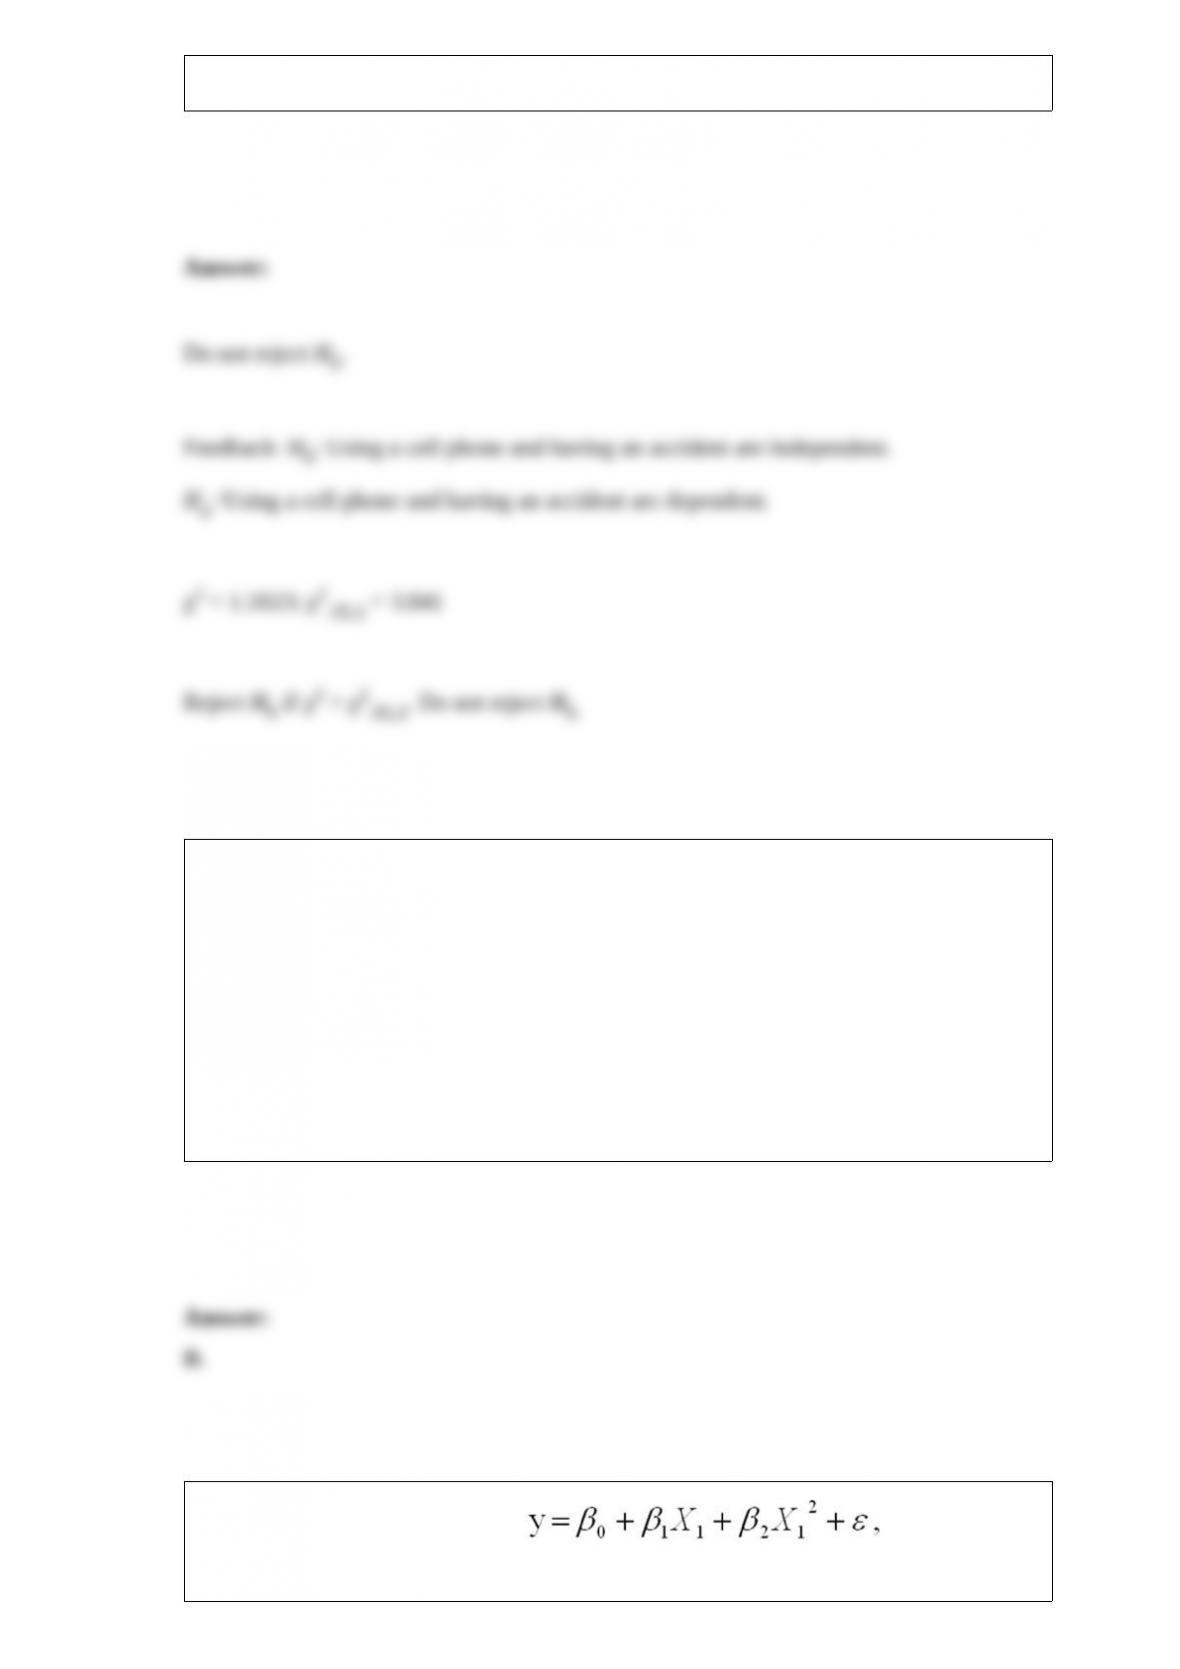
auto accident are independent. (Null hypothesis is that they are independent.)
The coefficient of determination measures the _____________ explained by the simple
linear regression model.
A. Correlation
B. Proportion of variation
C. Standard error
D. Mean square error
In the quadratic regression model the β2 term
represents the:

A. Rate of curvature of the parabola.
B. Value of Y when X is zero.
C. Shift parameter of the parabola.
D. Y-intercept of the parabola.
Which one of the following tools is not used to check the normality of residuals
assumption for a multiple regression model?
A. Histogram
B. Stem-and-leaf display
C. Scatter diagram
D. Normal plot
After analyzing a data set using the one-way ANOVA model, the same data are
analyzed using the randomized block design ANOVA model. SS (Treatment) in the
one-way ANOVA model is _______________ the SS (Treatment) in the randomized
block design ANOVA model.
A. Always equal to
B. Always greater than
C. Always less than
D. Sometimes greater than
The multiple coefficient of determination that relates x2 to all the other independent
variables R2(x2) = .94. Calculate the variance inflation factor for x2. Should the analyst
be concerned about multicollinearity? Why or why not?
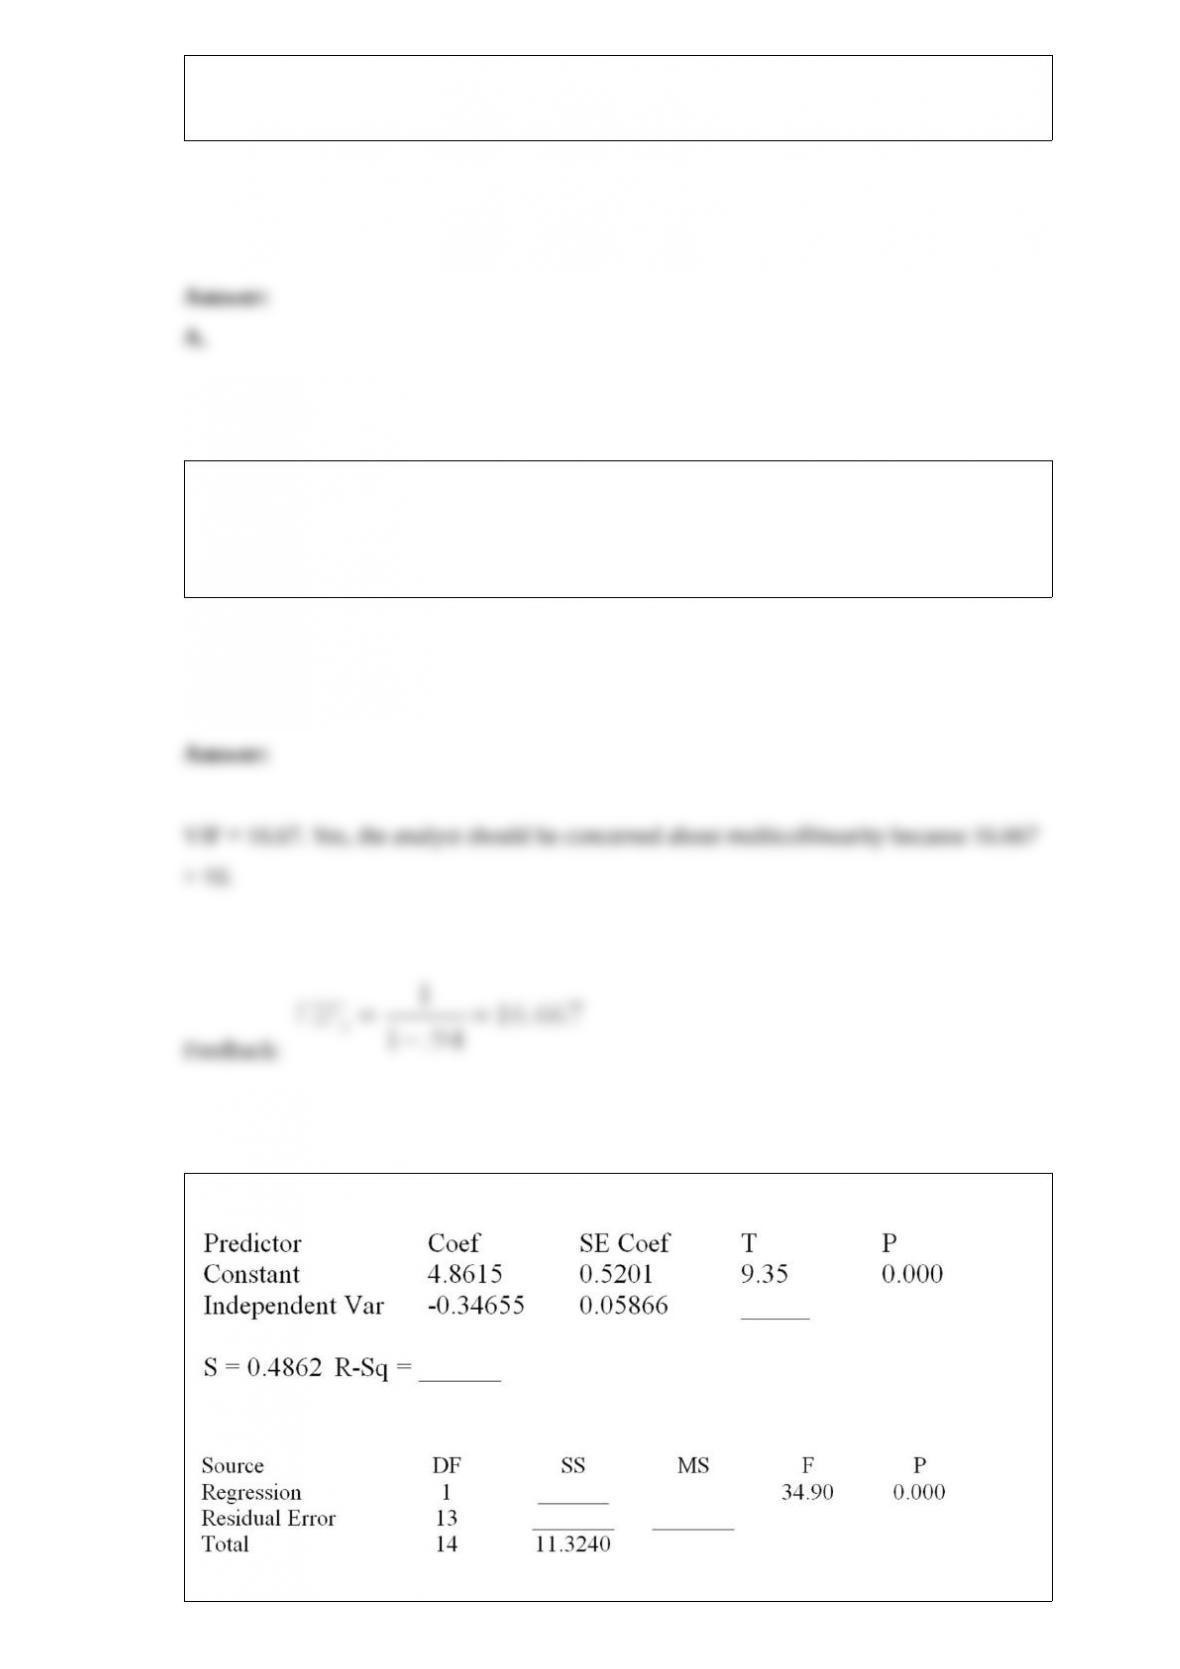
Consider the following partial computer output from a simple linear regression analysis.
Analysis of Variance
Test H0: β1 = 0 versus Ha: β1 ≠ 0 by setting α = .001. What do you conclude about the
relationship between y and x?
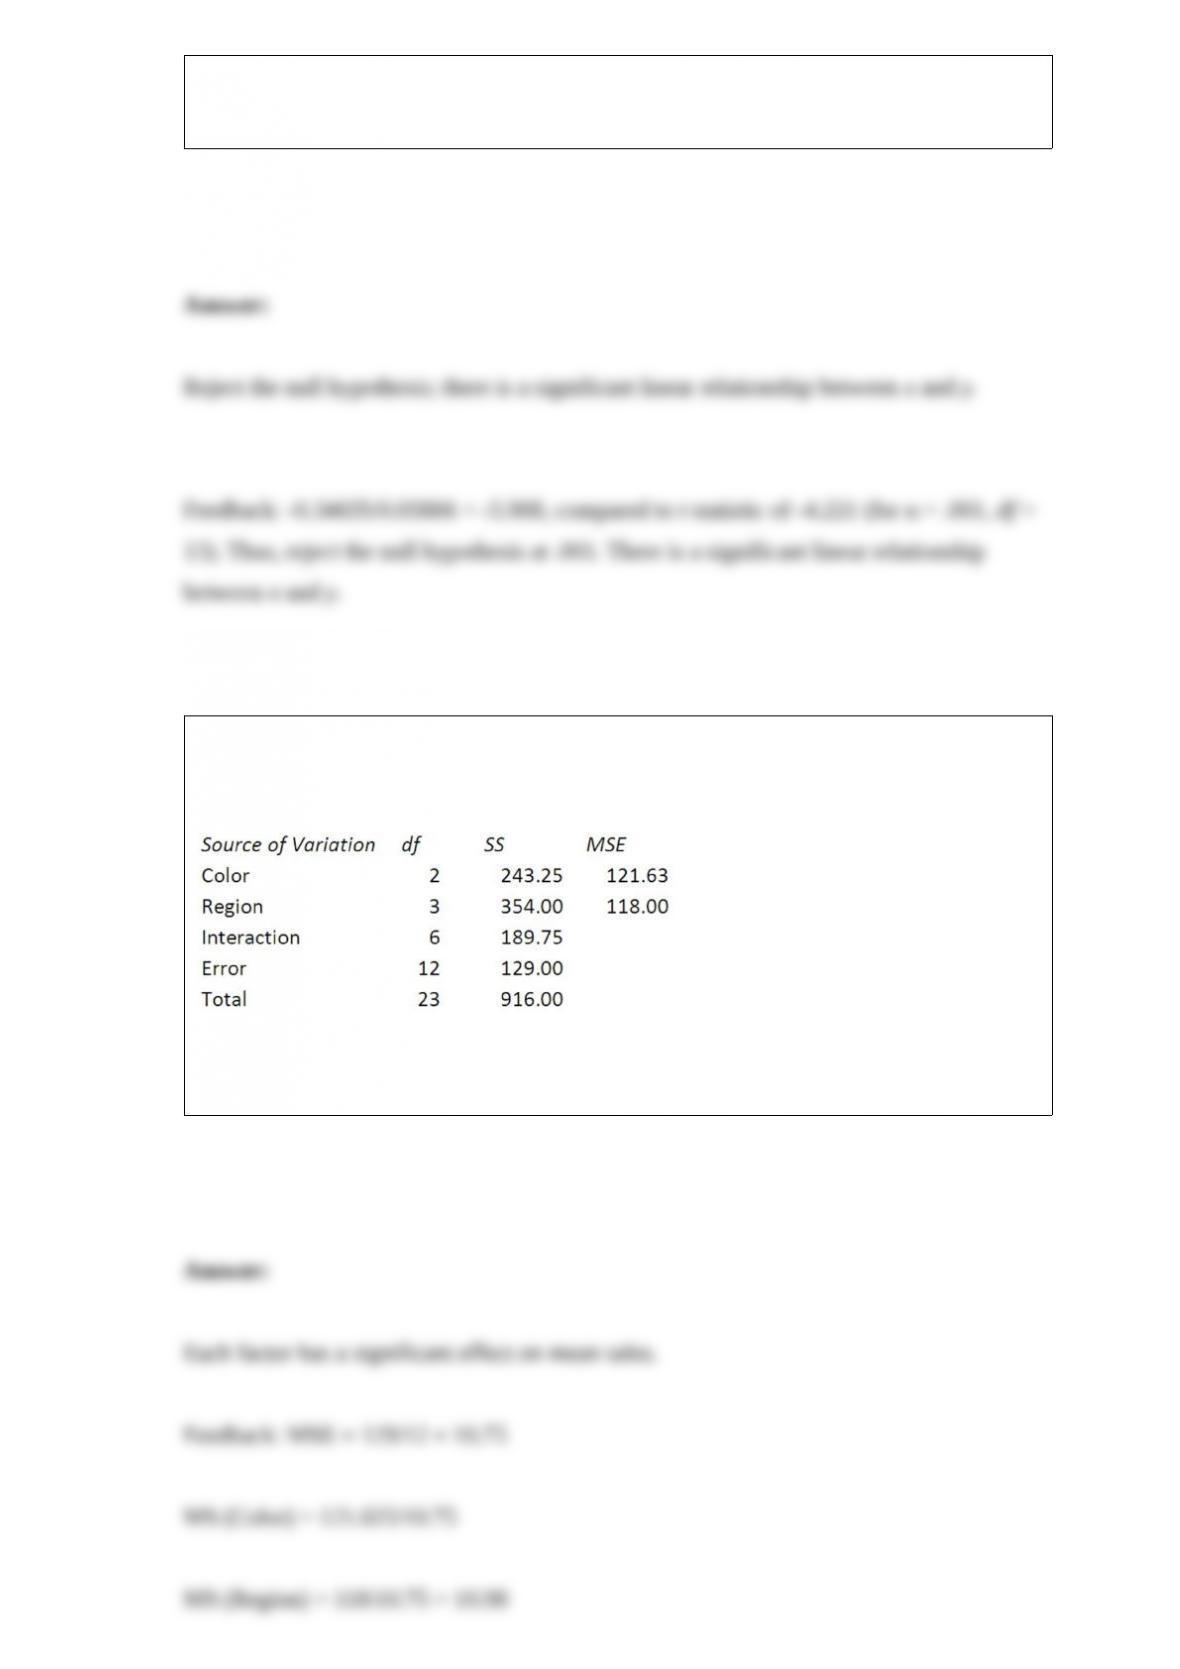
A vitamin-water manufacturer wants to compare the effects on sales of three water
colors: green, blue, and red. Four regions are selected for the test, with the following
ANOVA results.
If there is no interaction effect, test the individual null hypotheses on the effect of each
factor on mean sales at α = .01.
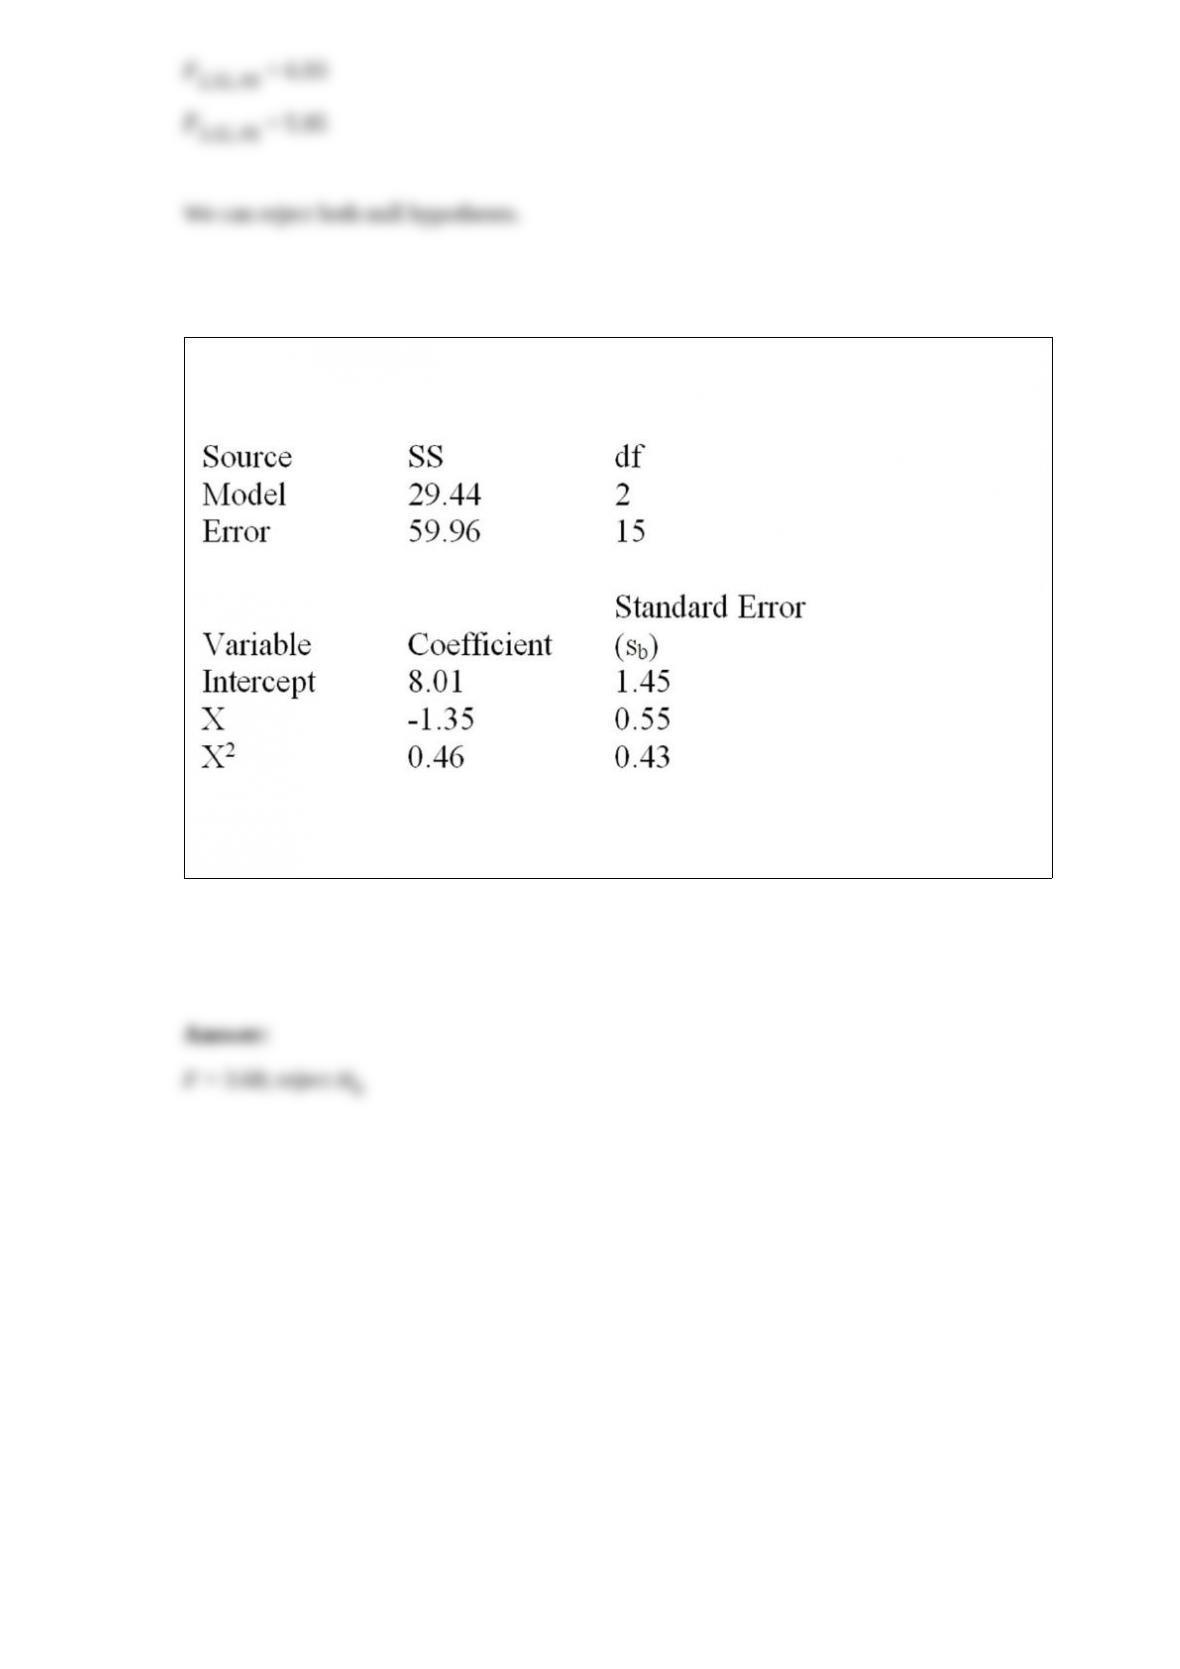
Below is a partial multiple regression computer output based on a quadratic regression
model.
Test the overall usefulness of the model at α = .05. Calculate the F statistic and make
your decision.
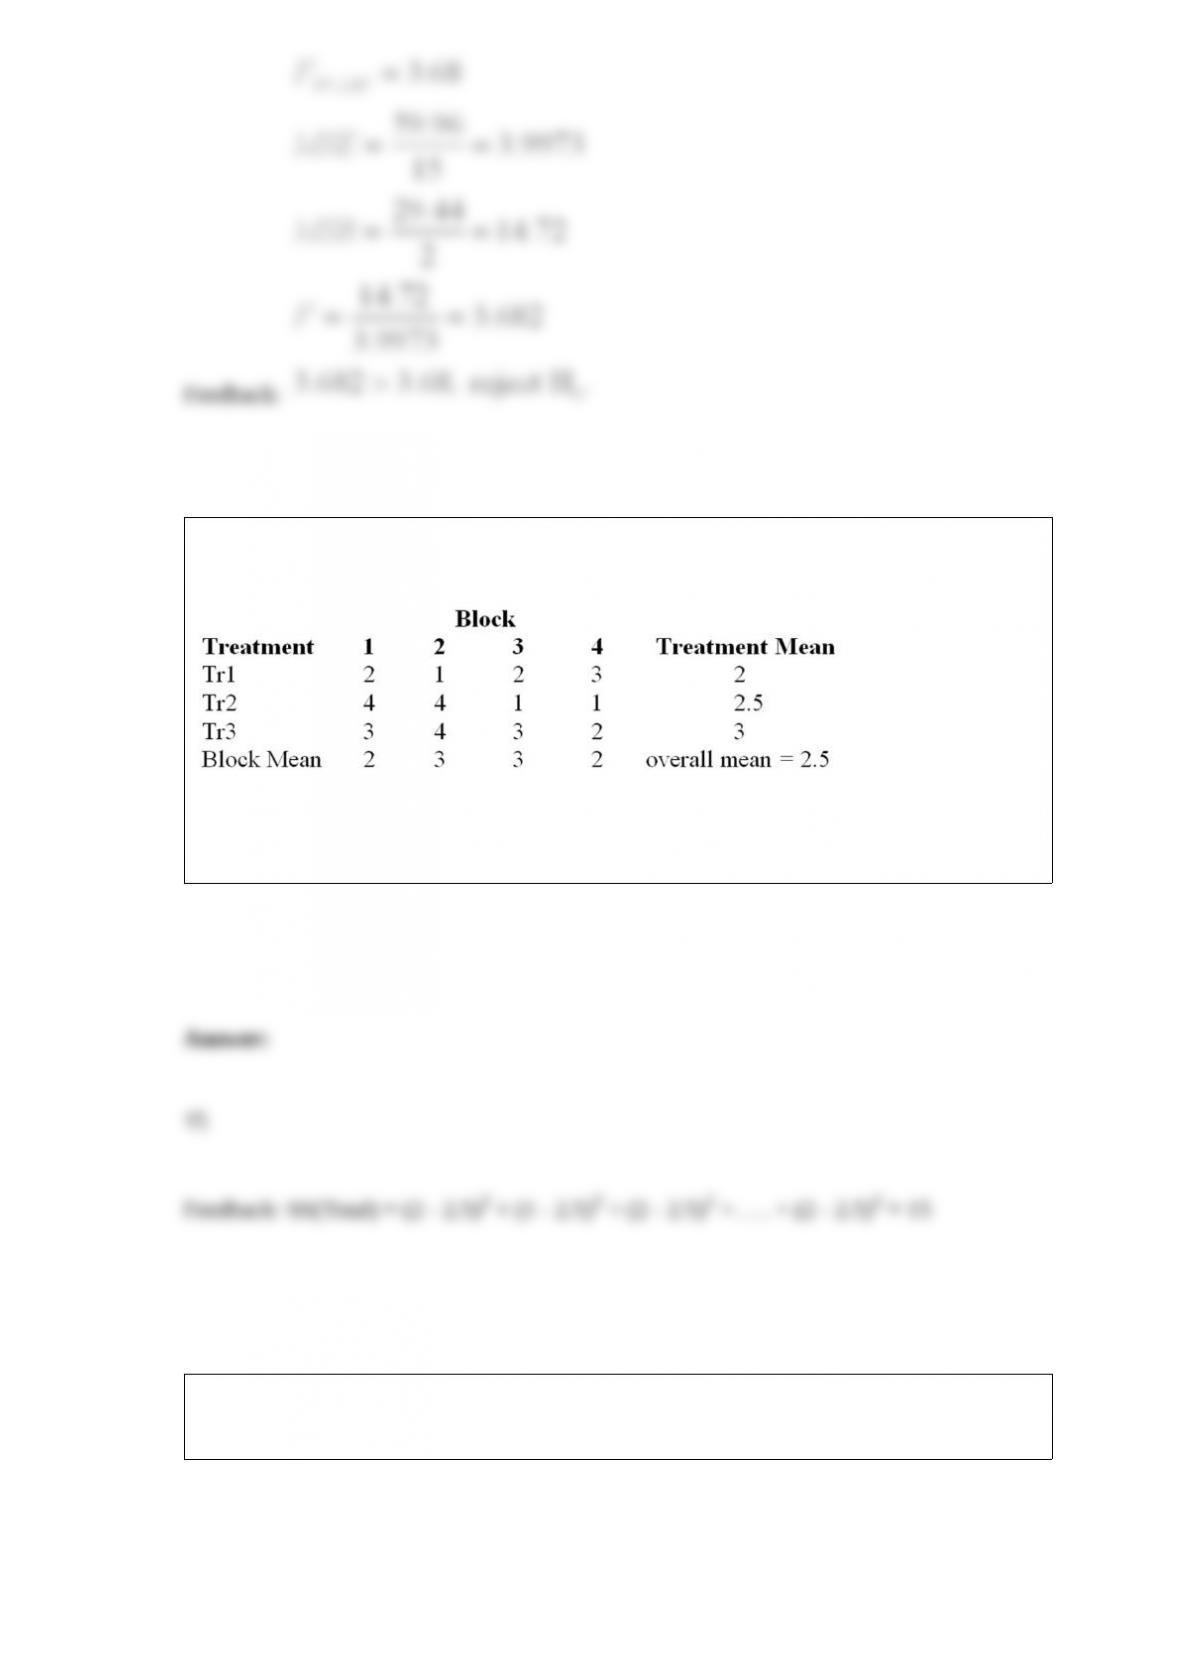
Consider the randomized block design with 4 blocks and 3 treatments given above.
What is the total sum of squares?
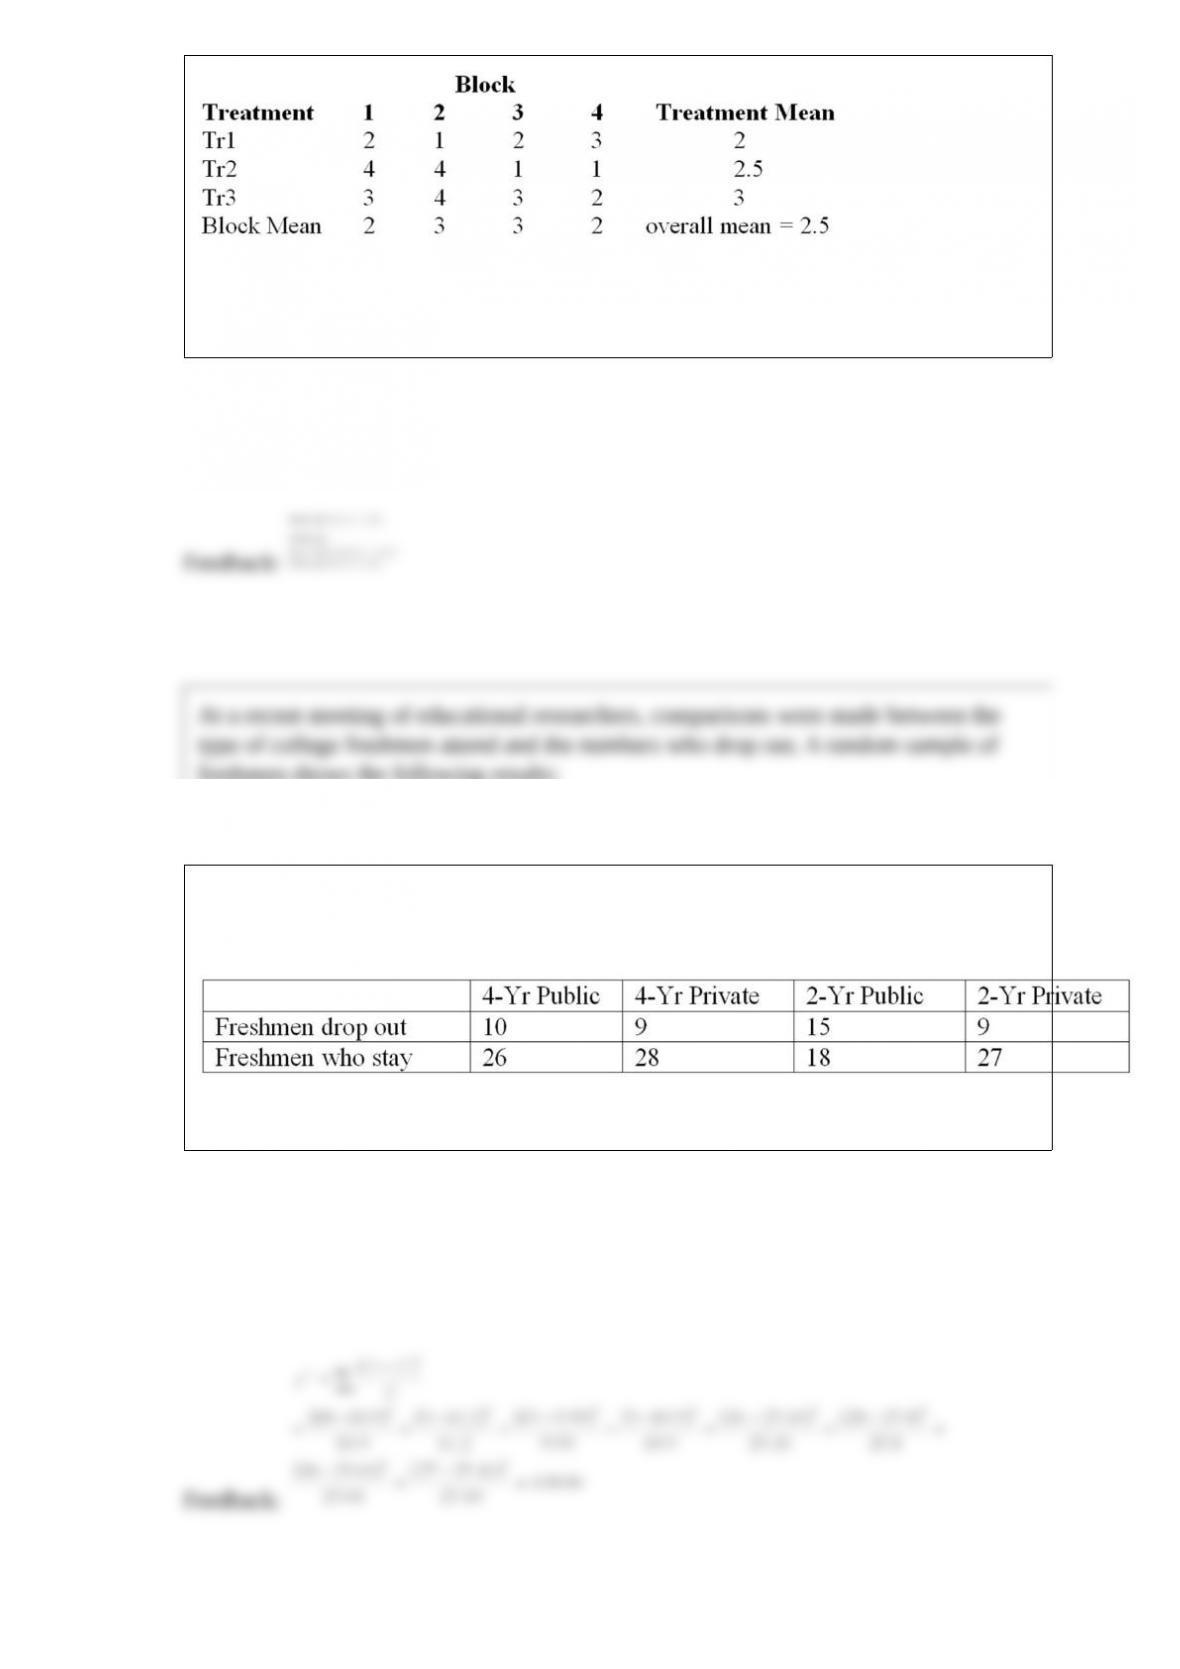
Consider the randomized block design with 4 blocks and 3 treatments given above. Test
H0: there is no difference between treatment effects at α = .05.
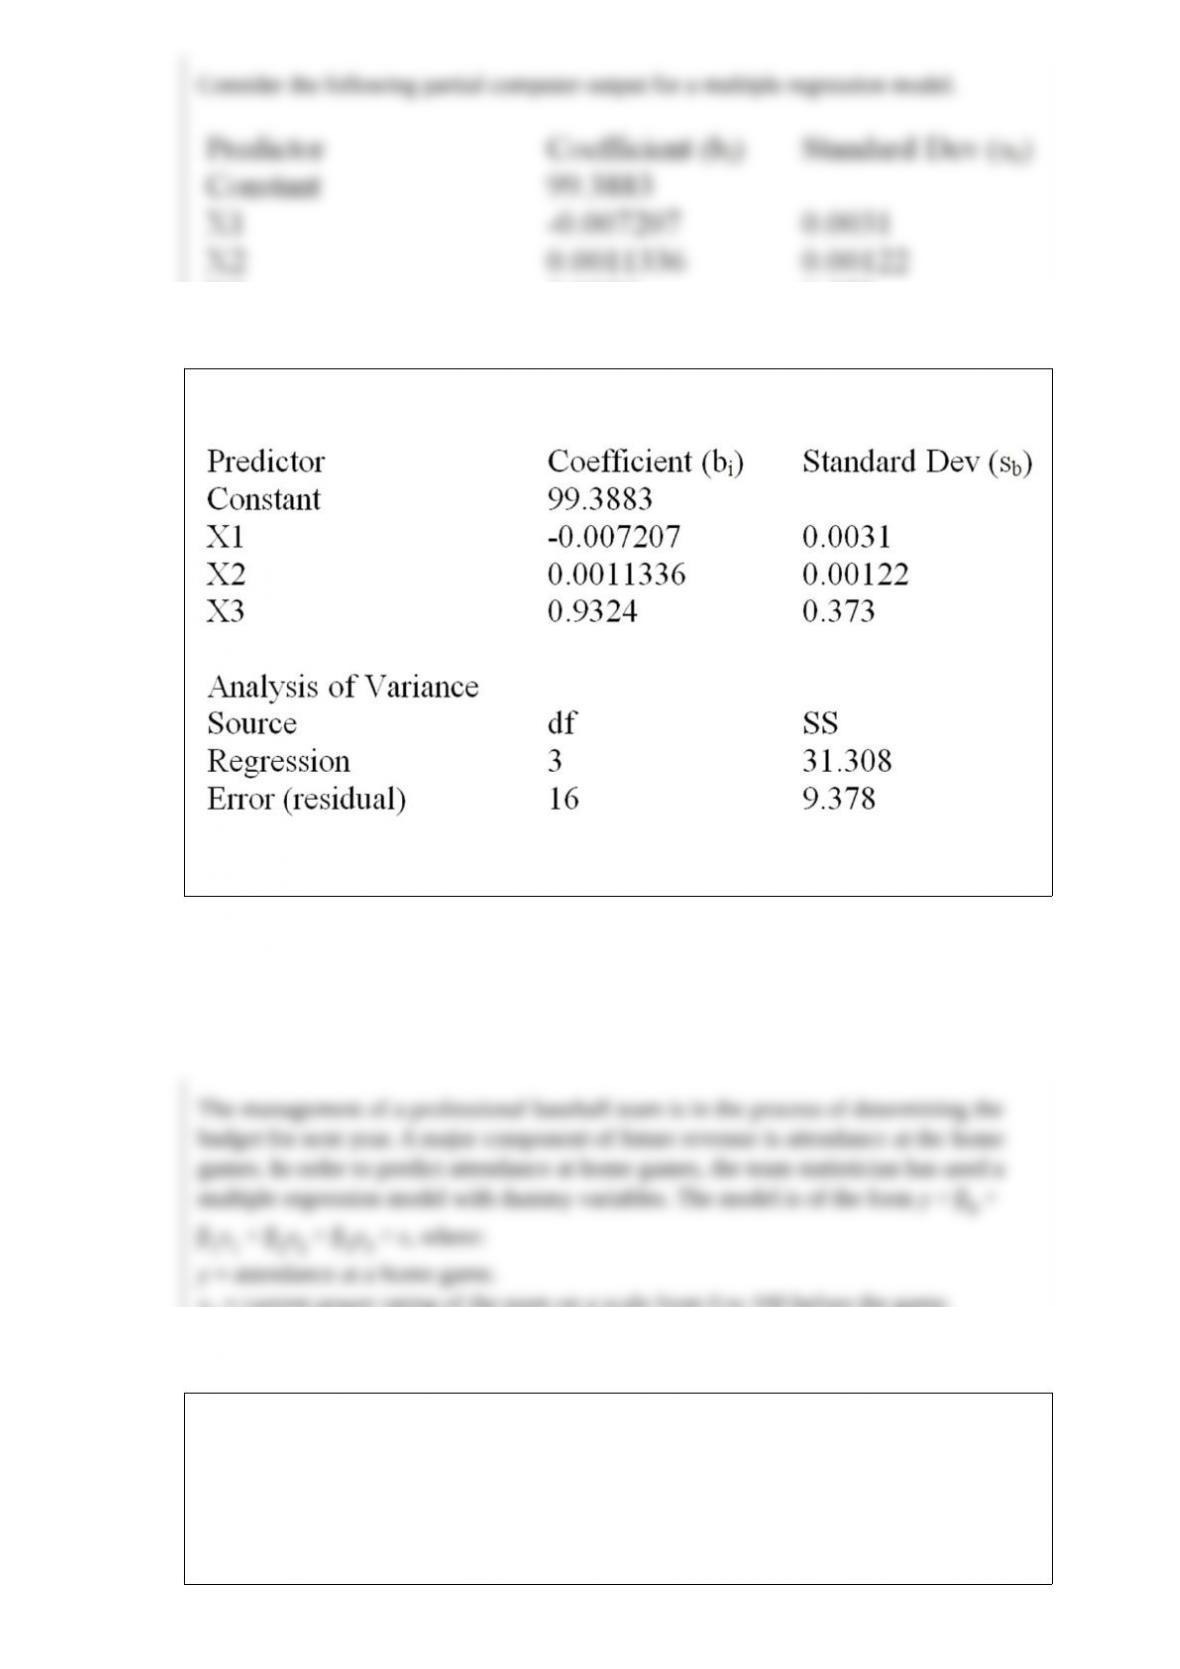
At a recent meeting of educational researchers, comparisons were made between the
type of college freshmen attend and the numbers who drop out. A random sample of
freshmen shows the following results:
Calculate the chi-square statistic for this test of independence.
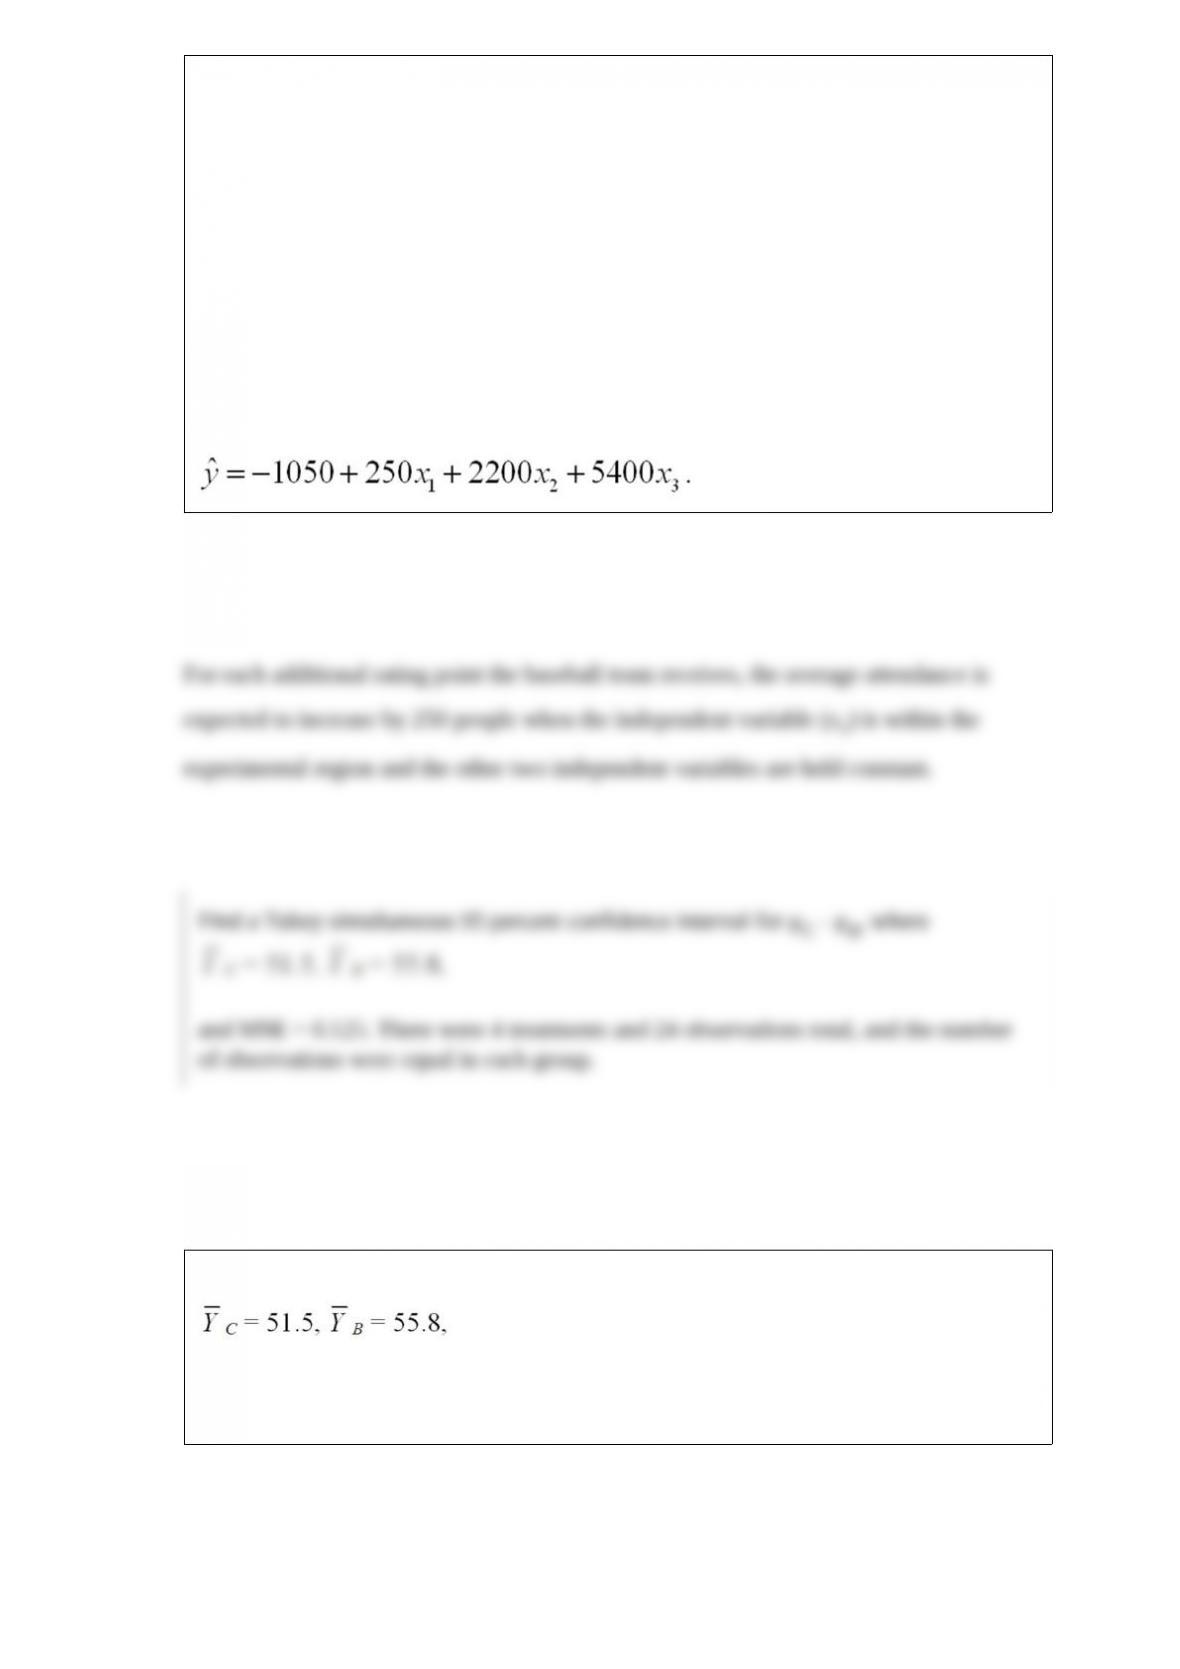
Consider the following partial computer output for a multiple regression model.
Calculate R2.
The management of a professional baseball team is in the process of determining the
budget for next year. A major component of future revenue is attendance at the home
games. In order to predict attendance at home games, the team statistician has used a
multiple regression model with dummy variables. The model is of the form y = β0 +
β1x1 + β2x2 + β3x3 + ε, where:
y = attendance at a home game.
x1 = current power rating of the team on a scale from 0 to 100 before the game.
x2 and x3 are dummy variables, and they are defined below.
x2 = 1, if weekend,
x2 = 0, otherwise.
x3 = 1, if weather is favorable,
x3 = 0, otherwise.
After collecting the data, based on 30 games from last year, and implementing the
above stated multiple regression model, the team statistician obtained the following
least squares multiple regression equation:
Find a Tukey simultaneous 95 percent confidence interval for μC – μB, where
and MSE = 6.125. There were 4 treatments and 24 observations total, and the number
of observations were equal in each group.
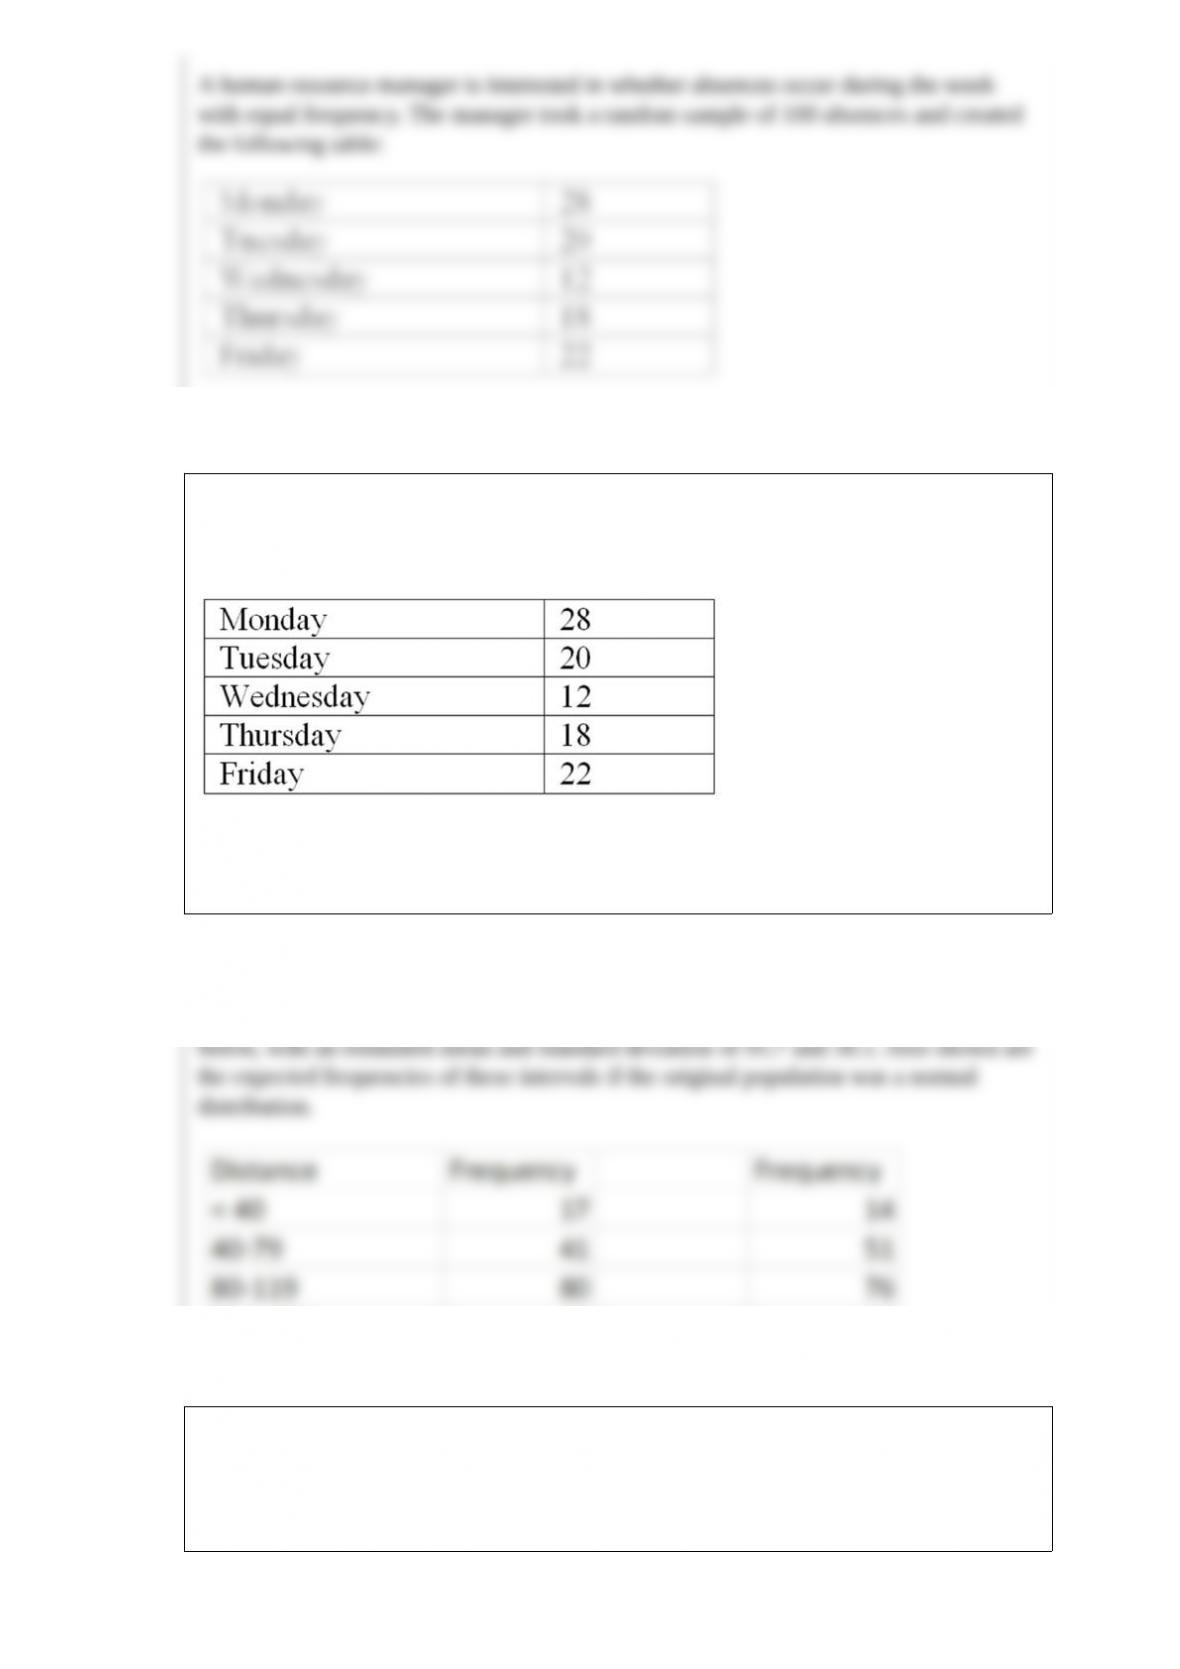
A human resource manager is interested in whether absences occur during the week
with equal frequency. The manager took a random sample of 100 absences and created
the following table:
At a significance level of .05, test H0: the probabilities are equal for all five days. What
is your conclusion?
The distance traveled by buses before their first major motor failure is distributed
below, with an estimated mean and standard deviation of 95.7 and 38.1. Also shown are
the expected frequencies of these intervals if the original population was a normal
distribution.
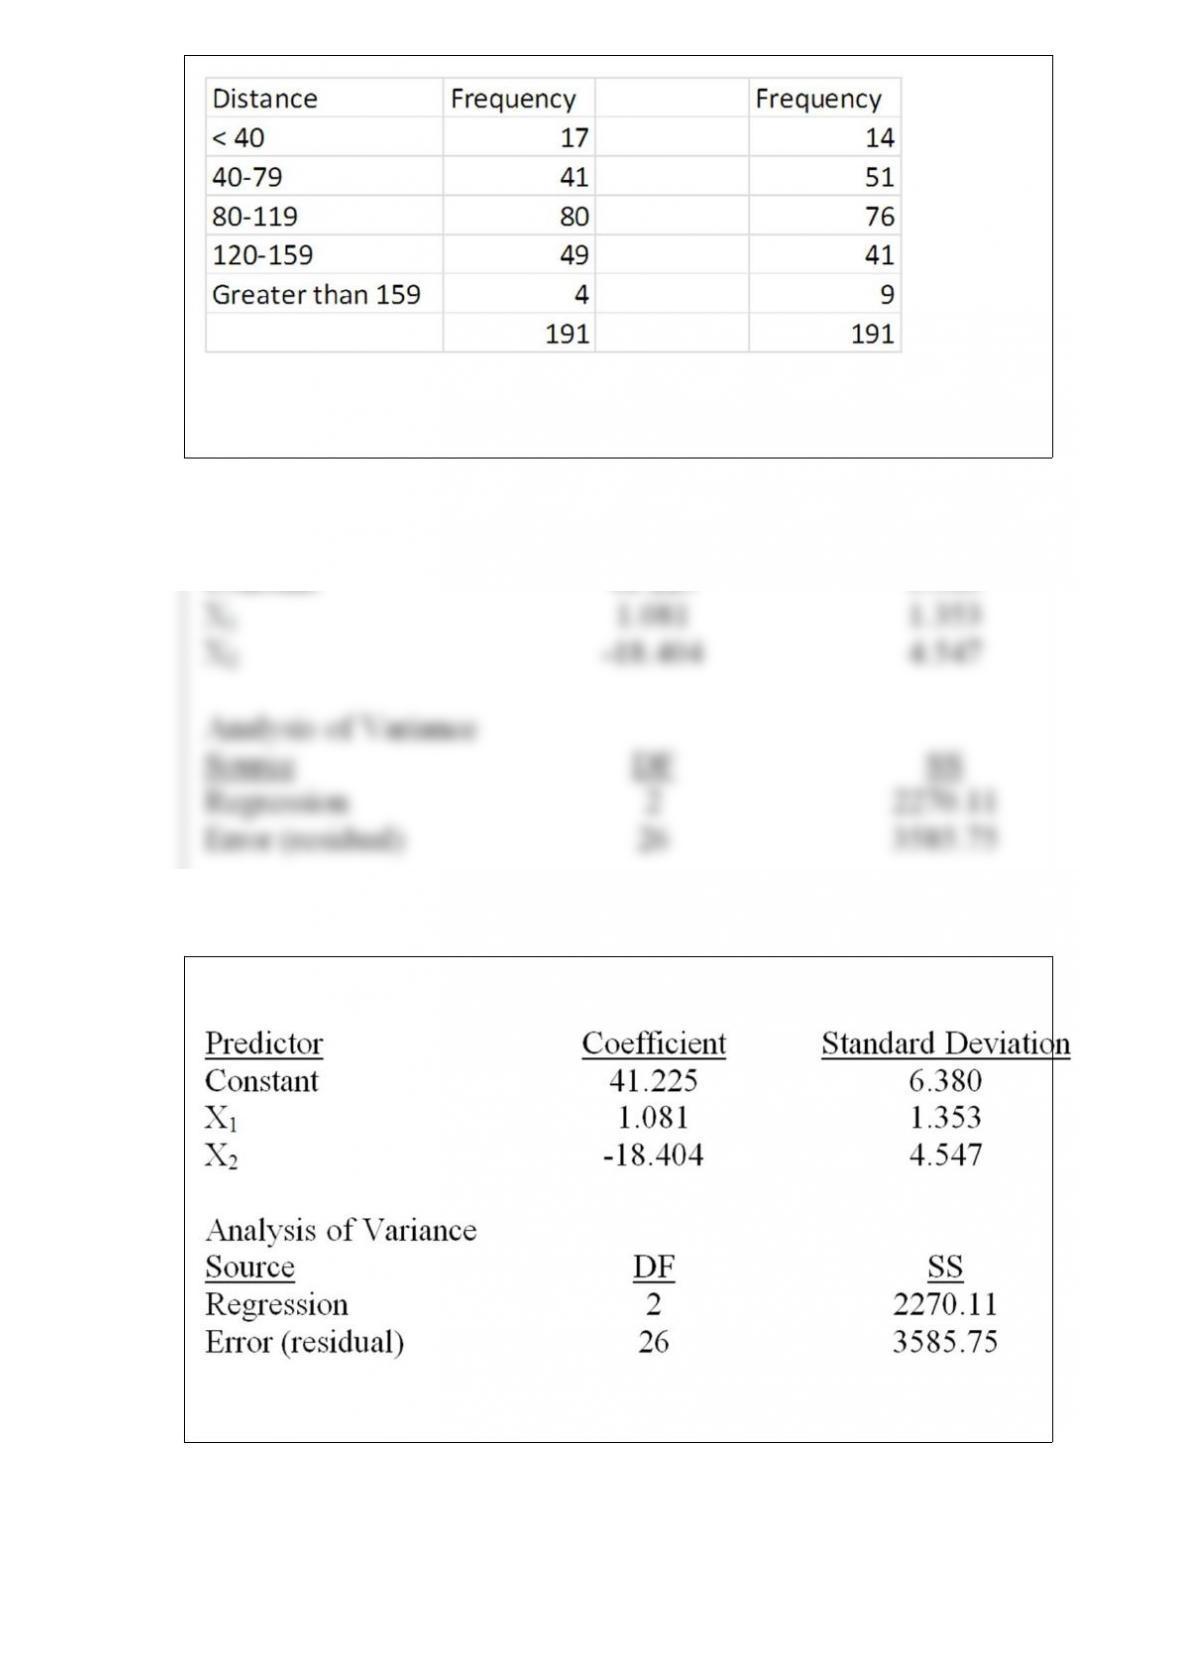
What is the chi-square test statistic for testing the hypothesis that the original
population is a normal distribution?
Consider the following partial computer output for a multiple regression model.
Determine the 95 percent interval for β2 and interpret its meaning.
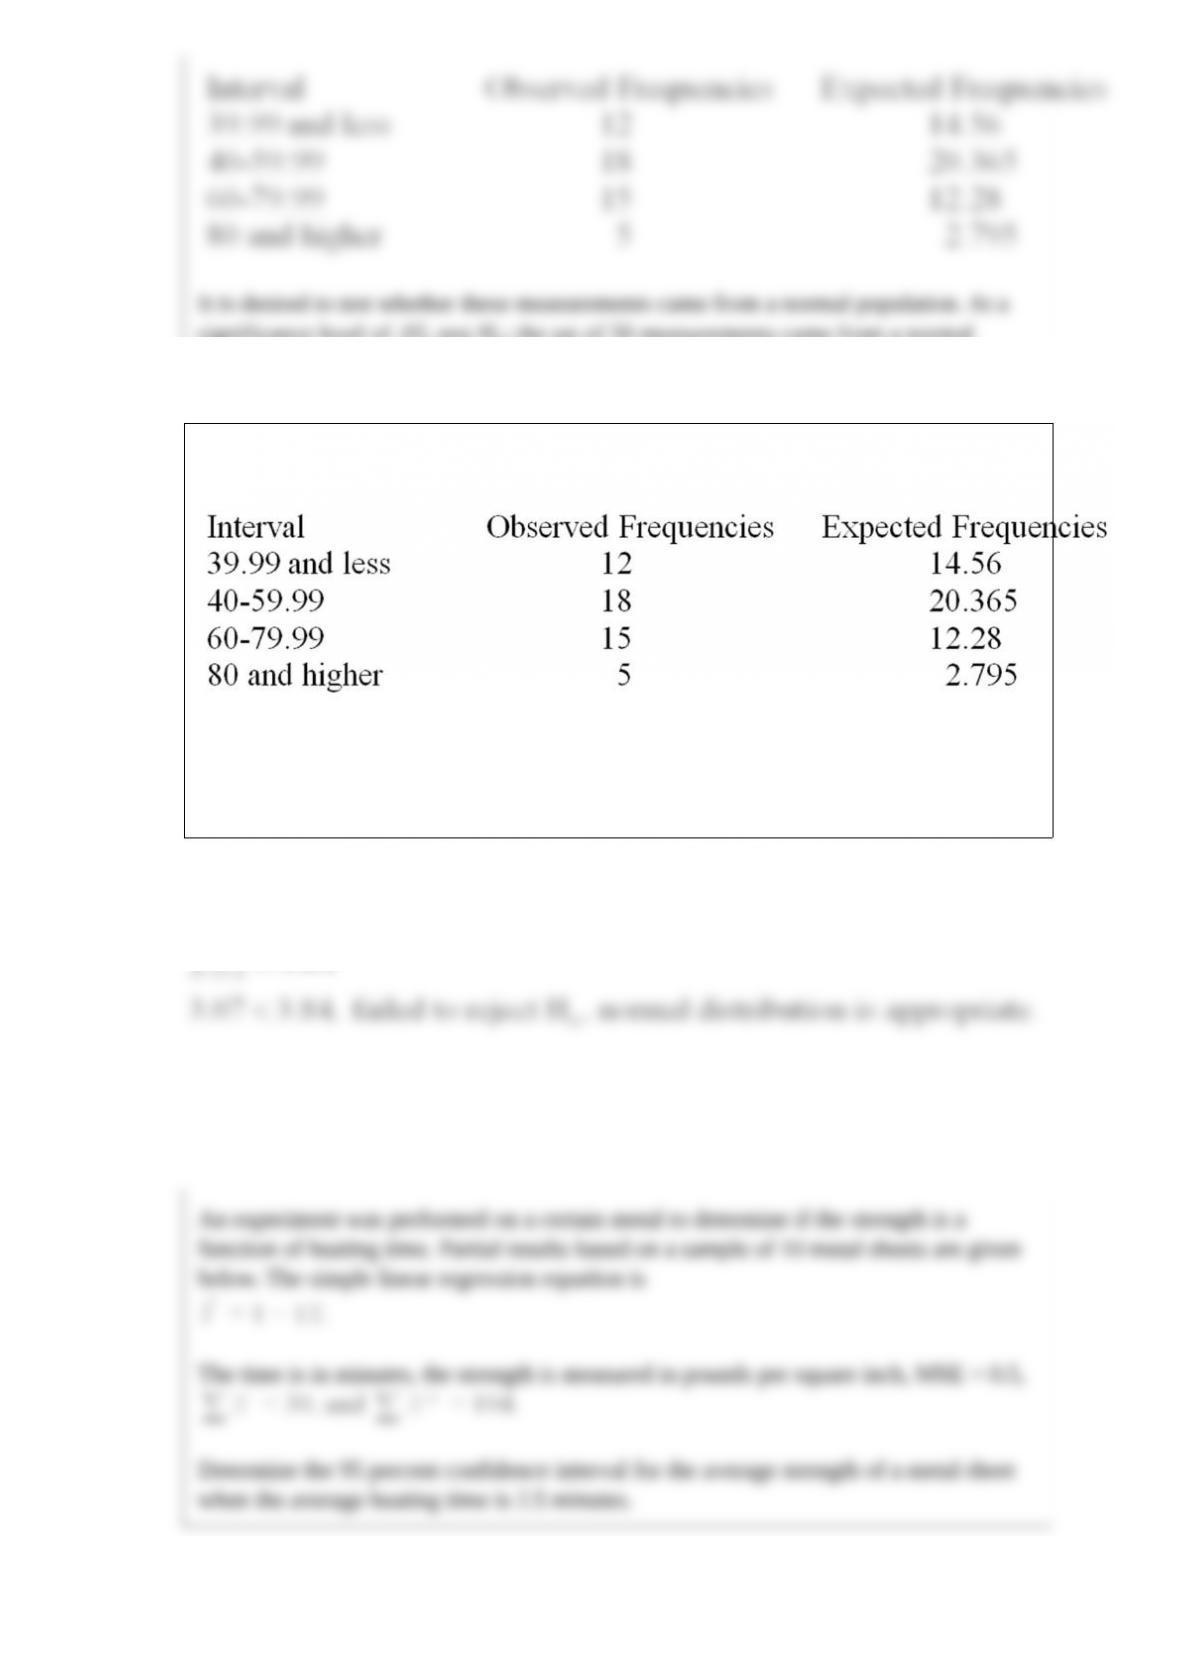
Consider a set of 50 measurements with mean 50.2 and standard deviation 18.7 and
with the following observed and expected frequencies.
It is desired to test whether these measurements came from a normal population. At a
significance level of .05, test H0: the set of 50 measurements came from a normal
population.
An experiment was performed on a certain metal to determine if the strength is a
function of heating time. Partial results based on a sample of 10 metal sheets are given
below. The simple linear regression equation is
The time is in minutes, the strength is measured in pounds per square inch, MSE = 0.5,
Determine the 95 percent confidence interval for the average strength of a metal sheet
when the average heating time is 2.5 minutes.
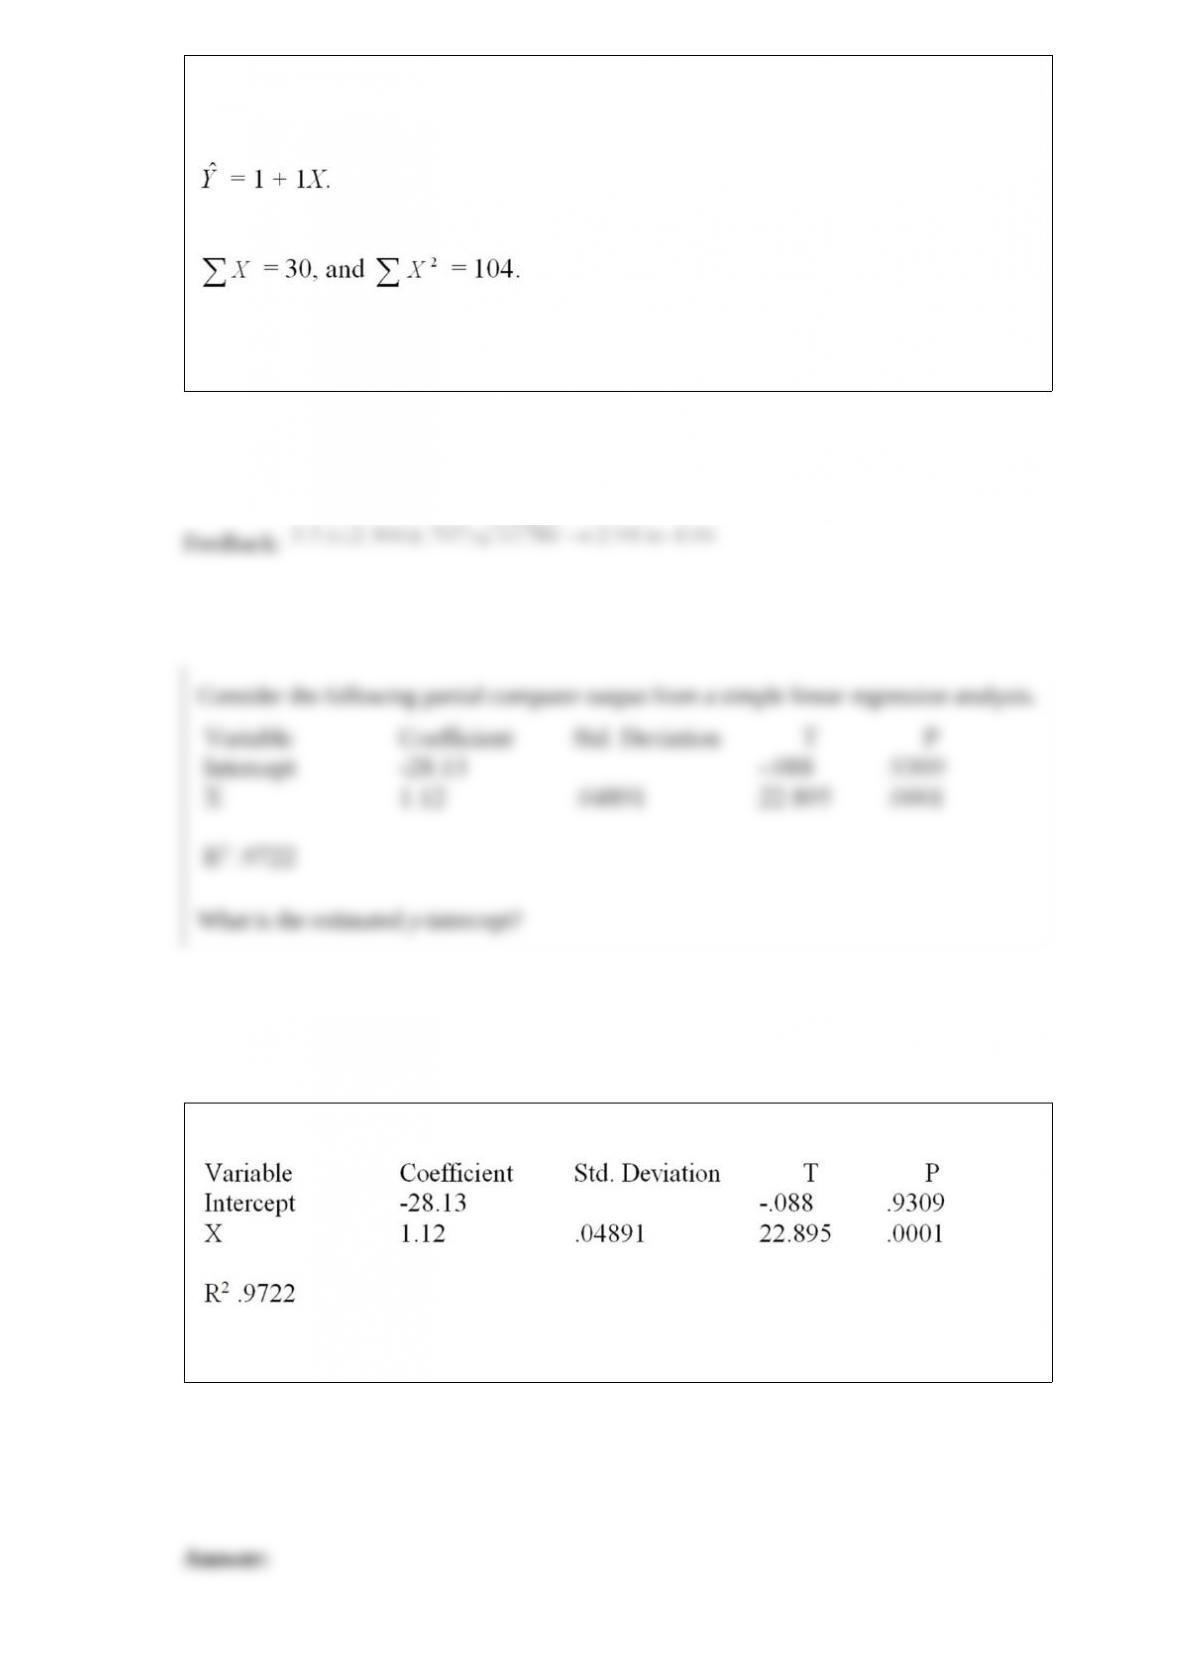
Consider the following partial computer output from a simple linear regression analysis.
What is the estimated y-intercept?
A multiple regression model with 3 independent variables and 16 observations
produced the following results: SSE = 15 and R2 = 2/3. Complete the analysis of
variance table and calculate the F statistic.
A member of the state legislature has expressed concern about the differences in the
mathematics test scores of high school freshmen across the state. She asks her research
assistant to conduct a study to investigate what factors could account for the
differences. The research assistant looks at a random sample of school districts across
the state and uses the factors of percentage of mathematics teachers in each district with
a degree in mathematics, the average age of mathematics teachers, and the average
salary of mathematics teachers.
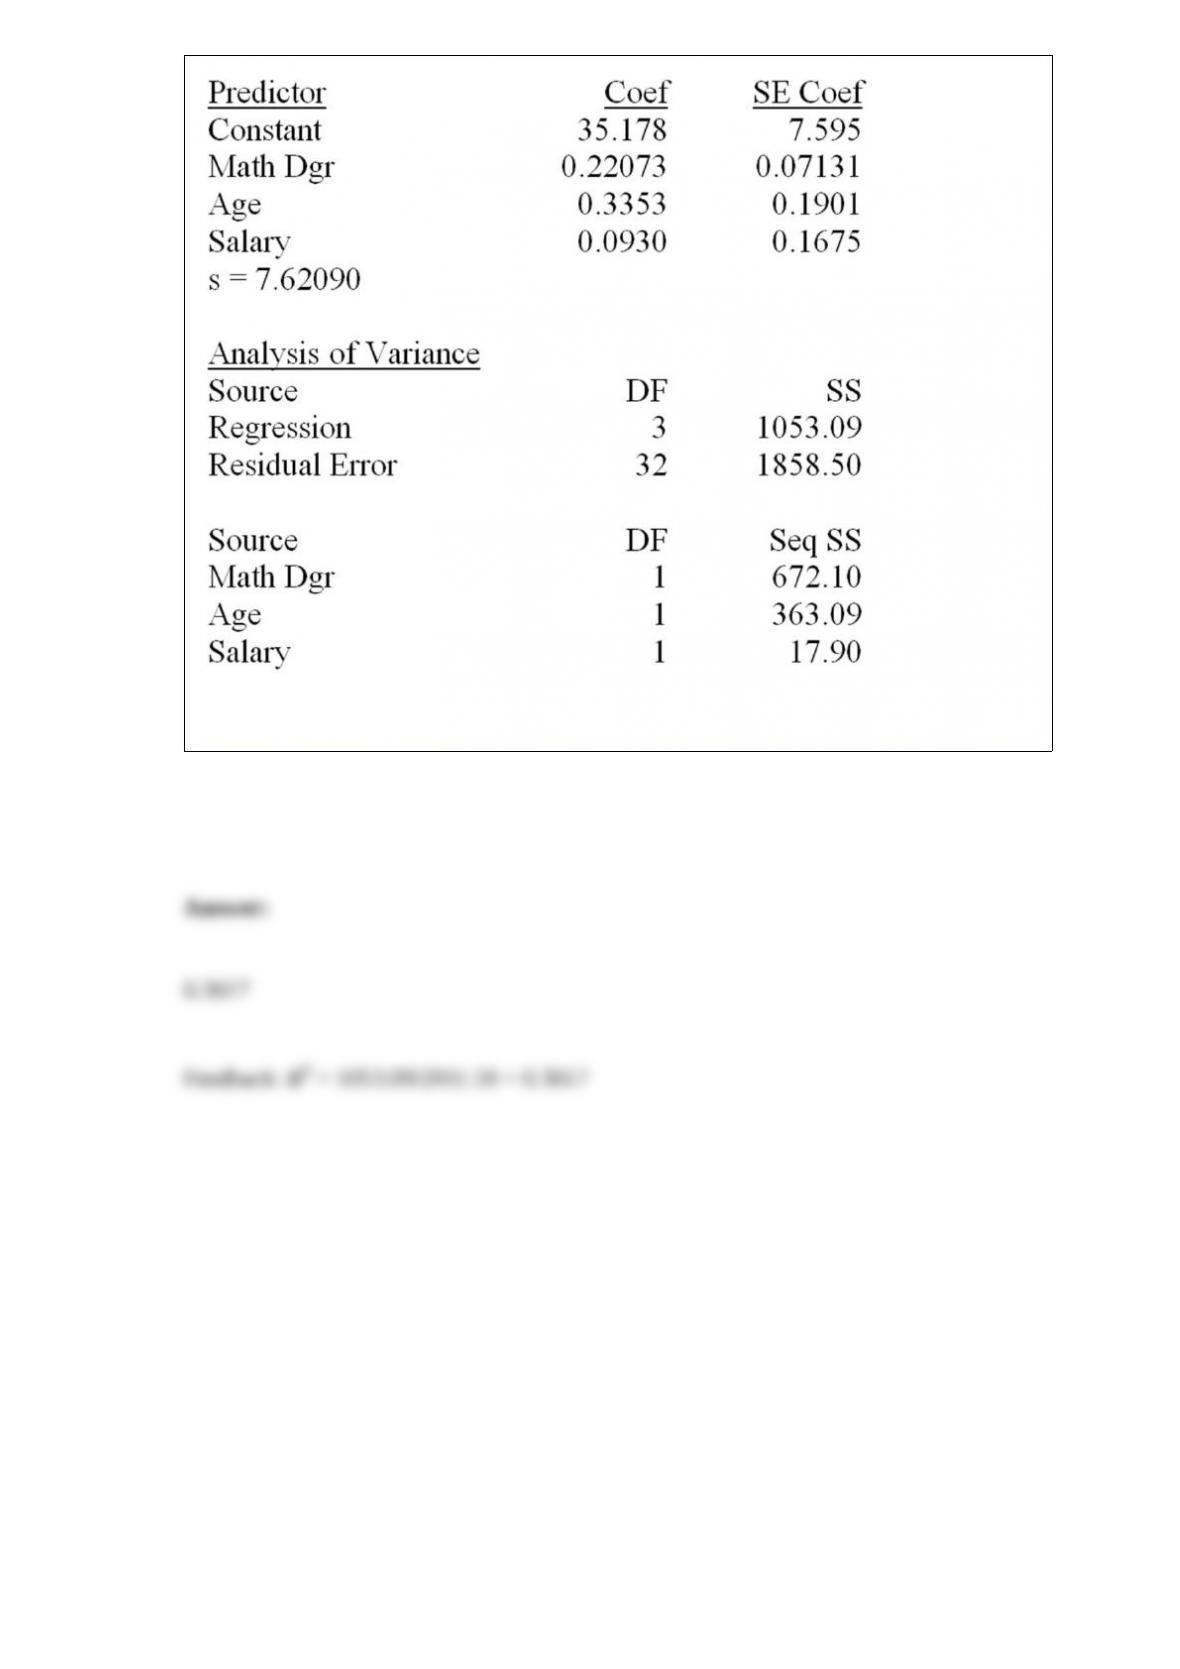
Calculate R2.