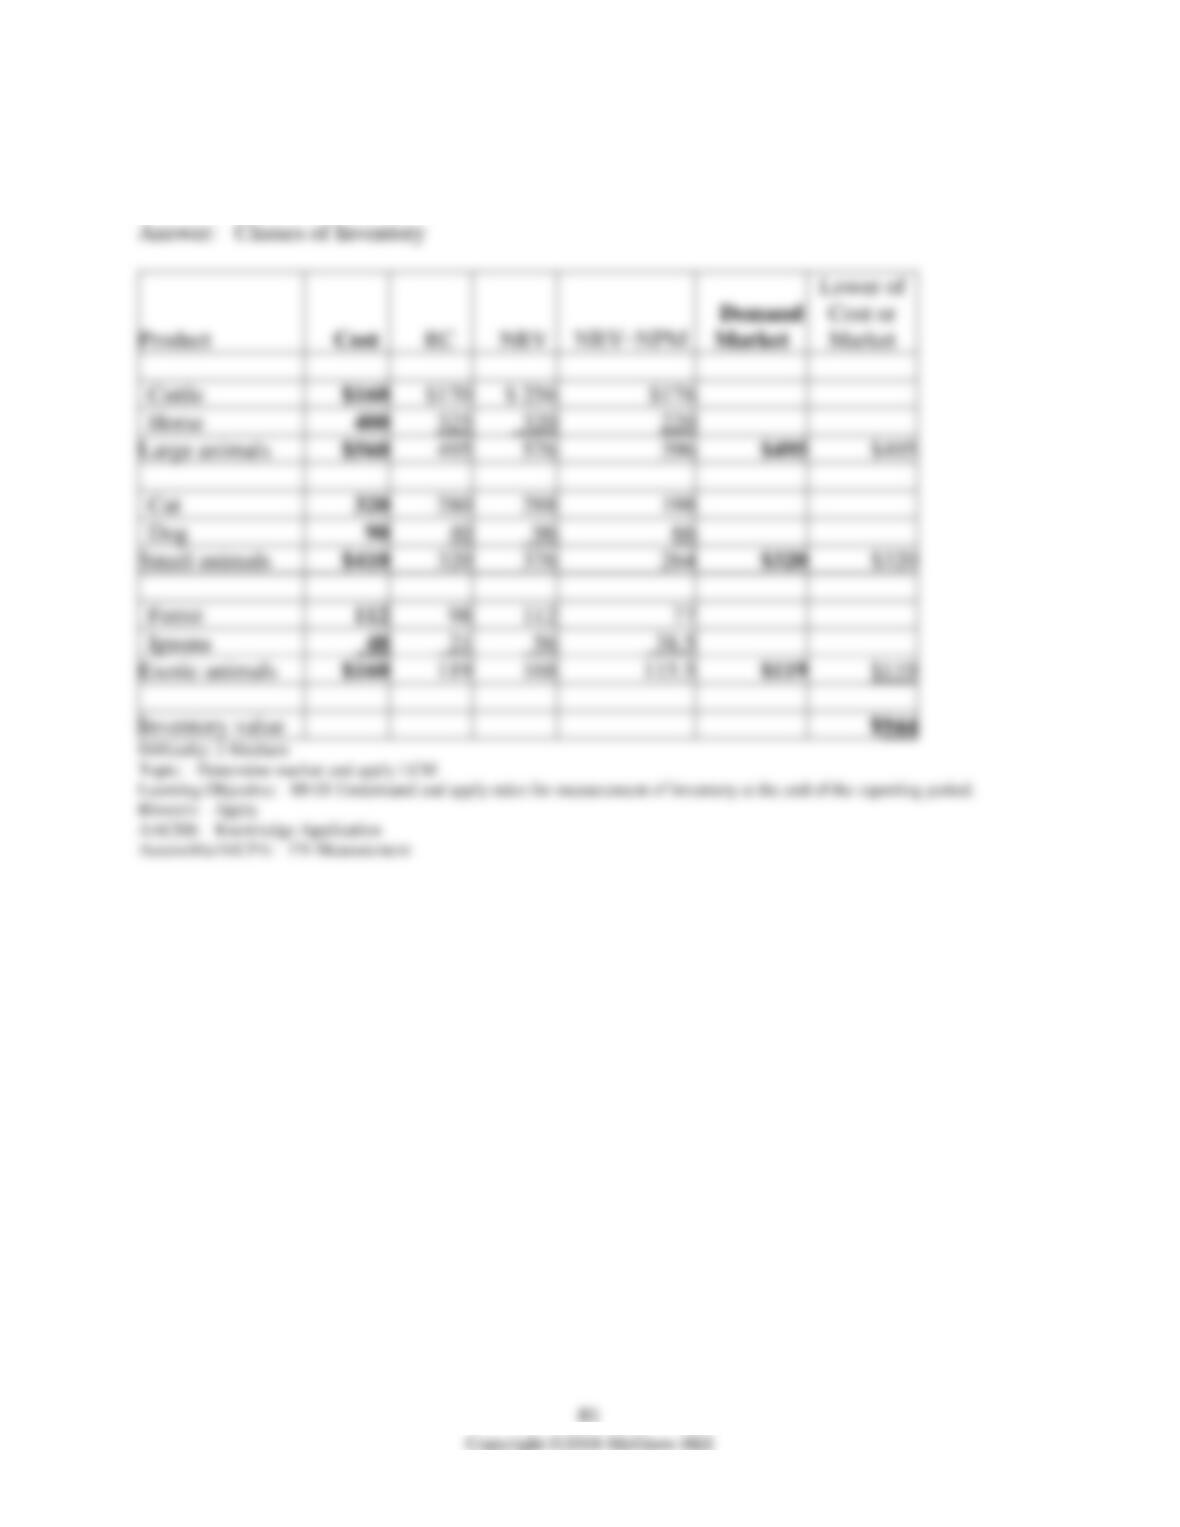
150) Required: Determine the reported inventory value assuming the lower of cost or market rule
is applied to categories of feed products.
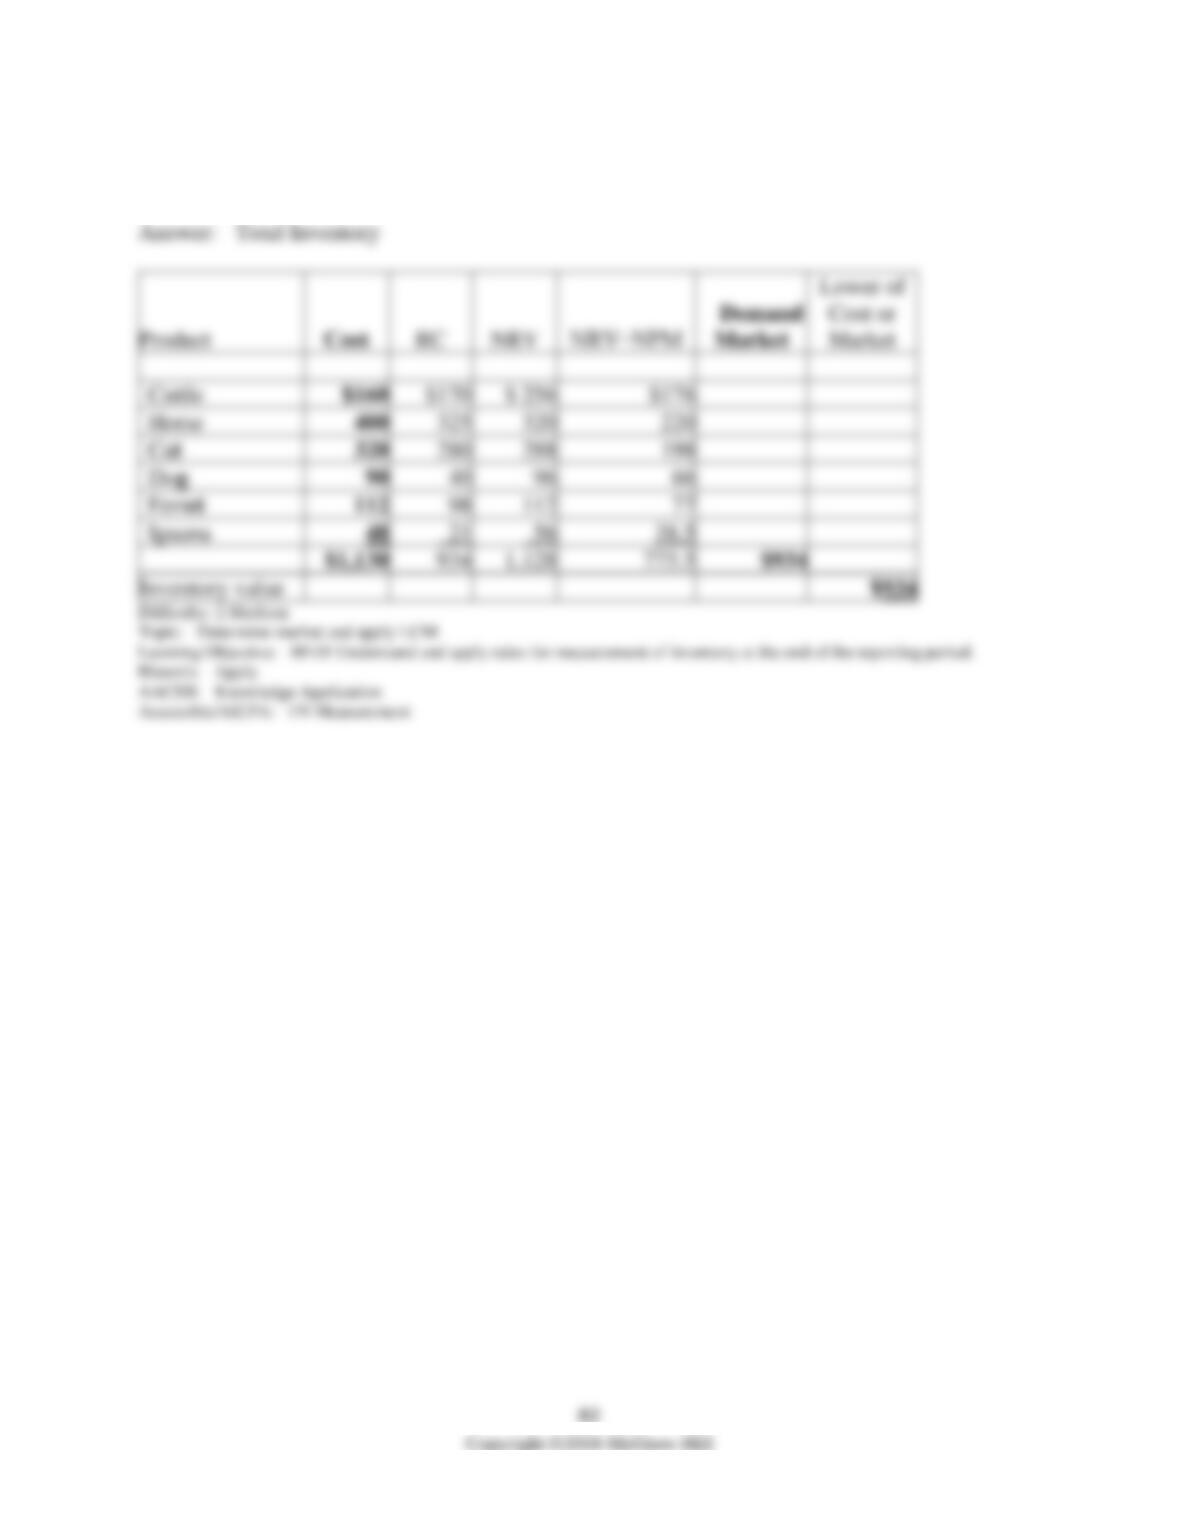
151) Required: Determine the reported inventory value assuming the lower of cost or market rule
is applied to the total inventory.

83
152) Henderson Company uses the gross profit method to estimate ending inventory and cost of
goods sold when preparing monthly financial statements required by its bank. Inventory on hand at
the end of July was $122,500. The following information for the month of August was available
from company records:
Purchases $219,000
Freight-in 5,200
Sales 350,000
Sales returns 9,000
Purchases returns 4,300
In addition, the controller is aware of $10,000 of inventory that was stolen during August from one
of the company’s warehouses.
Required:
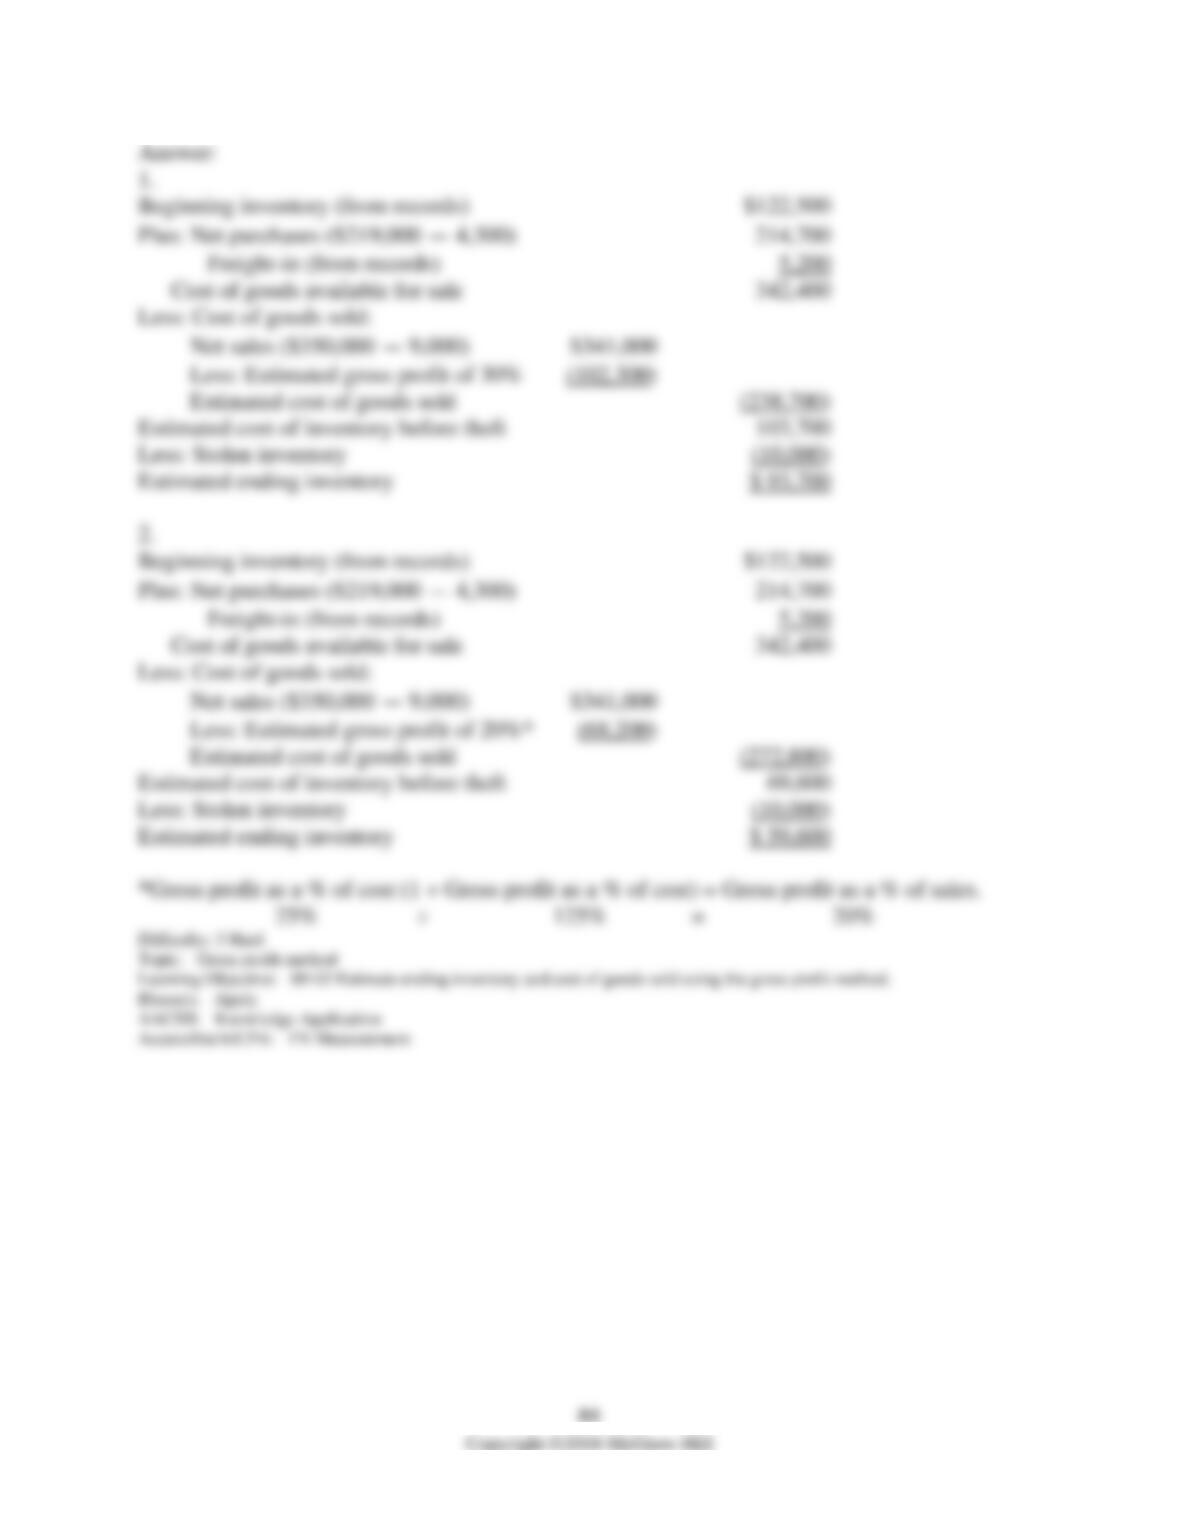
1. Calculate the estimated inventory at the end of August, assuming a gross profit ratio of 30%.
2. Calculate the estimated inventory at the end of August, assuming a markup on cost of 25%.
153) On March 17, 2018, a flood destroyed the entire inventory of Beatty Co. The following
information is available from its accounting records:
Inventory, January 1, 2018
$208,000
Purchases, Jan. 1 — Mar. 17
420,000
Sales, Jan. 1 — Mar. 17
600,000
Normal gross margin
40%
Required:
Compute the estimated cost of inventory lost in the flood.
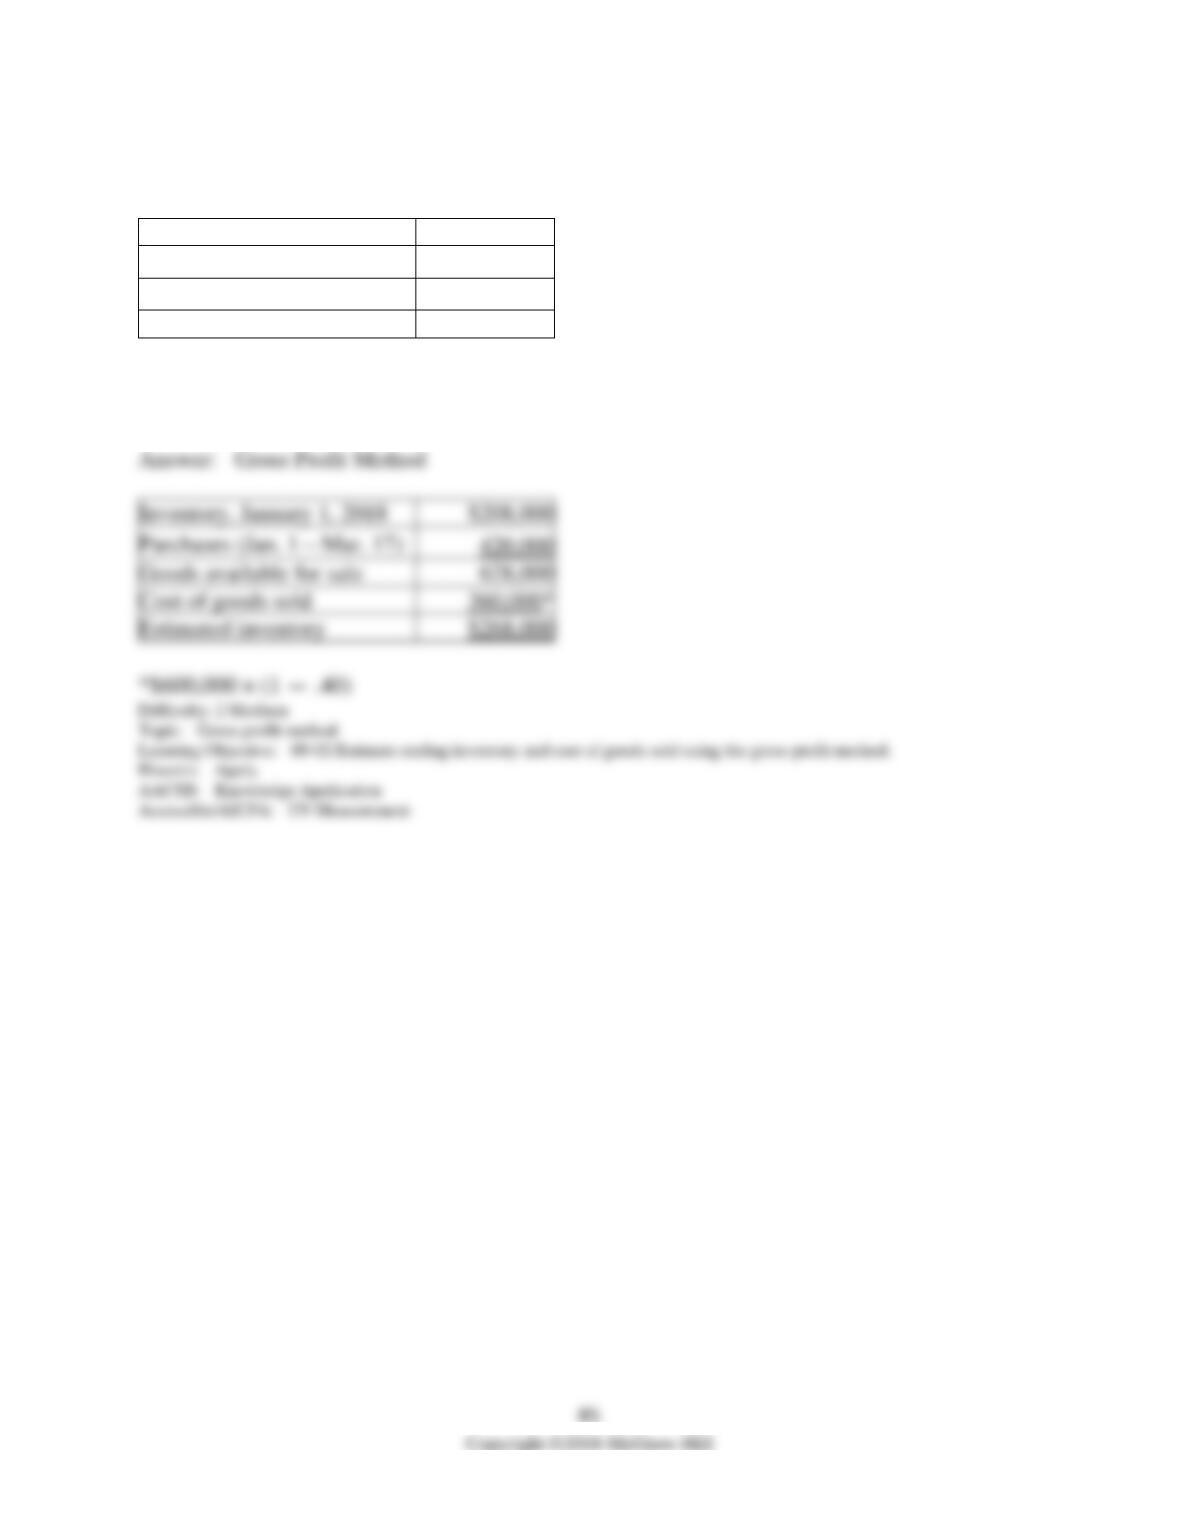
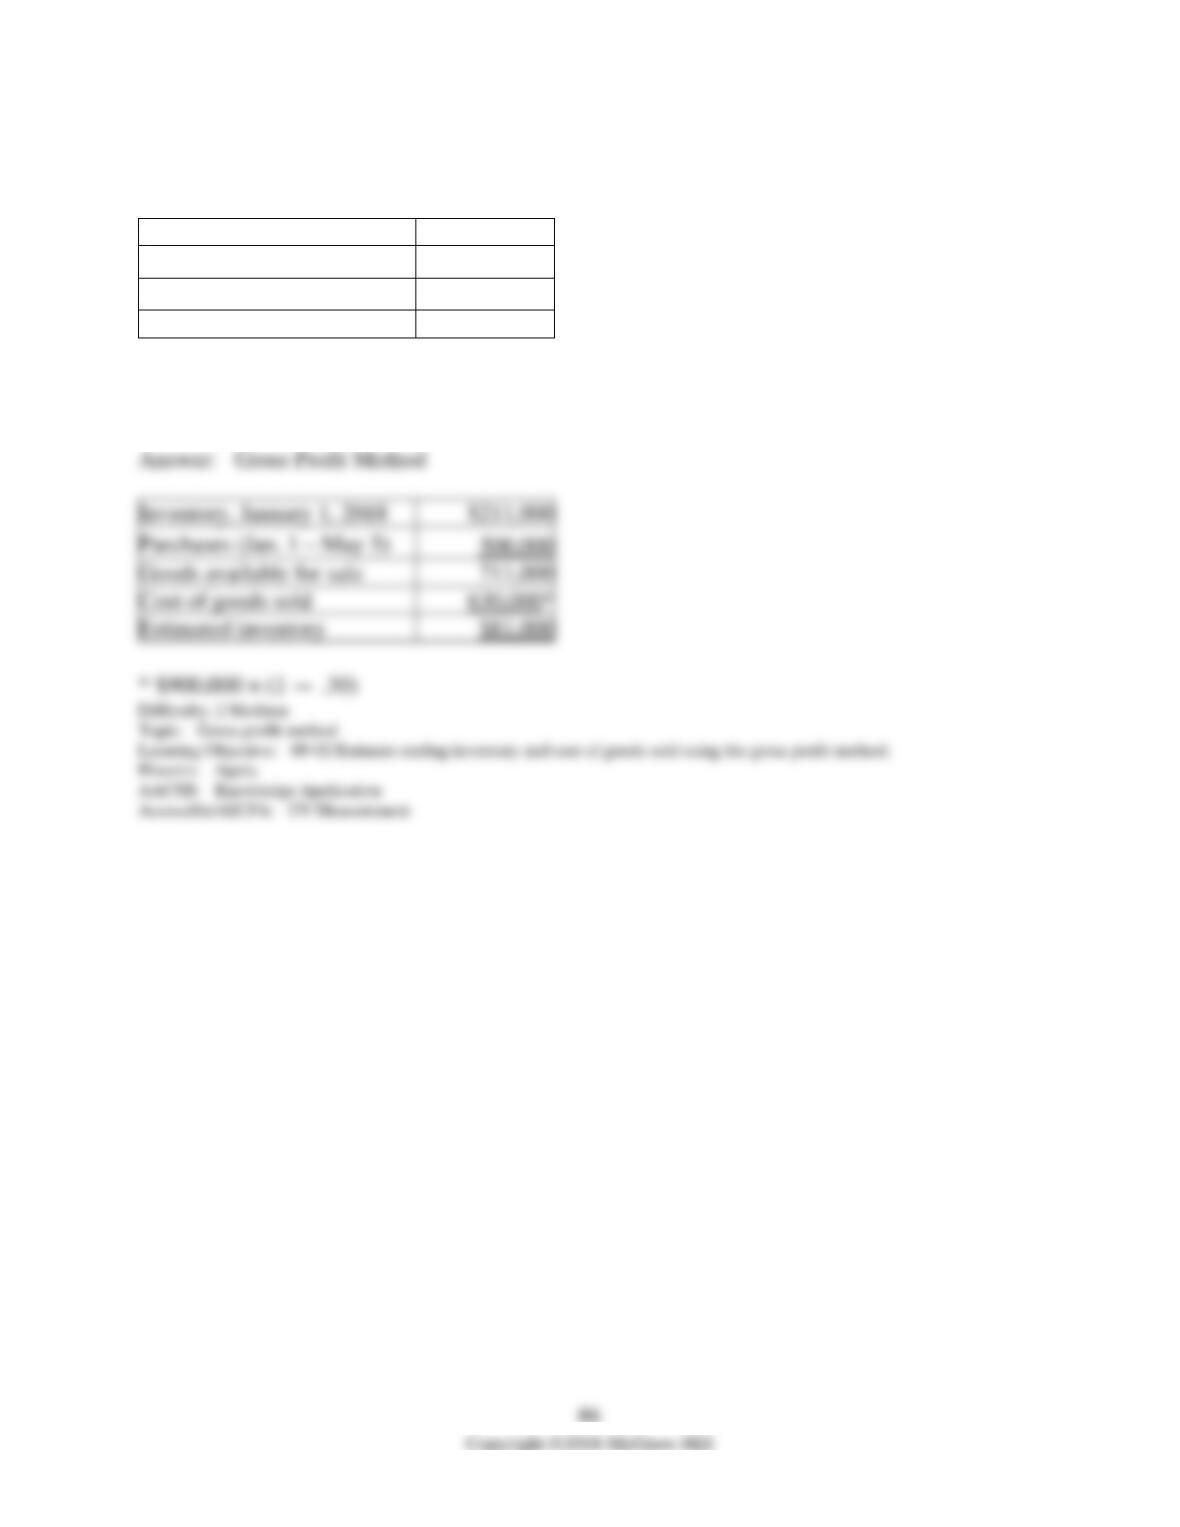
Inventory, January 1, 2018
$208,000
Purchases (Jan. 1—Mar. 17)
420,000
Goods available for sale
628,000
Cost of goods sold
360,000*
Estimated inventory
$268,000
154) On July 5, 2018, a fire destroyed the entire inventory of Kinard Music Mart. The following
information is available from its accounting records:
Inventory, January 1, 2018
$211,000
Purchases, Jan. 1 — July 5
500,000
Sales, Jan. 1 — July 5
900,000
Normal gross margin
30%
Required:
Compute the estimated cost of inventory lost in the fire.
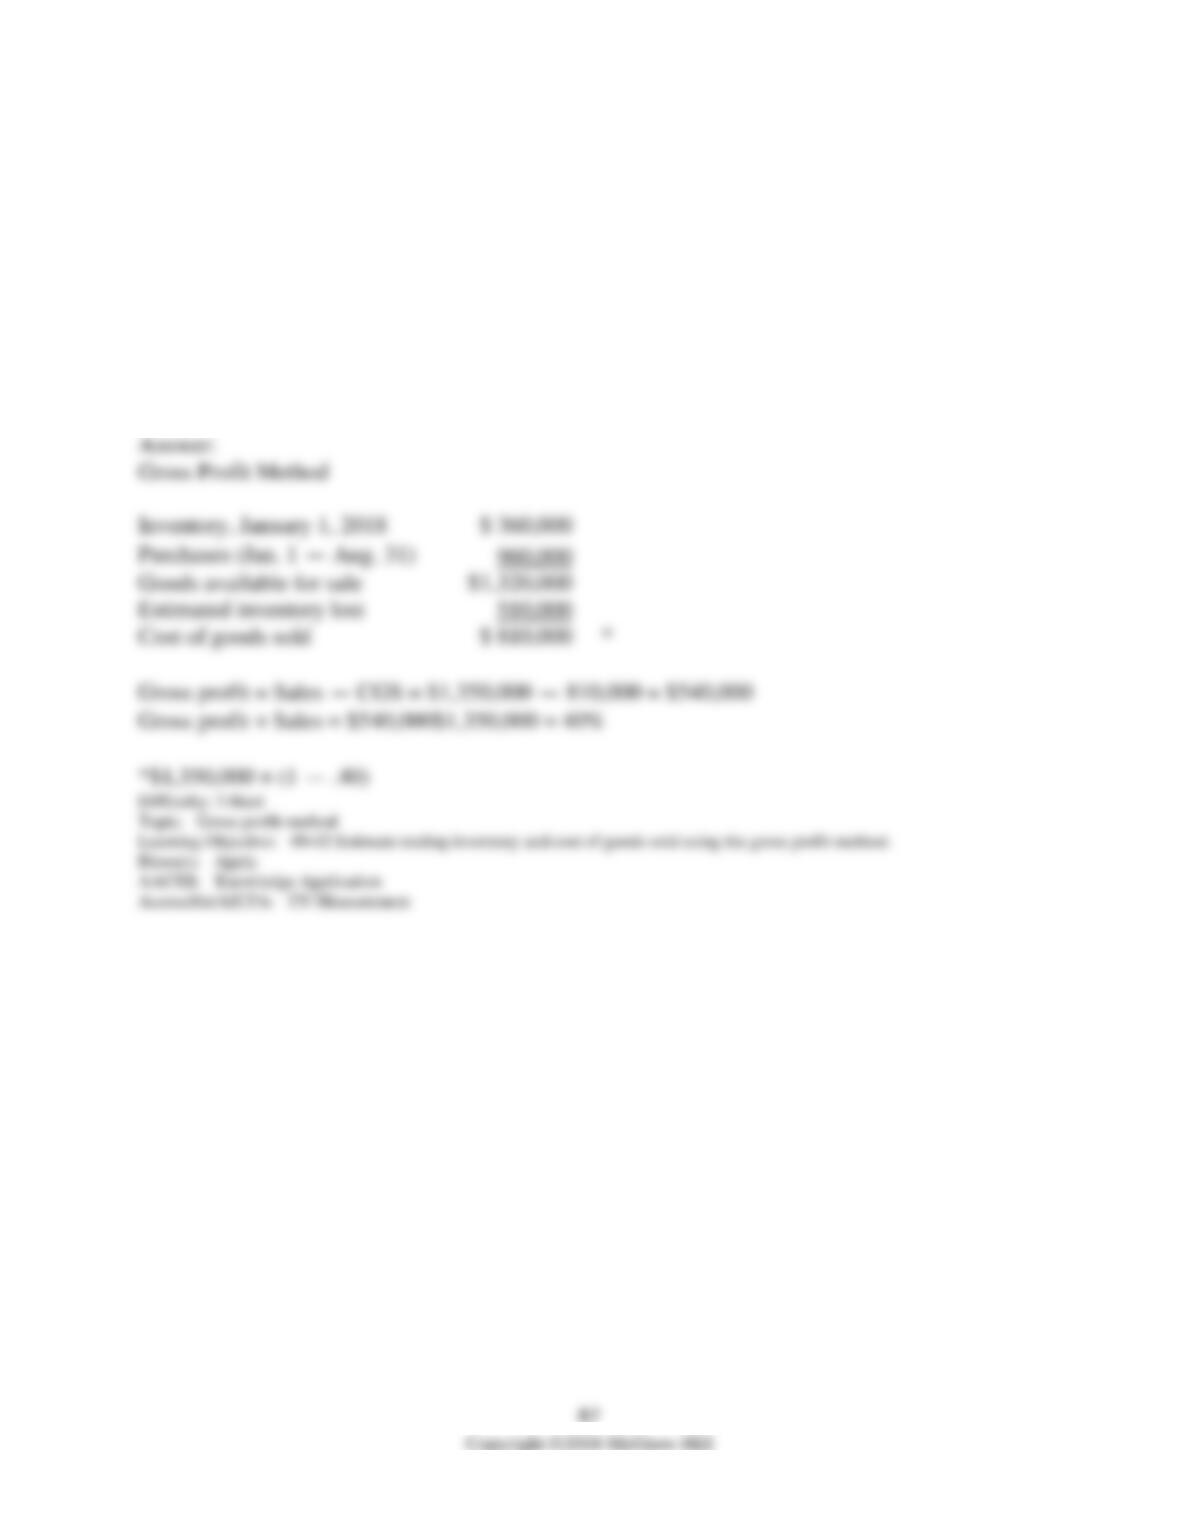
Inventory, January 1, 2018
$211,000
Purchases (Jan. 1—May 5)
500,000
Goods available for sale
711,000
Cost of goods sold
630,000*
Estimated inventory
$81,000
155) On August 31, 2018, Hurricane Chuck destroyed Bedford Craft Mart’s entire inventory. The
following information is available from its accounting records:
Inventory, January 1, 2018
$360,000
Purchases, Jan. 1 — Aug. 31
960,000
Sales, Jan. 1 — Aug. 31
1,350,000
Required:
Assuming that Bedford estimates the cost of destroyed inventory at $510,000, compute gross
profit margin % that Bedford uses in estimating inventory.
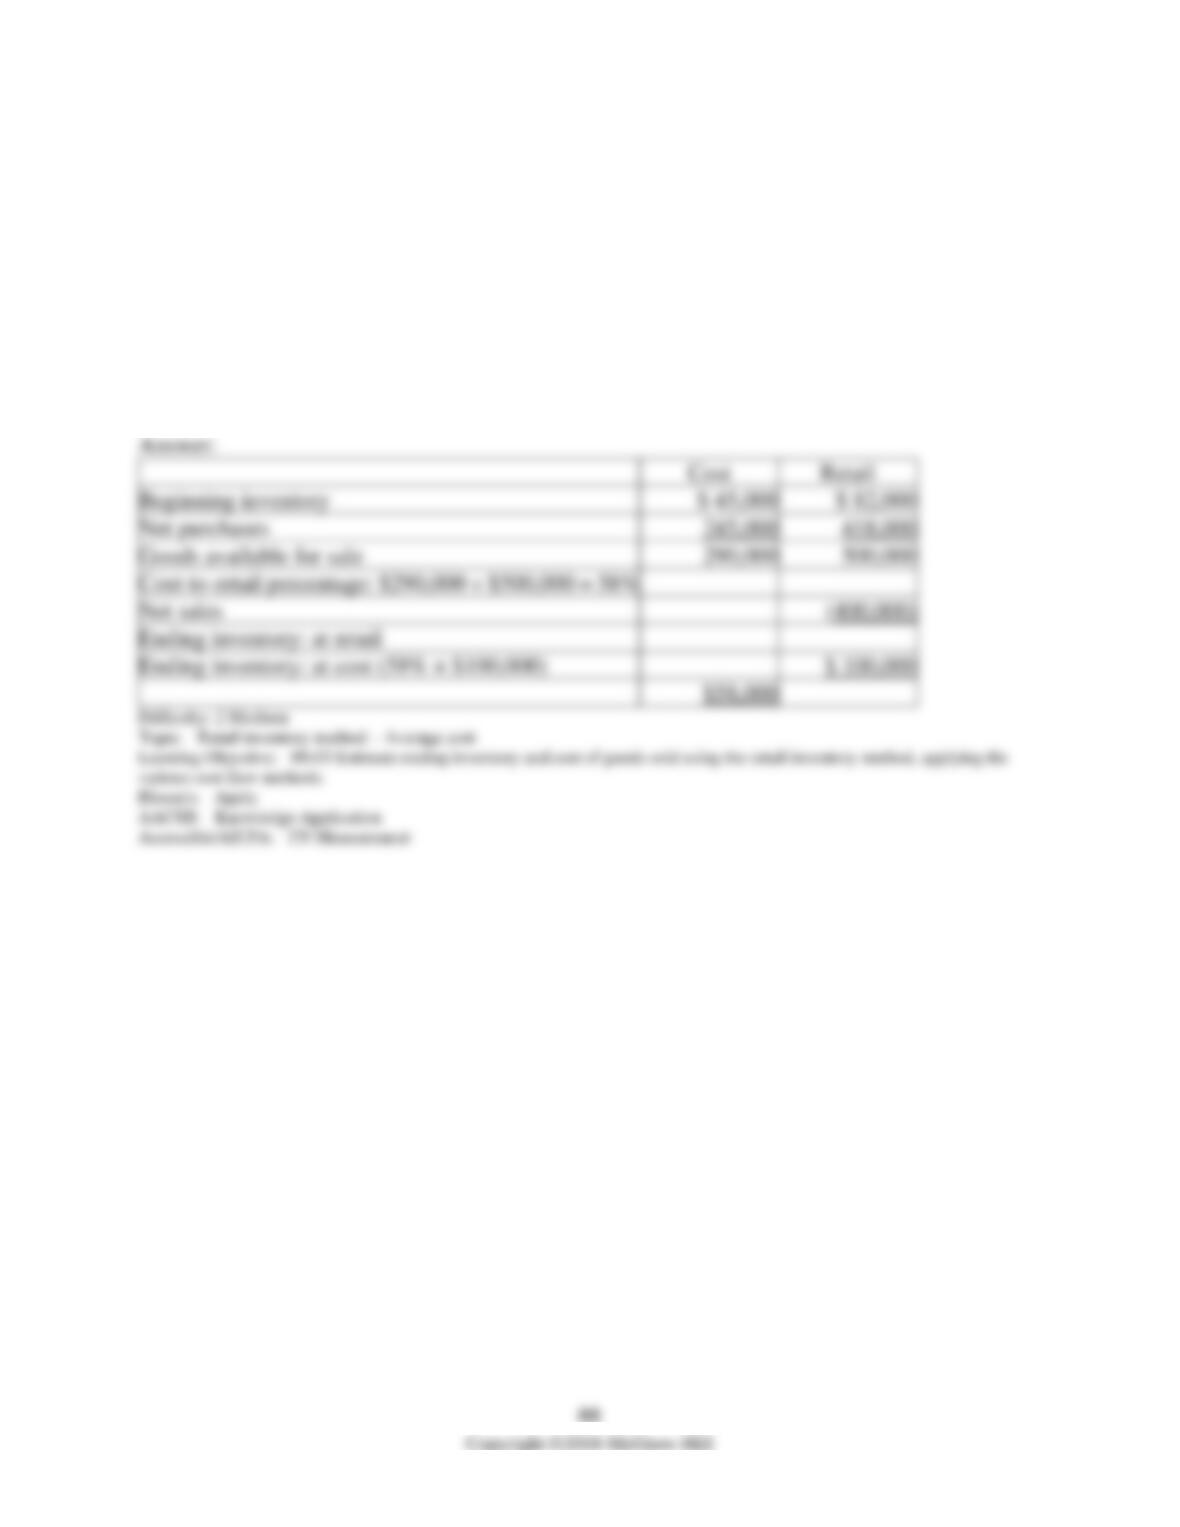
Inventory, January 1, 2018
Goods available for sale
Estimated inventory lost
Cost of goods sold
156) Andover Stores uses the average cost retail method to estimate its ending inventory.
Information as of June 30, 2018, is as follows:
Cost
Retail
Beginning inventory
$ 45,000
$ 82,000
Net purchases
245,000
418,000
Net sales
400,000
Required:
Use the retail method to estimate the June 30, 2018, inventory.
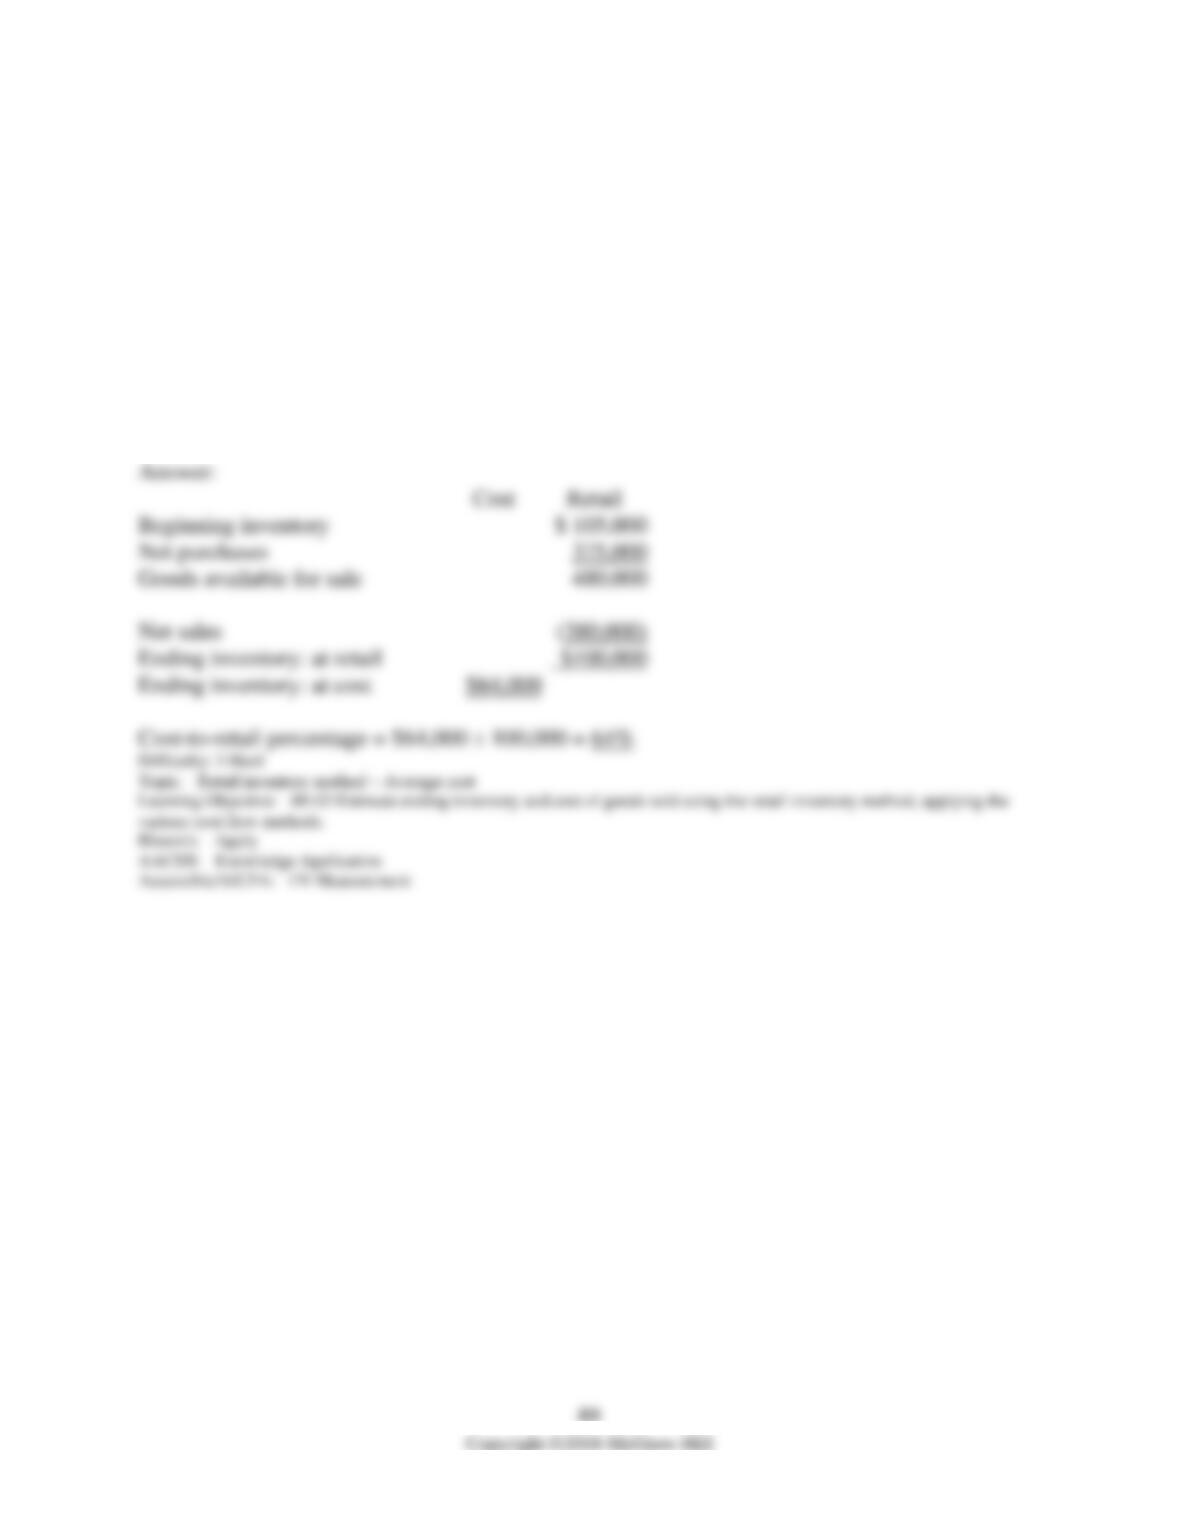
Beginning inventory
Net purchases
Goods available for sale
Net sales
Ending inventory: at retail
Ending inventory: at cost (58% × $100,000)
157) DK Super Stores Inc. uses the average cost retail method to estimate its ending inventory.
Information at June 30, 2018, is as follows:
Cost
Retail
Beginning inventory
$ 105,000
Net purchases
375,000
Net sales
380,000
Ending inventory
$64,000
Required:
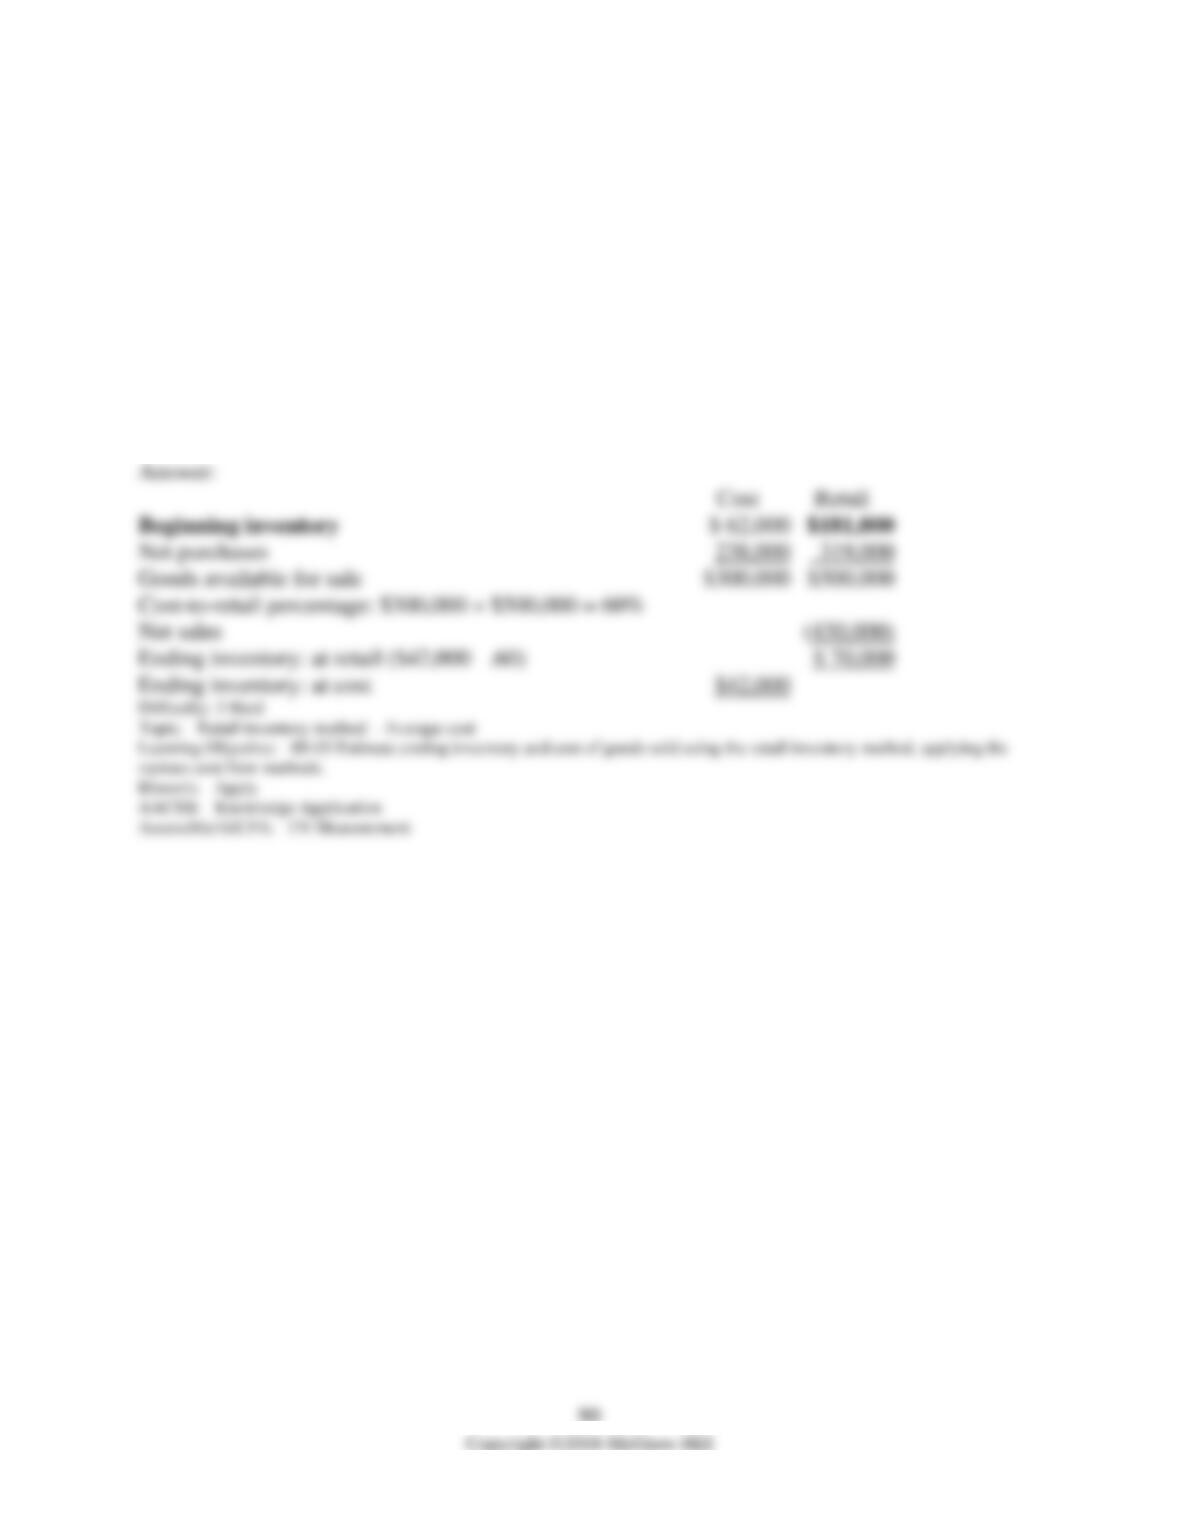
Compute the cost-to-retail percentage used by DK.
Beginning inventory
Net purchases
Goods available for sale
Net sales
Ending inventory: at retail
Ending inventory: at cost
$64,000
158) Trask Inc. uses the average cost retail method to estimate its ending inventory. Partial
information at June 30, 2018, is as follows:
Cost
Retail
Beginning inventory
$ 62,000
???
Net purchases
238,000
319,000
Net sales
430,000
Ending inventory
42,000
Required:
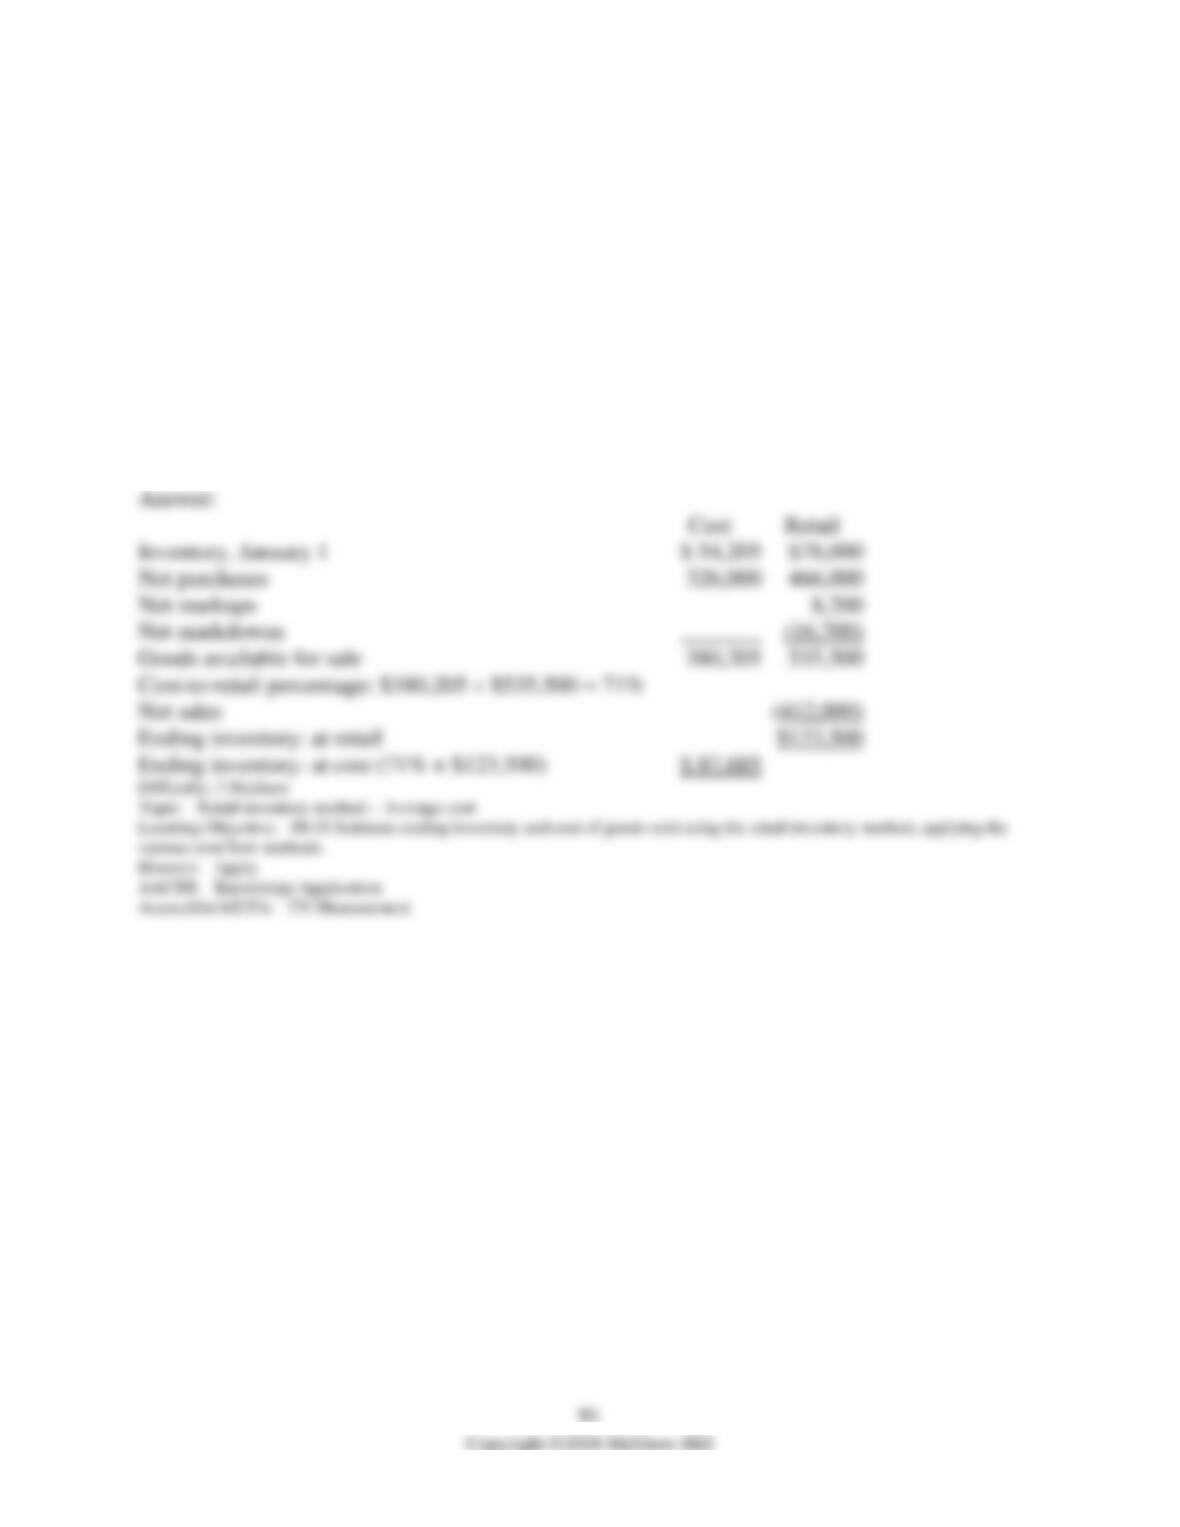
Assuming Trask’s cost-to-retail = 60%, compute Trask’s beginning inventory at retail.
Cost
Retail
$ 62,000
Net purchases
238,000
Goods available for sale
Net sales
Ending inventory: at retail ($42,000 .60)
$ 70,000
Ending inventory: at cost
$42,000
159) Manila Bread Company uses the average cost retail method to estimate its ending inventories.
The following data has been summarized for the year 2018:
Cost
Retail
Inventory, January 1
$ 54,205
$ 78,000
Purchases
326,000
466,000
Net markups
8,200
Net markdowns
16,700
Net sales
412,000
Required:
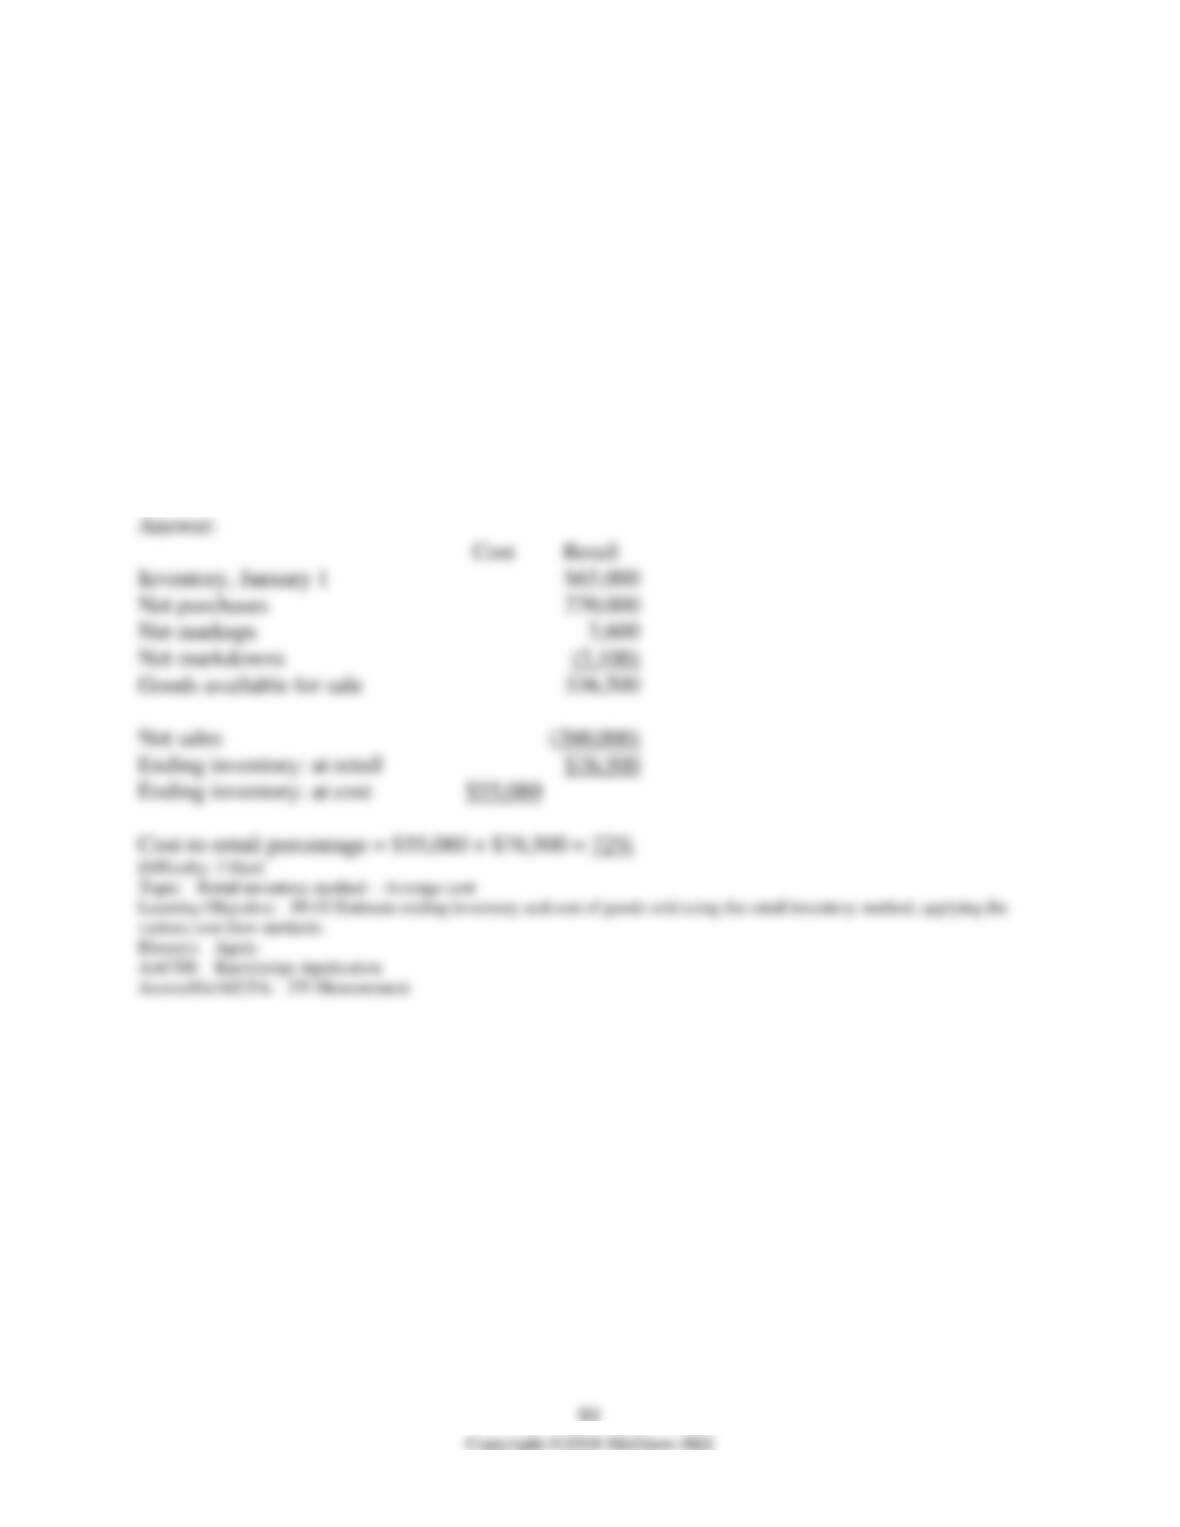
Estimate the ending inventory as of December 31, 2018.
Cost
Retail
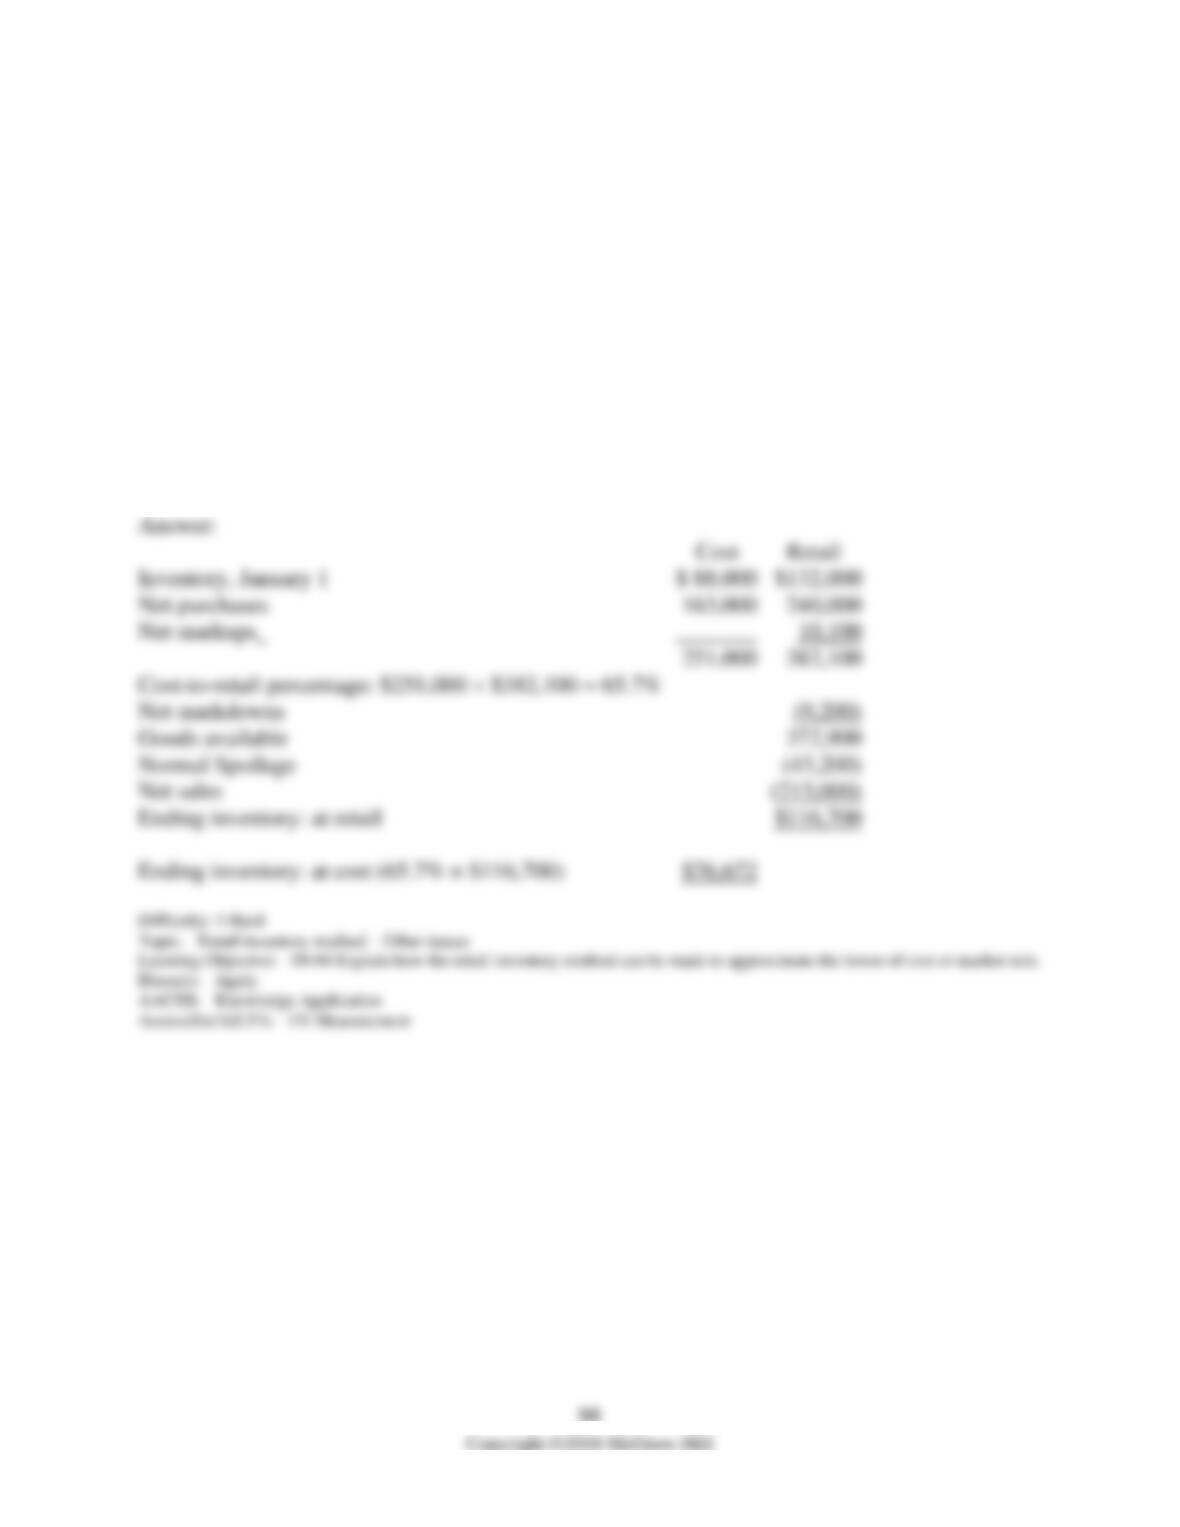
Inventory, January 1
Net purchases
Net markups
Net markdowns
Goods available for sale
Net sales
Ending inventory: at retail
Ending inventory: at cost (71% × $123,500)
160) Penfold’s Paints uses the average cost retail method to estimate its ending inventories. The
following data has been summarized for the year 2018:
Cost
Retail
Inventory, January 1
$ 65,000
Purchases
270,000
Net markups
3,600
Net markdowns
2,100
Net sales
260,000
Inventory, December 31
$55,080
Required:
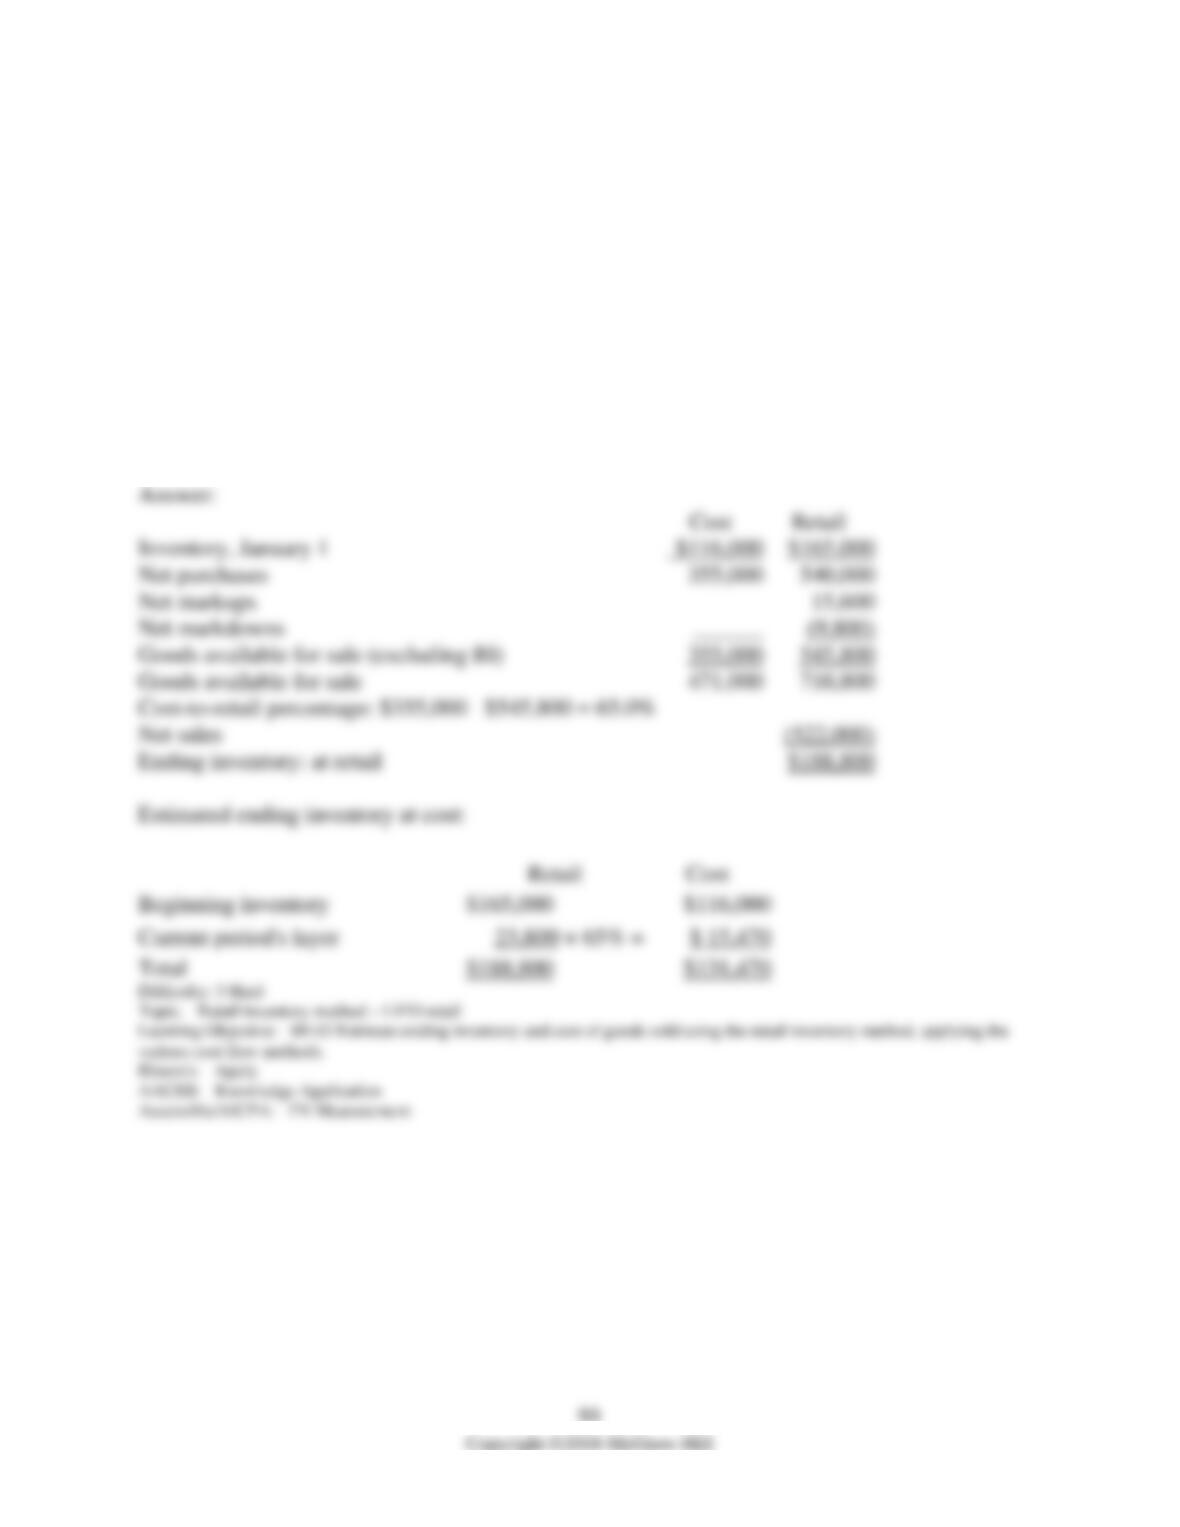
Compute the cost-to-retail percentage used by Penfold’s Paints.
Cost
Inventory, January 1
$65,000
Net purchases
270,000
Net markups
Net markdowns
Goods available for sale
336,500
Net sales
Ending inventory: at retail
$76,500
Ending inventory: at cost
$55,080
161) Murdock Industries uses a periodic inventory system and the LIFO retail method to estimate
its ending inventories. The following data has been summarized for December 31, 2018:
Cost
Retail
Inventory, January 1
$116,000
$165,000
Purchases
355,000
540,000
Net markups
15,600
Net markdowns
9,800
Net sales
522,000
Required:
Estimate the LIFO cost of ending inventory. Assume stable retail prices during the period.
Retail
Inventory, January 1
Net purchases
355,000
540,000
Net markups
15,600
Net markdowns
______
Goods available for sale (excluding BI)
355,000
545,800
Goods available for sale
471,000
710,800
Net sales
Ending inventory: at retail
Beginning inventory
$165,000
Current period’s layer
23,800 × 65% =
$ 15,470
Total
$188,800
162) Littleton Company uses a periodic inventory system and the LIFO retail method to estimate
its ending inventories. The following partial data has been summarized for December 31, 2018:
Cost
Retail
Inventory, January 1
$216,000
$285,000
Purchases
650,000
Net markups
18,300
Net markdowns
21,200
Net sales
625,000
Inventory, Dec. 31
$232,730
Required:
Determine the cost-to-retail percentage used by Littleton. Assume stable retail prices during the
period.
Cost
Inventory, January 1
Net purchases
650,000
Net markups
Net markdowns
Goods available for sale (Excluding BI)
647,100
Goods available for sale
932,100
Net sales
Ending inventory: at retail
307,100
Total
Beginning inventory
Current period’s layer (at cost)
$16,730
163) Billingsly Products uses the conventional retail method to estimate its ending inventories.
The following data has been summarized for the year 2018:
Cost
Retail
Inventory, January 1
$ 53,000
$ 78,000
Purchases
322,360
466,000
Net markups
8,000
Net markdowns
16,700
Net sales
392,000
Required:
Estimate the ending inventory as of December 31, 2018.
Cost
Retail
Inventory, January 1
$53,000
$78,000
Net purchases
322,360
466,000
Net markups
375,360
552,000
Net markdowns
(16,700)
Sales
Ending inventory: at retail
Ending inventory: at cost (68% × $143,300)
$97,444
164) New York Sales Inc. uses the conventional retail method to estimate its ending inventories.
The following data has been summarized for December 31, 2018:
Cost
Retail
Inventory, January 1
$160,000
Purchases
538,000
Net markups
12,000
Net markdowns
9,100
Net sales
582,000
Inventory, Dec. 31
$77,285
Required:
Compute the cost-to-retail percentage used by New York Sales Inc.
Retail
Inventory, January 1
$160,000
Net purchases
538,000
Net markups
12,000
Net markdowns
Net sales
Ending inventory: at retail
Ending inventory: at cost
165) Harley Inc. uses the conventional retail method to estimate its ending inventories. The
following data has been summarized for December 31, 2018:
Cost
Retail
Inventory, January 1
$208,000
$ 280,000
Purchases
470,000
610,000
Net markups
15,300
Net markdowns
11,200
Normal spoilage
4,600
Net sales
489,500
Required:
Estimate the cost of ending inventory applying the conventional retail method.
Retail
Inventory, January 1
Net purchases
470,000
610,000
Net markups
678,000
905,300
Net markdowns
Goods available
894,100
Normal Spoilage
Net sales
Ending inventory: at retail
Ending inventory: at cost (74.9% × $400,000)
166) Zanesville Pots Co. uses the conventional retail method to estimate ending inventories. The
following data has been summarized for the year ended December 31, 2018:
Cost
Retail
Inventory, January 1
$ 88,000
$ 132,000
Purchases
163,000
240,000
Net markups
10,100
Net markdowns
9,200
Normal spoilage
43,200
Net sales
213,000
Required:
Estimate the cost of ending inventory applying the conventional retail method.
Inventory, January 1
Net purchases
240,000
Net markups
382,100
Net markdowns
(9,200)
Goods available
372,900
Normal Spoilage
Net sales
Ending inventory: at retail
Ending inventory: at cost (65.7% × $116,700)