79.
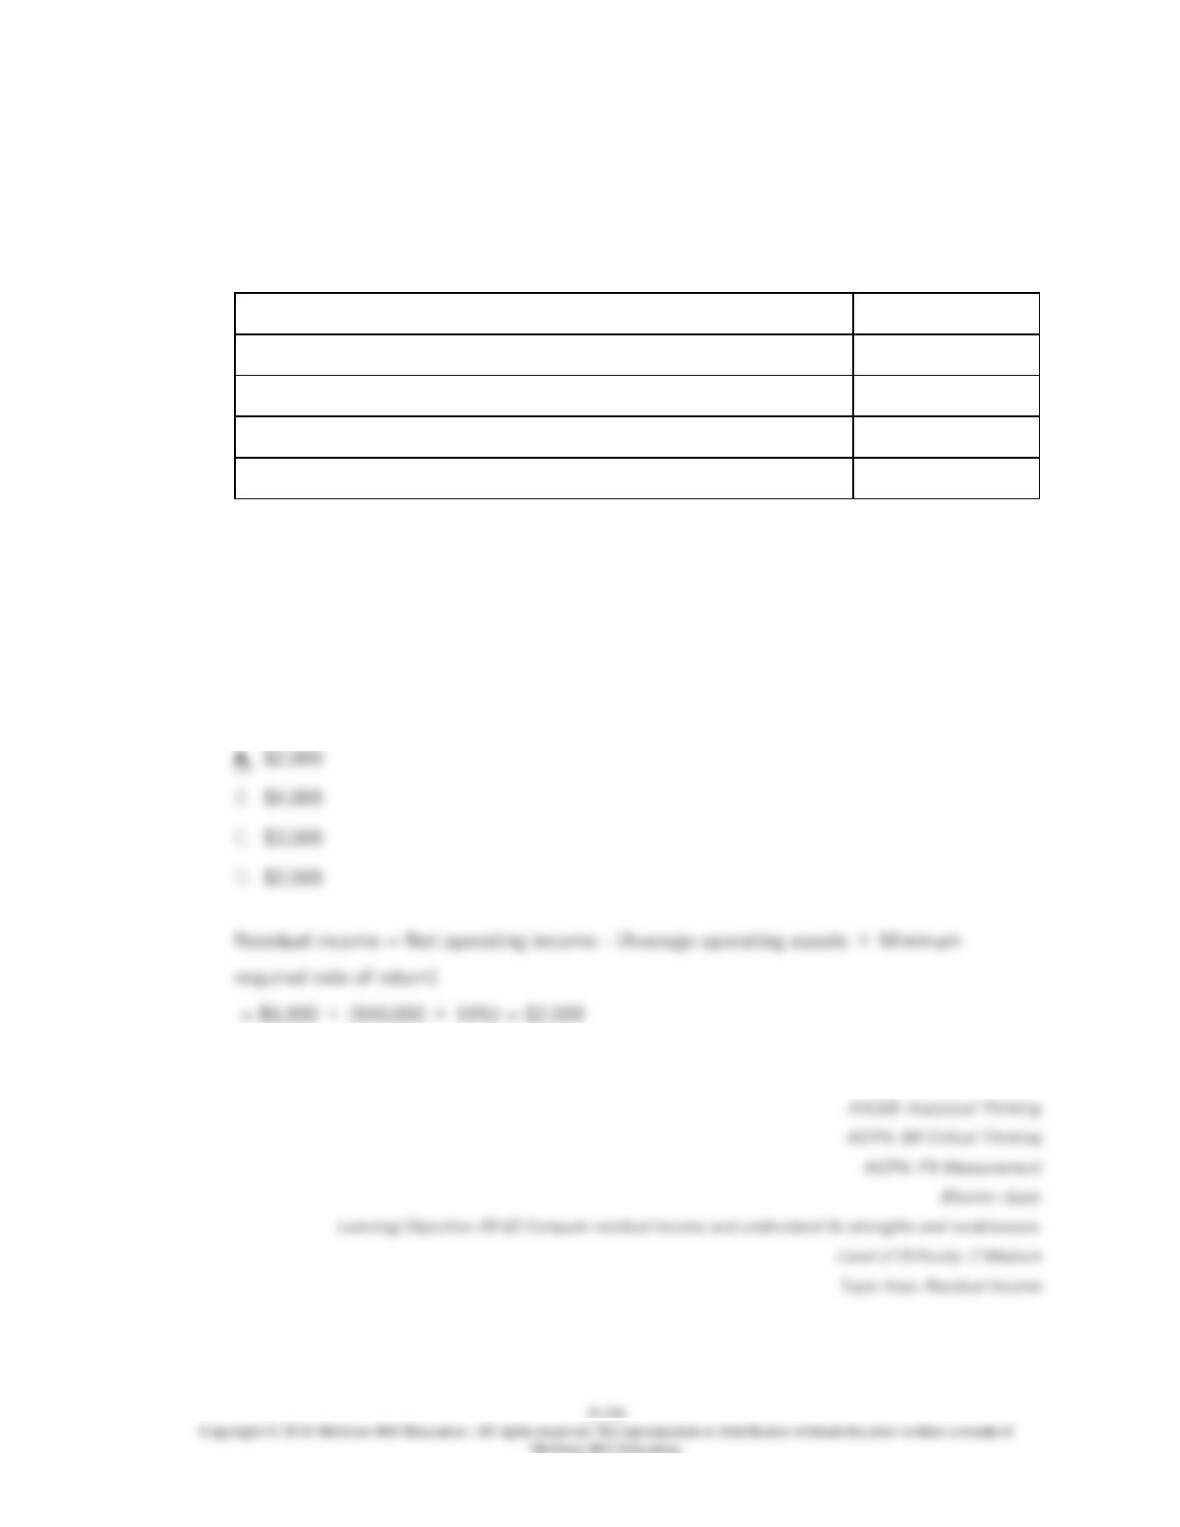
Brandon Inc., has provided the following data for last year’s operations:
Sales
$100,000
Net operating income
$6,000
Average operating assets
$40,000
Stockholders’ equity
$25,000
Minimum required rate of return
10%
Brandon’s residual income is:
80.
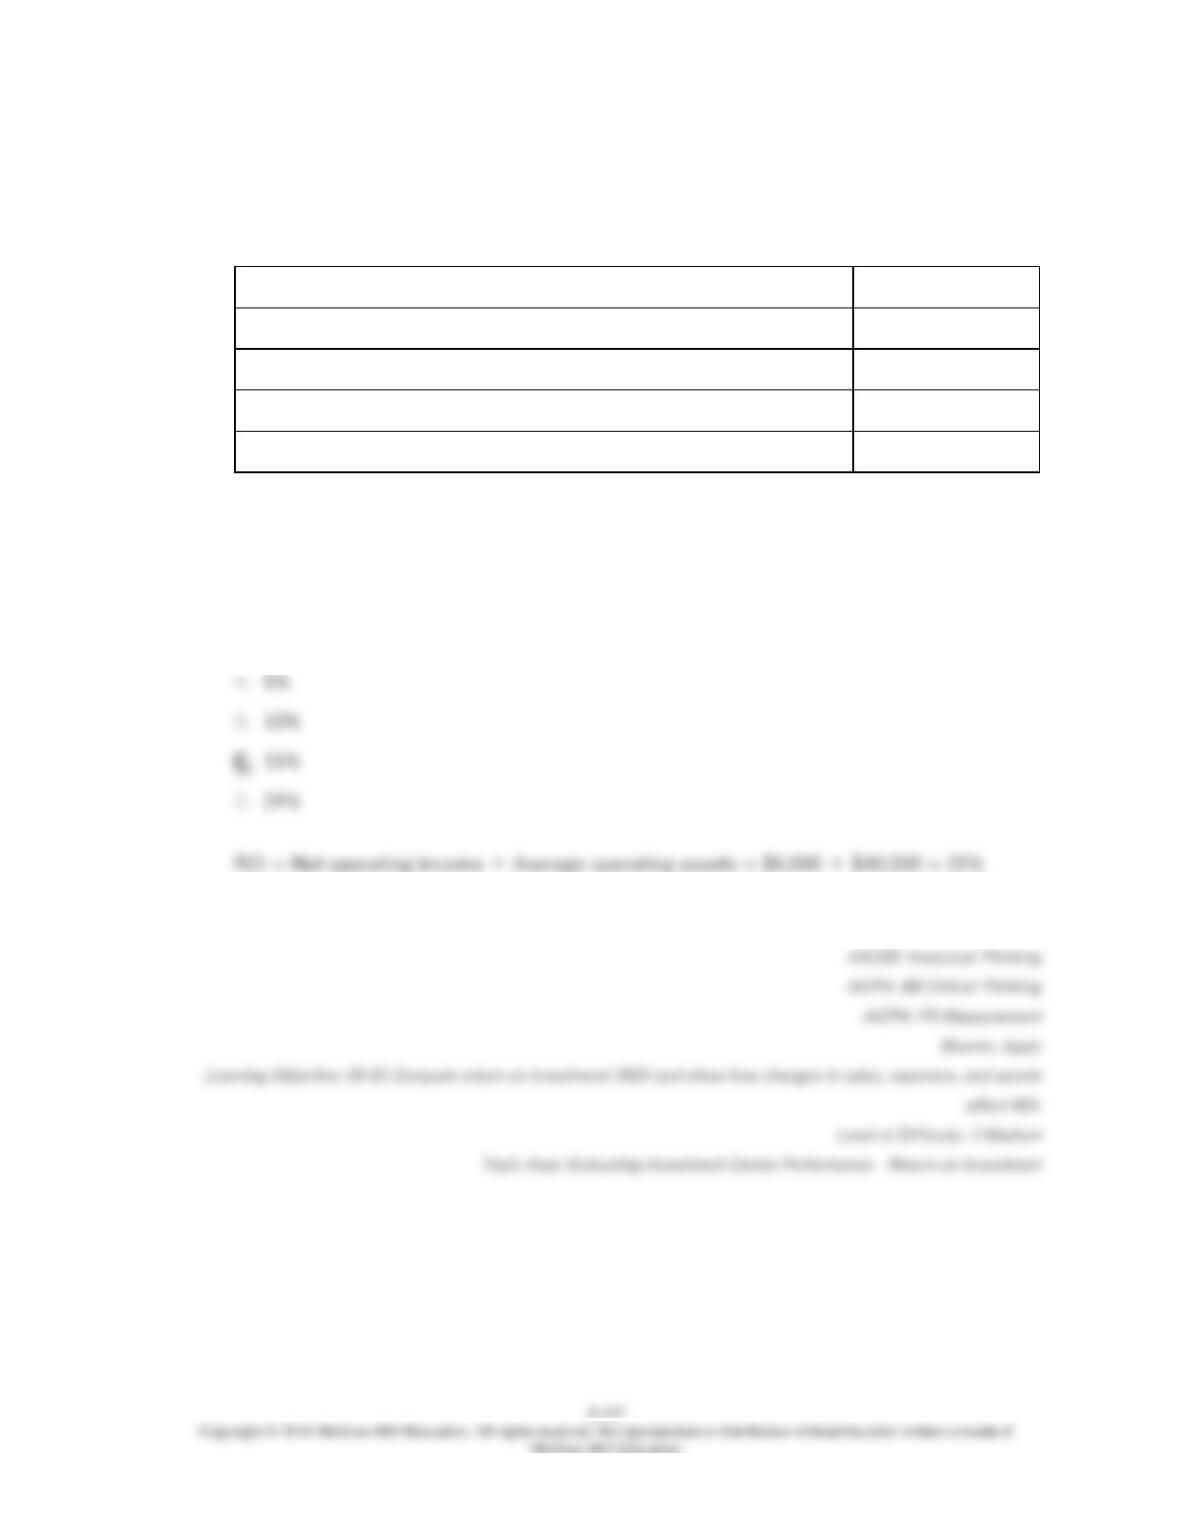
Brandon Inc., has provided the following data for last year’s operations:
Sales
$100,000
Net operating income
$6,000
Average operating assets
$40,000
Stockholders’ equity
$25,000
Minimum required rate of return
10%
Brandon’s return on investment (ROI) is:
81.
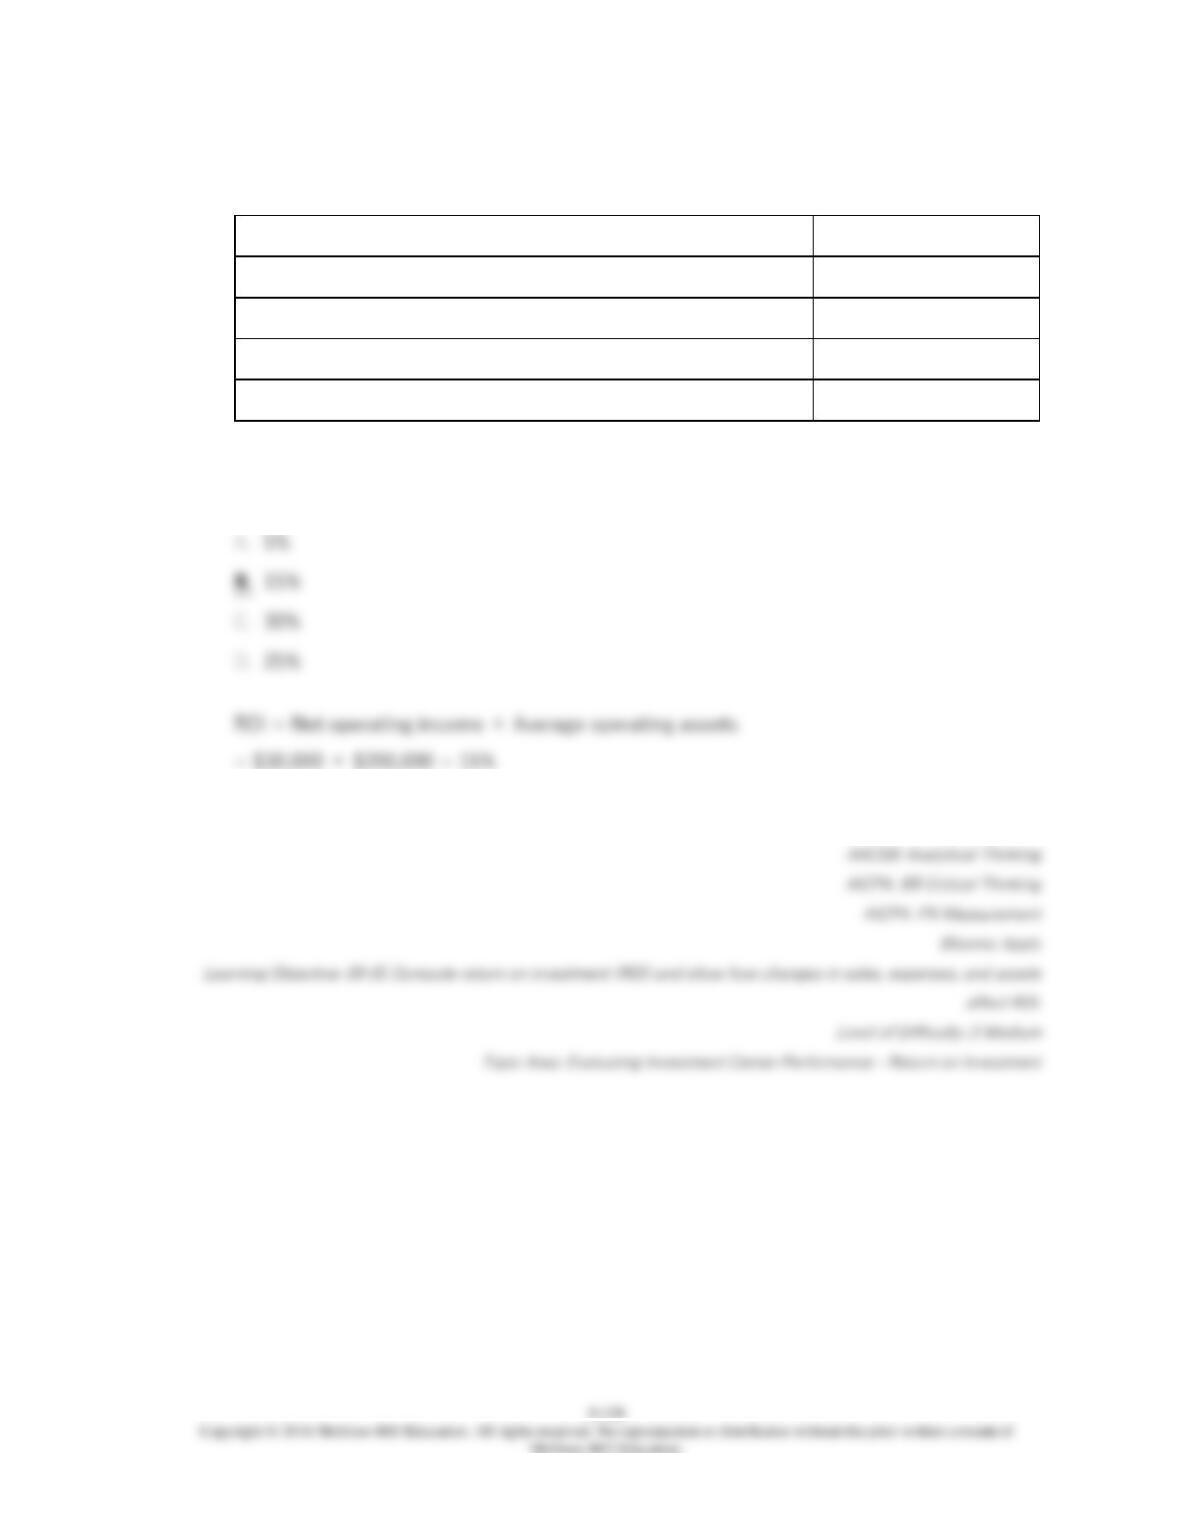
The Jenkins Division recorded operating data as follows for the past year:
Sales
$600,000
Net operating income
$30,000
Average operating assets
$200,000
Stockholders’ equity
$50,000
Residual income
$14,000
For the past year, the return on investment was:
82.
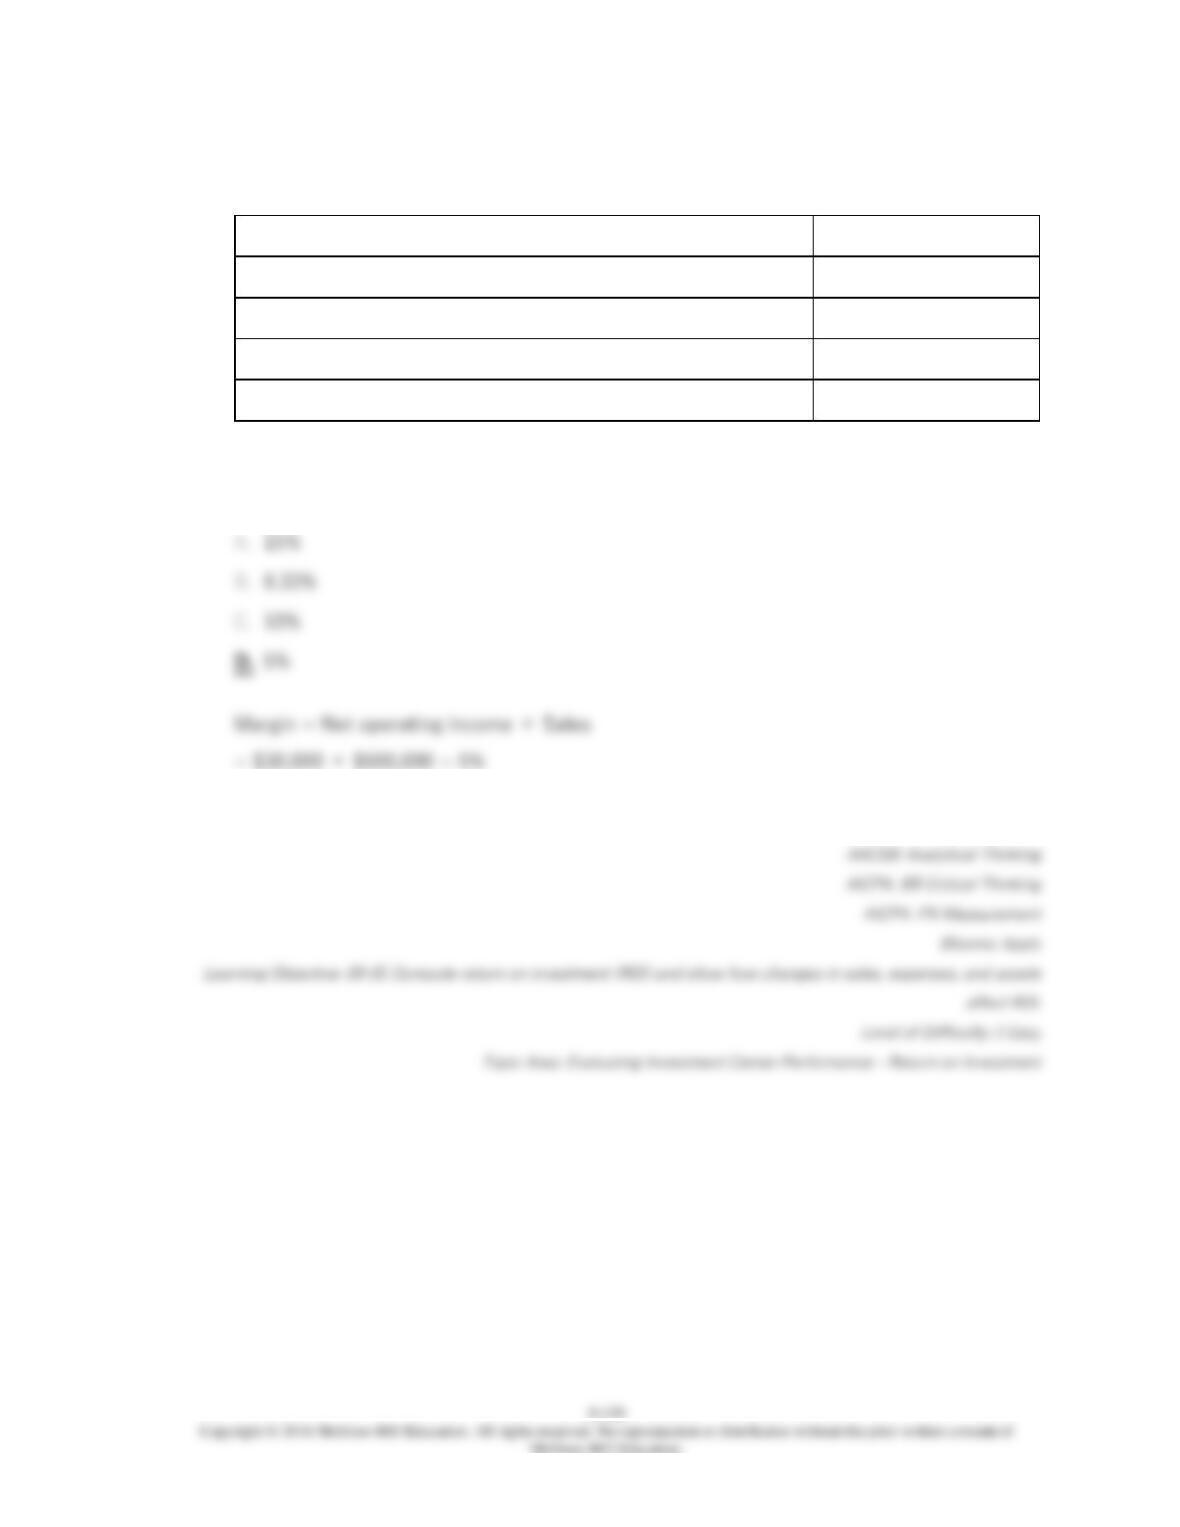
The Jenkins Division recorded operating data as follows for the past year:
Sales
$600,000
Net operating income
$30,000
Average operating assets
$200,000
Stockholders’ equity
$50,000
Residual income
$14,000
For the past year, the margin used in ROI calculations was:
83.
The Jenkins Division recorded operating data as follows for the past year:
Sales
$600,000
Net operating income
$30,000
Average operating assets
$200,000
Stockholders’ equity
$50,000
Residual income
$14,000
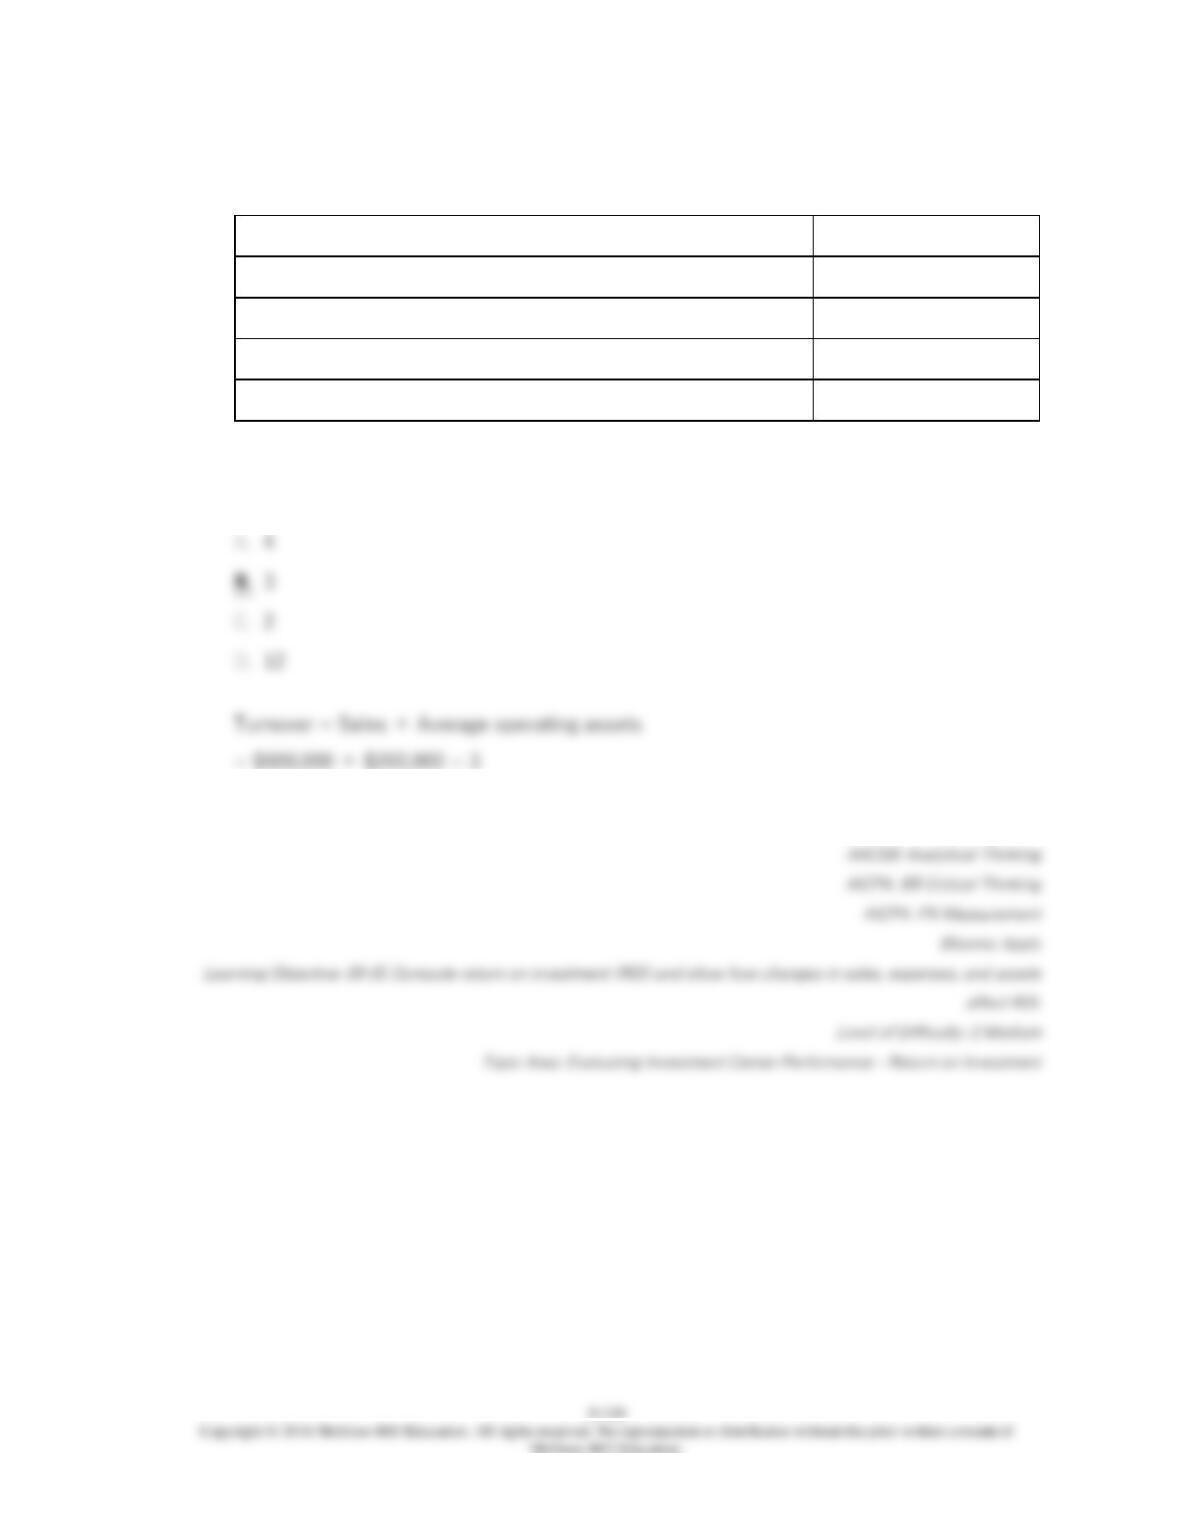
For the past year, the turnover used in ROI calculations was:
84.
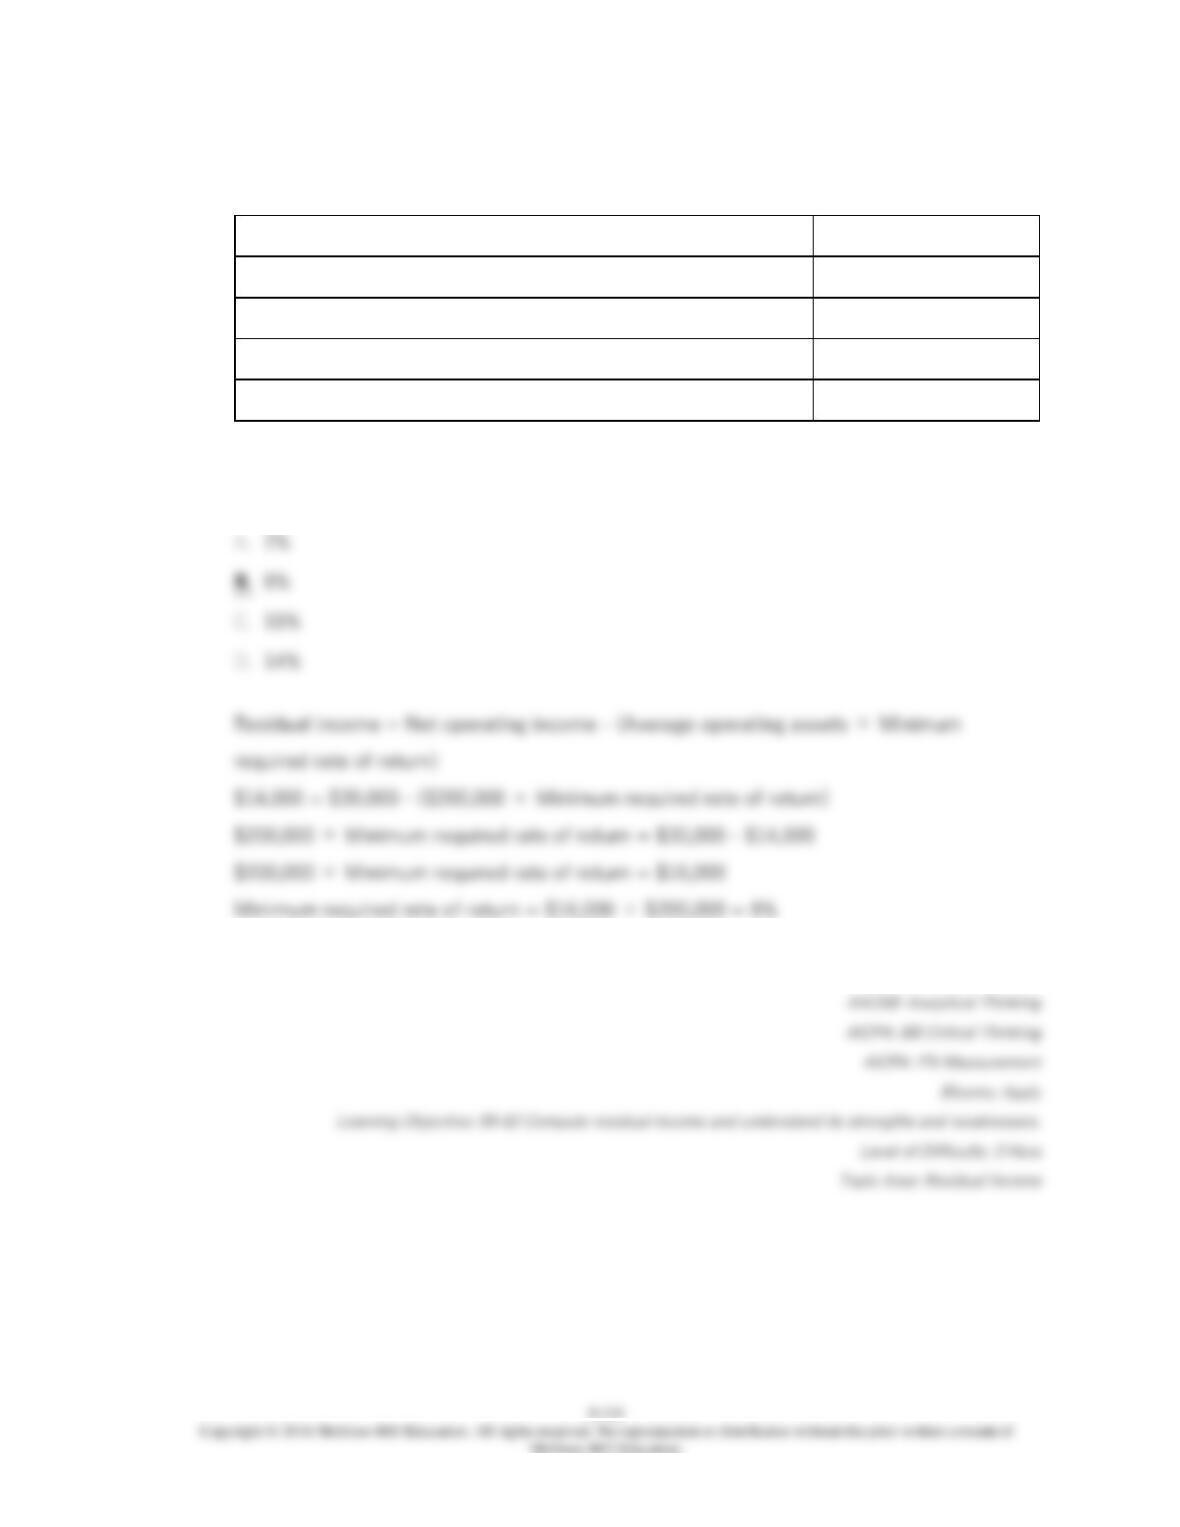
The Jenkins Division recorded operating data as follows for the past year:
Sales
$600,000
Net operating income
$30,000
Average operating assets
$200,000
Stockholders’ equity
$50,000
Residual income
$14,000
For the past year, the minimum required rate of return was:
85.
The North Division of the Lyman Company reported the following data for last year:
Net operating income
$200,000
Interest expense
$50,000
Tax expense
$60,000
Stockholders’ equity
$250,000
Average operating assets
$500,000
Minimum required rate of
return
14%
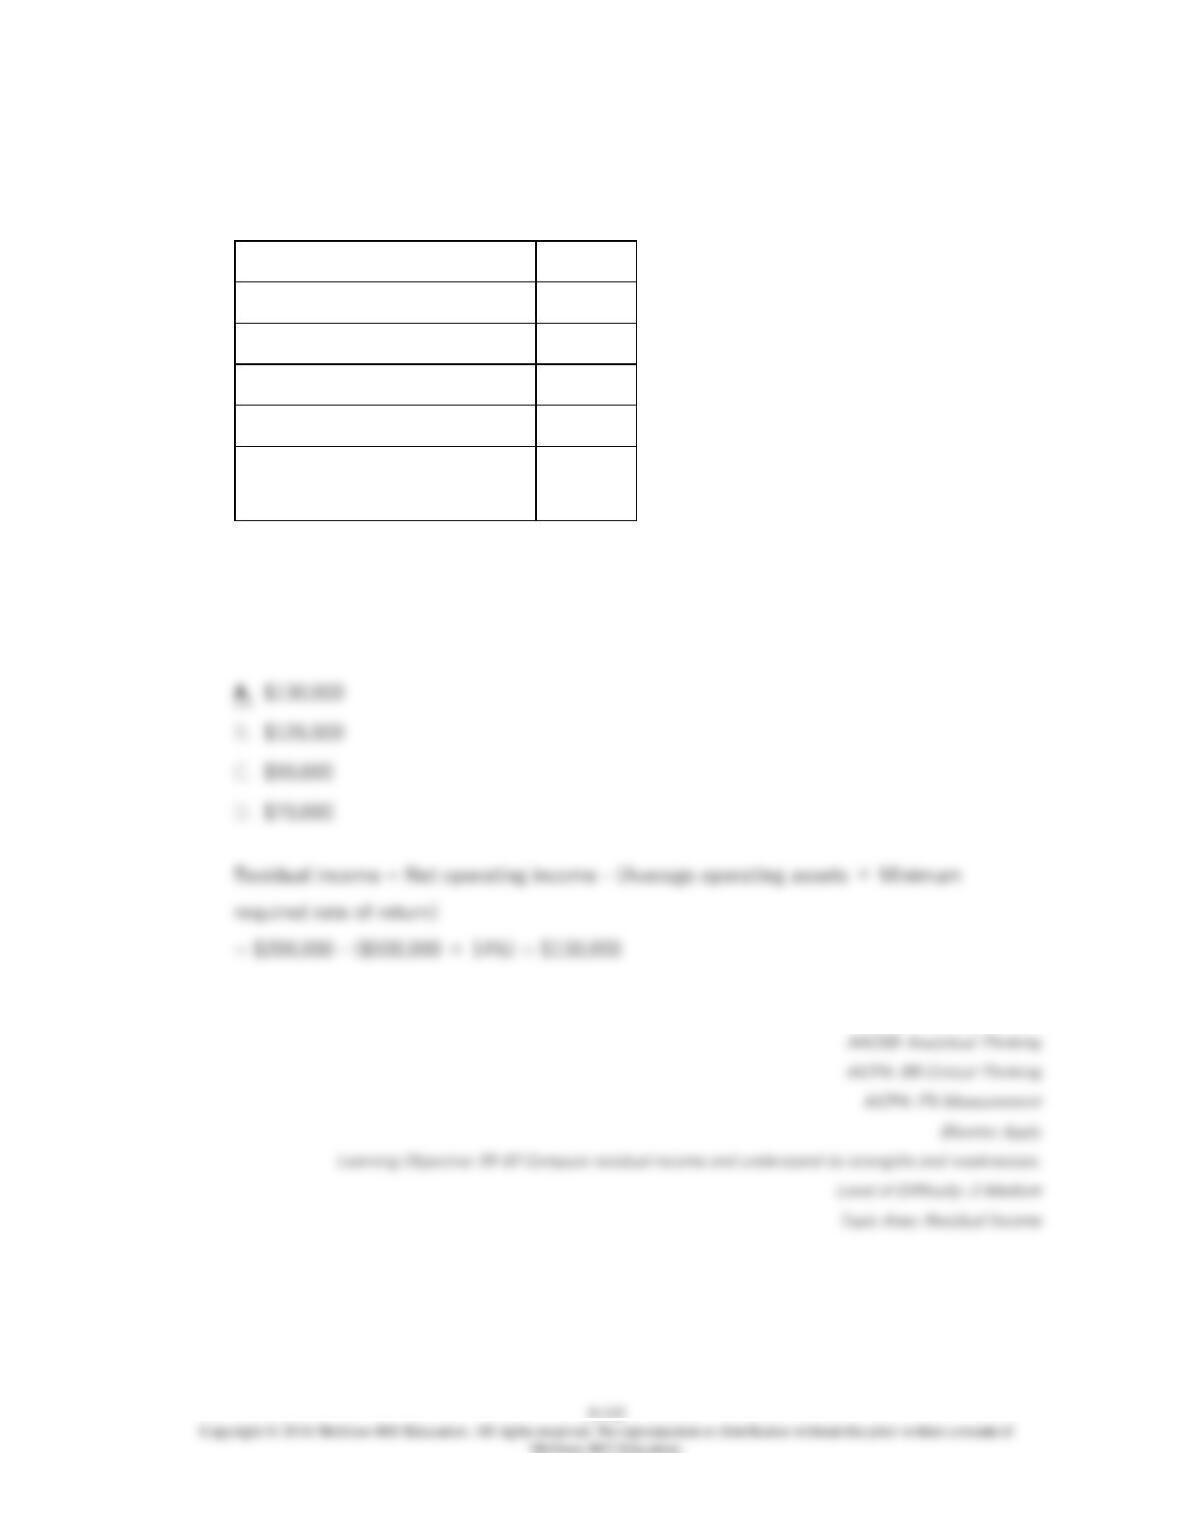
The residual income for the North Division last year was:
86.
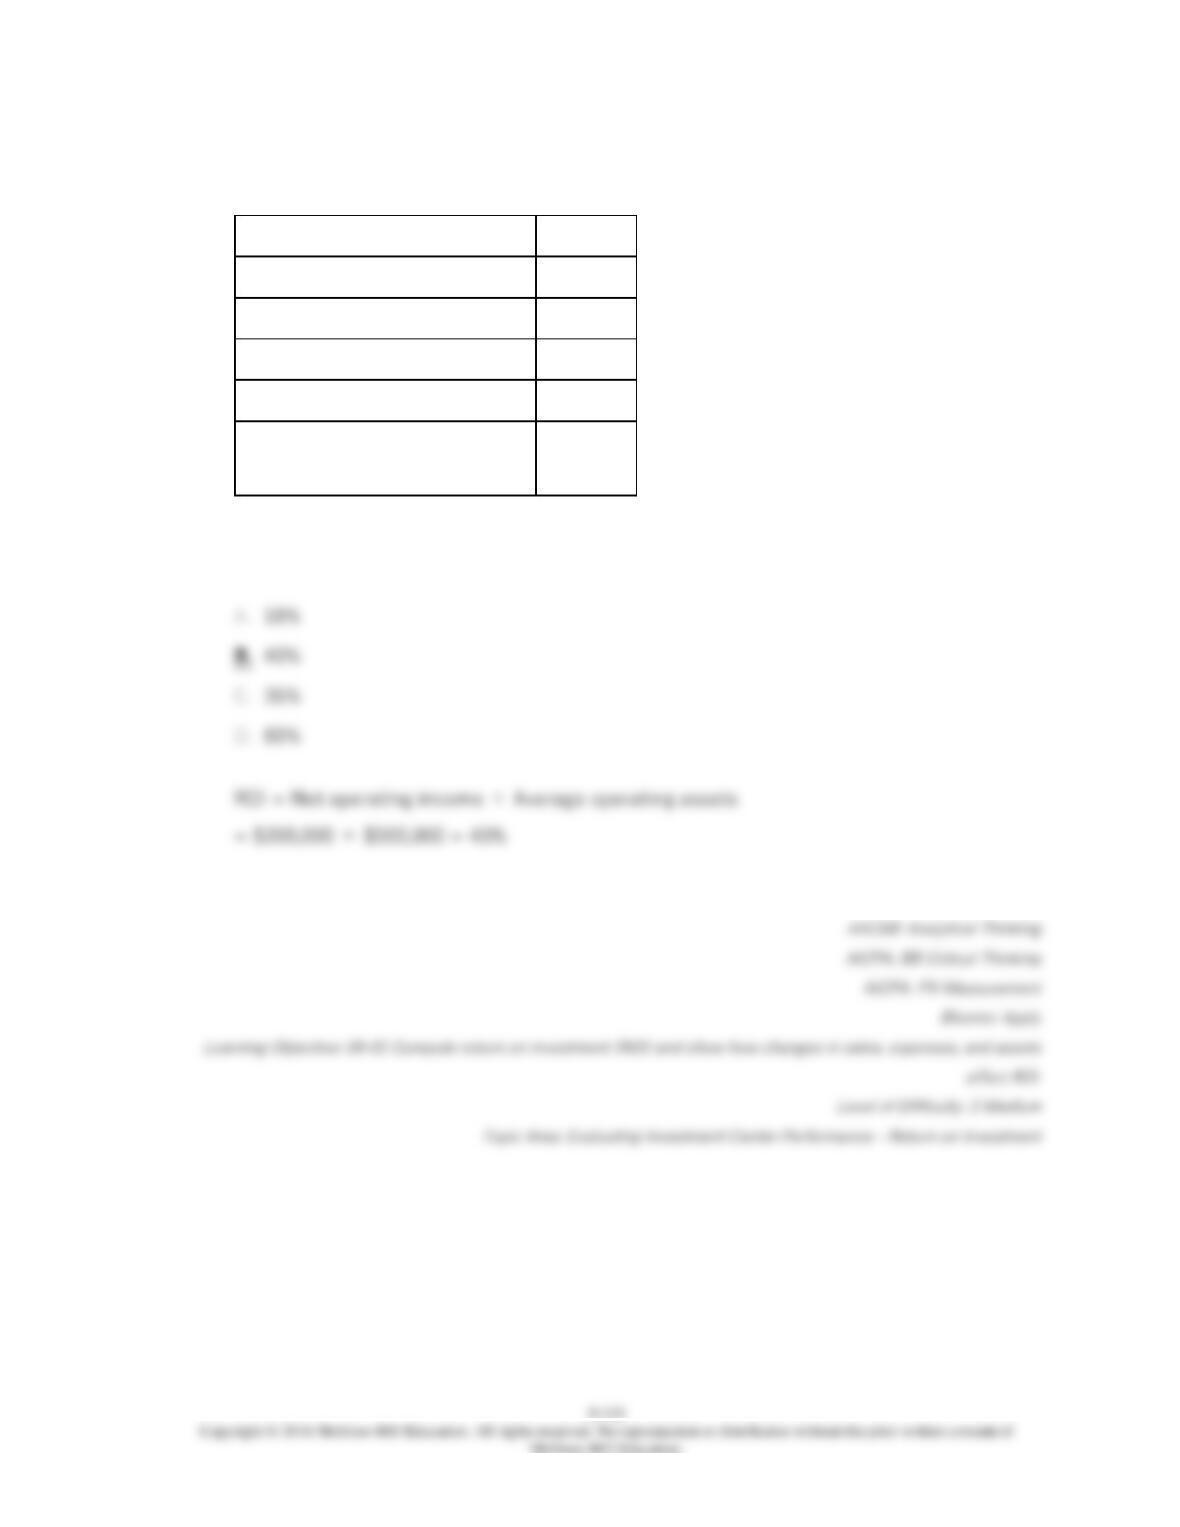
The North Division of the Lyman Company reported the following data for last year:
Net operating income
$200,000
Interest expense
$50,000
Tax expense
$60,000
Stockholders’ equity
$250,000
Average operating assets
$500,000
Minimum required rate of
return
14%
The return on investment last year for the North Division was:
87.
The West Division of Frede Corporation had average operating assets of $700,000 and net
operating income of $120,800 in December. The minimum required rate of return for
performance evaluation purposes is 16%.
What was the West Division’s minimum required return in December?
88.
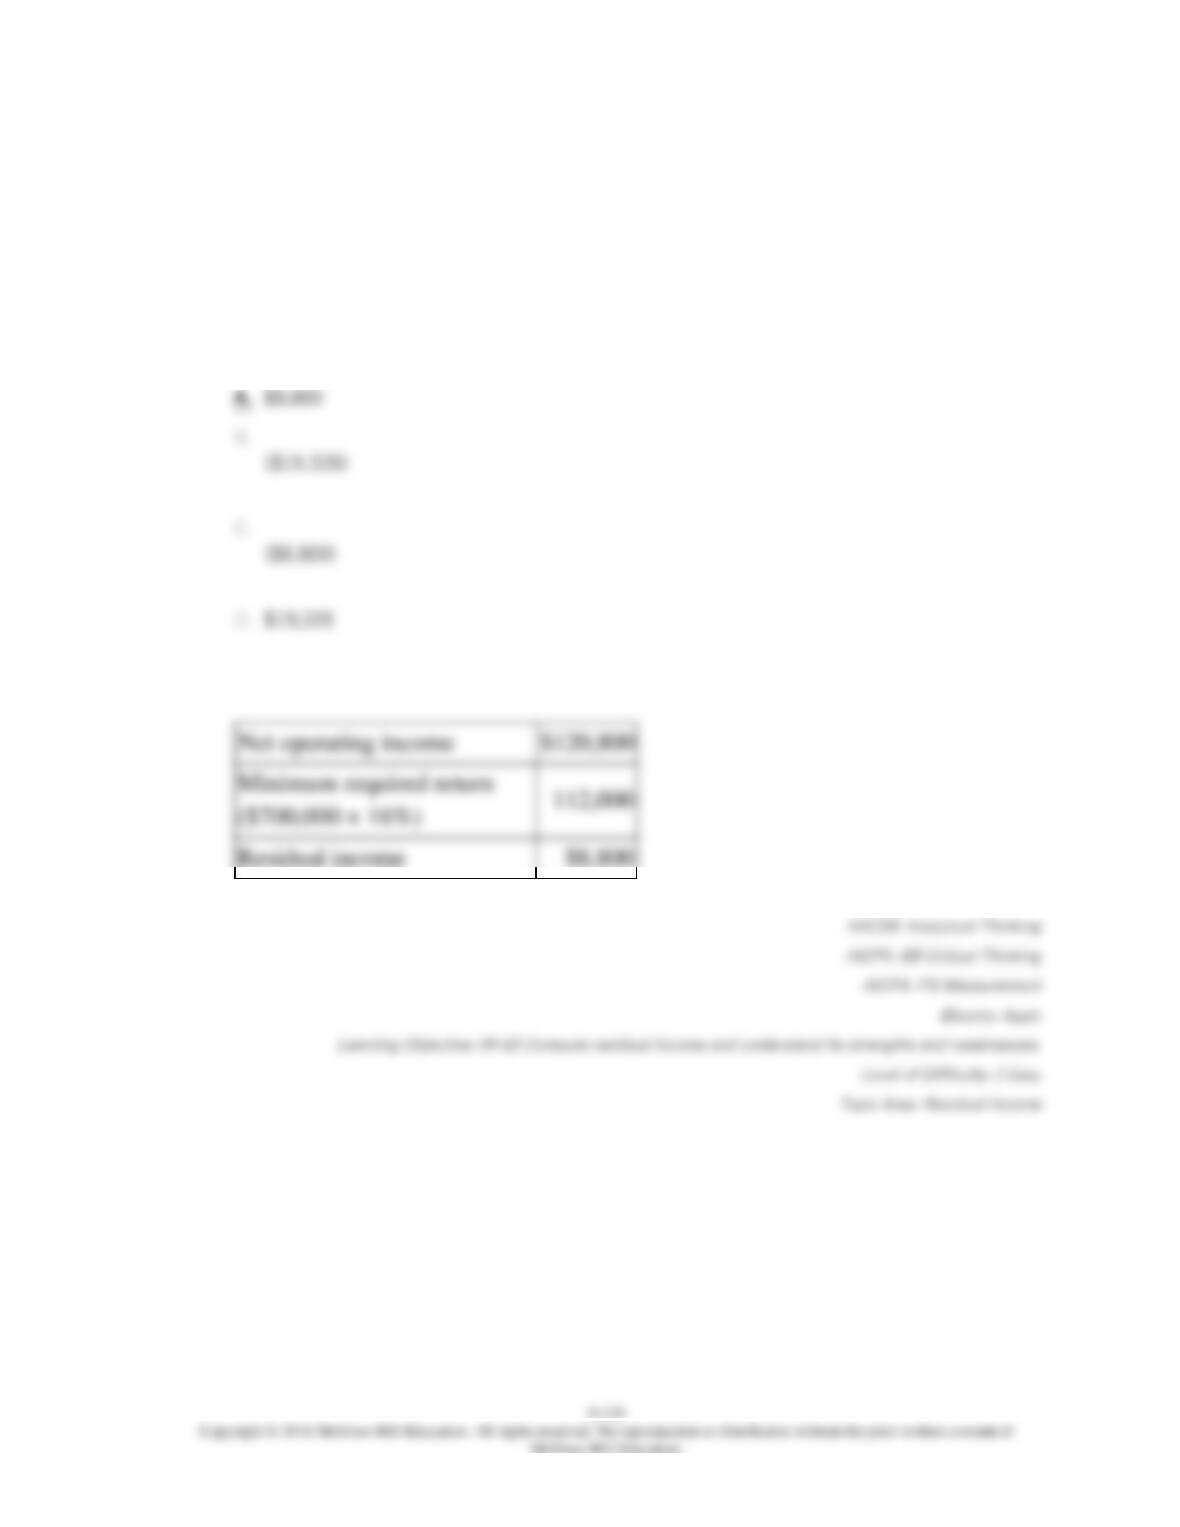
The West Division of Frede Corporation had average operating assets of $700,000 and net
operating income of $120,800 in December. The minimum required rate of return for
performance evaluation purposes is 16%.
What was the West Division’s residual income in December?
9-137
90.
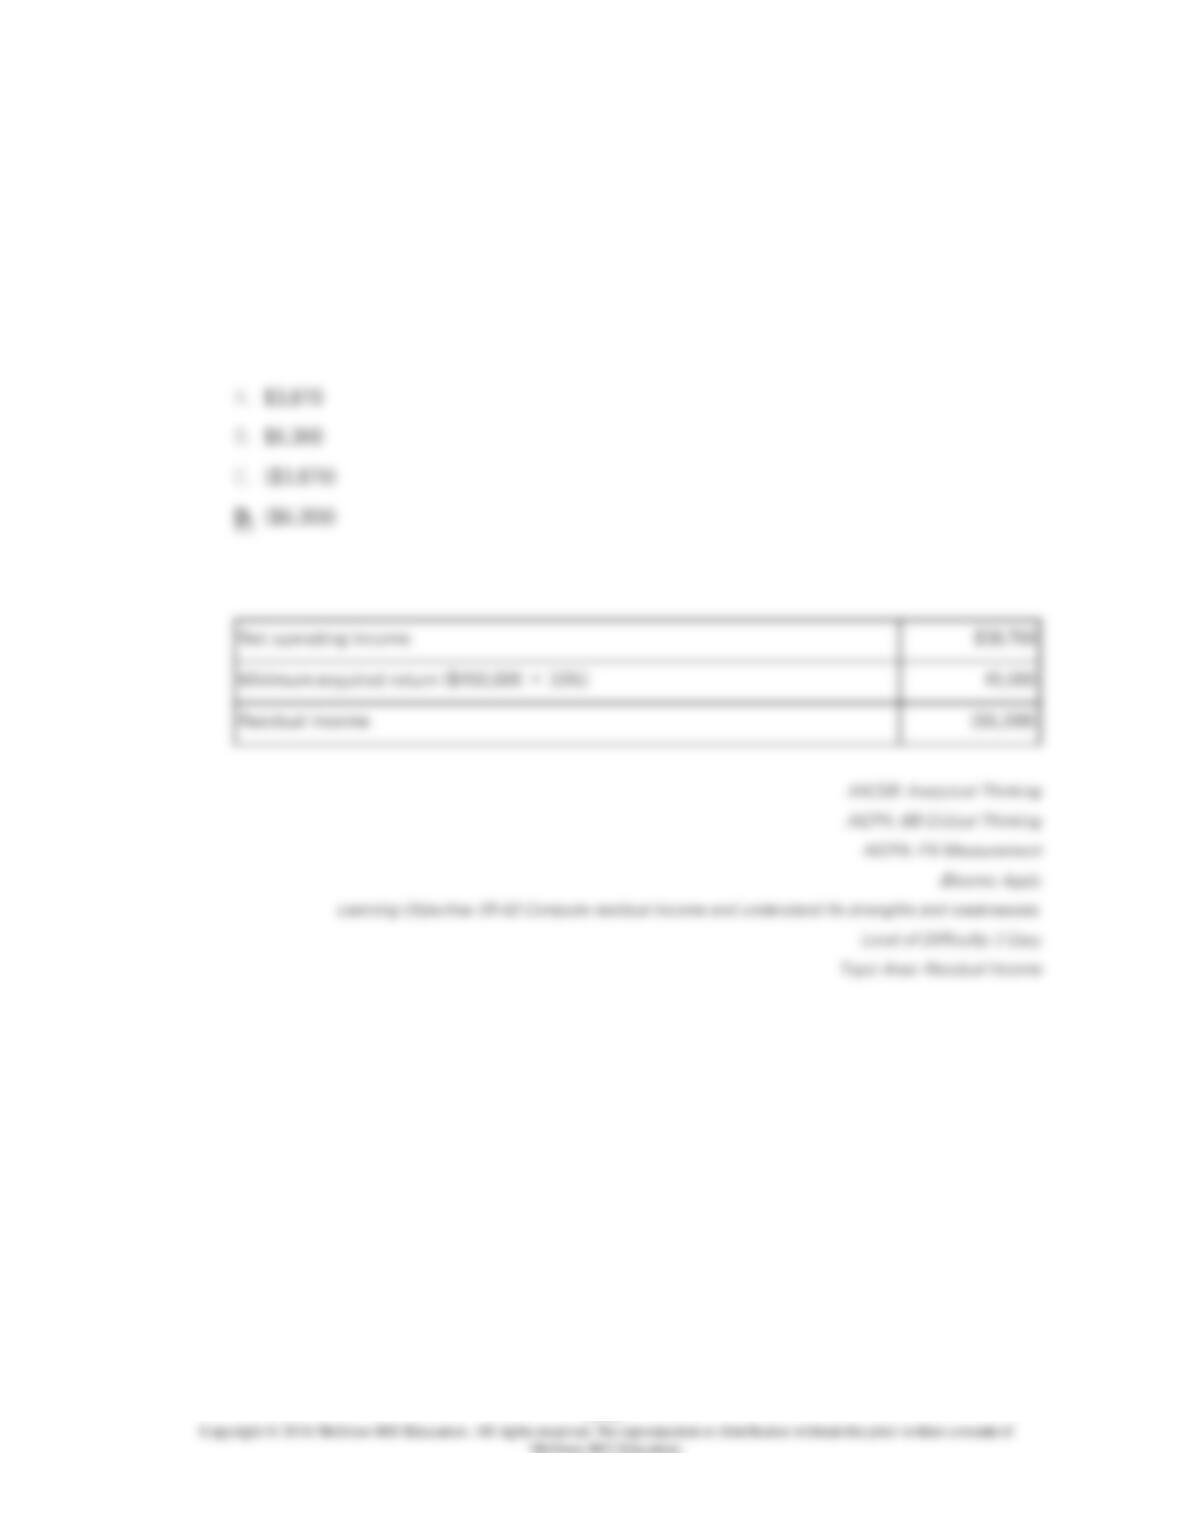
The Consumer Products Division of Mickolick Corporation had average operating assets of
$450,000 and net operating income of $38,700 in August. The minimum required rate of
return for performance evaluation purposes is 10%.
What was the Consumer Products Division’s residual income in August?
91.
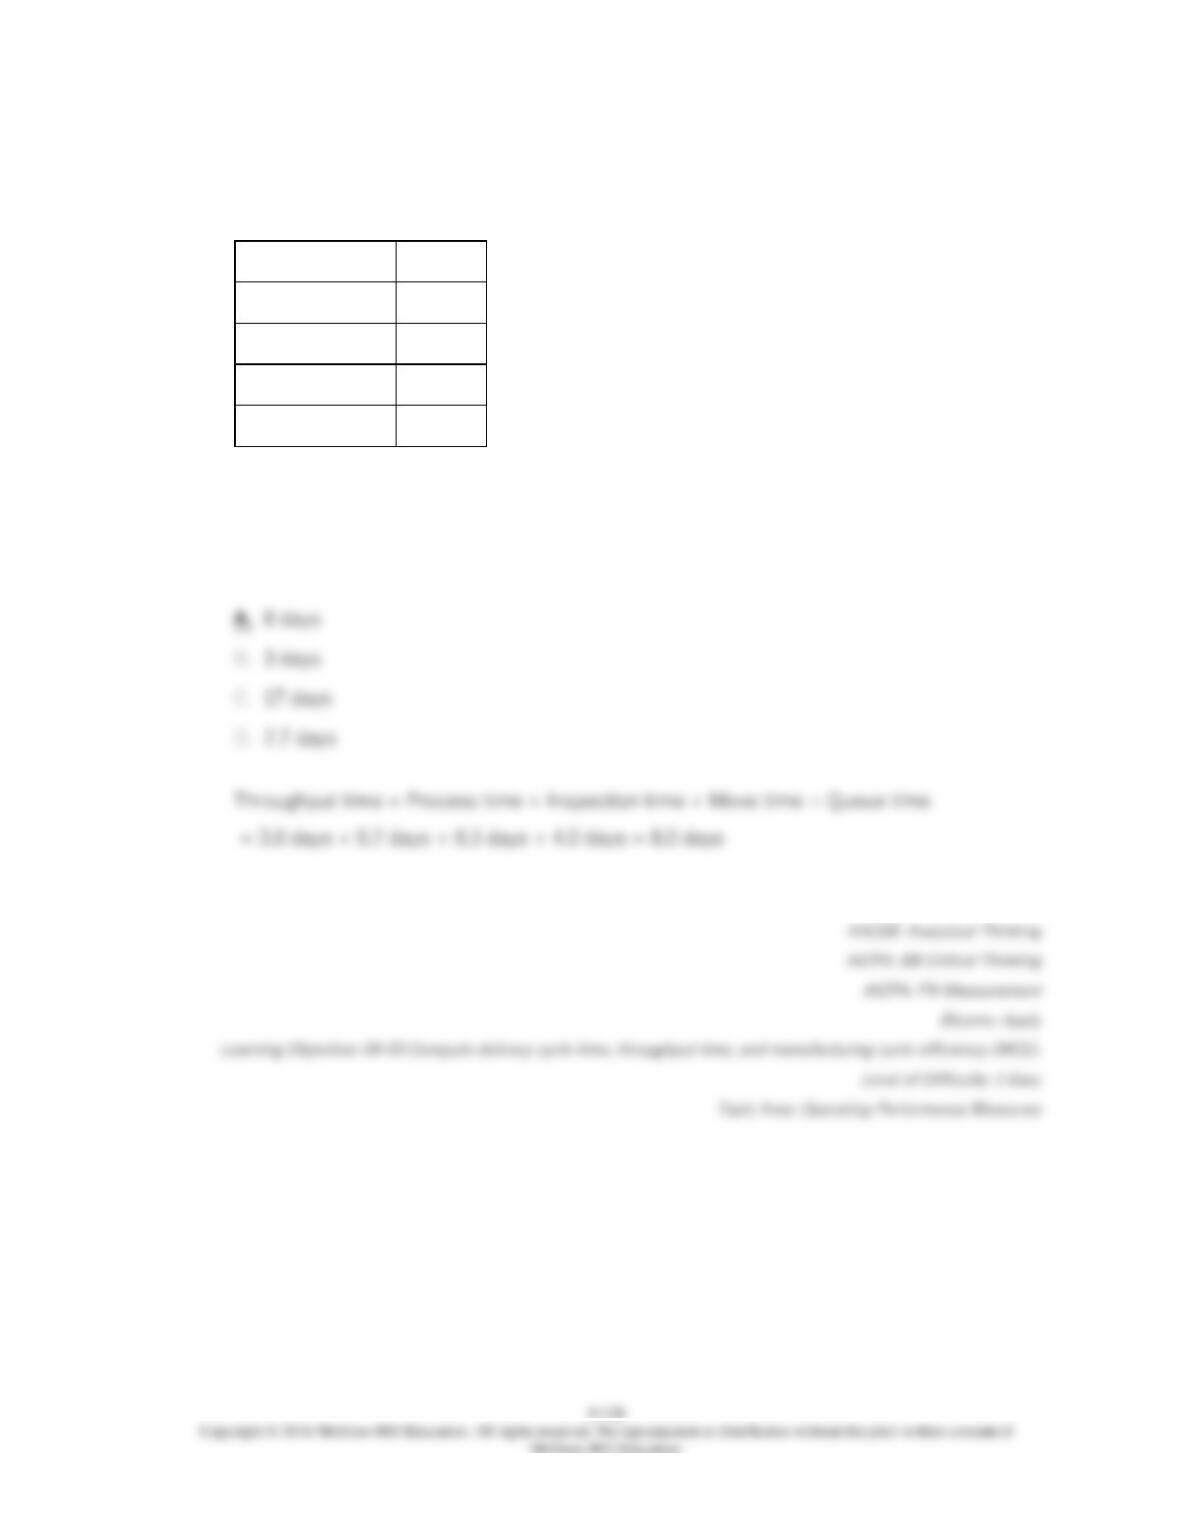
Ricric Corporation has provided the following data for one of its products:
Process time
3.0 days
Queue time
4.0 days
Inspection time
0.7 days
Move time
0.3 days
Wait time
9.0 days
The throughput time for this operation is:
92.
Ricric Corporation has provided the following data for one of its products:
Process time
3.0 days
Queue time
4.0 days
Inspection time
0.7 days
Move time
0.3 days
Wait time
9.0 days
The delivery cycle time for this operation is:
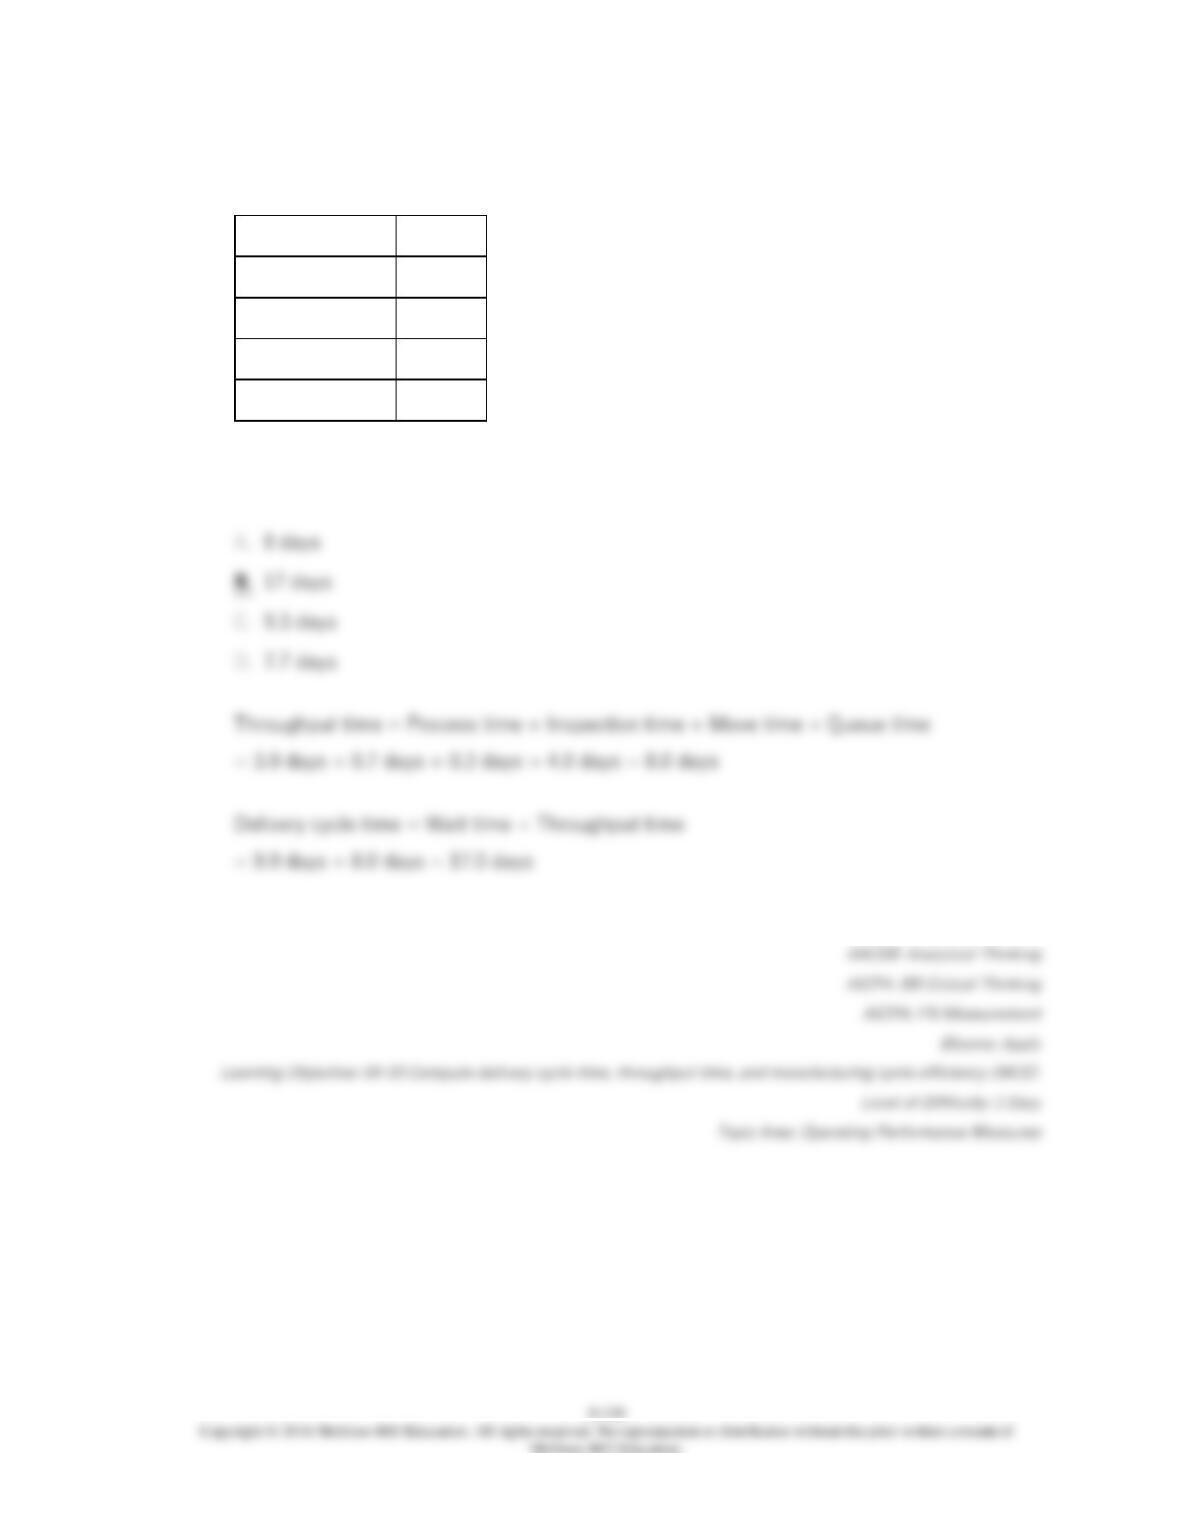
93.
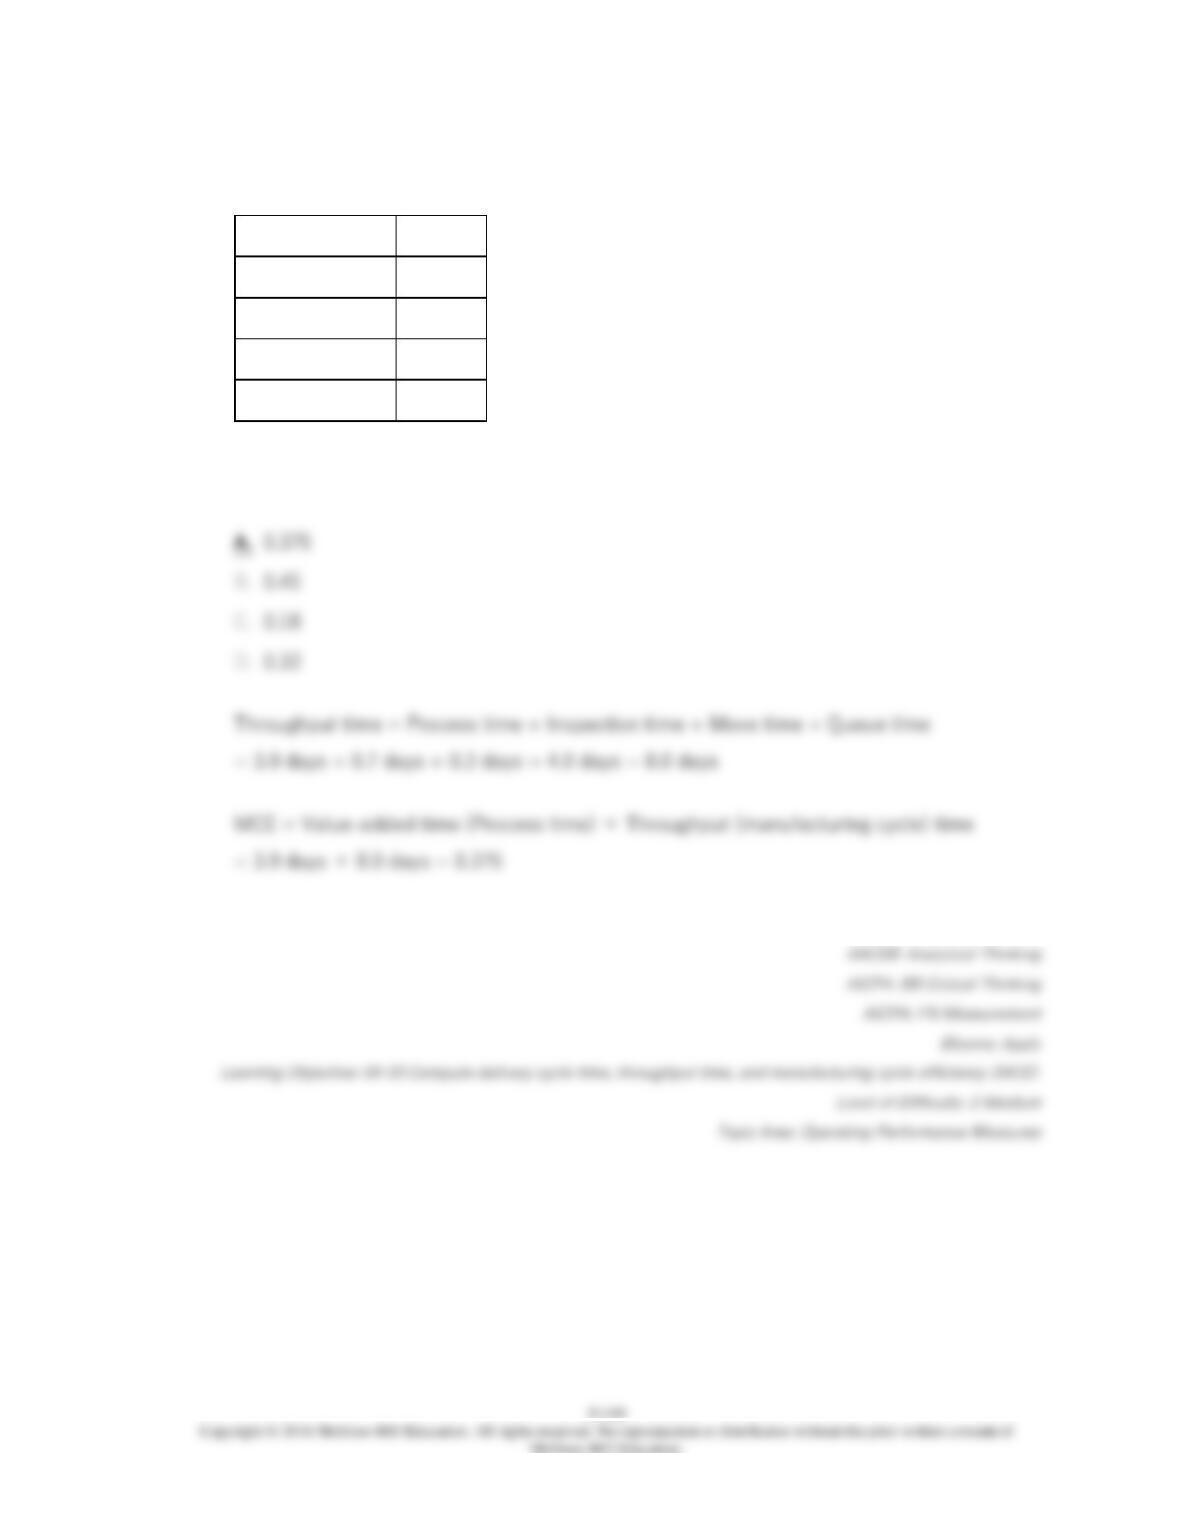
Ricric Corporation has provided the following data for one of its products:
Process time
3.0 days
Queue time
4.0 days
Inspection time
0.7 days
Move time
0.3 days
Wait time
9.0 days
The manufacturing cycle efficiency for this operation is closest to:
94.
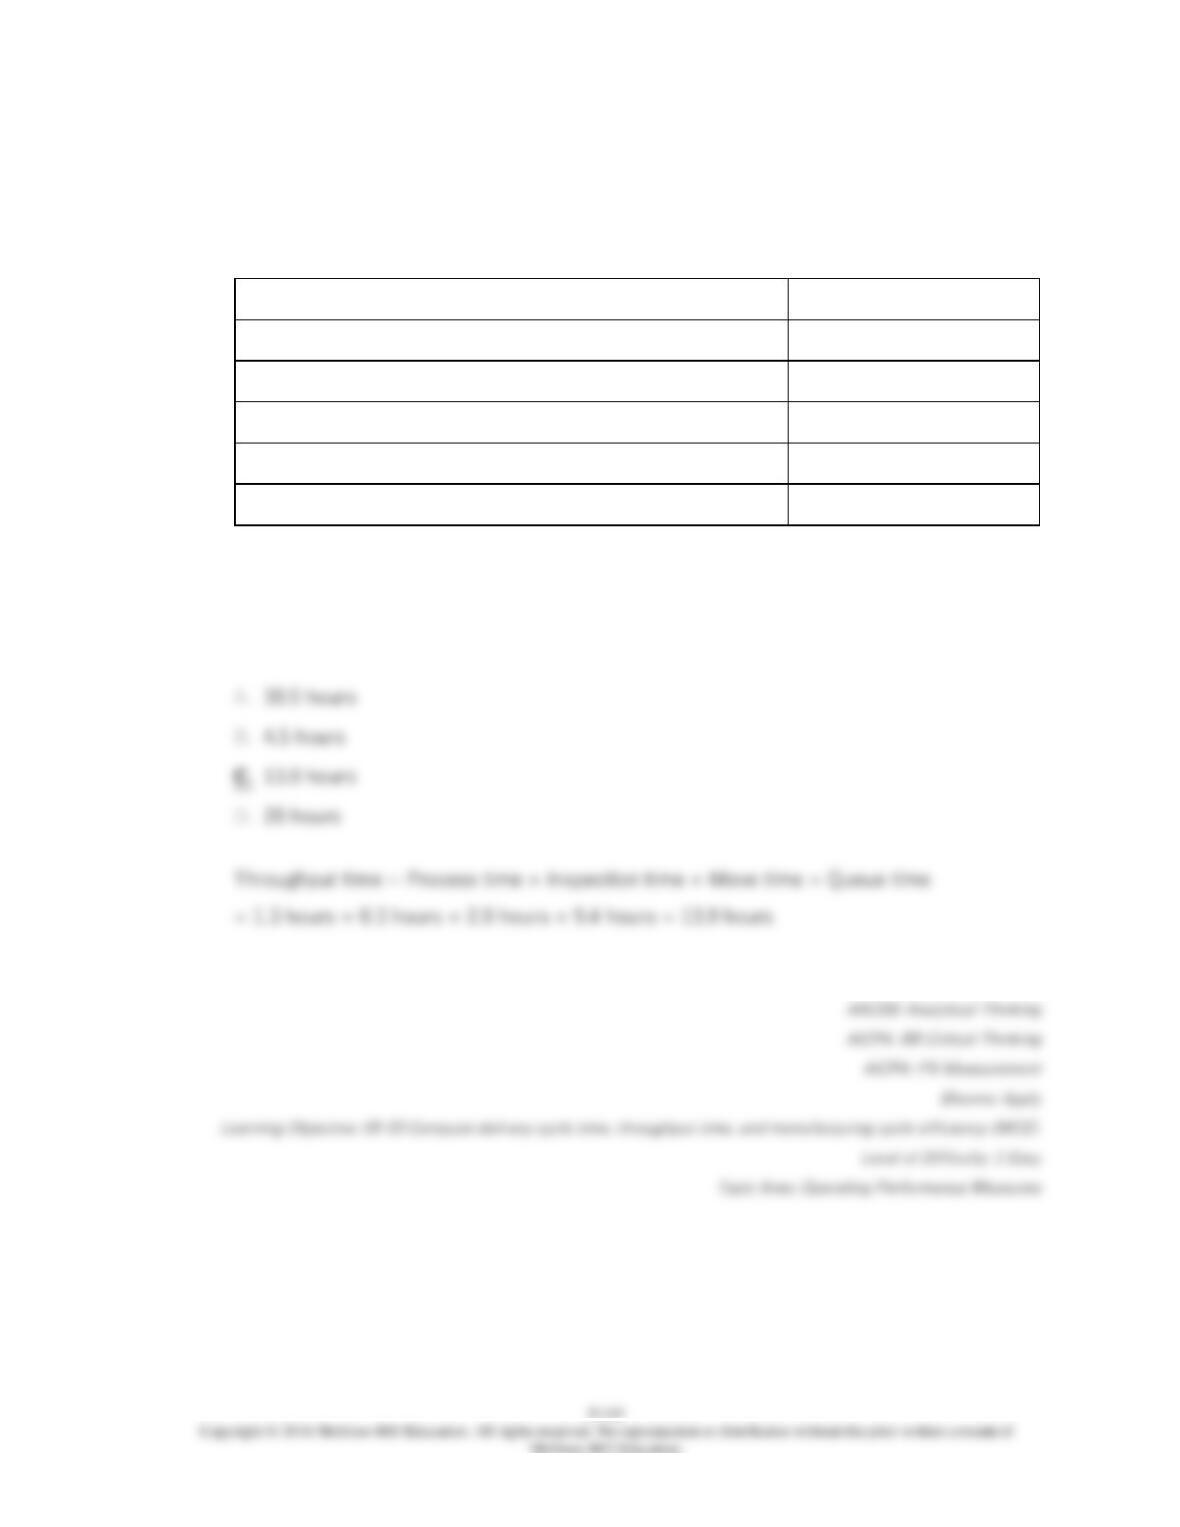
Ebsen Corporation keeps careful track of the time required to fill orders. Data concerning a
particular order appear below:
Hours
Wait time
16.6
Process time
1.3
Inspection time
0.3
Move time
2.9
Queue time
9.4
The throughput time was:
95.
Ebsen Corporation keeps careful track of the time required to fill orders. Data concerning a
particular order appear below:
Hours
Wait time
16.6
Process time
1.3
Inspection time
0.3
Move time
2.9
Queue time
9.4
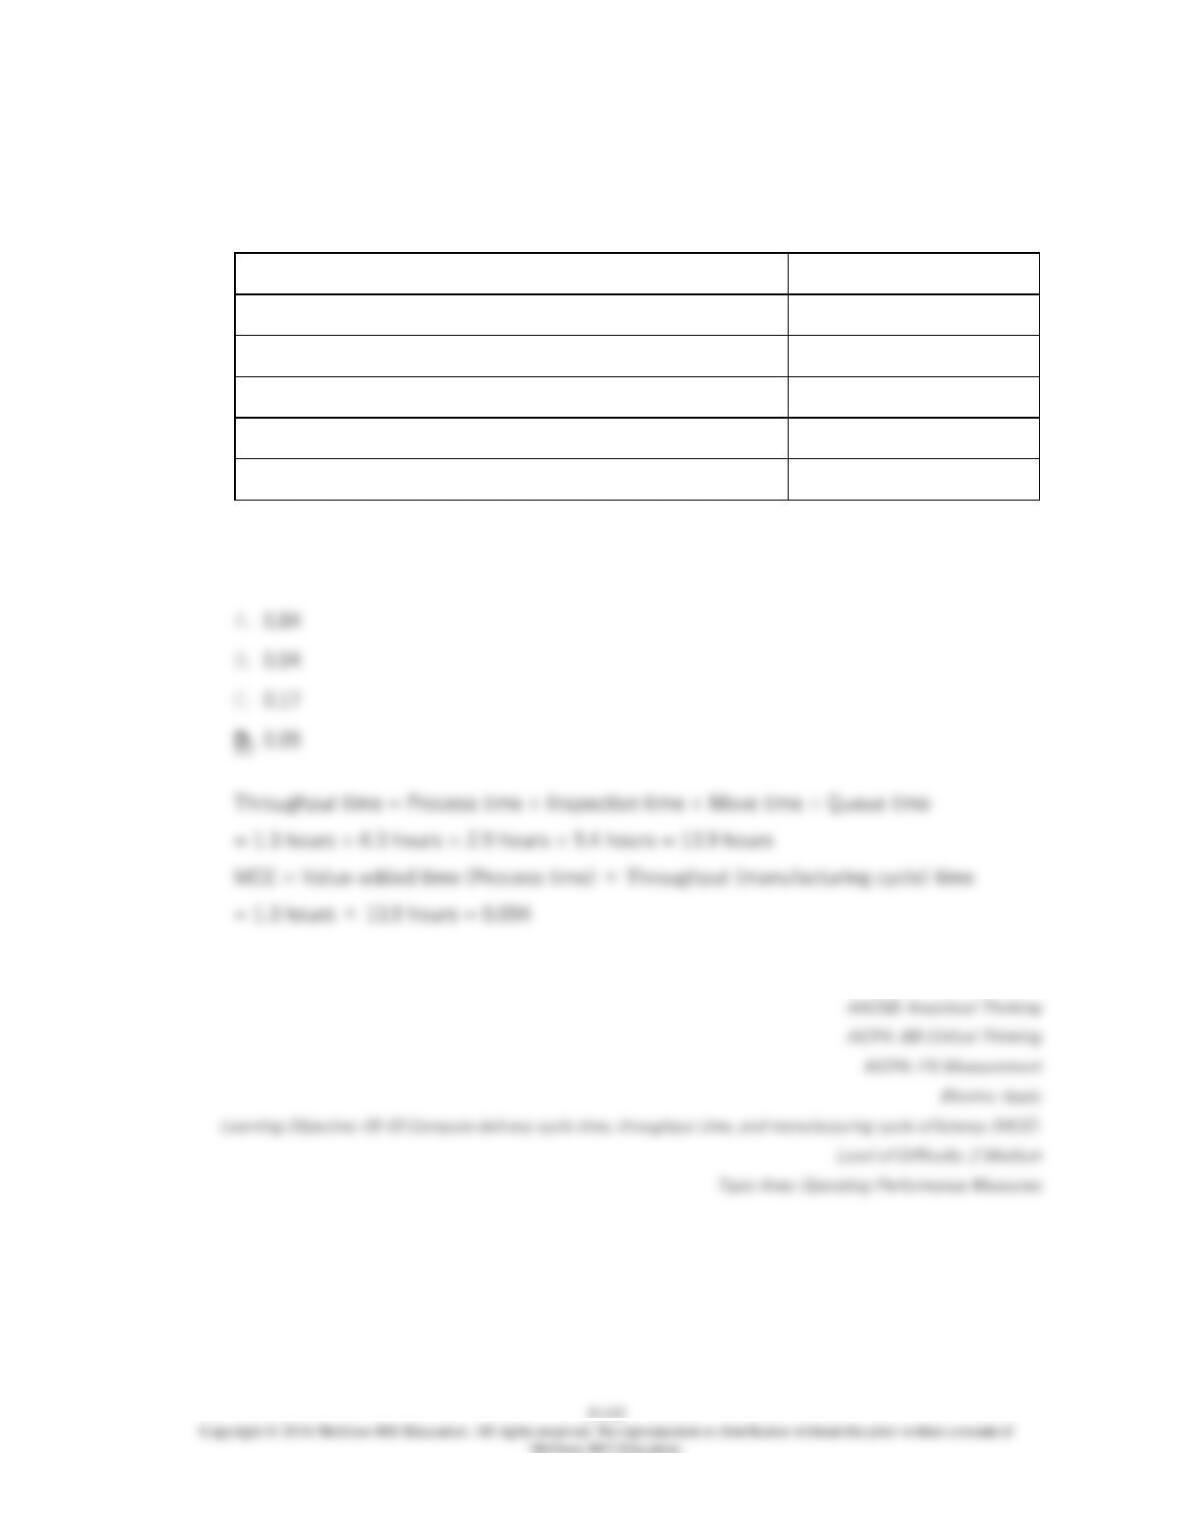
The manufacturing cycle efficiency (MCE) was closest to:
96.
Ebsen Corporation keeps careful track of the time required to fill orders. Data concerning a
particular order appear below:
Hours
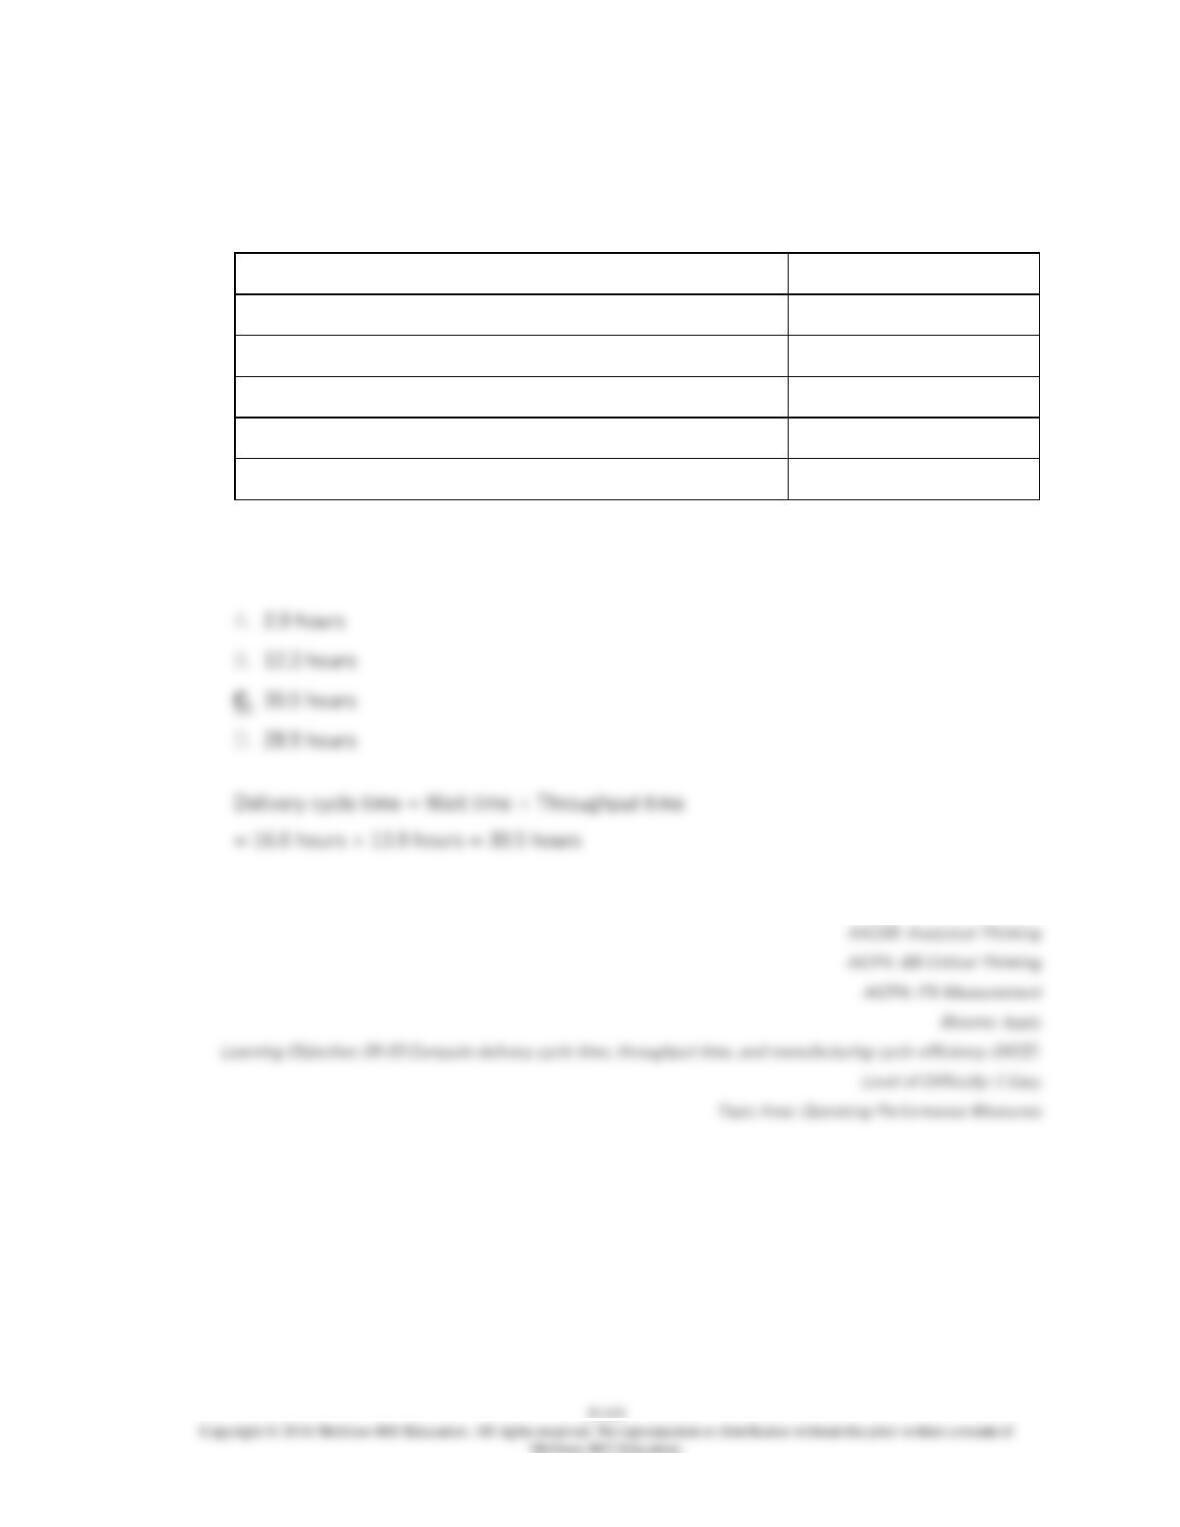
Wait time
16.6
Process time
1.3
Inspection time
0.3
Move time
2.9
Queue time
9.4
The delivery cycle time was:
97.
The following data pertain to operations at Quick Incorporated:
Throughput time
4 hours
Delivery cycle time
8 hours
Process time
1 hour
Queue time
2 hours
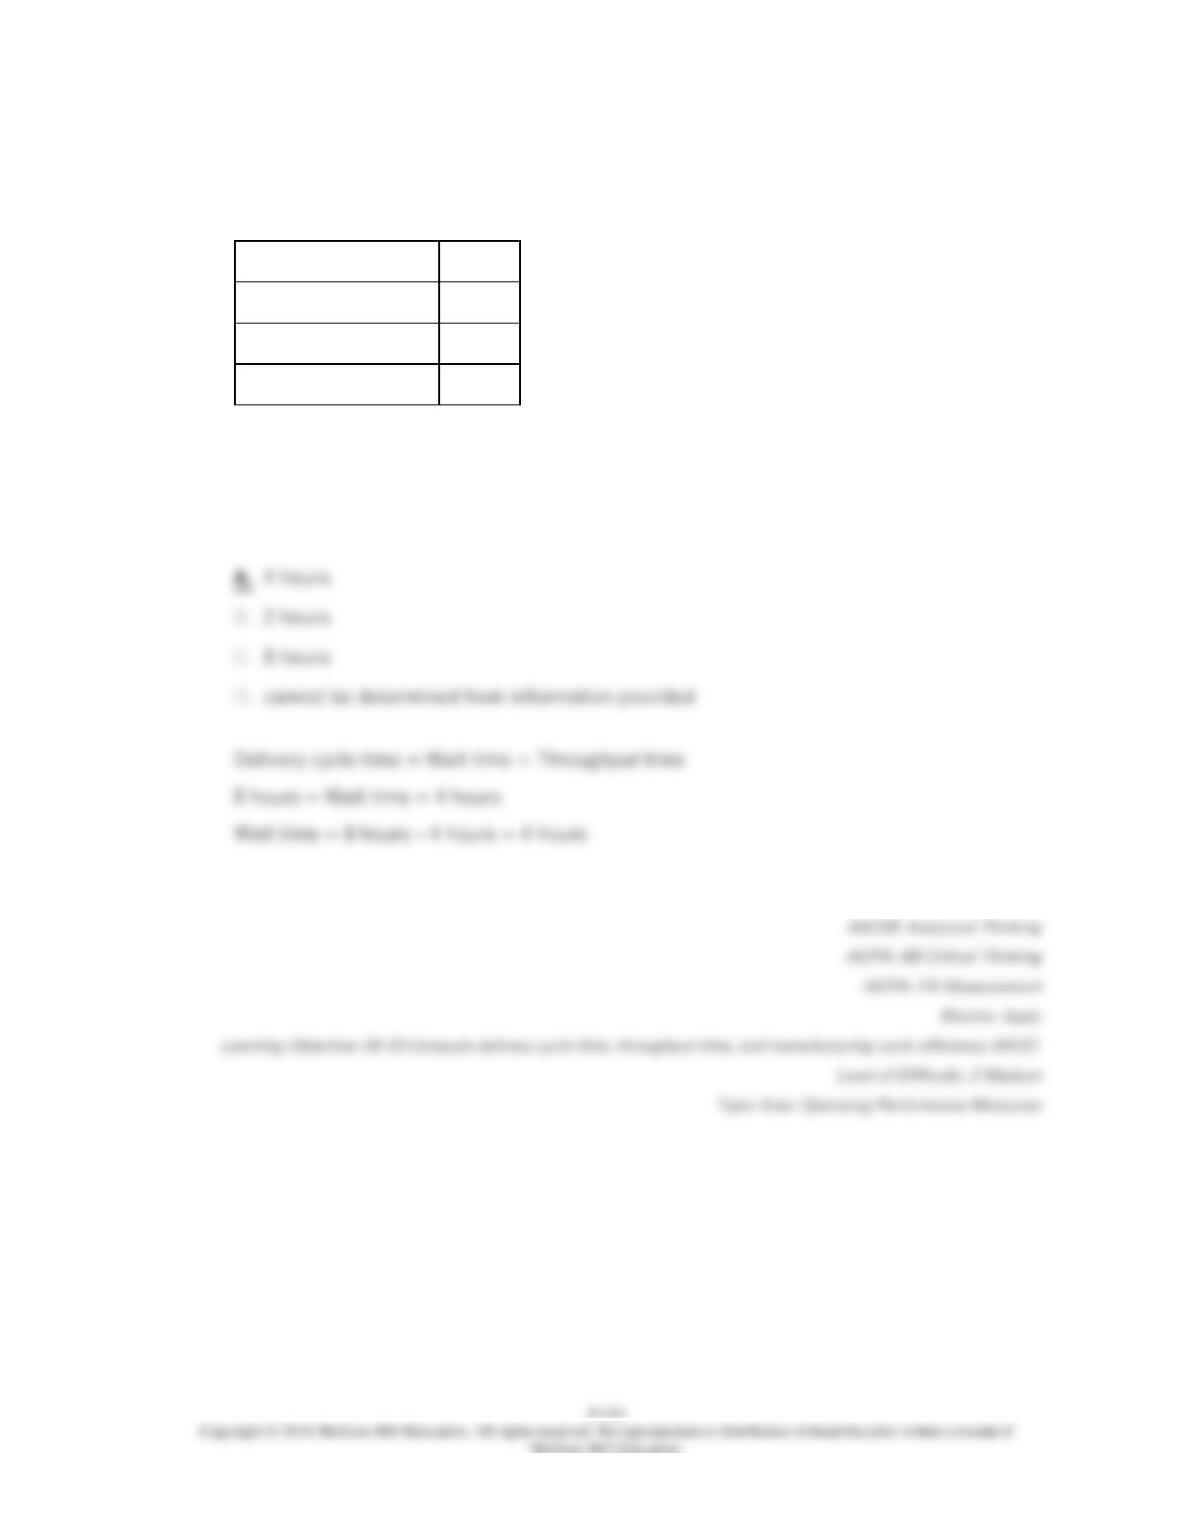
The wait time for this operation would be:
98.
The following data pertain to operations at Quick Incorporated:
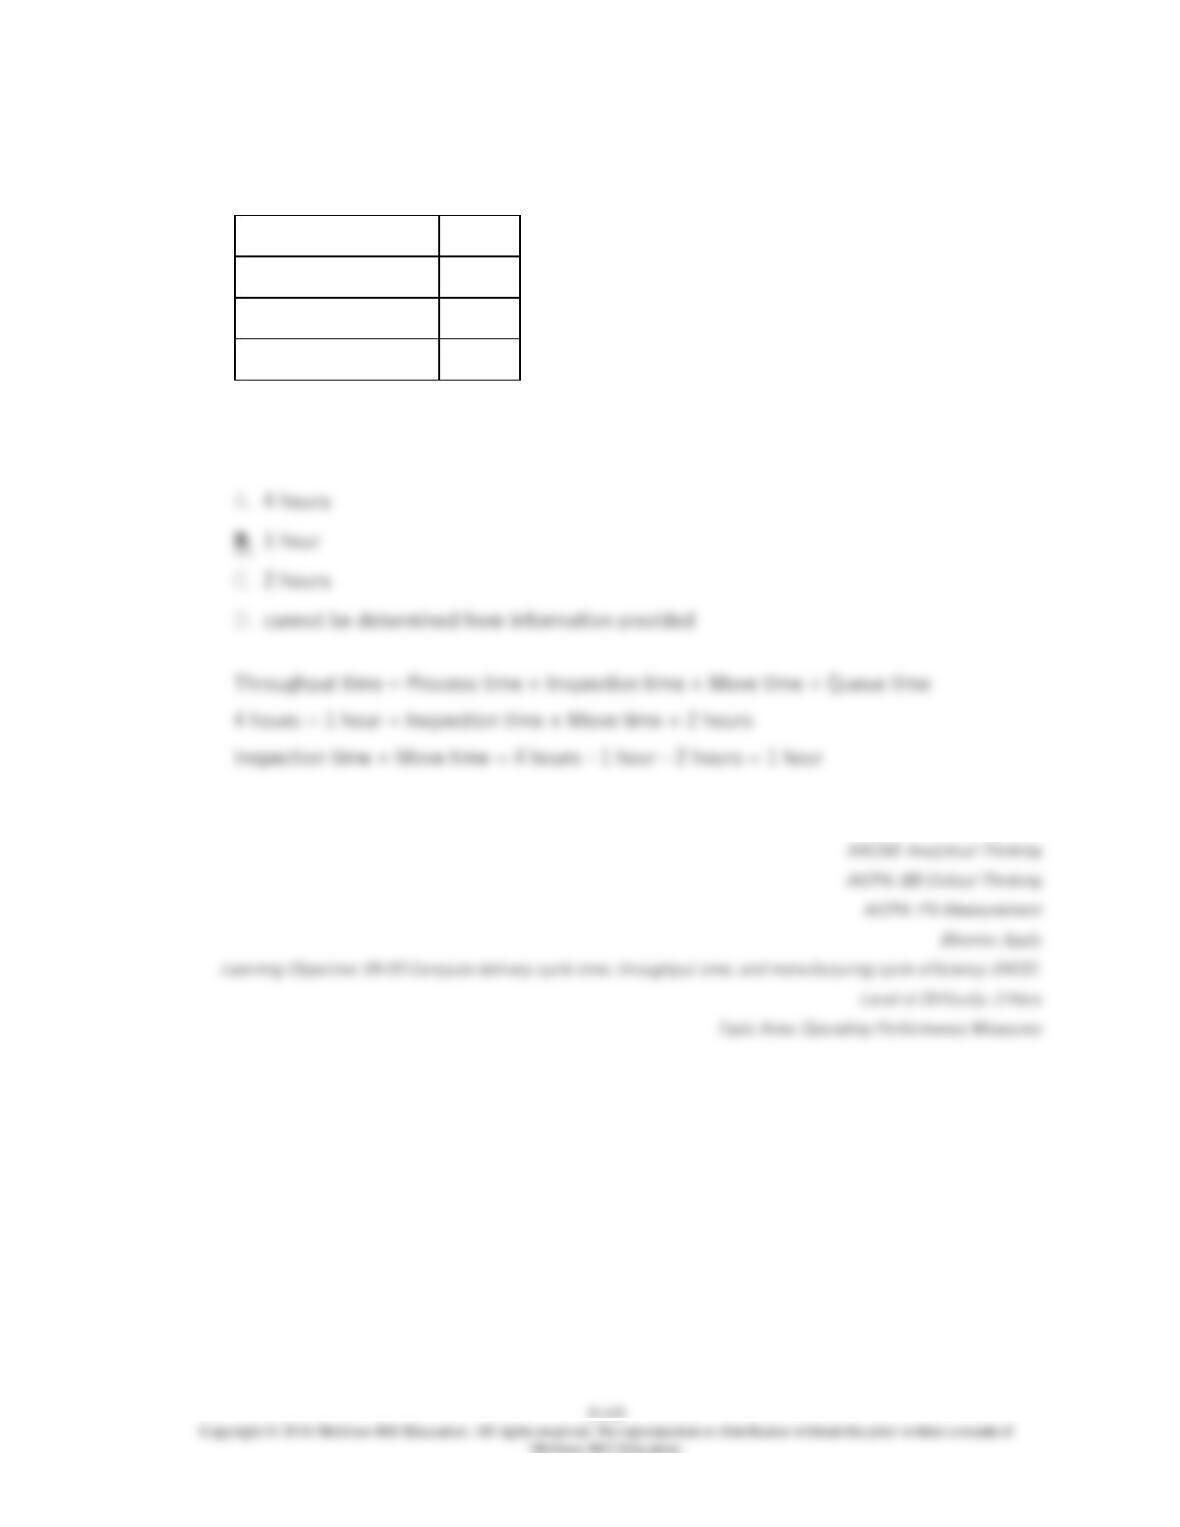
Throughput time
4 hours
Delivery cycle time
8 hours
Process time
1 hour
Queue time
2 hours
The combined inspection and move time for this operation would be: