8-741
218.
Smithj Kennel uses tenant-days as its measure of activity; an animal housed in the kennel
for one day is counted as one tenant-day. During February, the kennel budgeted for 3,500
tenant-days, but its actual level of activity was 3,490 tenant-days. The kennel has
provided the following data concerning the formulas used in its budgeting and its actual
results for February:
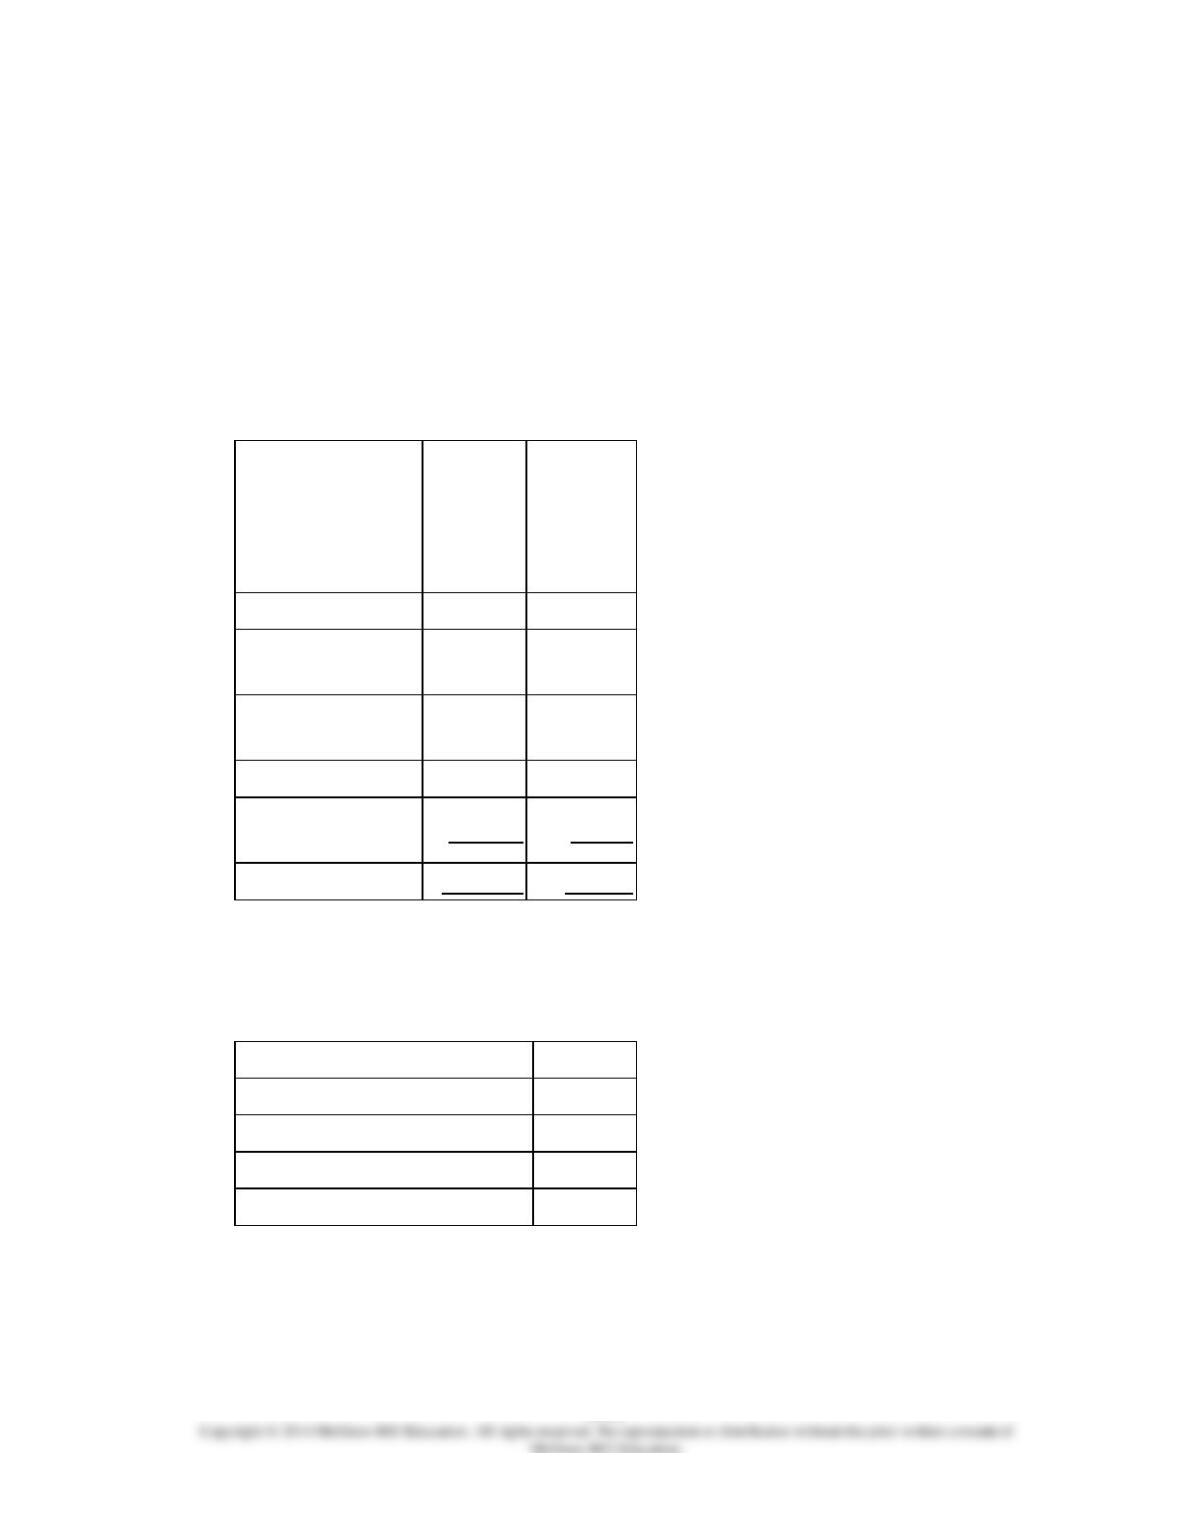
Data used in budgeting:
Fixed
element
per
month
Variable
element
per
tenant-
day
Revenue
−
$27.80
Wages and
salaries
$2,000
$5.10
Food and
supplies
1,100
9.10
Facility expenses
9,200
4.70
Administrative
expenses
7,600
0.40
Total expenses
$19,900
$19.30
Actual results for February:
Revenue
$96,382
Wages and salaries
$19,529
Food and supplies
$33,899
Facility expenses
$25,203
Administrative expenses
$8,956
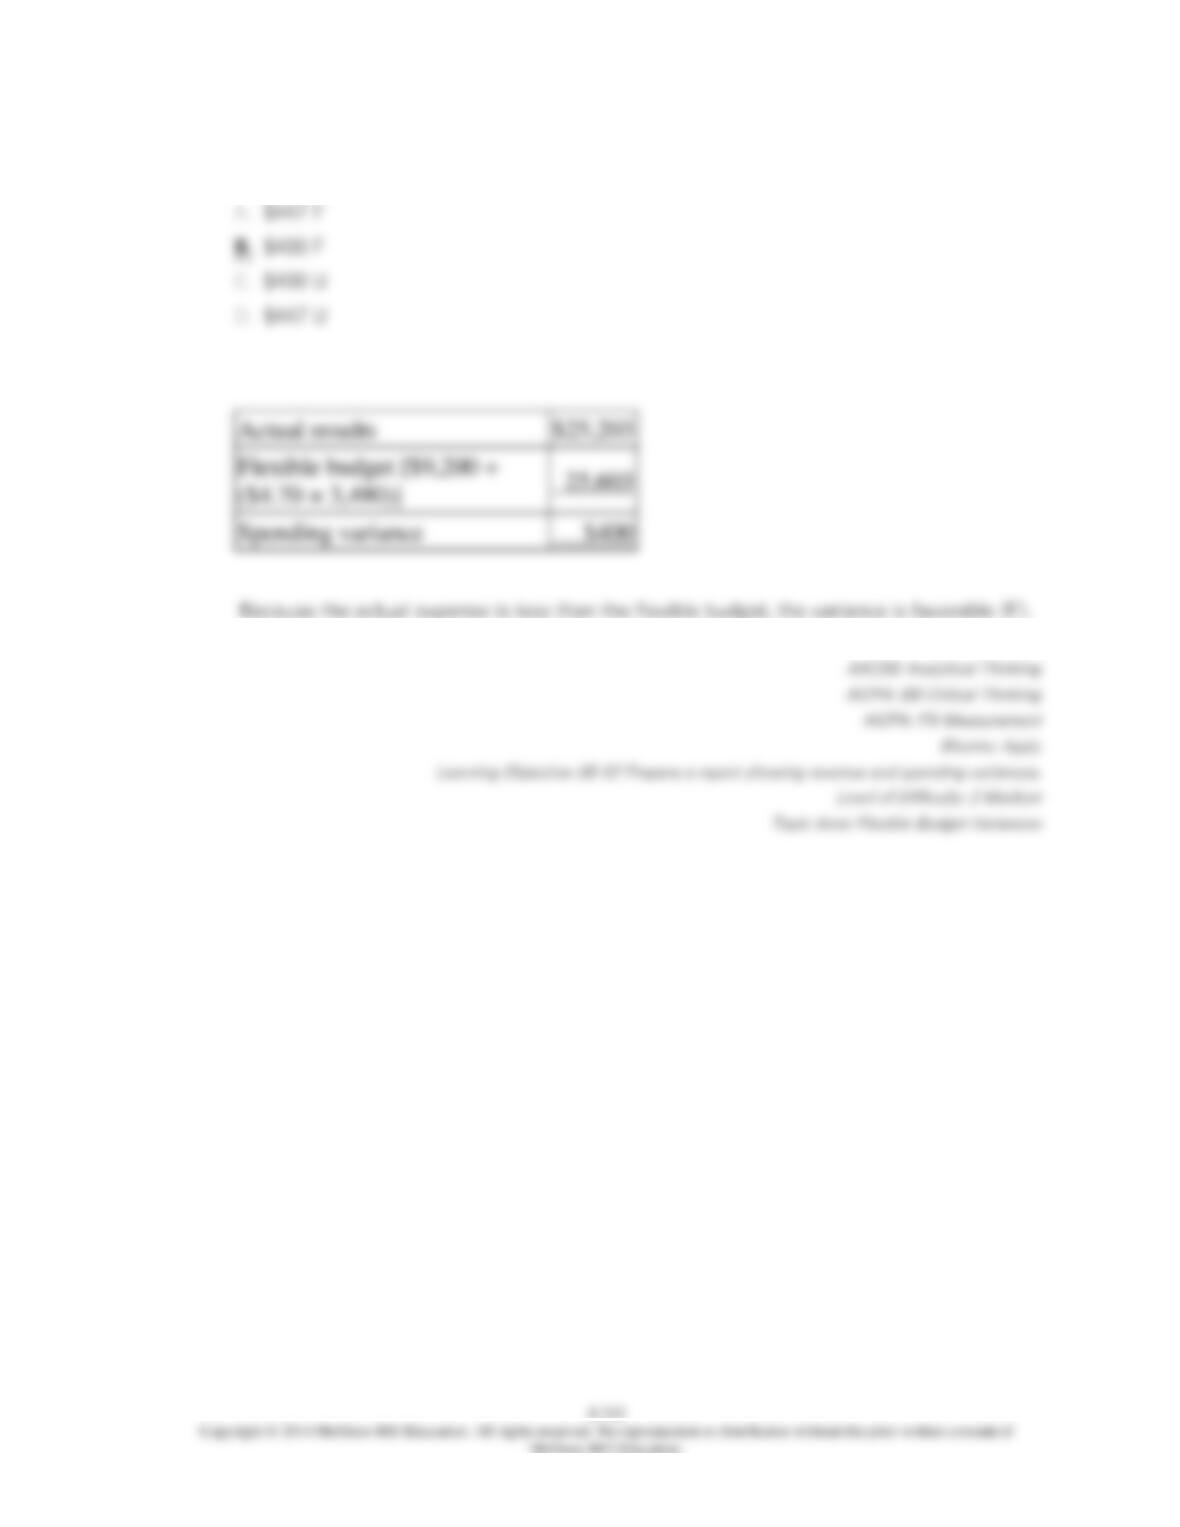
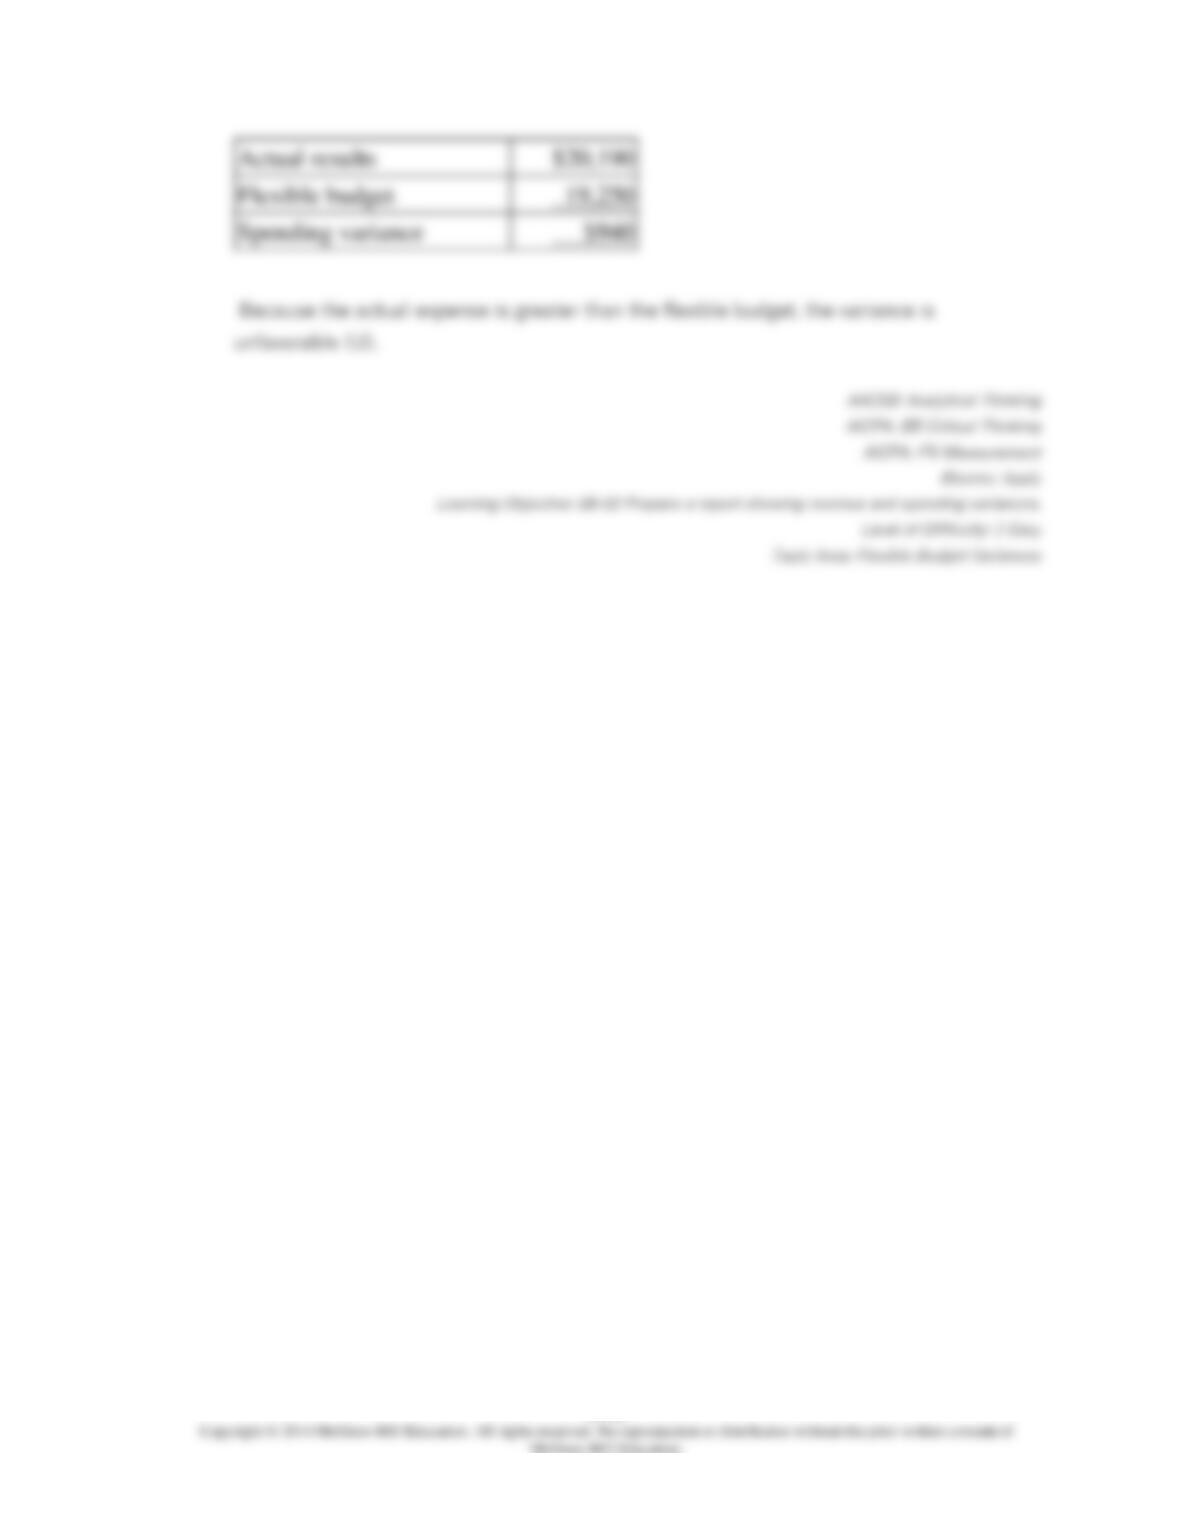
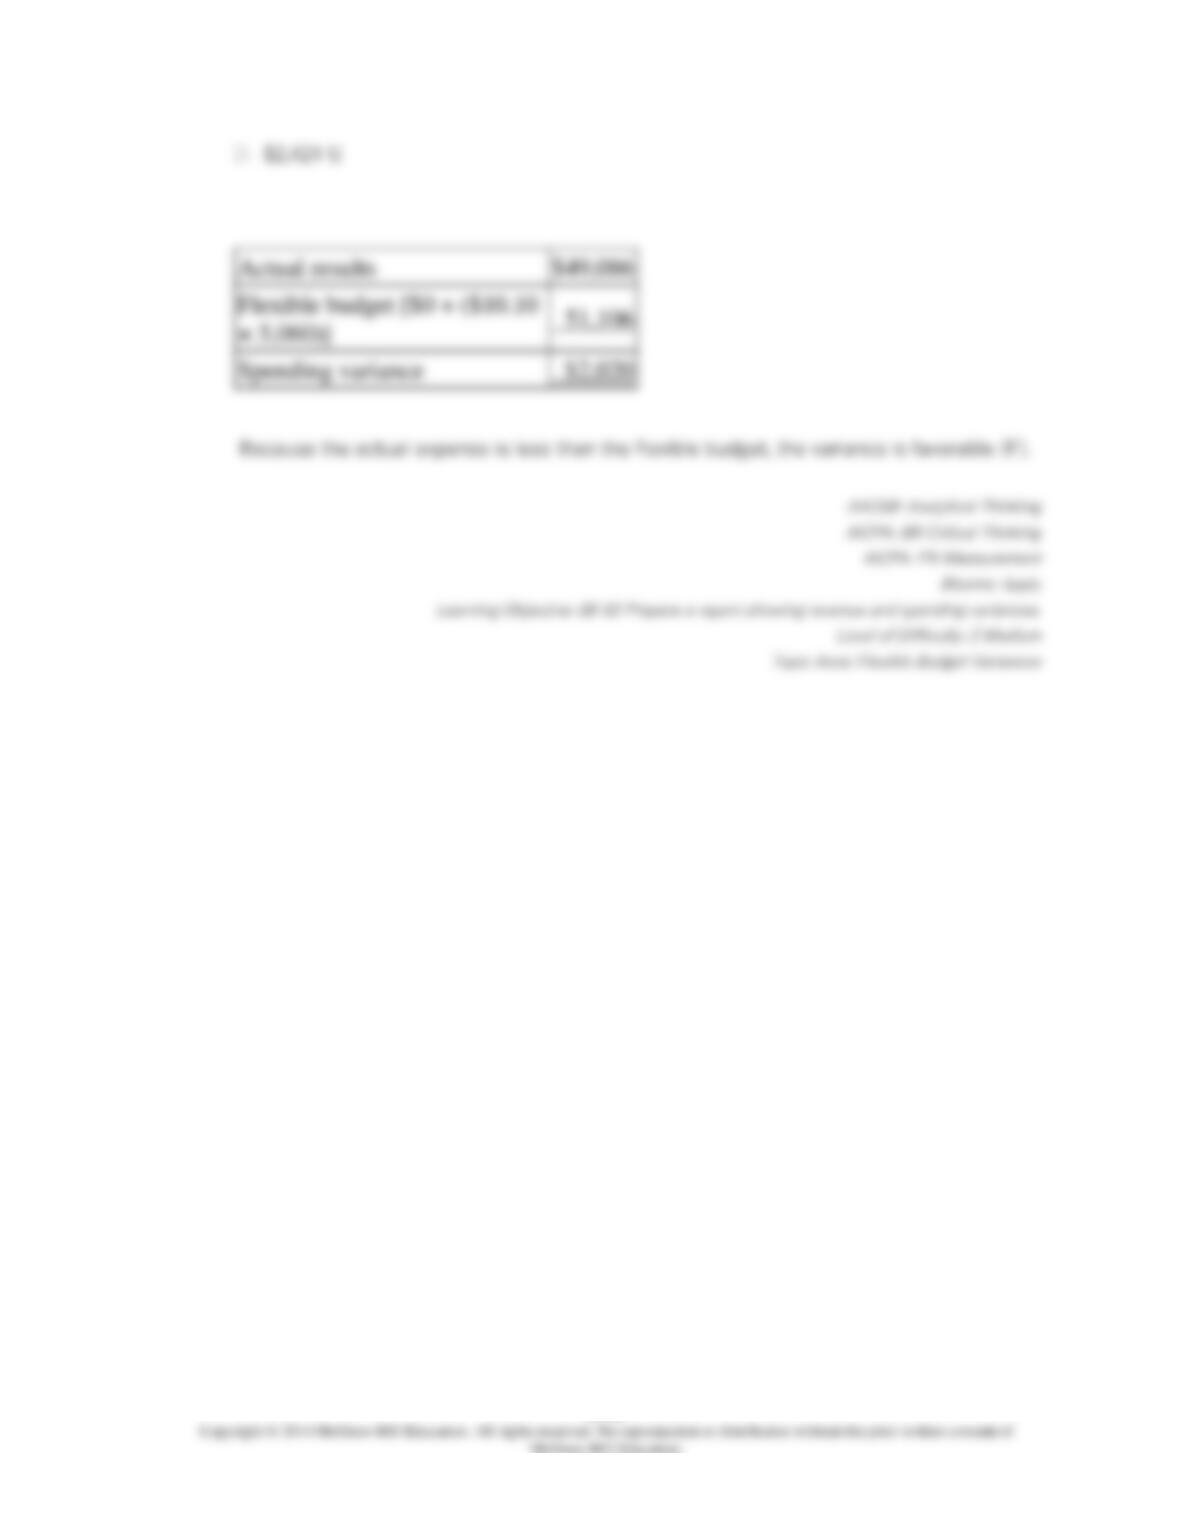
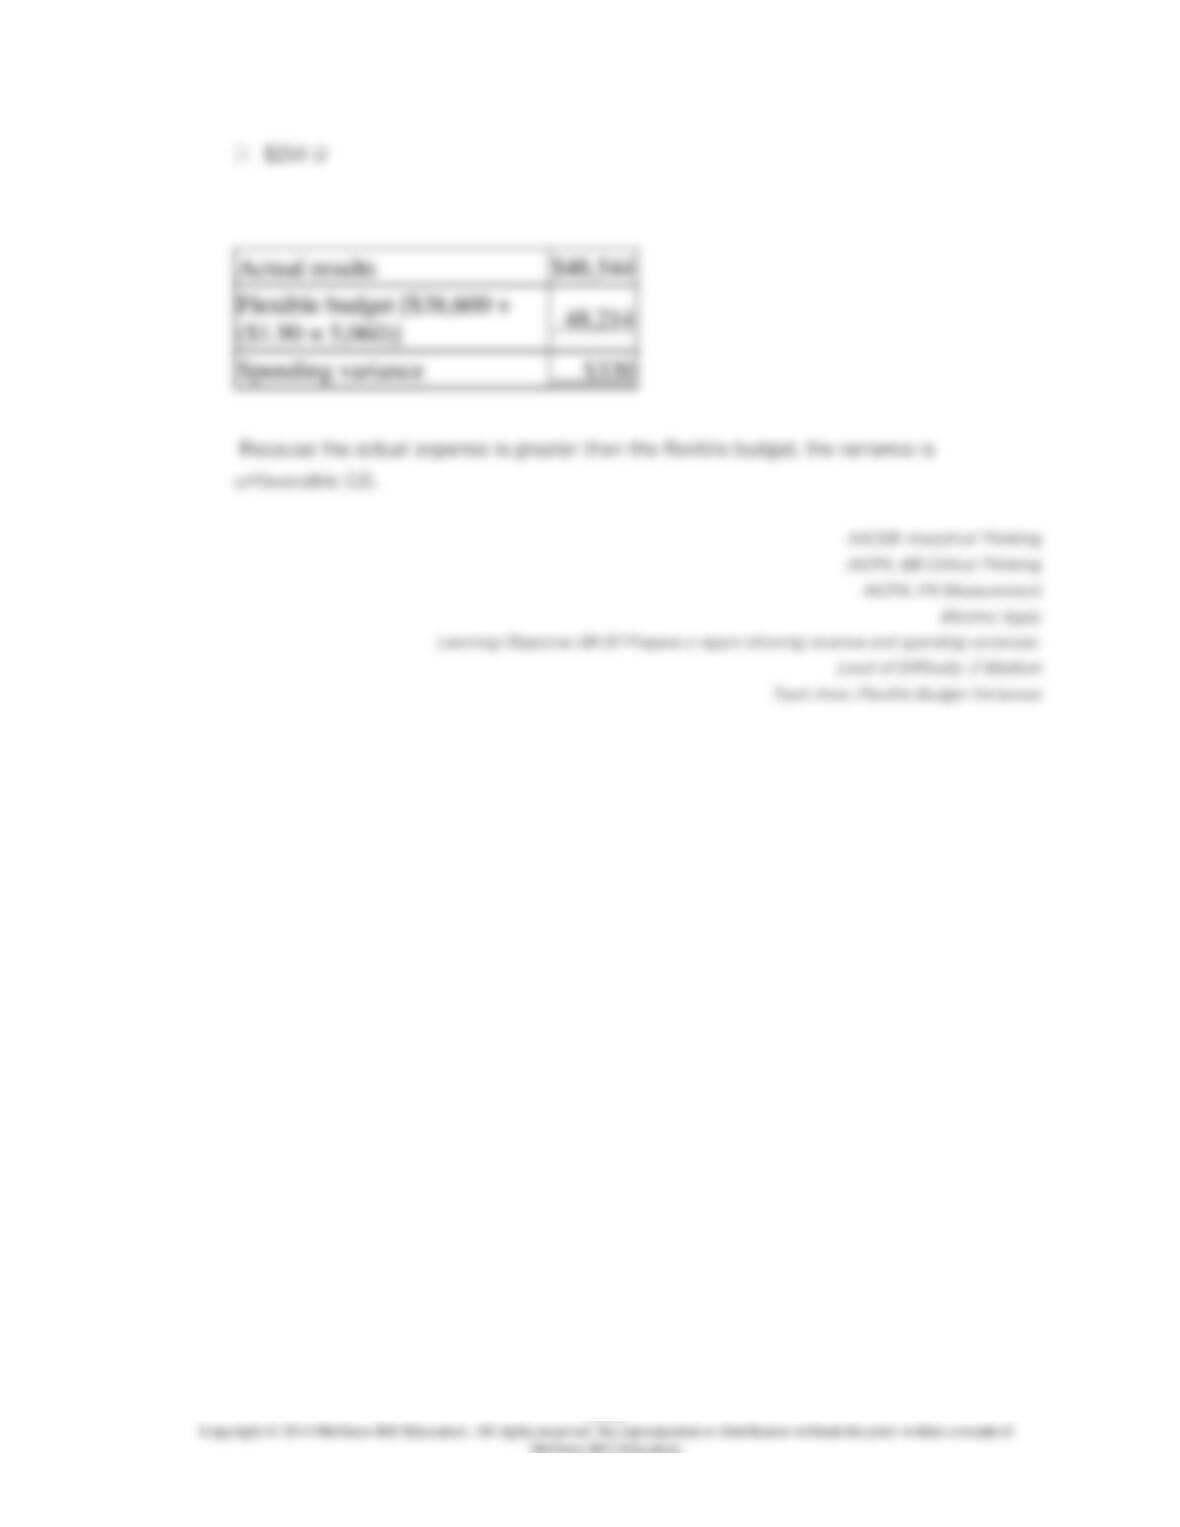
The spending variance for facility expenses in February would be closest to:
8-743
219.
Smithj Kennel uses tenant-days as its measure of activity; an animal housed in the kennel
for one day is counted as one tenant-day. During February, the kennel budgeted for 3,500
tenant-days, but its actual level of activity was 3,490 tenant-days. The kennel has
provided the following data concerning the formulas used in its budgeting and its actual
results for February:
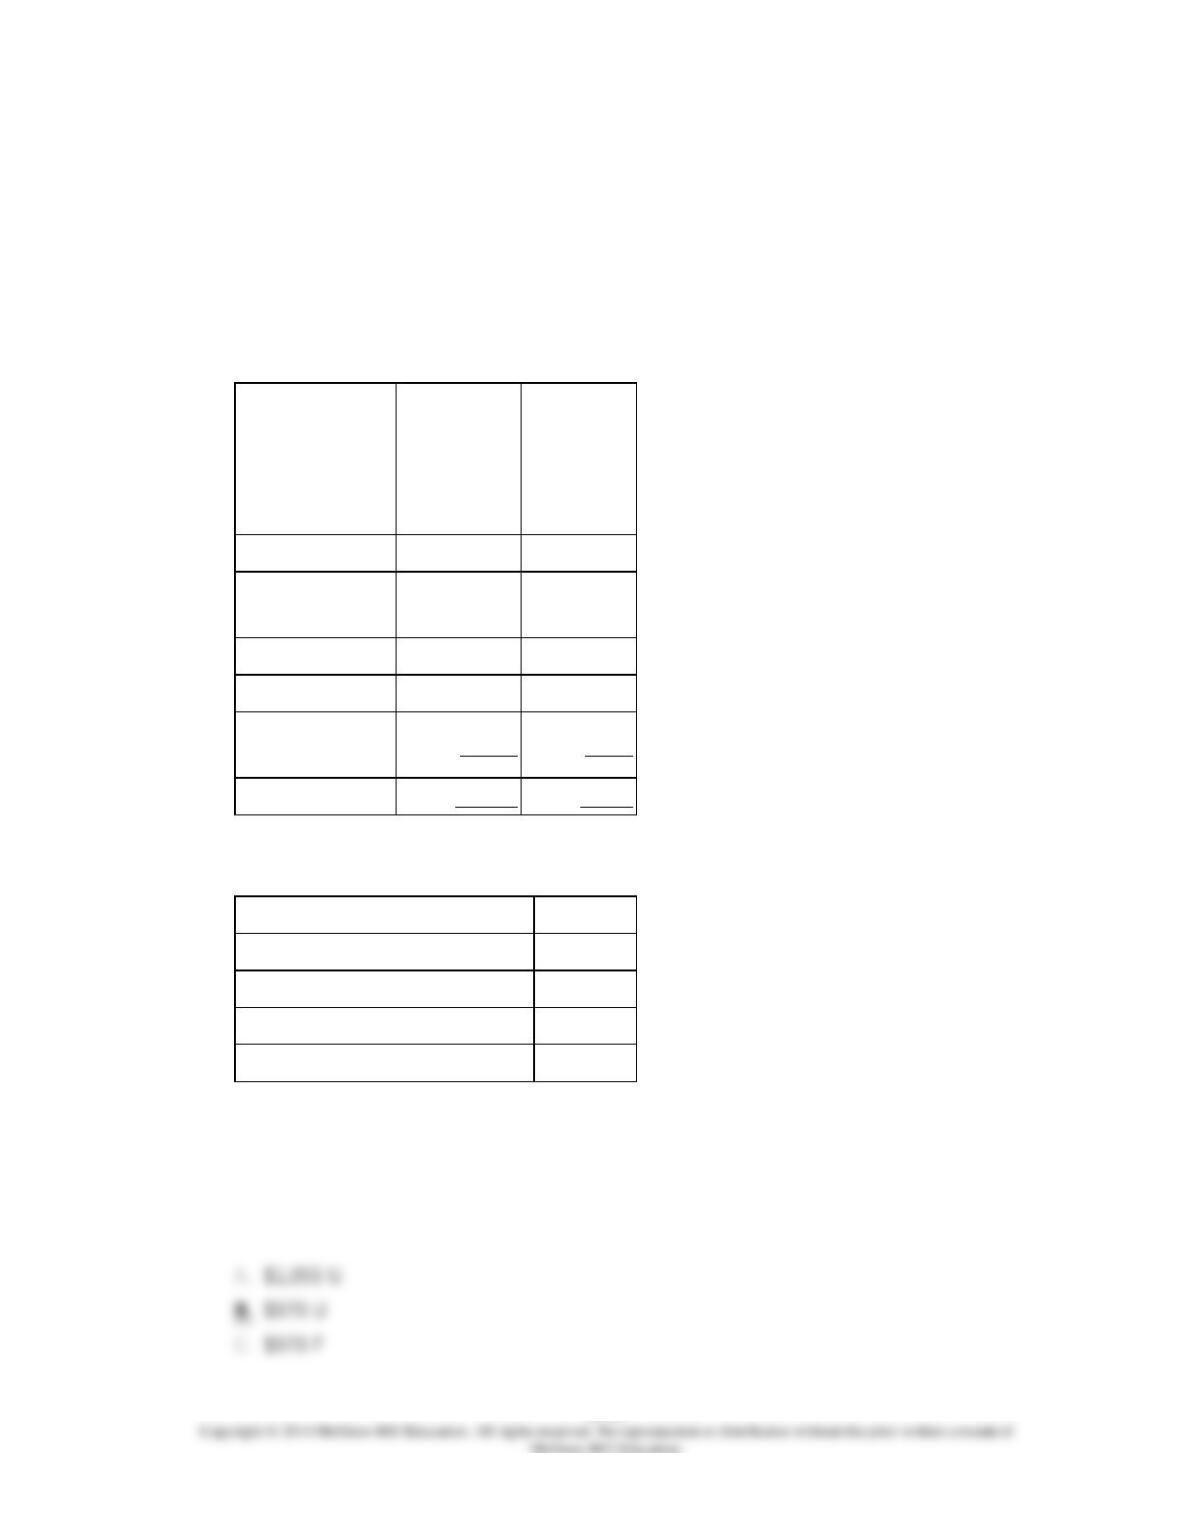
Data used in budgeting:
Fixed
element
per month
Variable
element
per
tenant-
day
Revenue
–
$27.80
Wages and
salaries
$2,000
$5.10
Food and supplies
1,100
9.10
Facility expenses
9,200
4.70
Administrative
expenses
7,600
0.40
Total expenses
$19,900
$19.30
Actual results for February:
Revenue
$96,382
Wages and salaries
$19,529
Food and supplies
$33,899
Facility expenses
$25,203
Administrative expenses
$8,956
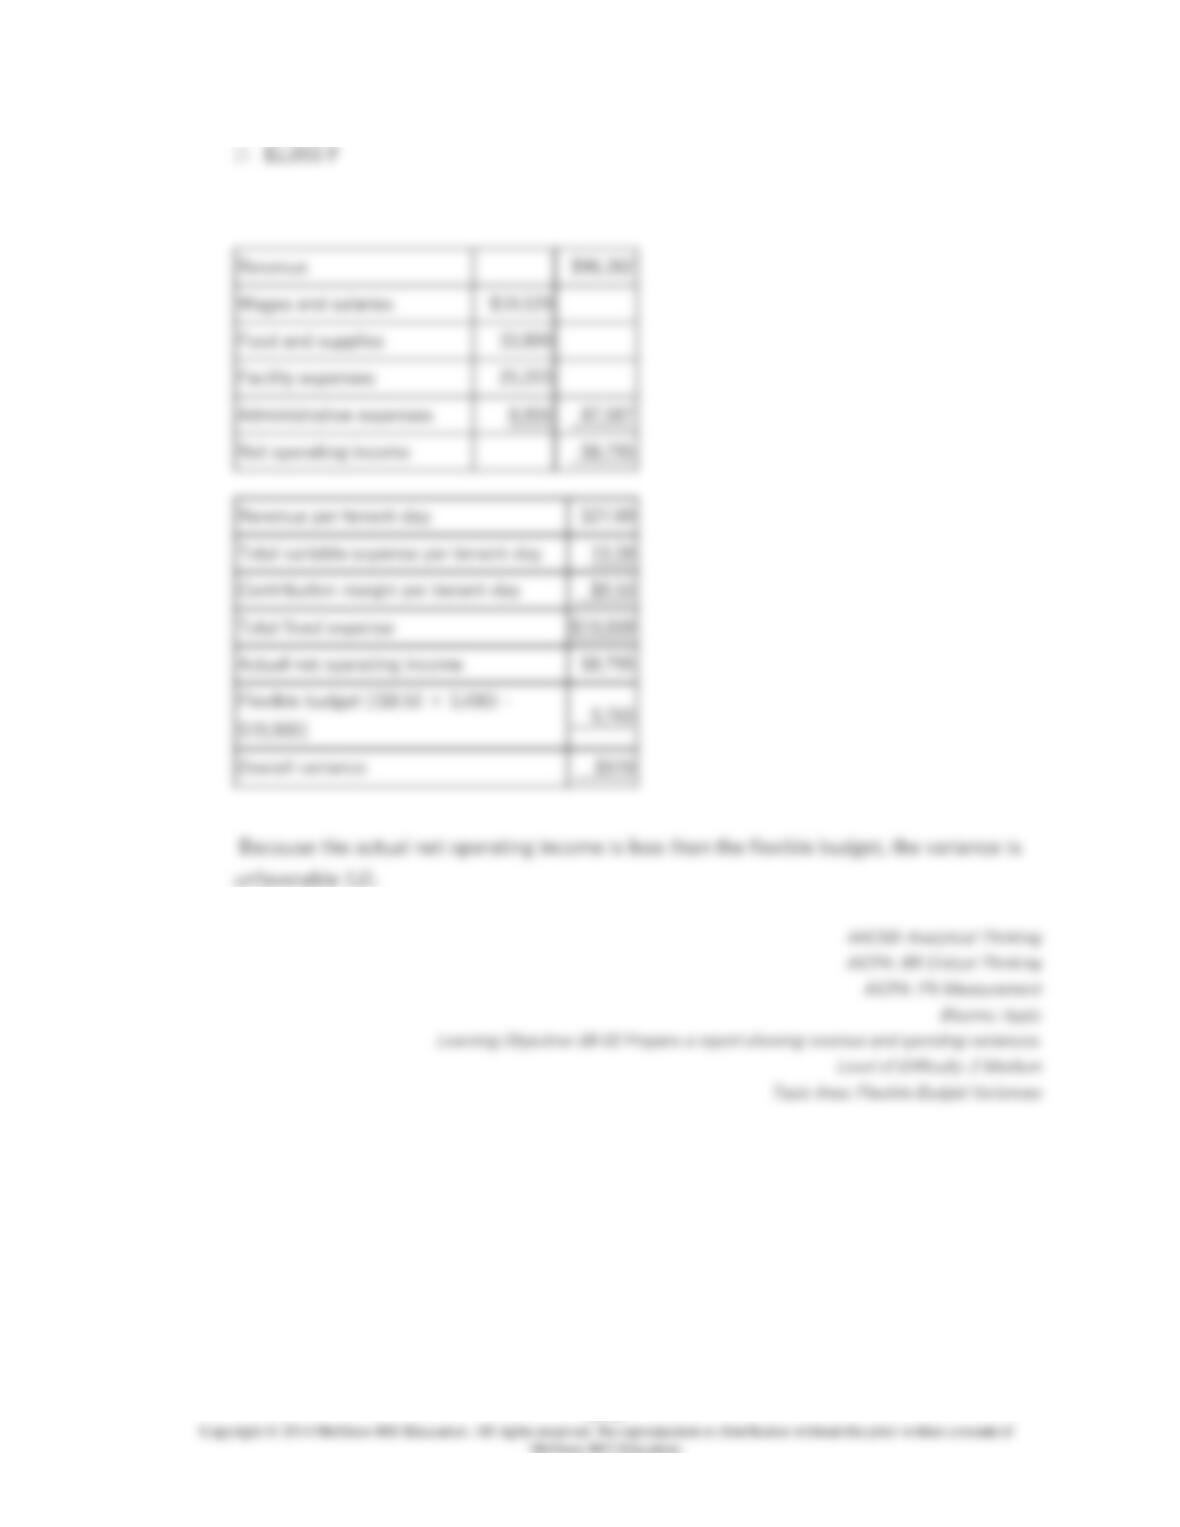
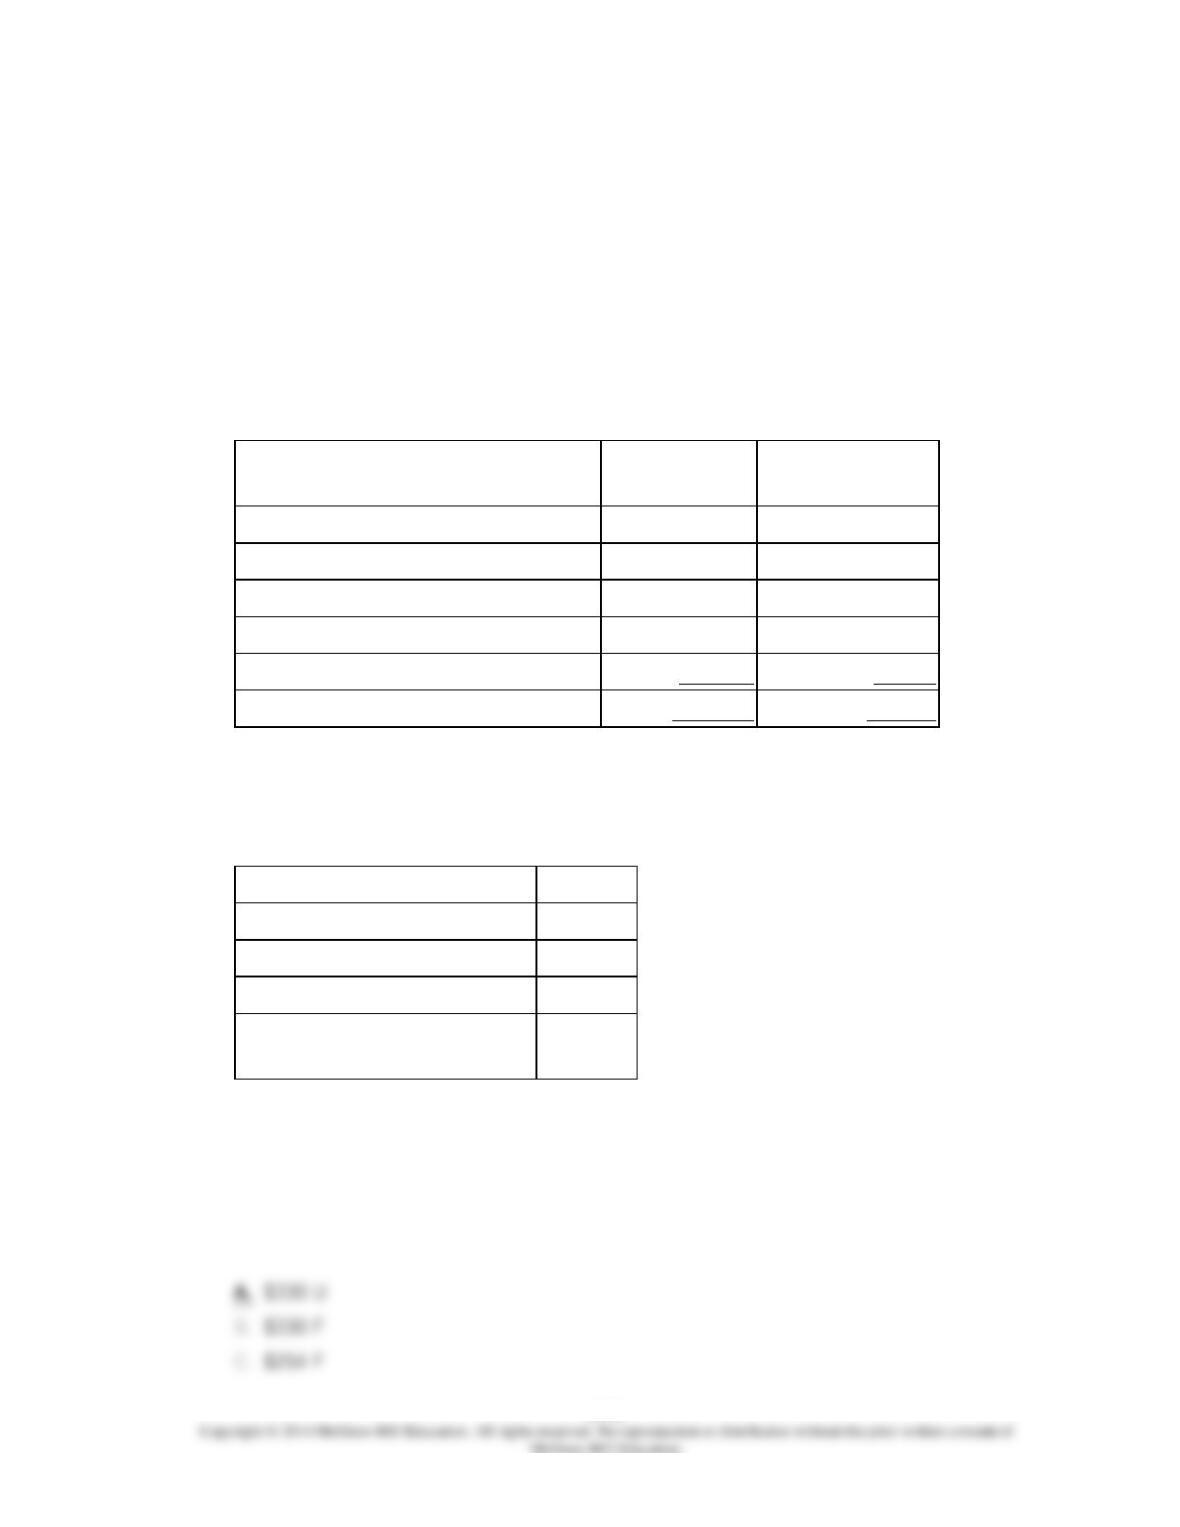
The overall revenue and spending variance (i.e., the variance for net operating income in
the revenue and spending variance column on the revenue and spending variances report)
for February would be closest to:
8-744
8-745
220.
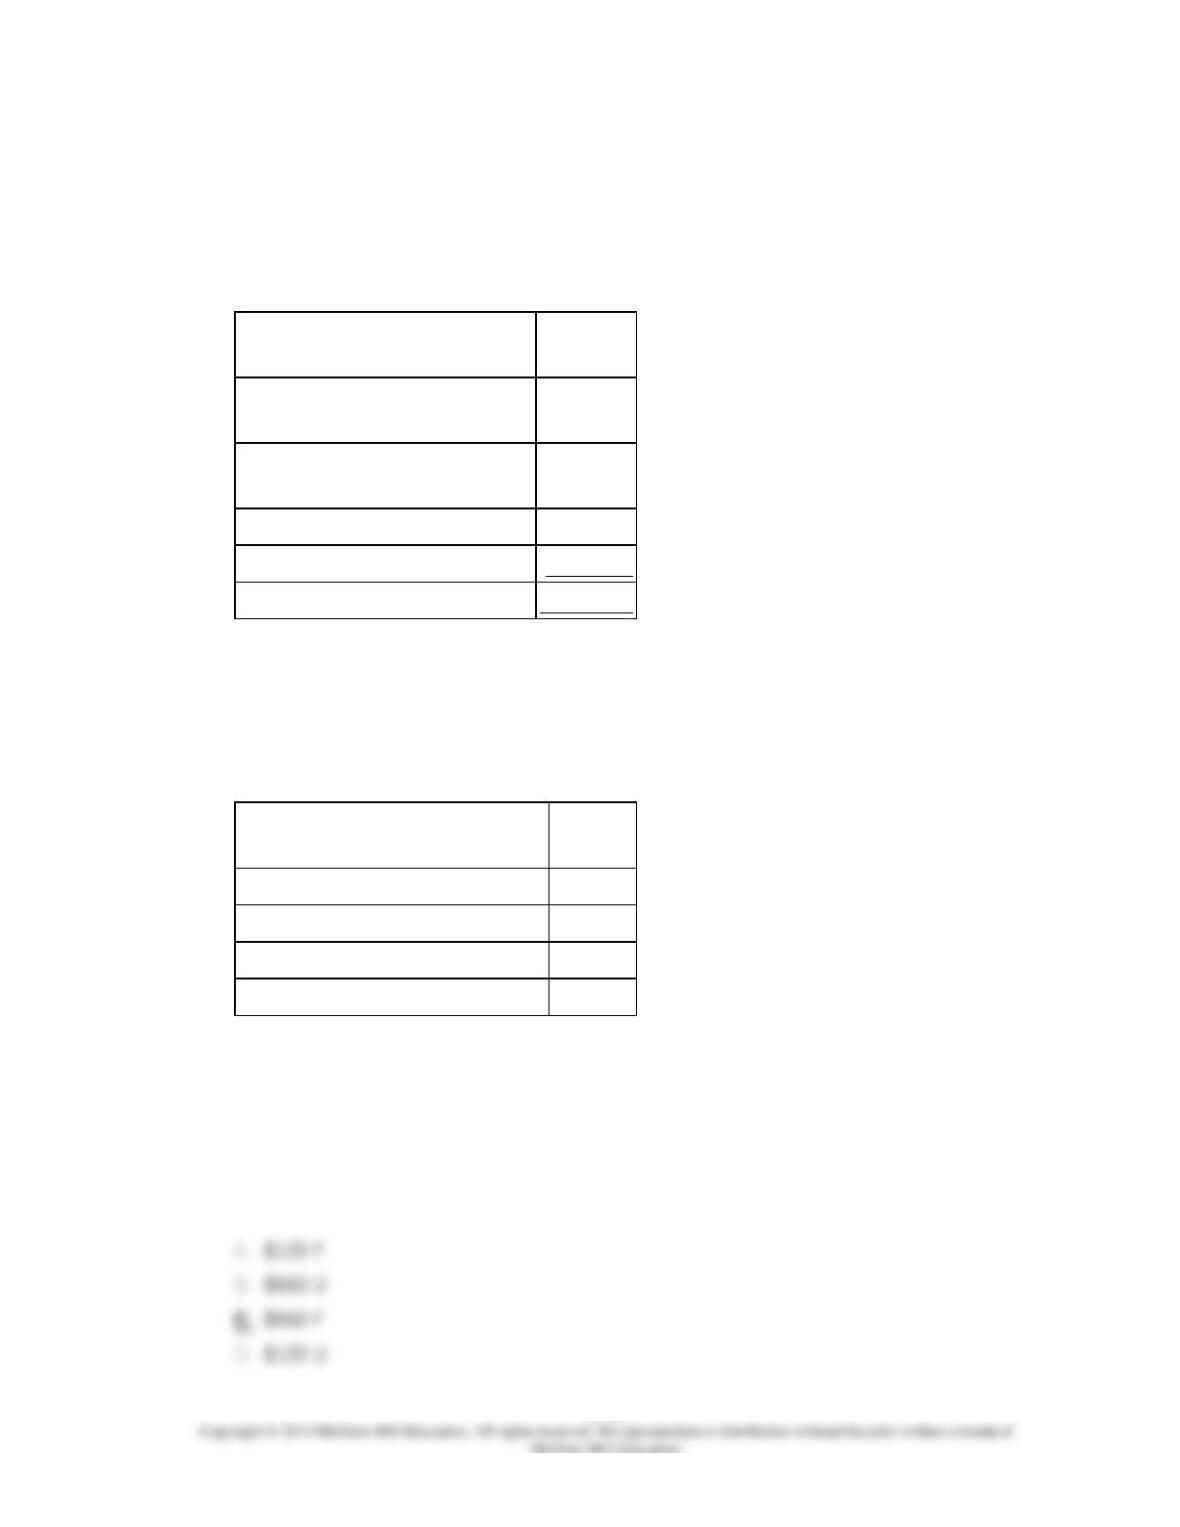
Privett Hospital bases its budgets on patient-visits. The hospital’s static planning budget
for November appears below:
Budgeted number of patient-
visits
3,500
Supplies (@ $3.70 per
patient-visit)
$12,950
Laundry (@ $4.90 per
patient-visit)
17,150
Salaries
18,550
Occupancy costs
19,250
Total
$67,900
Actual results for the month were:
Actual number of patient-
visits
3,700
Supplies
$12,830
Laundry
$17,650
Salaries
$19,220
Occupancy costs
$20,190
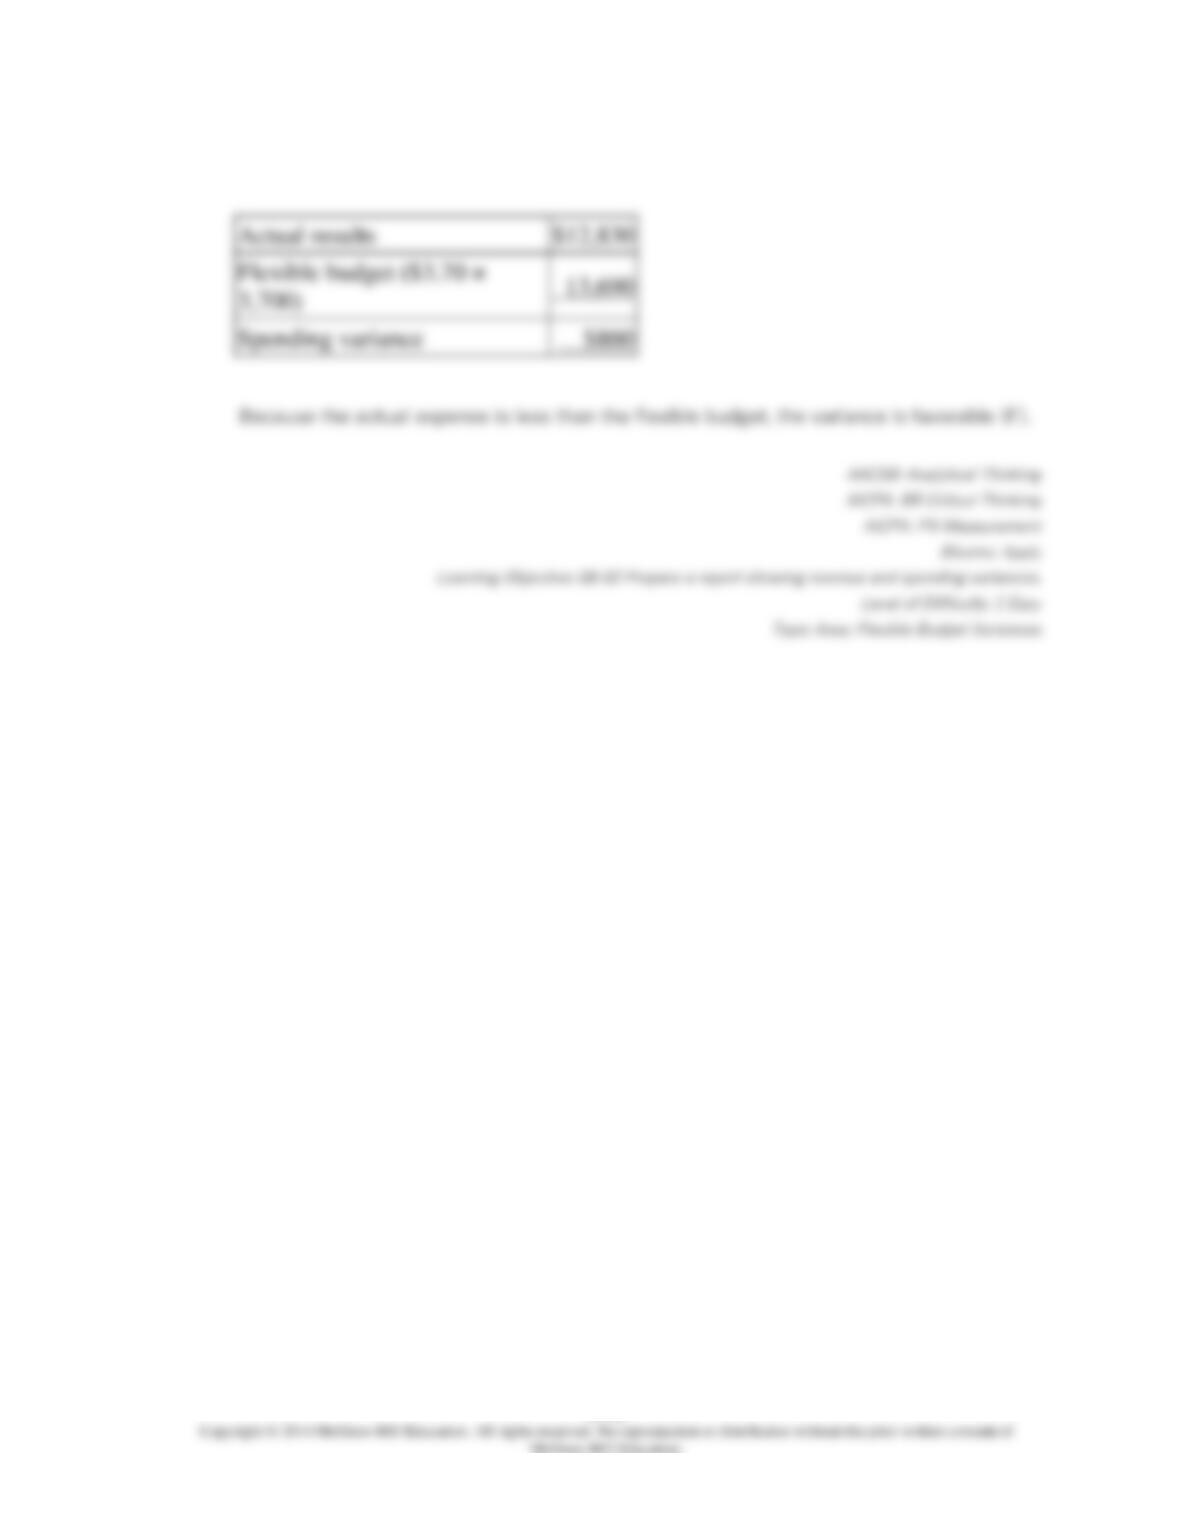
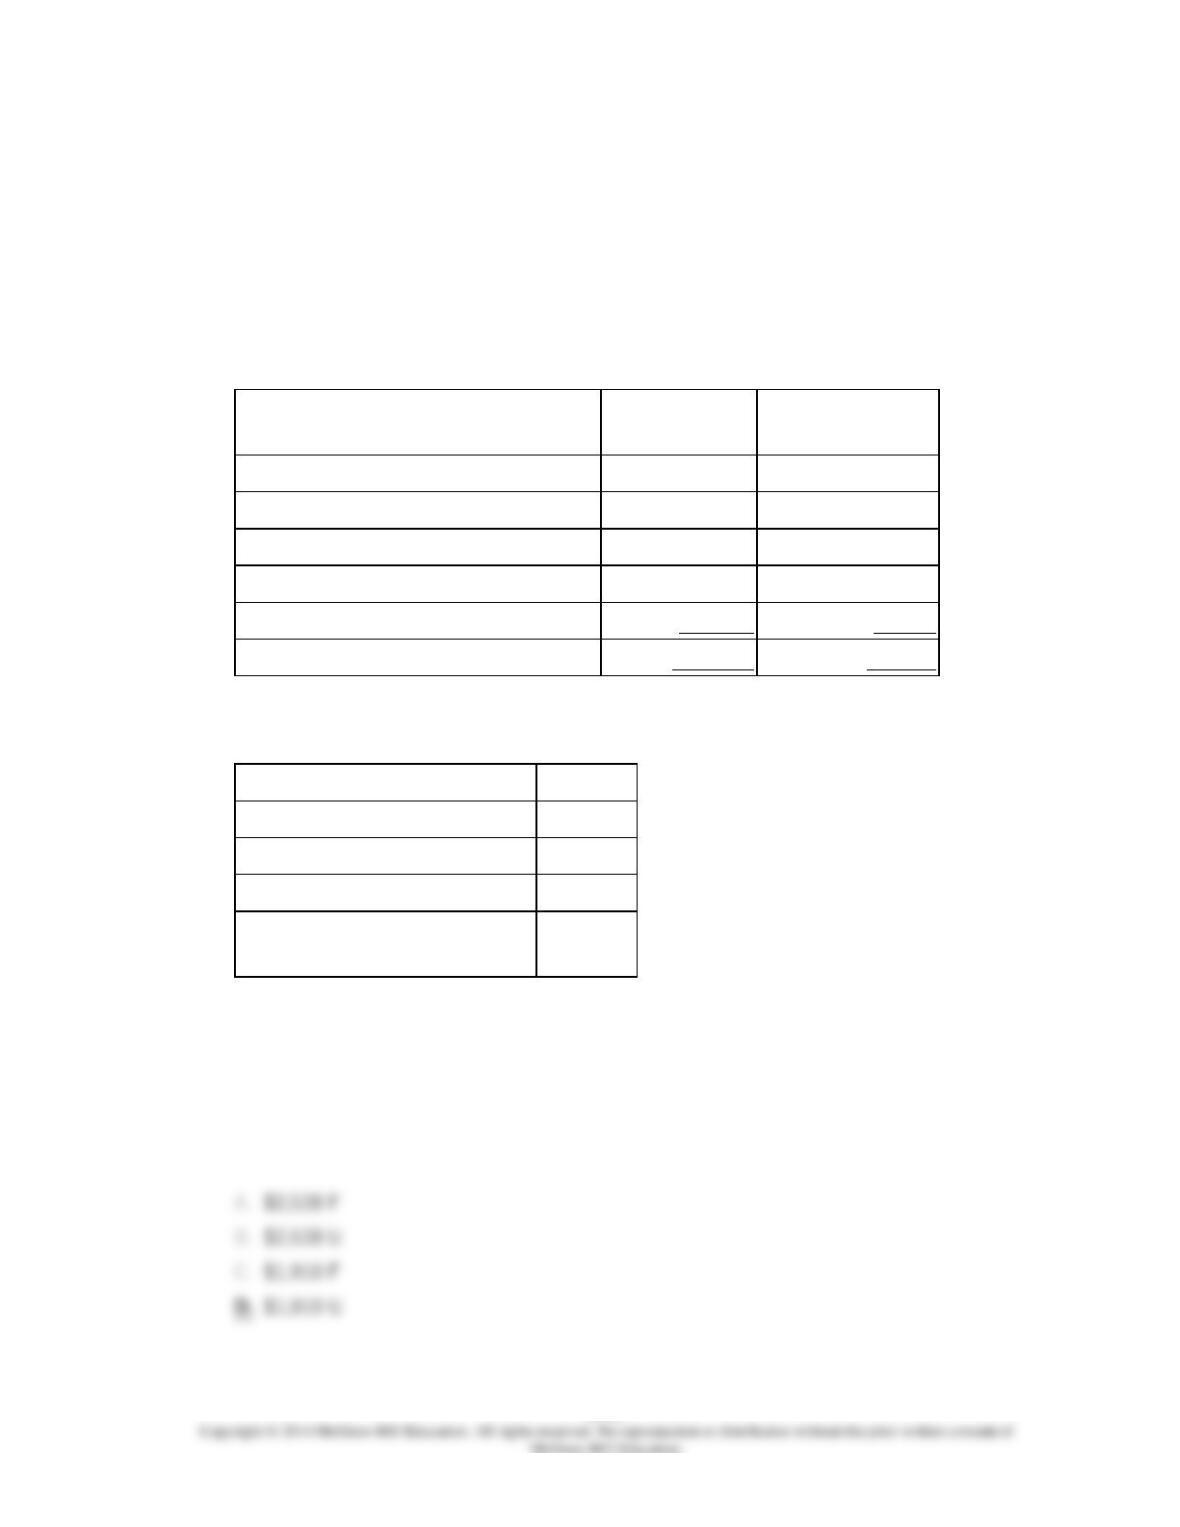
The spending variance for supplies costs in the performance report for the month is:
8-746
8-747
221.
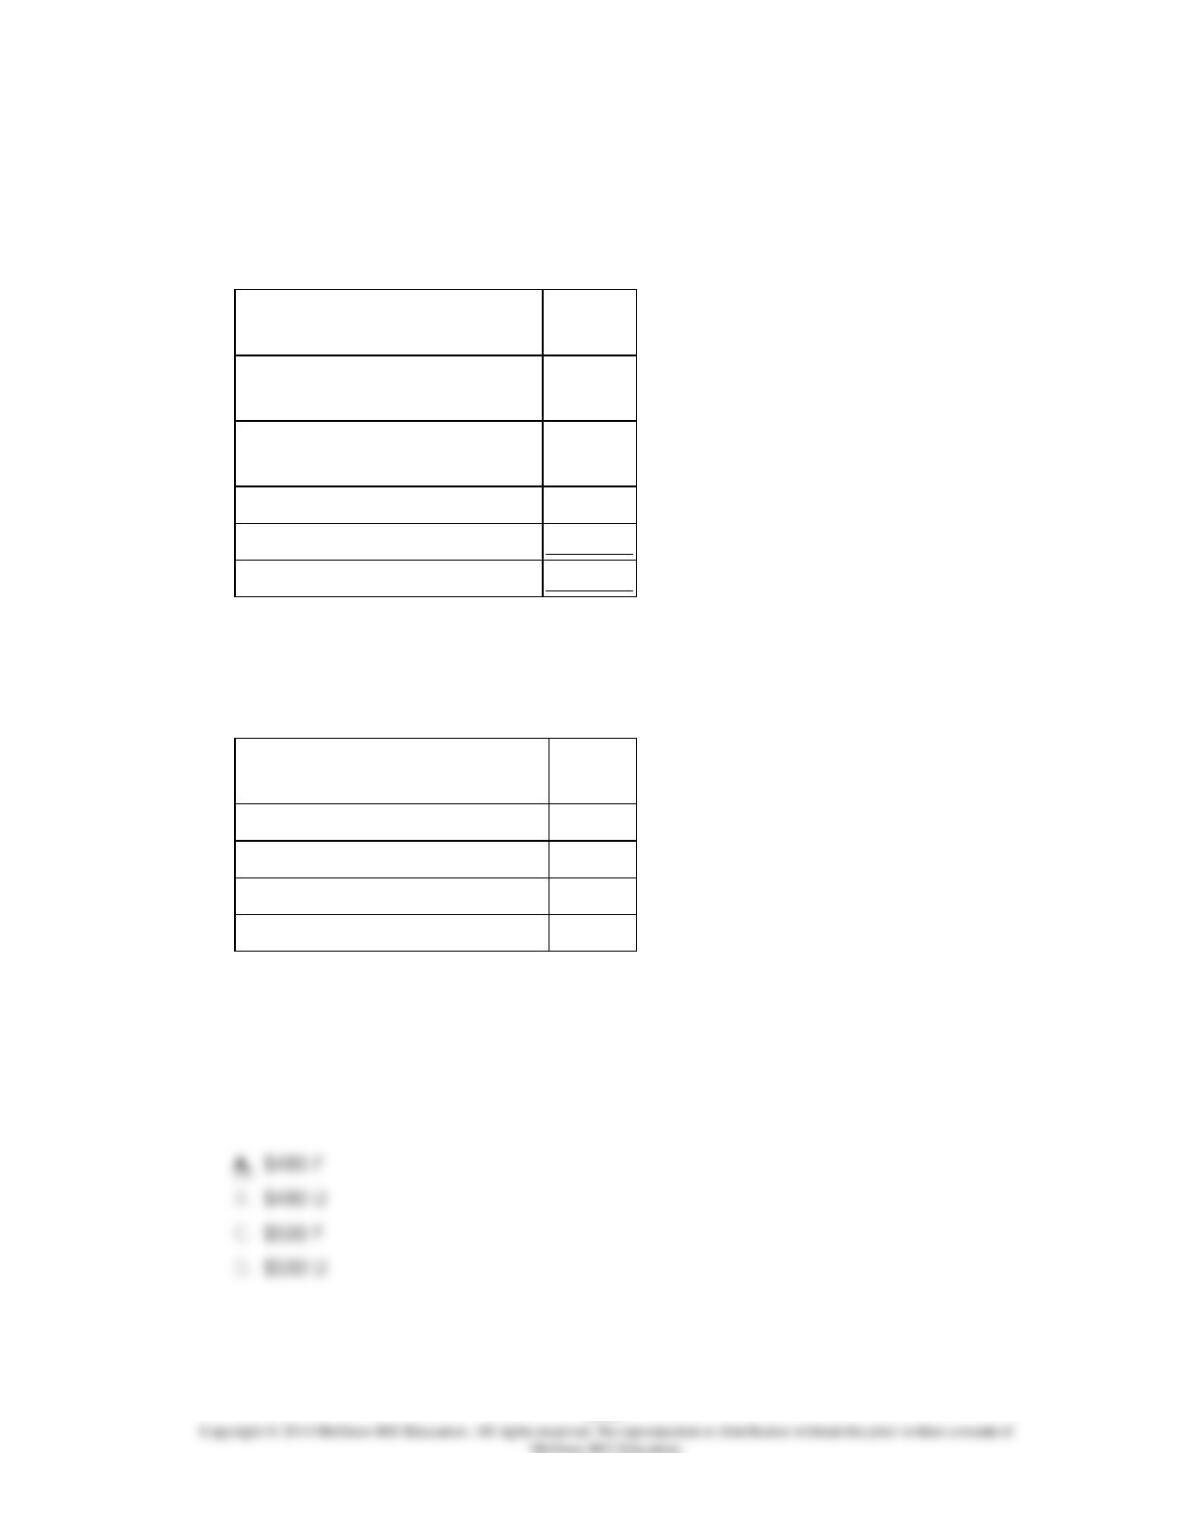
Privett Hospital bases its budgets on patient-visits. The hospital’s static planning budget
for November appears below:
Budgeted number of patient-
visits
3,500
Supplies (@ $3.70 per
patient-visit)
$12,950
Laundry (@ $4.90 per
patient-visit)
17,150
Salaries
18,550
Occupancy costs
19,250
Total
$67,900
Actual results for the month were:
Actual number of patient-
visits
3,700
Supplies
$12,830
Laundry
$17,650
Salaries
$19,220
Occupancy costs
$20,190
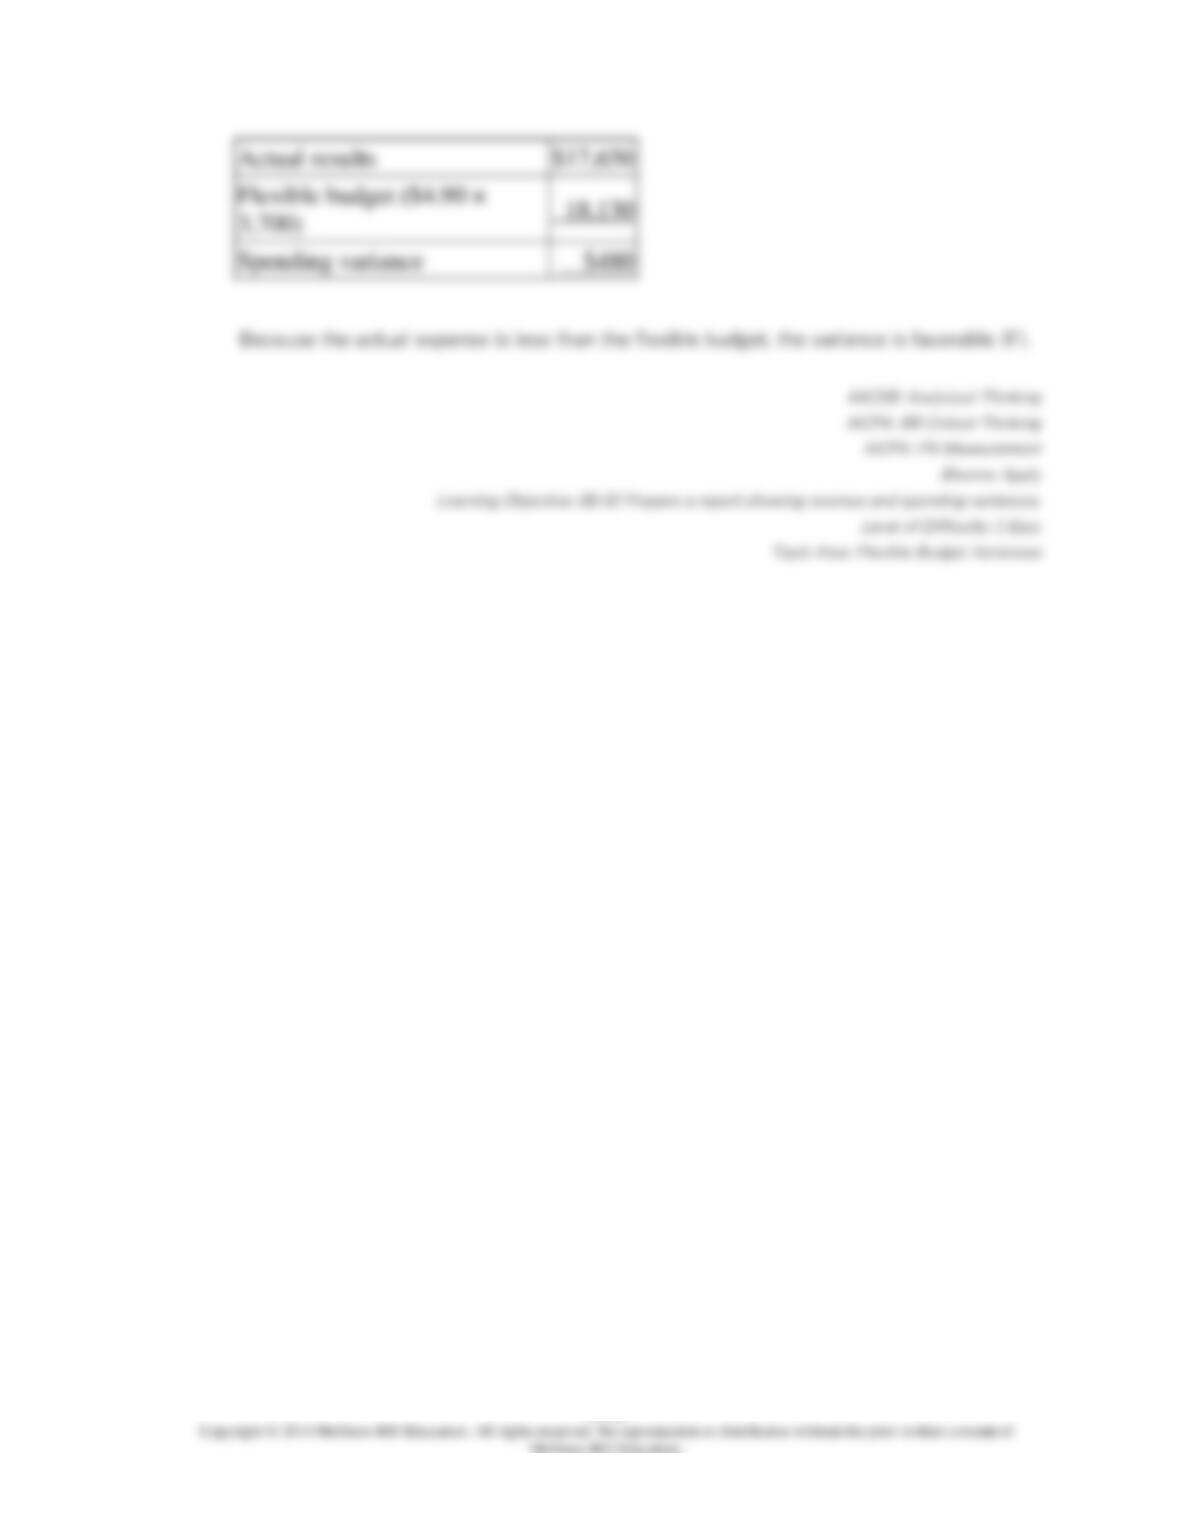
The spending variance for laundry costs in the performance report for the month is:
8-748

8-749
222.
Privett Hospital bases its budgets on patient-visits. The hospital’s static planning budget
for November appears below:
Budgeted number of patient-
visits
3,500
Supplies (@ $3.70 per
patient-visit)
$12,950
Laundry (@ $4.90 per
patient-visit)
17,150
Salaries
18,550
Occupancy costs
19,250
Total
$67,900
Actual results for the month were:
Actual number of patient-
visits
3,700
Supplies
$12,830
Laundry
$17,650
Salaries
$19,220
Occupancy costs
$20,190
The spending variance for occupancy costs in the performance report for the month is:
8-750
8-751
223.
Gilson Corporation manufactures and sells a single product. The company uses units as
the measure of activity in its budgets and performance reports. During April, the company
budgeted for 5,100 units, but its actual level of activity was 5,060 units. The company has
provided the following data concerning the formulas used in its budgeting and its actual
results for April:
Data used in budgeting:
Fixed element
per month
Variable
element per unit
Revenue
−
$35.90
Direct labor
$0
$7.80
Direct materials
0
10.10
Manufacturing overhead
38,600
1.90
Selling and administrative expenses
21,000
0.40
Total expenses
$59,600
$20.20
Actual results for April:
Revenue
$179,164
Direct labor
$41,248
Direct materials
$49,086
Manufacturing overhead
$48,544
Selling and administrative
expenses
$22,354
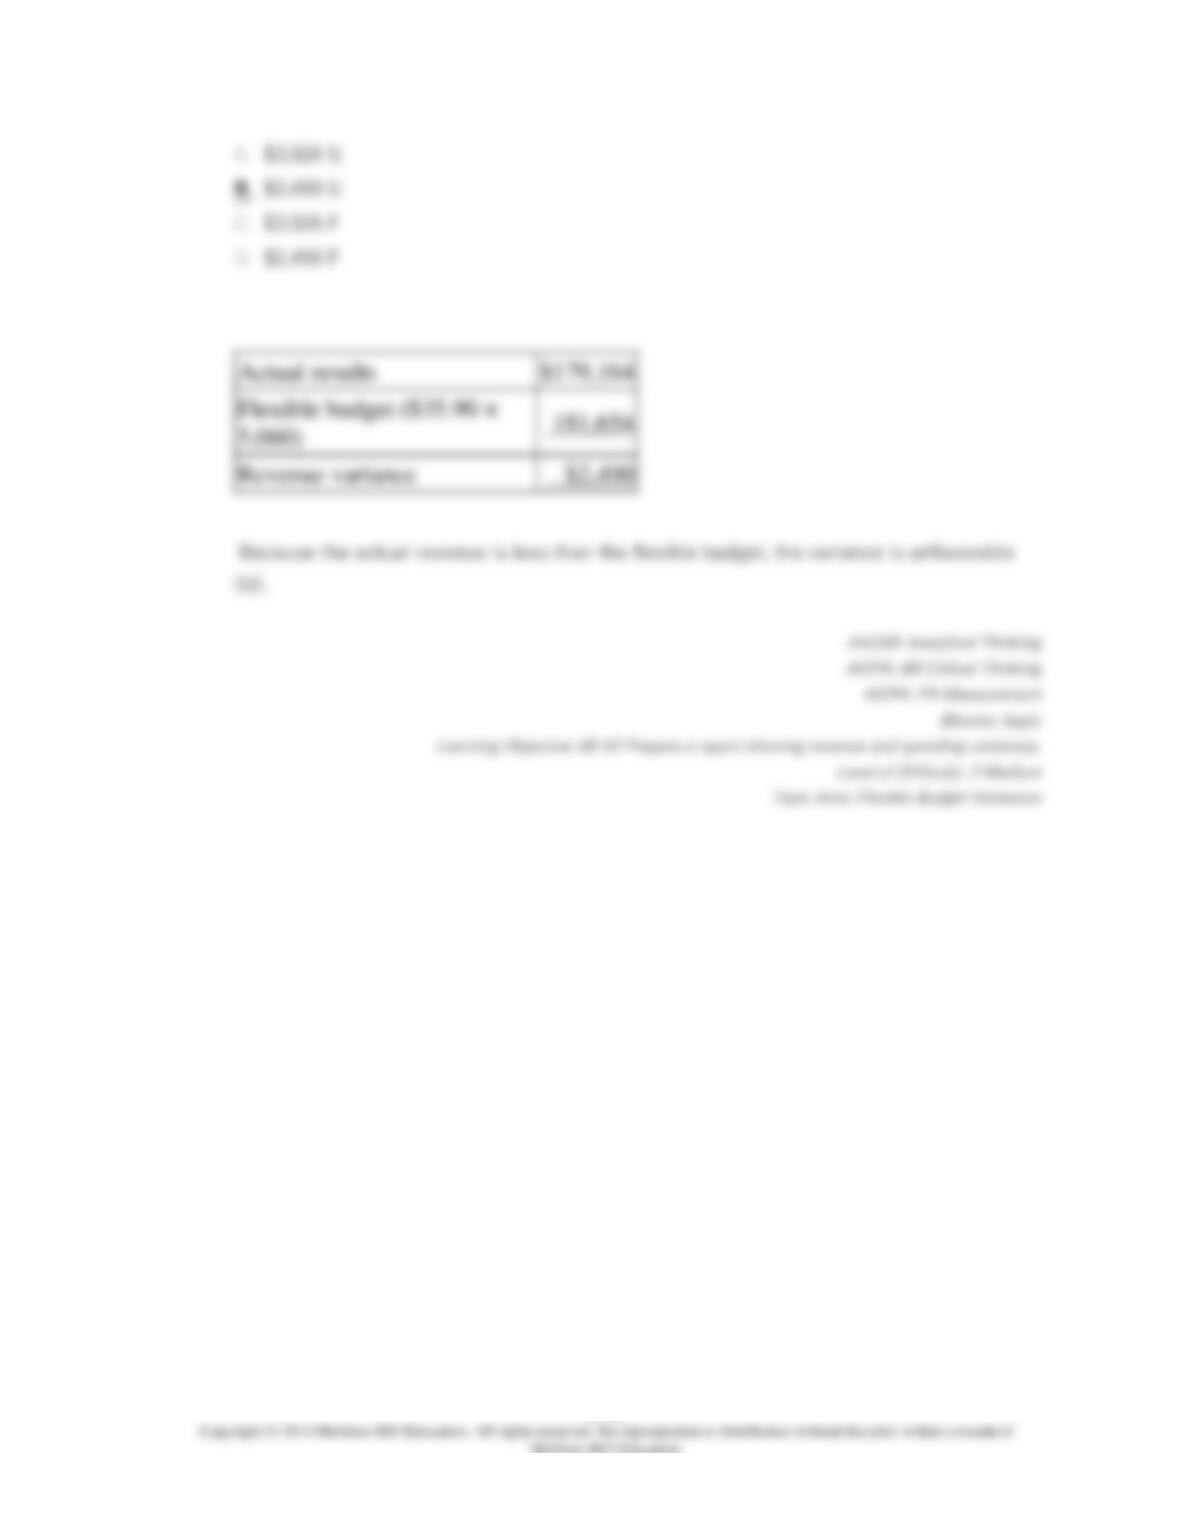
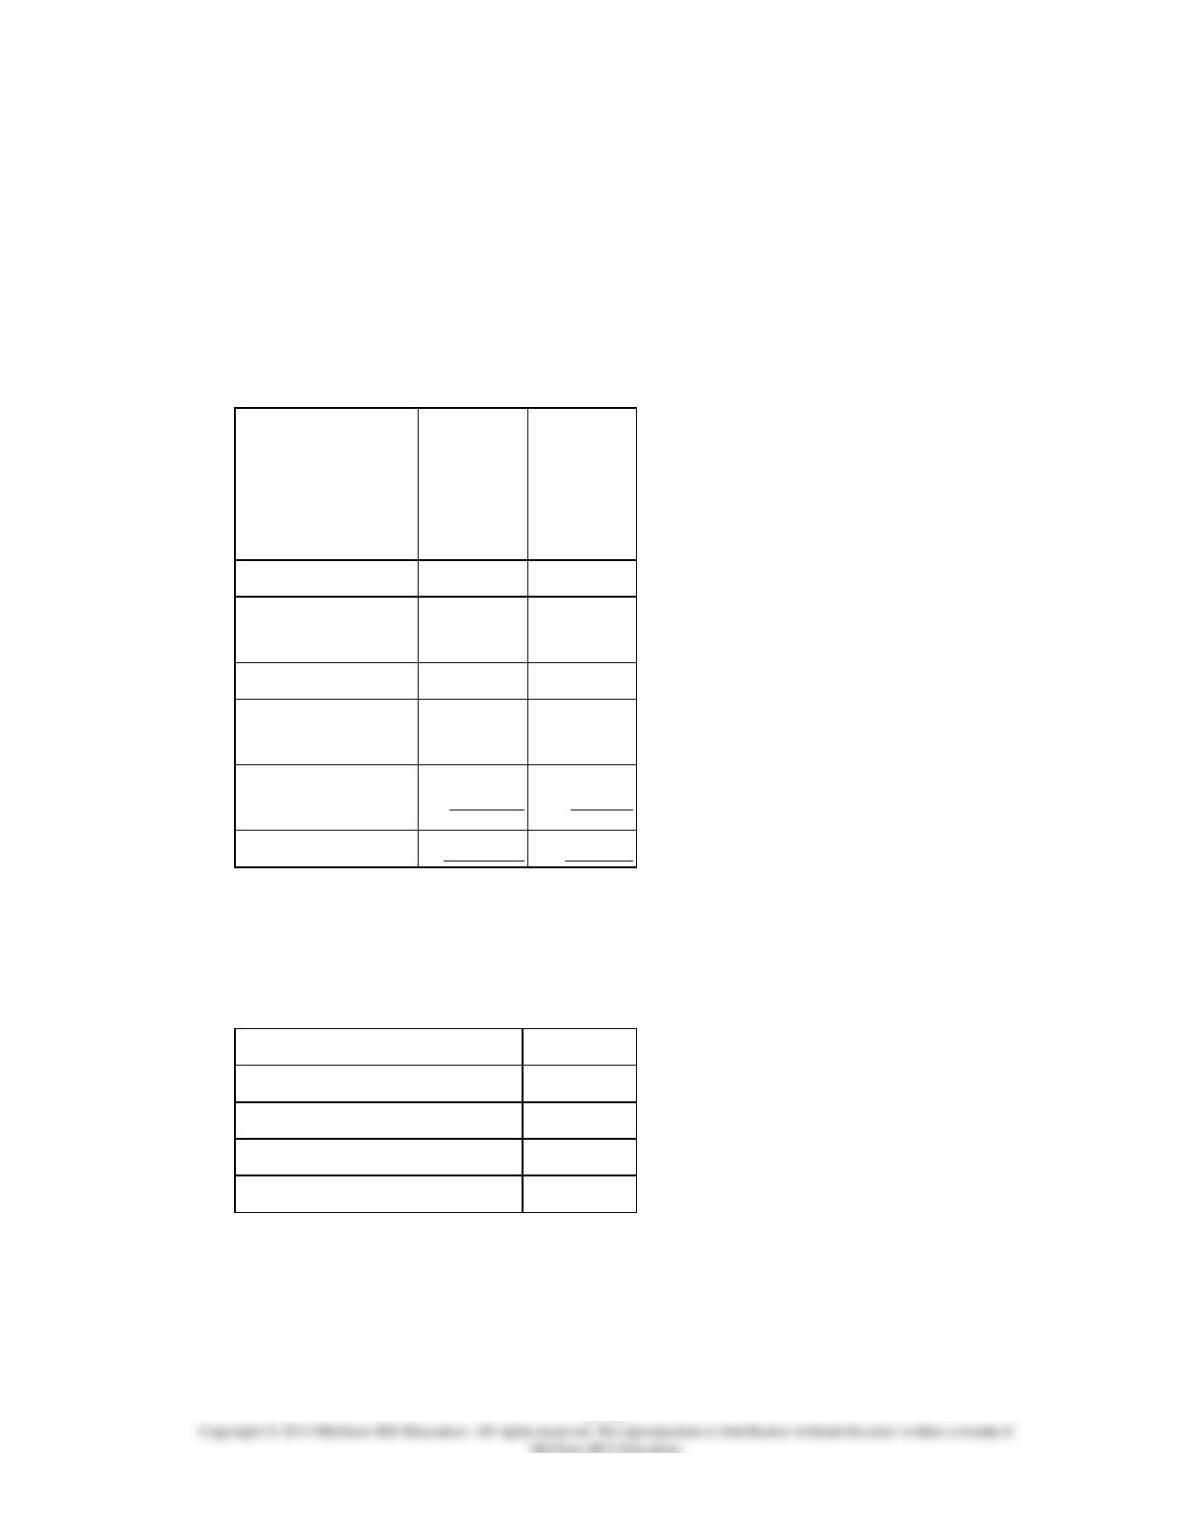
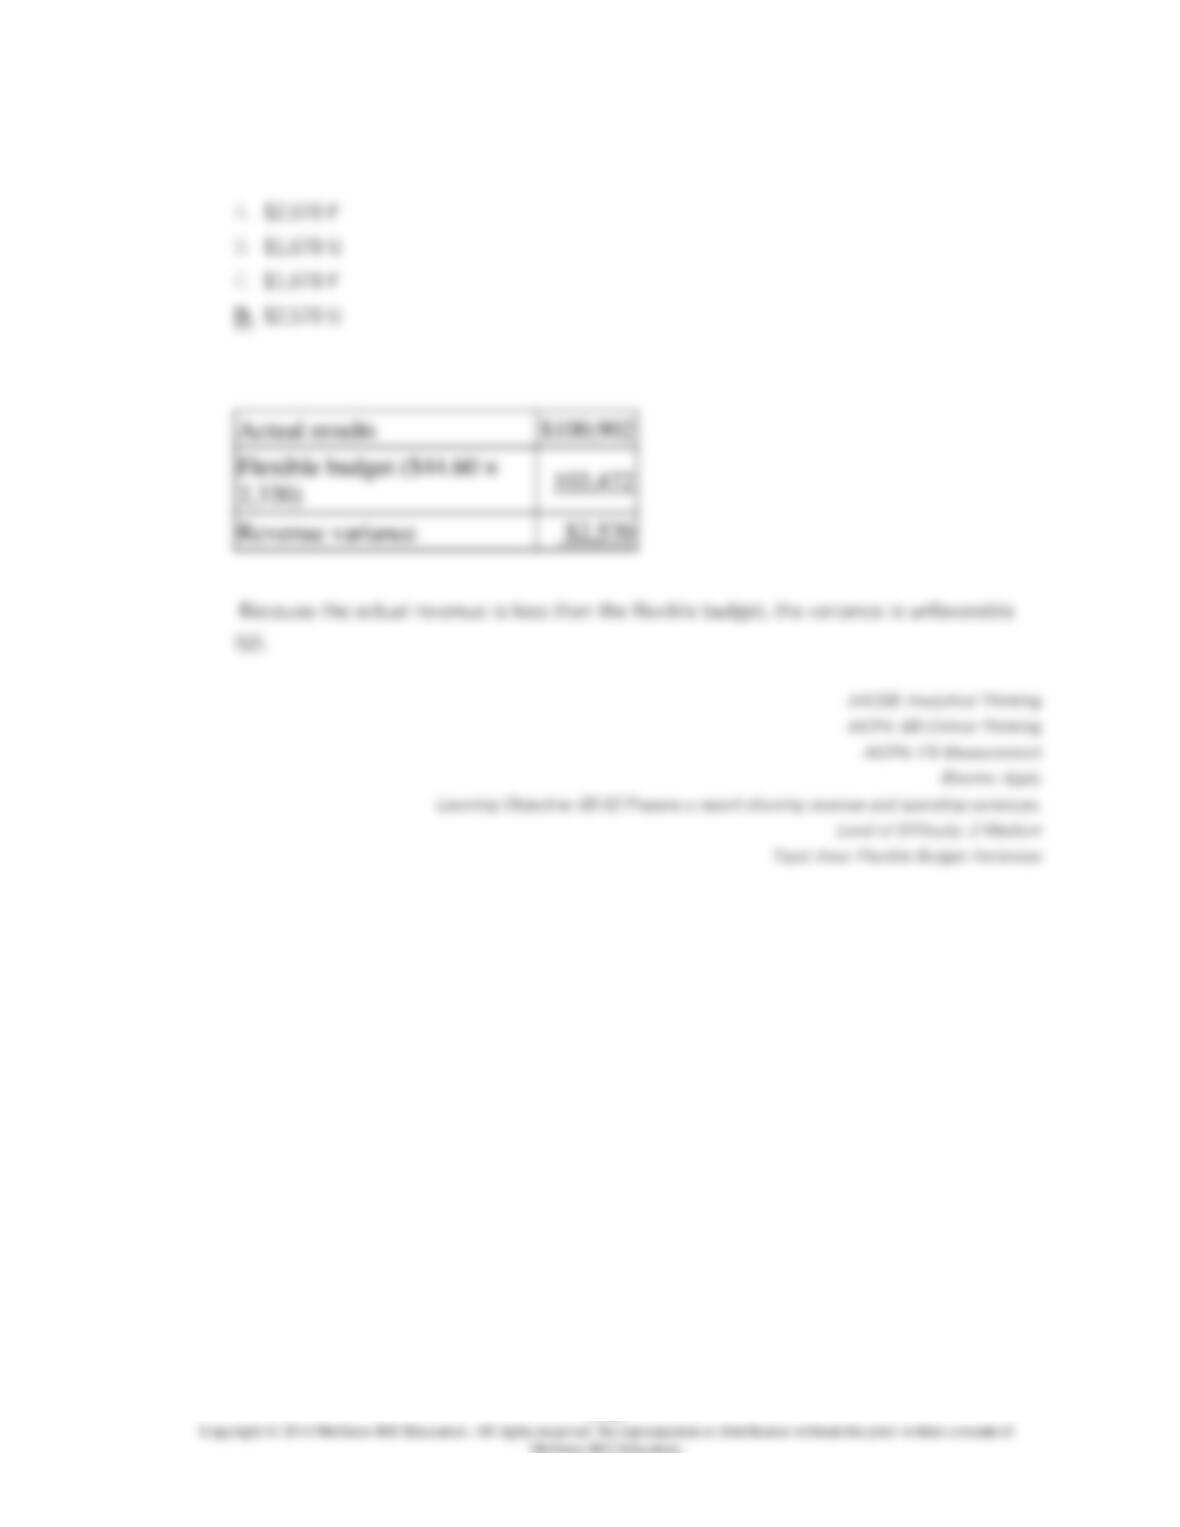
The revenue variance for April would be closest to:
8-752
8-753
224.
Gilson Corporation manufactures and sells a single product. The company uses units as
the measure of activity in its budgets and performance reports. During April, the company
budgeted for 5,100 units, but its actual level of activity was 5,060 units. The company has
provided the following data concerning the formulas used in its budgeting and its actual
results for April:
Data used in budgeting:
Fixed element
per month
Variable
element per unit
Revenue
−
$35.90
Direct labor
$0
$7.80
Direct materials
0
10.10
Manufacturing overhead
38,600
1.90
Selling and administrative expenses
21,000
0.40
Total expenses
$59,600
$20.20
Actual results for April:
Revenue
$179,164
Direct labor
$41,248
Direct materials
$49,086
Manufacturing overhead
$48,544
Selling and administrative
expenses
$22,354
The spending variance for direct materials in April would be closest to:
8-754
8-755
225.
Gilson Corporation manufactures and sells a single product. The company uses units as
the measure of activity in its budgets and performance reports. During April, the company
budgeted for 5,100 units, but its actual level of activity was 5,060 units. The company has
provided the following data concerning the formulas used in its budgeting and its actual
results for April:
Data used in budgeting:
Fixed element
per month
Variable
element per unit
Revenue
−
$35.90
Direct labor
$0
$7.80
Direct materials
0
10.10
Manufacturing overhead
38,600
1.90
Selling and administrative expenses
21,000
0.40
Total expenses
$59,600
$20.20
Actual results for April:
Revenue
$179,164
Direct labor
$41,248
Direct materials
$49,086
Manufacturing overhead
$48,544
Selling and administrative
expenses
$22,354
The spending variance for manufacturing overhead in April would be closest to:
8-756
8-757
226.
Gilson Corporation manufactures and sells a single product. The company uses units as
the measure of activity in its budgets and performance reports. During April, the company
budgeted for 5,100 units, but its actual level of activity was 5,060 units. The company has
provided the following data concerning the formulas used in its budgeting and its actual
results for April:
Data used in budgeting:
Fixed element
per month
Variable
element per unit
Revenue
–
$35.90
Direct labor
$0
$7.80
Direct materials
0
10.10
Manufacturing overhead
38,600
1.90
Selling and administrative expenses
21,000
0.40
Total expenses
$59,600
$20.20
Actual results for April:
Revenue
$179,164
Direct labor
$41,248
Direct materials
$49,086
Manufacturing overhead
$48,544
Selling and administrative
expenses
$22,354
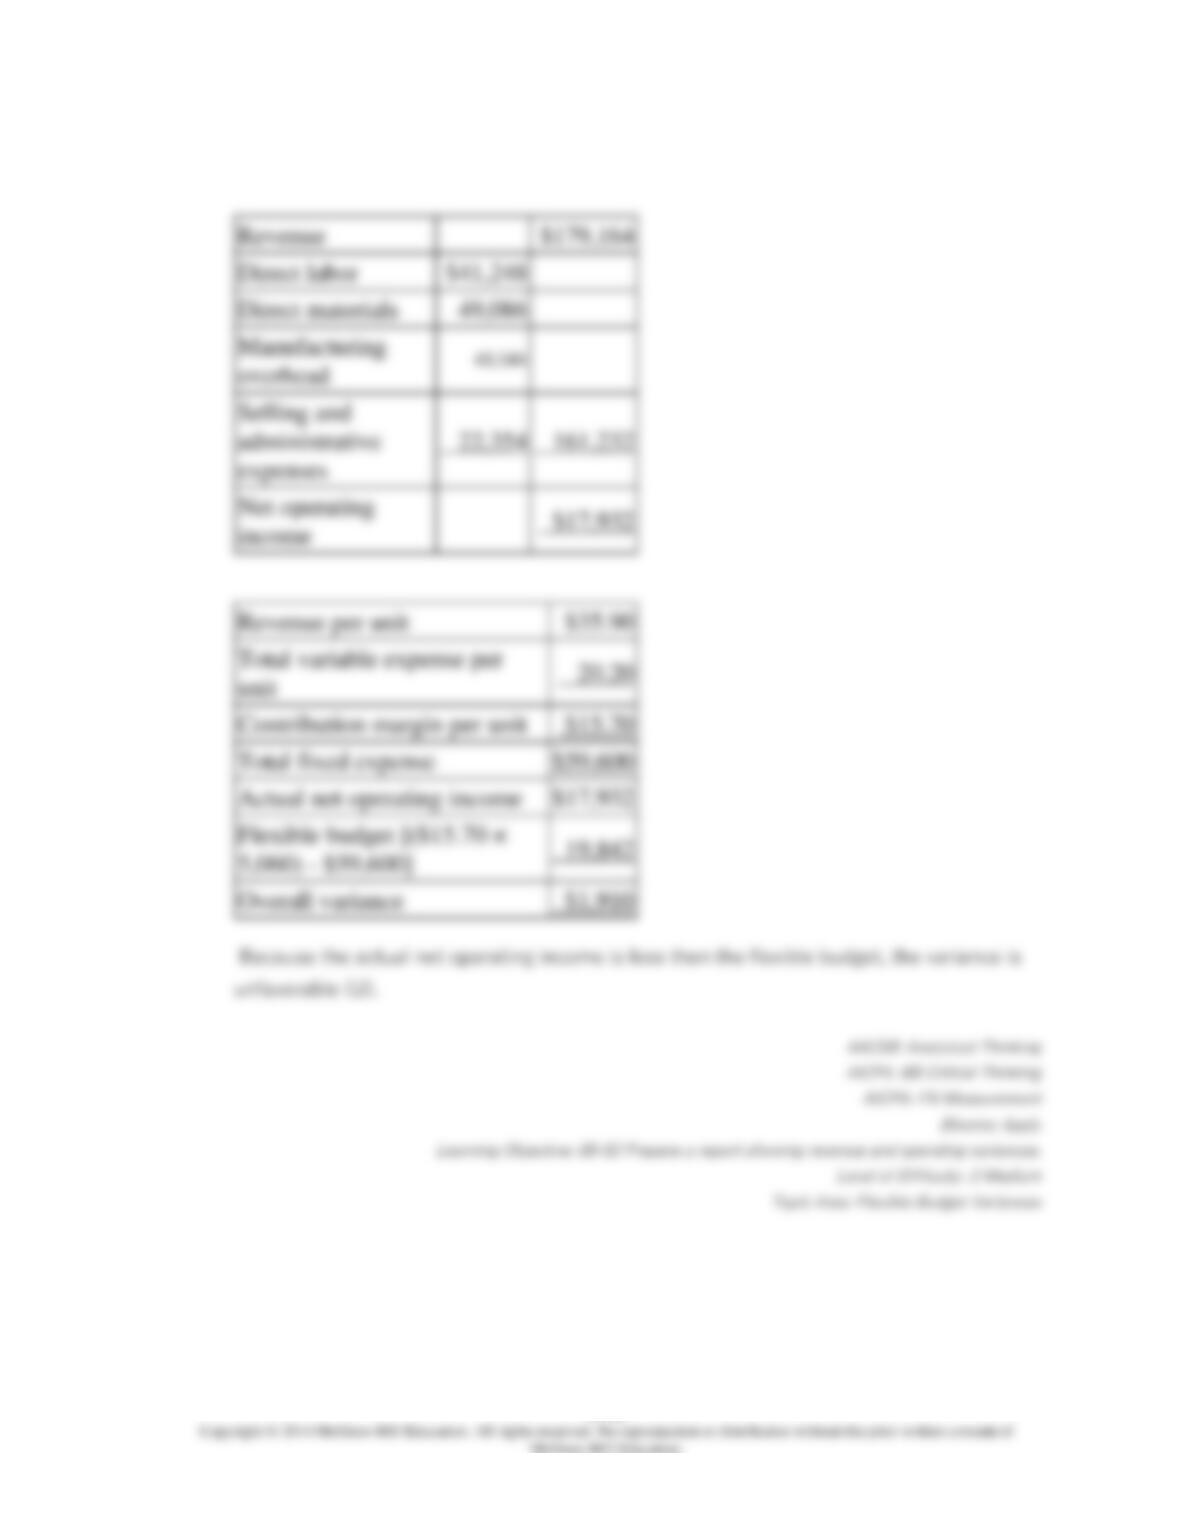
The overall revenue and spending variance (i.e., the variance for net operating income in
the revenue and spending variance column on the revenue and spending variances report)
for April would be closest to:
8-758
8-759
227.
Hagel Clinic uses client-visits as its measure of activity. During July, the clinic budgeted
for 2,300 client-visits, but its actual level of activity was 2,320 client-visits. The clinic has
provided the following data concerning the formulas used in its budgeting and its actual
results for July:
Data used in budgeting:
Fixed
element
per
month
Variable
element
per
client-
visit
Revenue
−
$44.60
Personnel
expenses
$23,200
$15.10
Medical supplies
900
7.40
Occupancy
expenses
6,500
2.00
Administrative
expenses
4,000
0.20
Total expenses
$34,600
$24.70
Actual results for July:
Revenue
$100,902
Personnel expenses
$60,922
Medical supplies
$18,648
Occupancy expenses
$11,290
Administrative expenses
$4,594
The revenue variance for July would be closest to:
8-760