8-721
208.
Wesolick Clinic uses client-visits as its measure of activity. During August, the clinic
budgeted for 2,900 client-visits, but its actual level of activity was 2,870 client-visits. The
clinic has provided the following data concerning the formulas used in its budgeting and
its actual results for August:
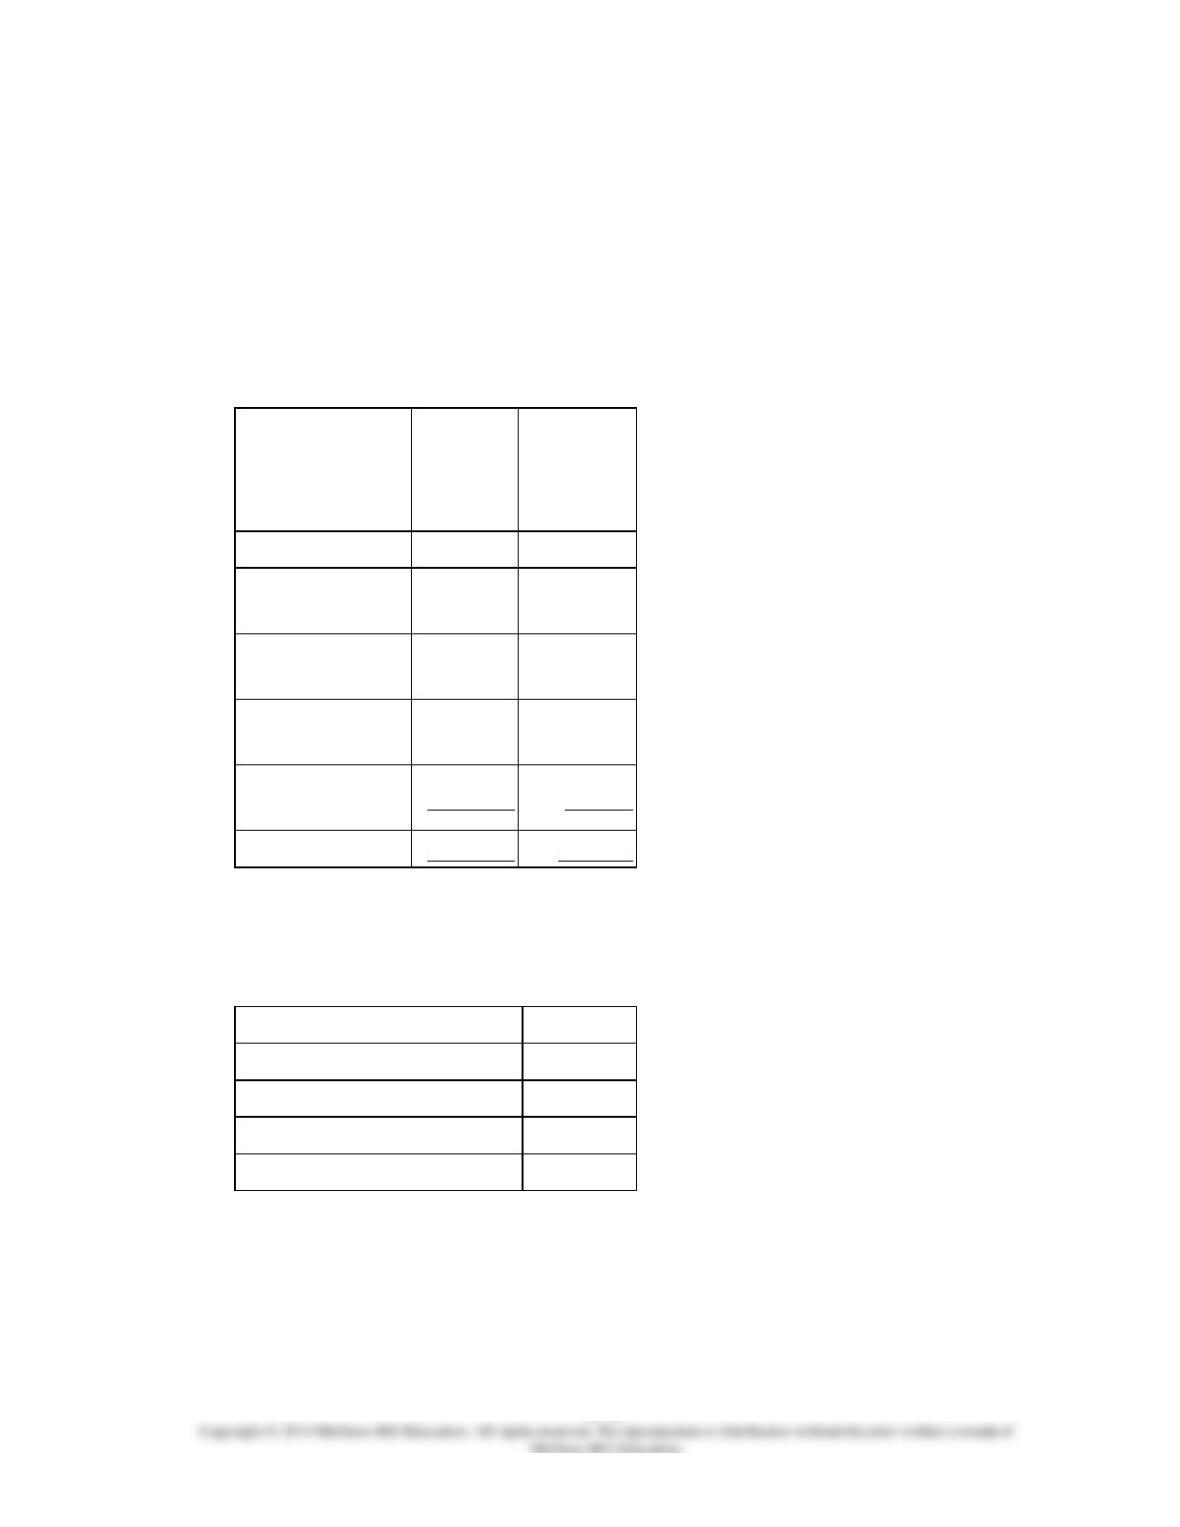
Data used in budgeting:
Fixed
element
per
month
Variable
element
per client-
visit
Revenue
−
$40.50
Personnel
expenses
$30,900
$12.80
Medical
supplies
1,400
5.60
Occupancy
expenses
7,500
2.00
Administrative
expenses
6,300
0.20
Total expenses
$46,100
$20.60
Actual results for August:
Revenue
$120,375
Personnel expenses
$65,916
Medical supplies
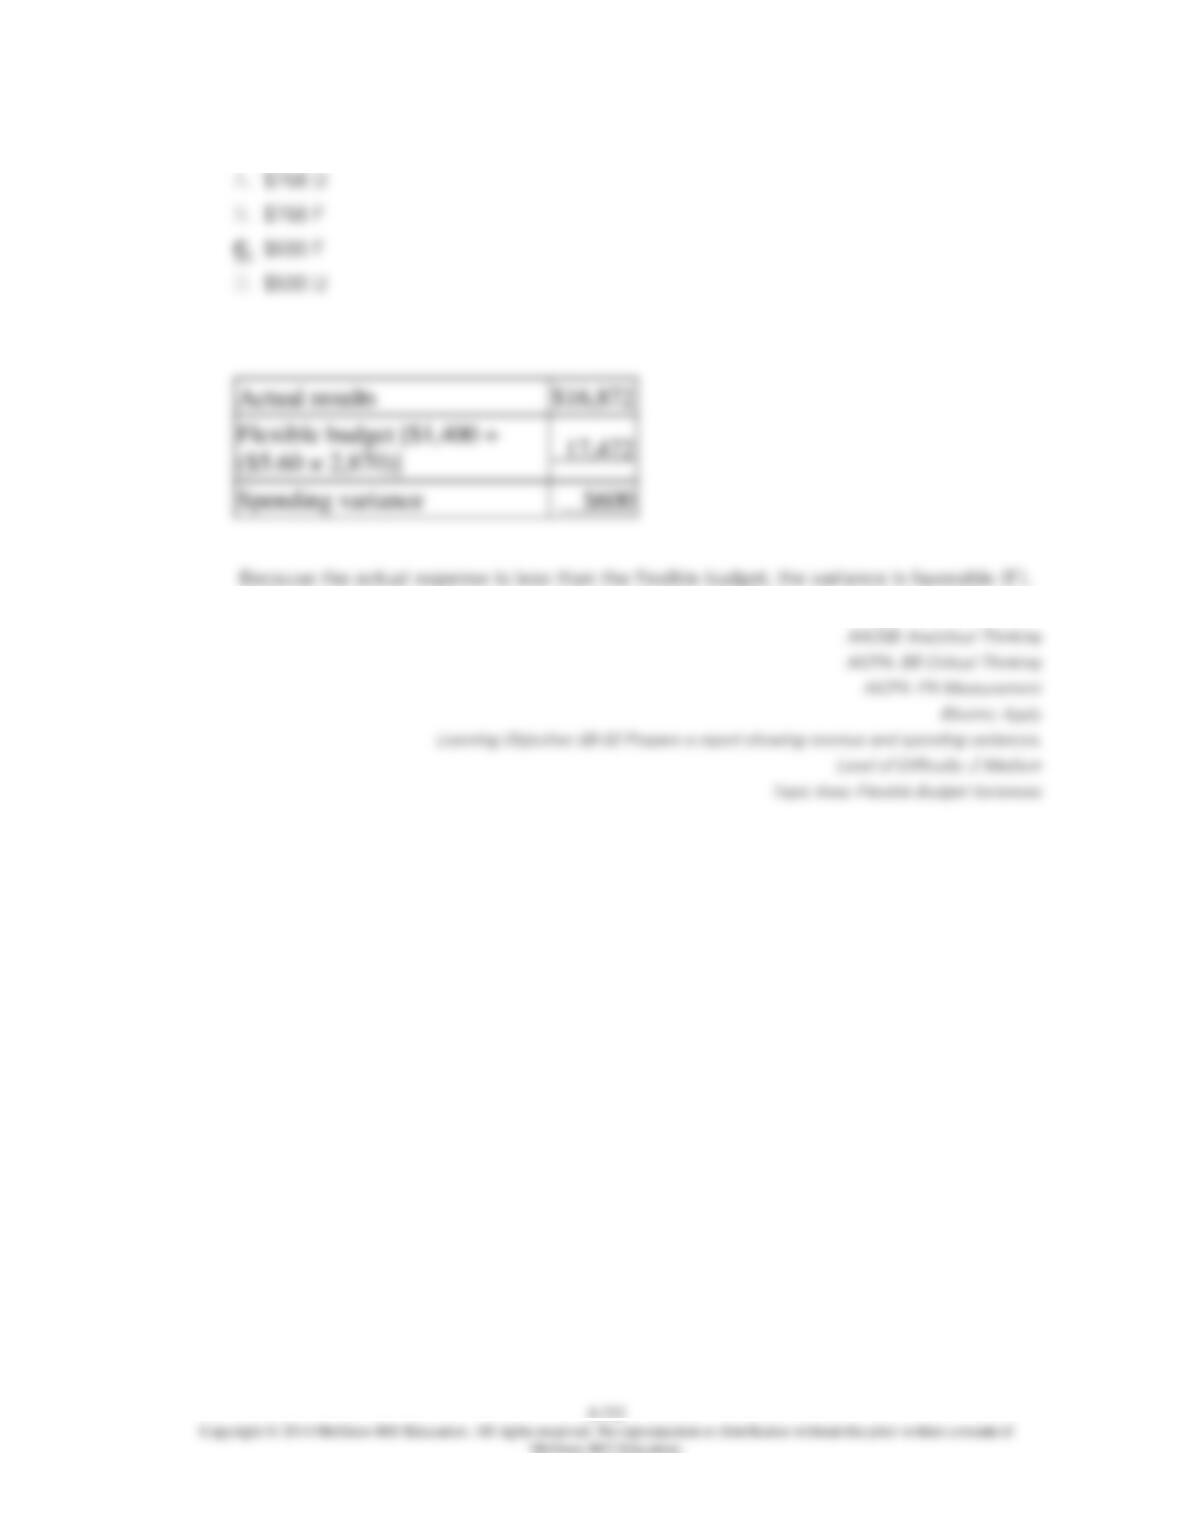
$16,872
Occupancy expenses
$13,200
Administrative expenses
$6,974
The spending variance for medical supplies in August would be closest to:
8-723
209.
Coderre Corporation manufactures and sells a single product. The company uses units as
the measure of activity in its budgets and performance reports. During July, the company
budgeted for 7,800 units, but its actual level of activity was 7,780 units. The company has
provided the following data concerning the formulas used in its budgeting and its actual
results for July:
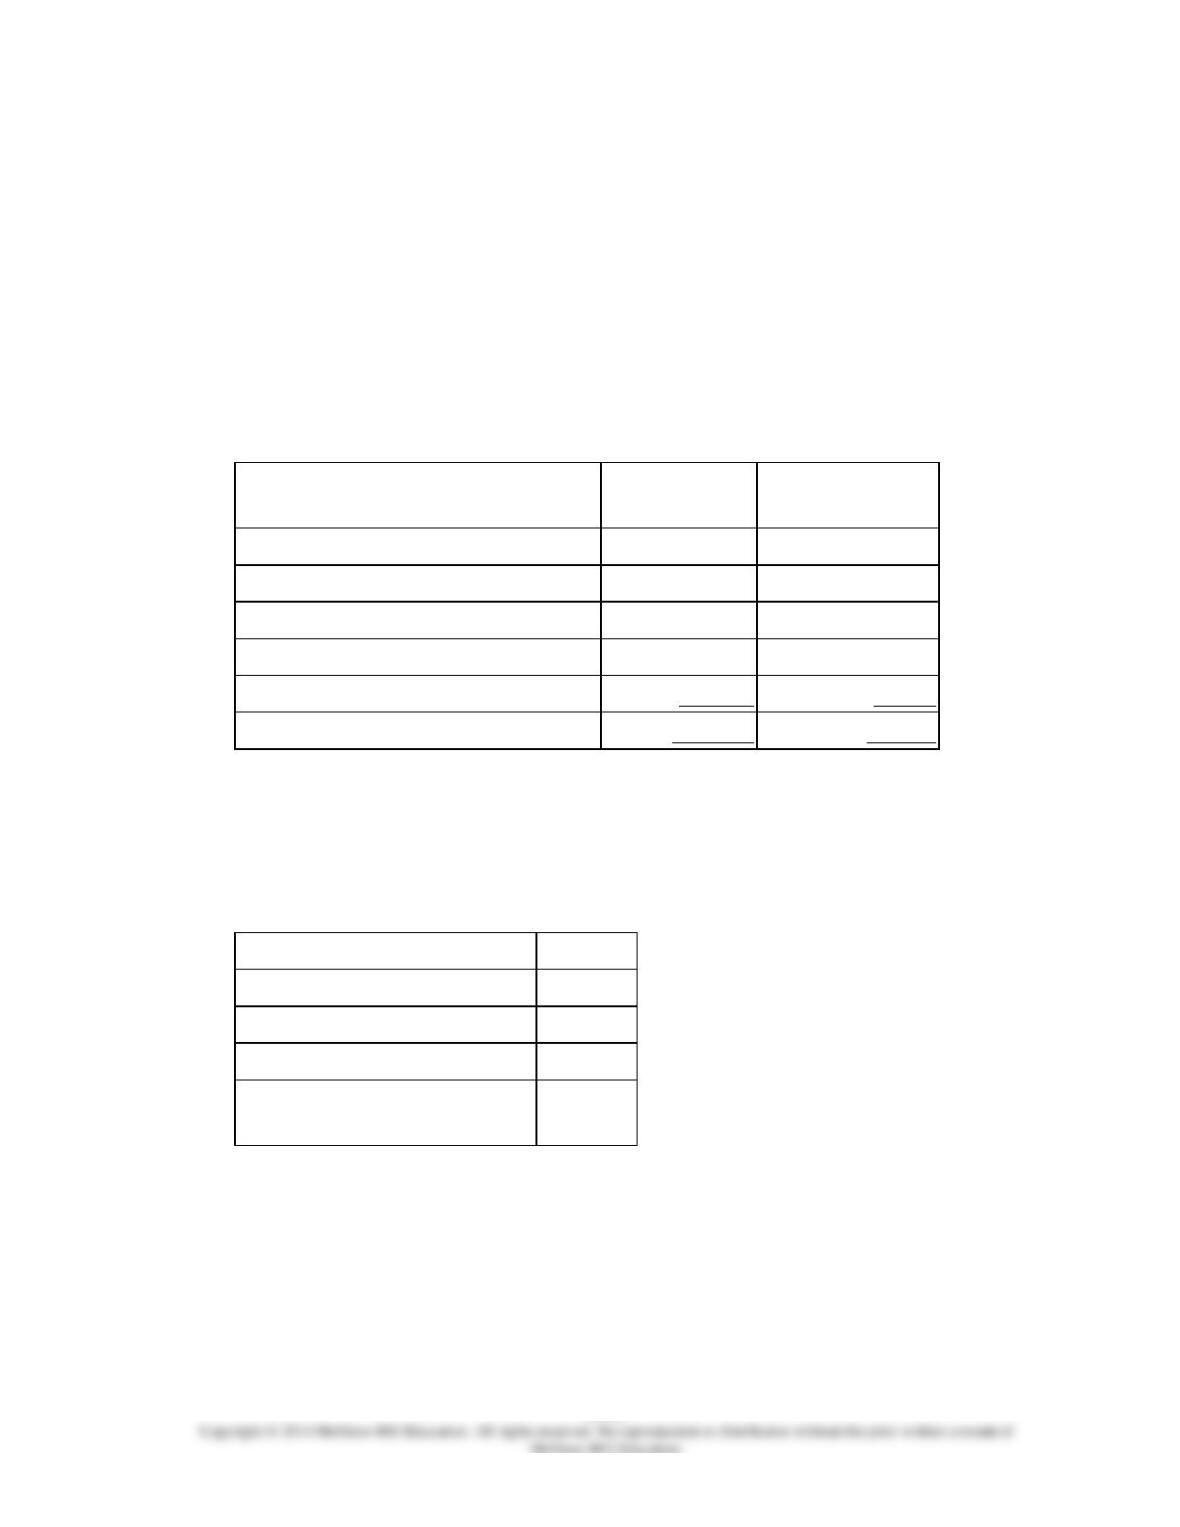
Data used in budgeting:
Fixed element
per month
Variable
element per unit
Revenue
−
$29.70
Direct labor
$0
$6.80
Direct materials
0
8.90
Manufacturing overhead
49,300
1.30
Selling and administrative expenses
26,300
0.10
Total expenses
$75,600
$17.10
Actual results for July:
Revenue
$224,996
Direct labor
$52,274
Direct materials
$69,312
Manufacturing overhead
$57,794
Selling and administrative
expenses
$27,588
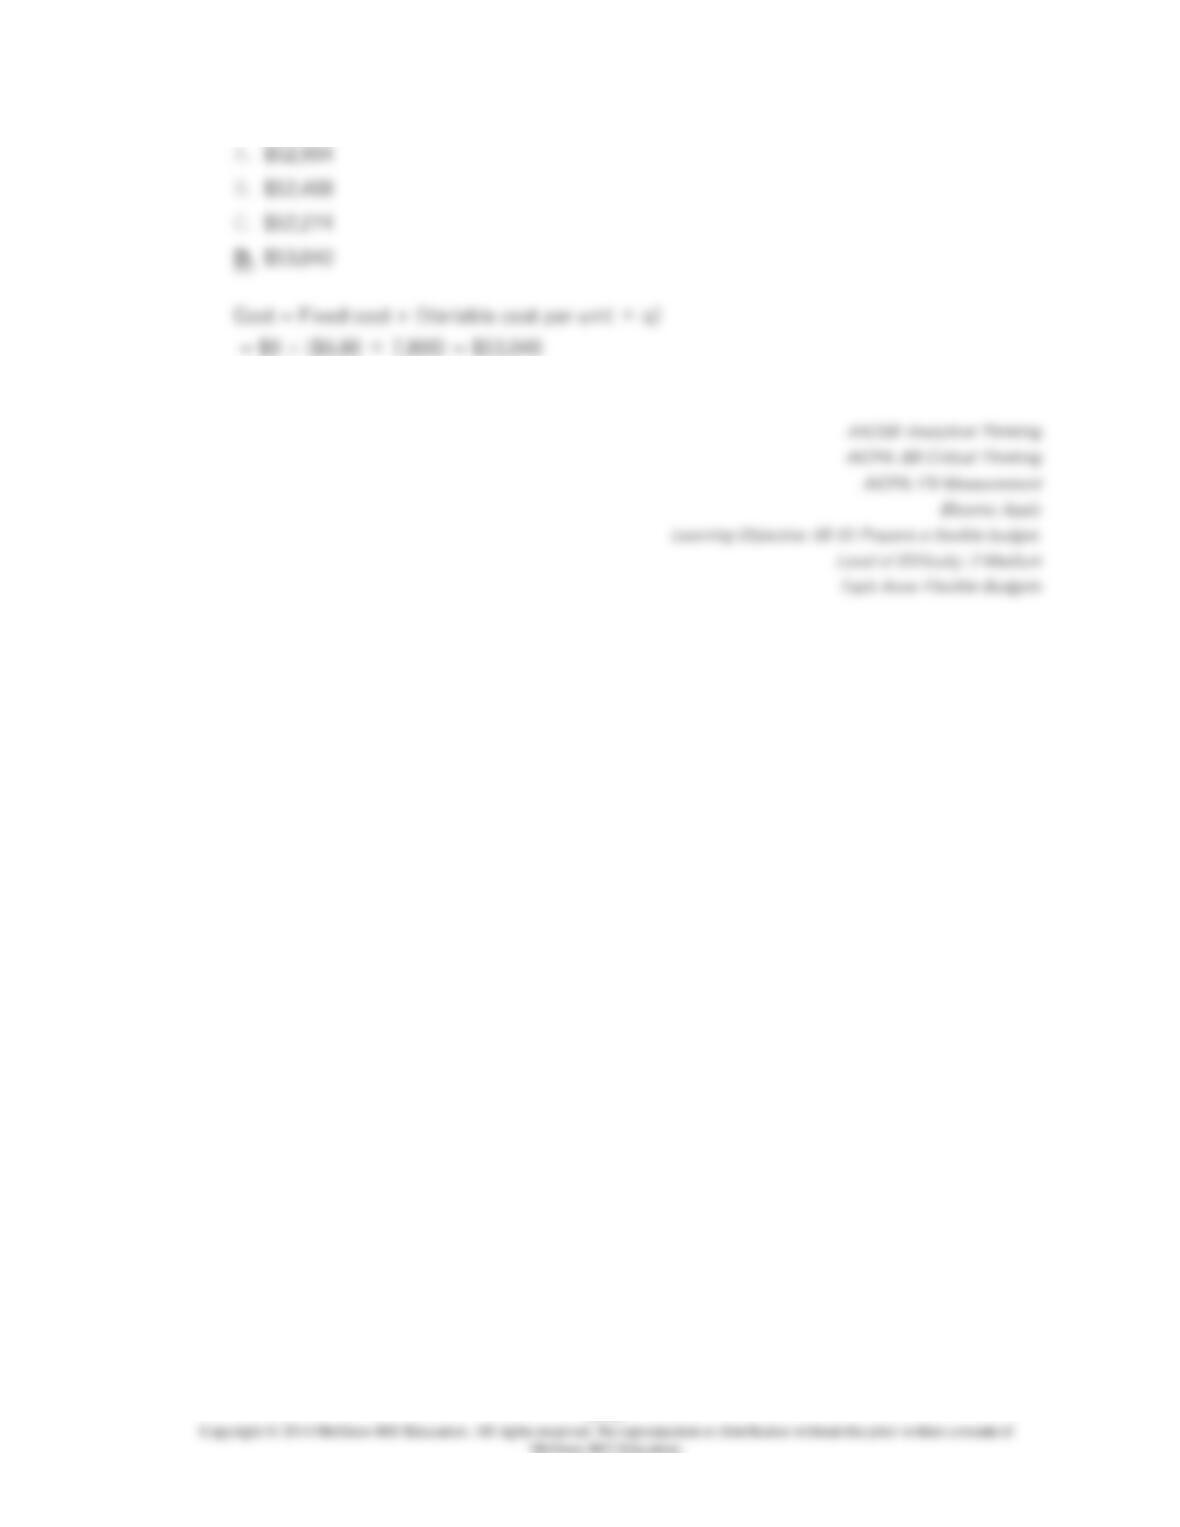
The direct labor in the planning budget for July would be closest to:
8-724

8-725
210.
Coderre Corporation manufactures and sells a single product. The company uses units as
the measure of activity in its budgets and performance reports. During July, the company
budgeted for 7,800 units, but its actual level of activity was 7,780 units. The company has
provided the following data concerning the formulas used in its budgeting and its actual
results for July:
Data used in budgeting:
Fixed element
per month
Variable
element per unit
Revenue
−
$29.70
Direct labor
$0
$6.80
Direct materials
0
8.90
Manufacturing overhead
49,300
1.30
Selling and administrative expenses
26,300
0.10
Total expenses
$75,600
$17.10
Actual results for July:
Revenue
$224,996
Direct labor
$52,274
Direct materials
$69,312
Manufacturing overhead
$57,794
Selling and administrative
expenses
$27,588
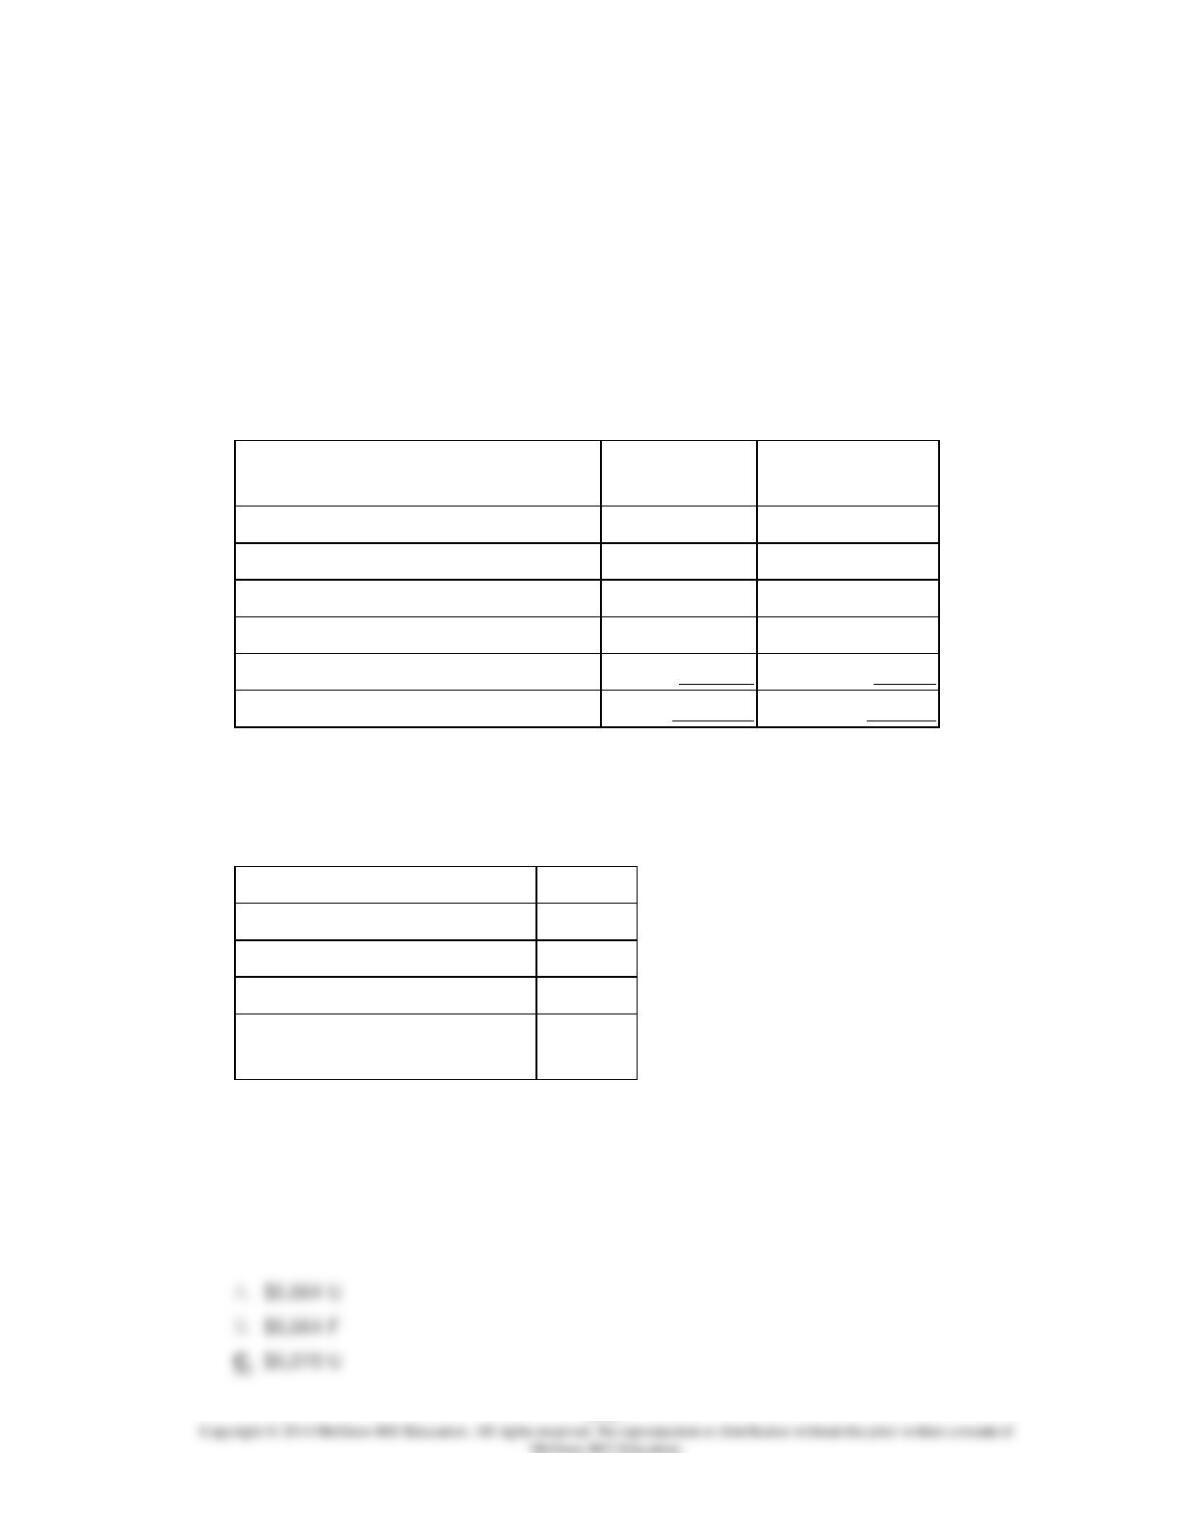
The direct materials in the flexible budget for July would be closest to:
8-726
8-727
211.
Coderre Corporation manufactures and sells a single product. The company uses units as
the measure of activity in its budgets and performance reports. During July, the company
budgeted for 7,800 units, but its actual level of activity was 7,780 units. The company has
provided the following data concerning the formulas used in its budgeting and its actual
results for July:
Data used in budgeting:
Fixed element
per month
Variable
element per unit
Revenue
−
$29.70
Direct labor
$0
$6.80
Direct materials
0
8.90
Manufacturing overhead
49,300
1.30
Selling and administrative expenses
26,300
0.10
Total expenses
$75,600
$17.10
Actual results for July:
Revenue
$224,996
Direct labor
$52,274
Direct materials
$69,312
Manufacturing overhead
$57,794
Selling and administrative
expenses
$27,588
The revenue variance for July would be closest to:
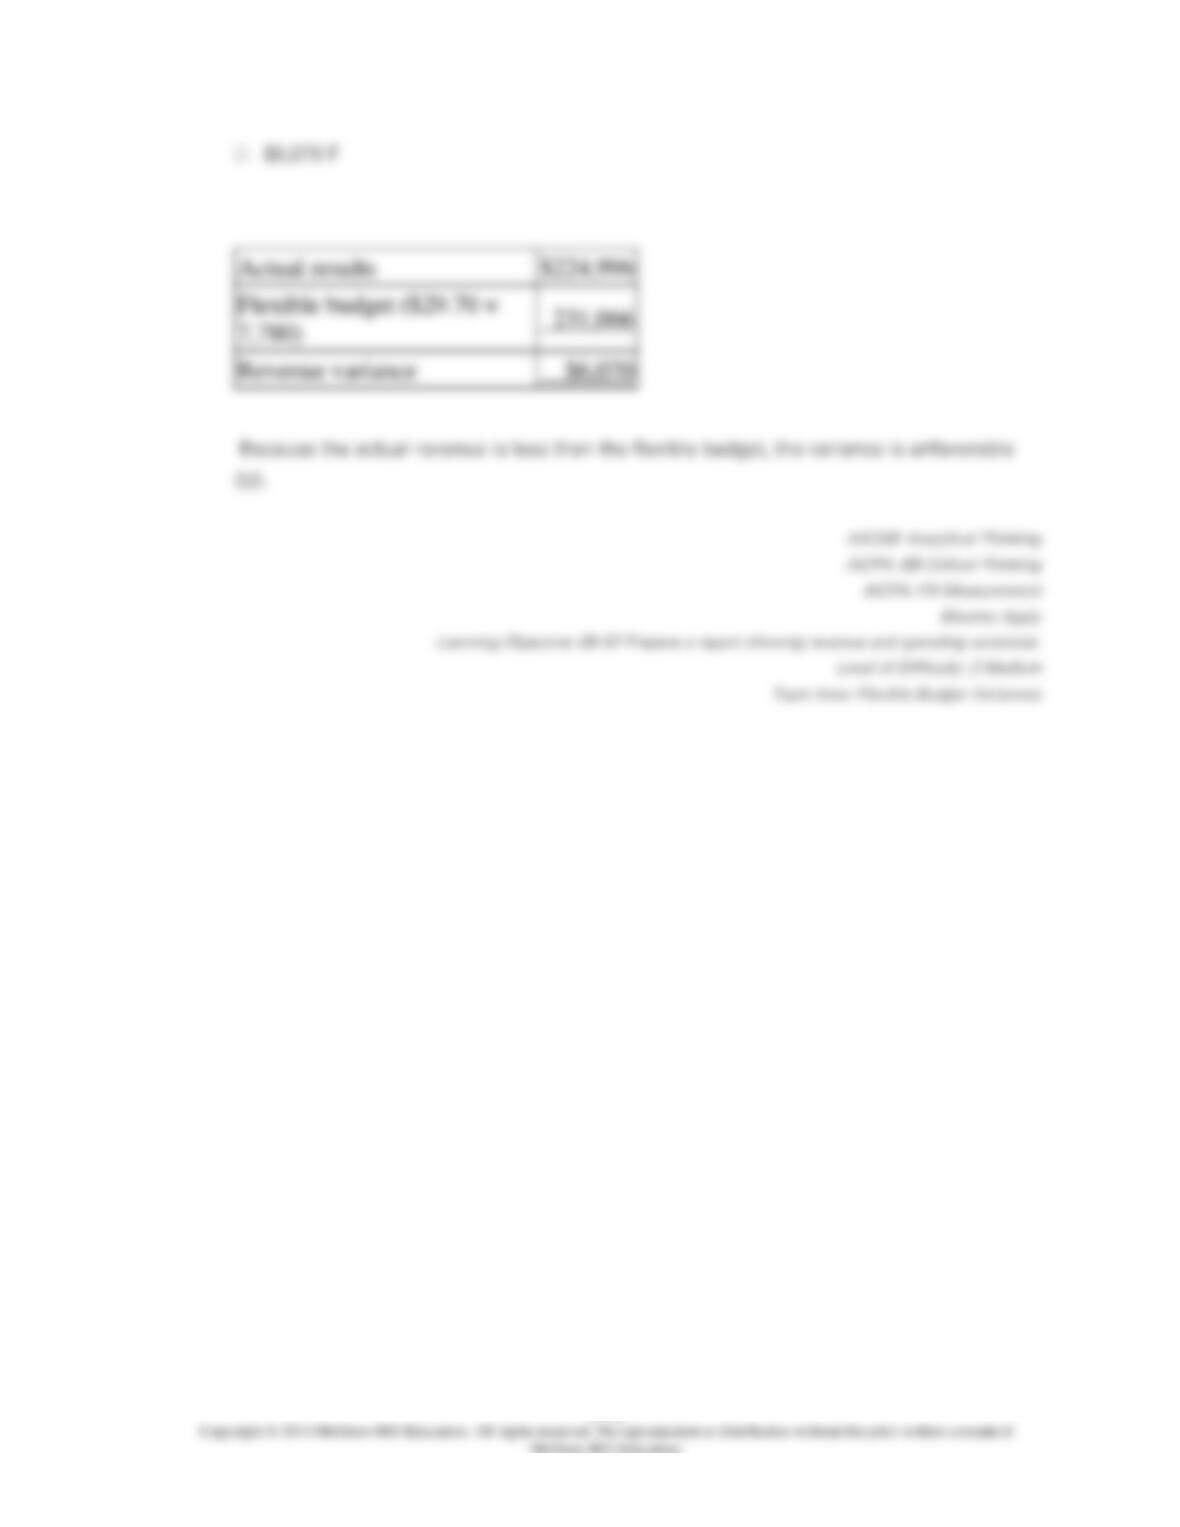
8-728
8-729
212.
Coderre Corporation manufactures and sells a single product. The company uses units as
the measure of activity in its budgets and performance reports. During July, the company
budgeted for 7,800 units, but its actual level of activity was 7,780 units. The company has
provided the following data concerning the formulas used in its budgeting and its actual
results for July:
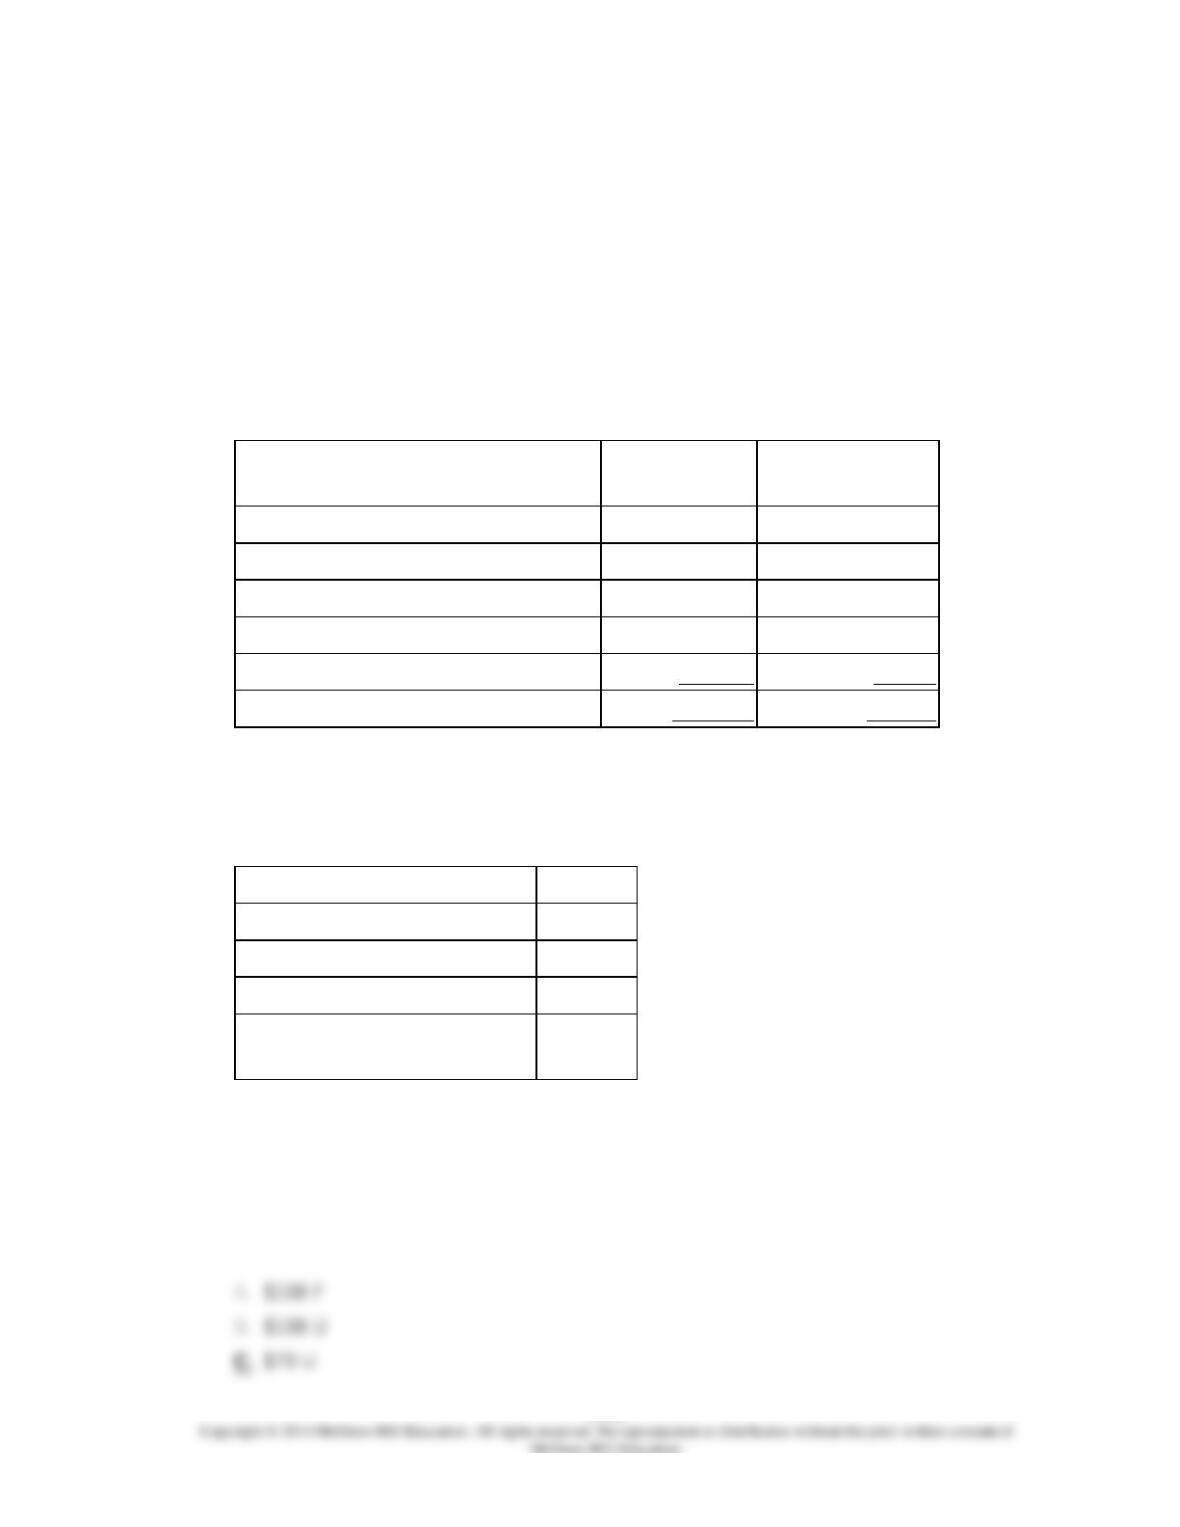
Data used in budgeting:
Fixed element
per month
Variable
element per unit
Revenue
−
$29.70
Direct labor
$0
$6.80
Direct materials
0
8.90
Manufacturing overhead
49,300
1.30
Selling and administrative expenses
26,300
0.10
Total expenses
$75,600
$17.10
Actual results for July:
Revenue
$224,996
Direct labor
$52,274
Direct materials
$69,312
Manufacturing overhead
$57,794
Selling and administrative
expenses
$27,588
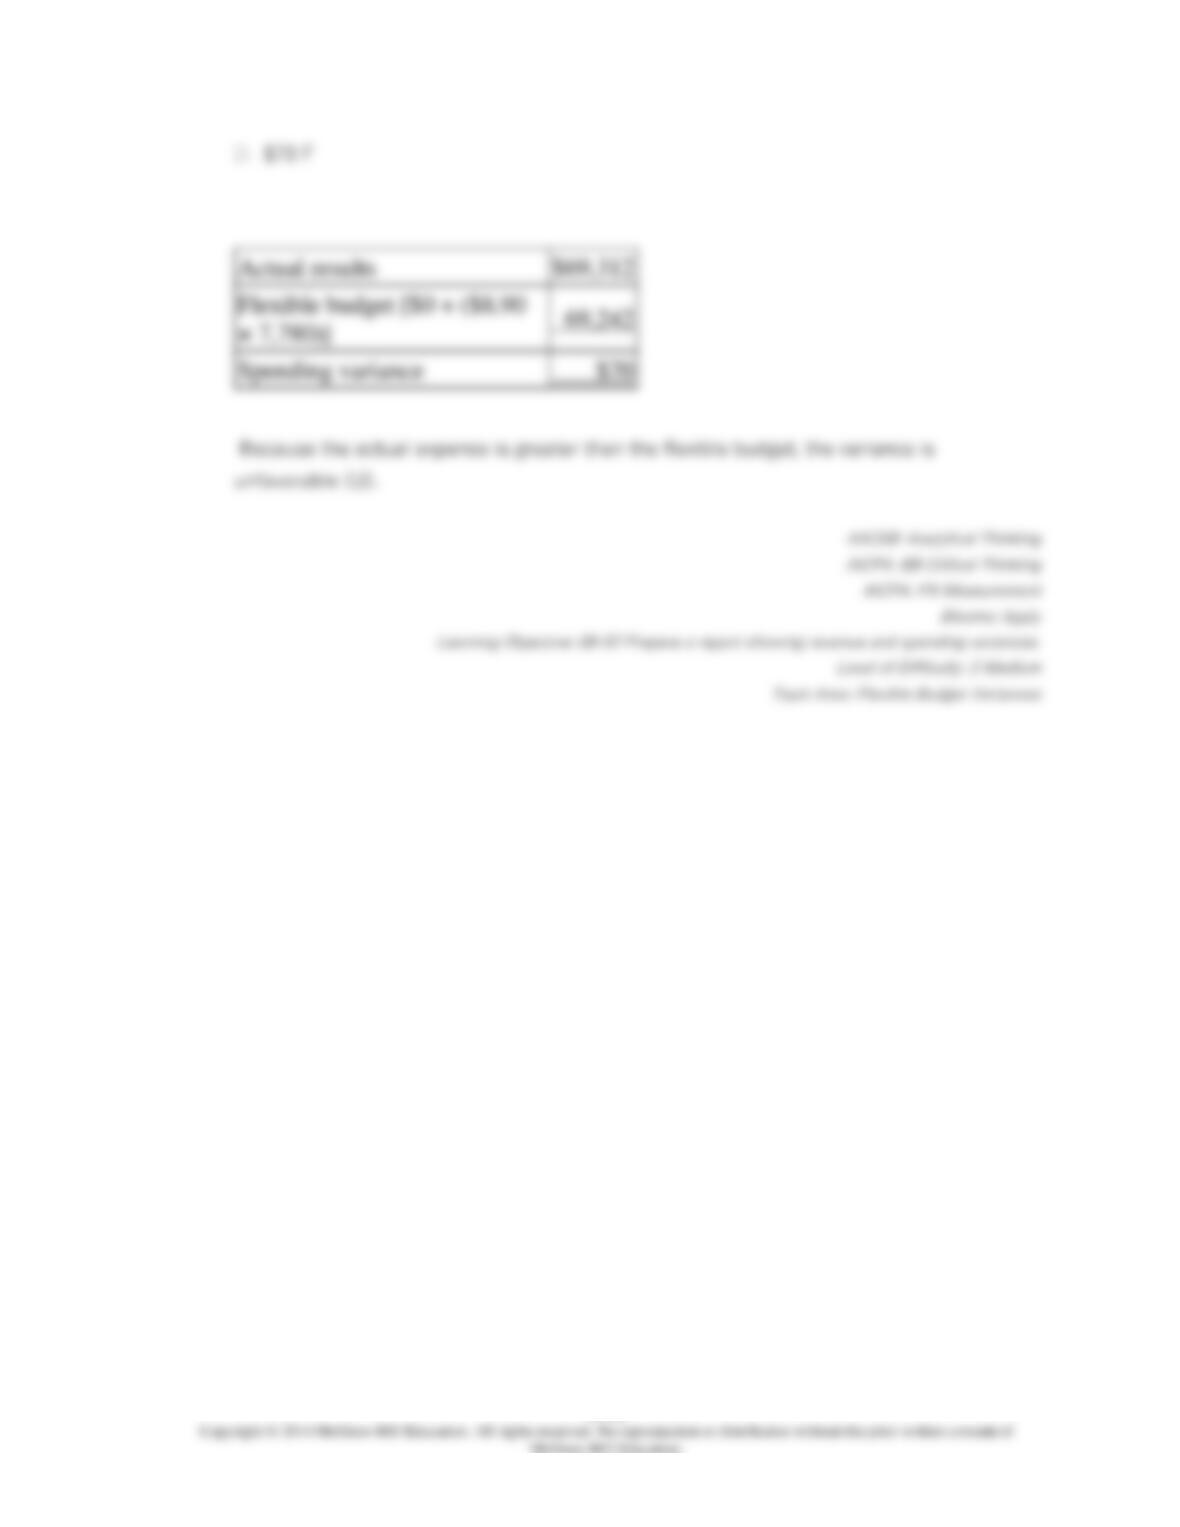
The spending variance for direct materials in July would be closest to:
8-730
8-731
213.
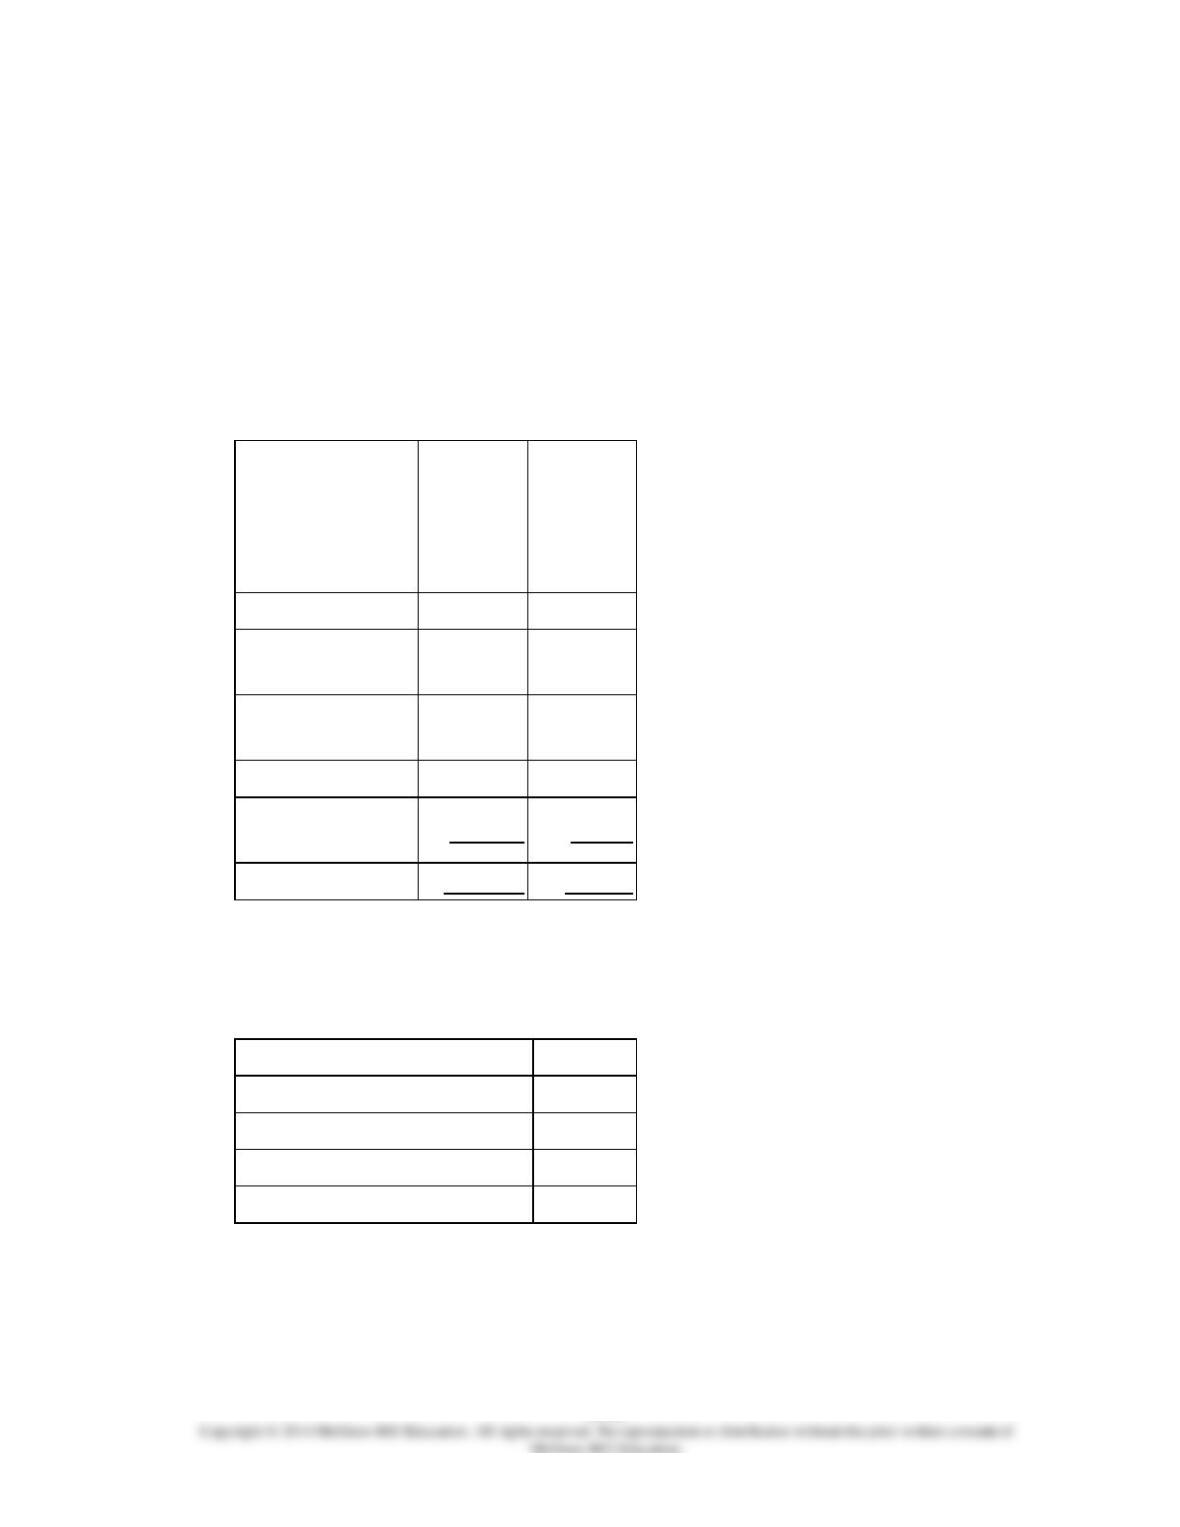
Zike Corporation’s static planning budget for October appears below. The company bases
its budgets on machine-hours.
Budgeted number of
machine-hours
5,700
Supplies (@ $2.30 per
machine-hour)
$13,110
Power (@ $8.00 per
machine-hour)
45,600
Salaries
15,390
Equipment depreciation
62,700
Total
$136,800
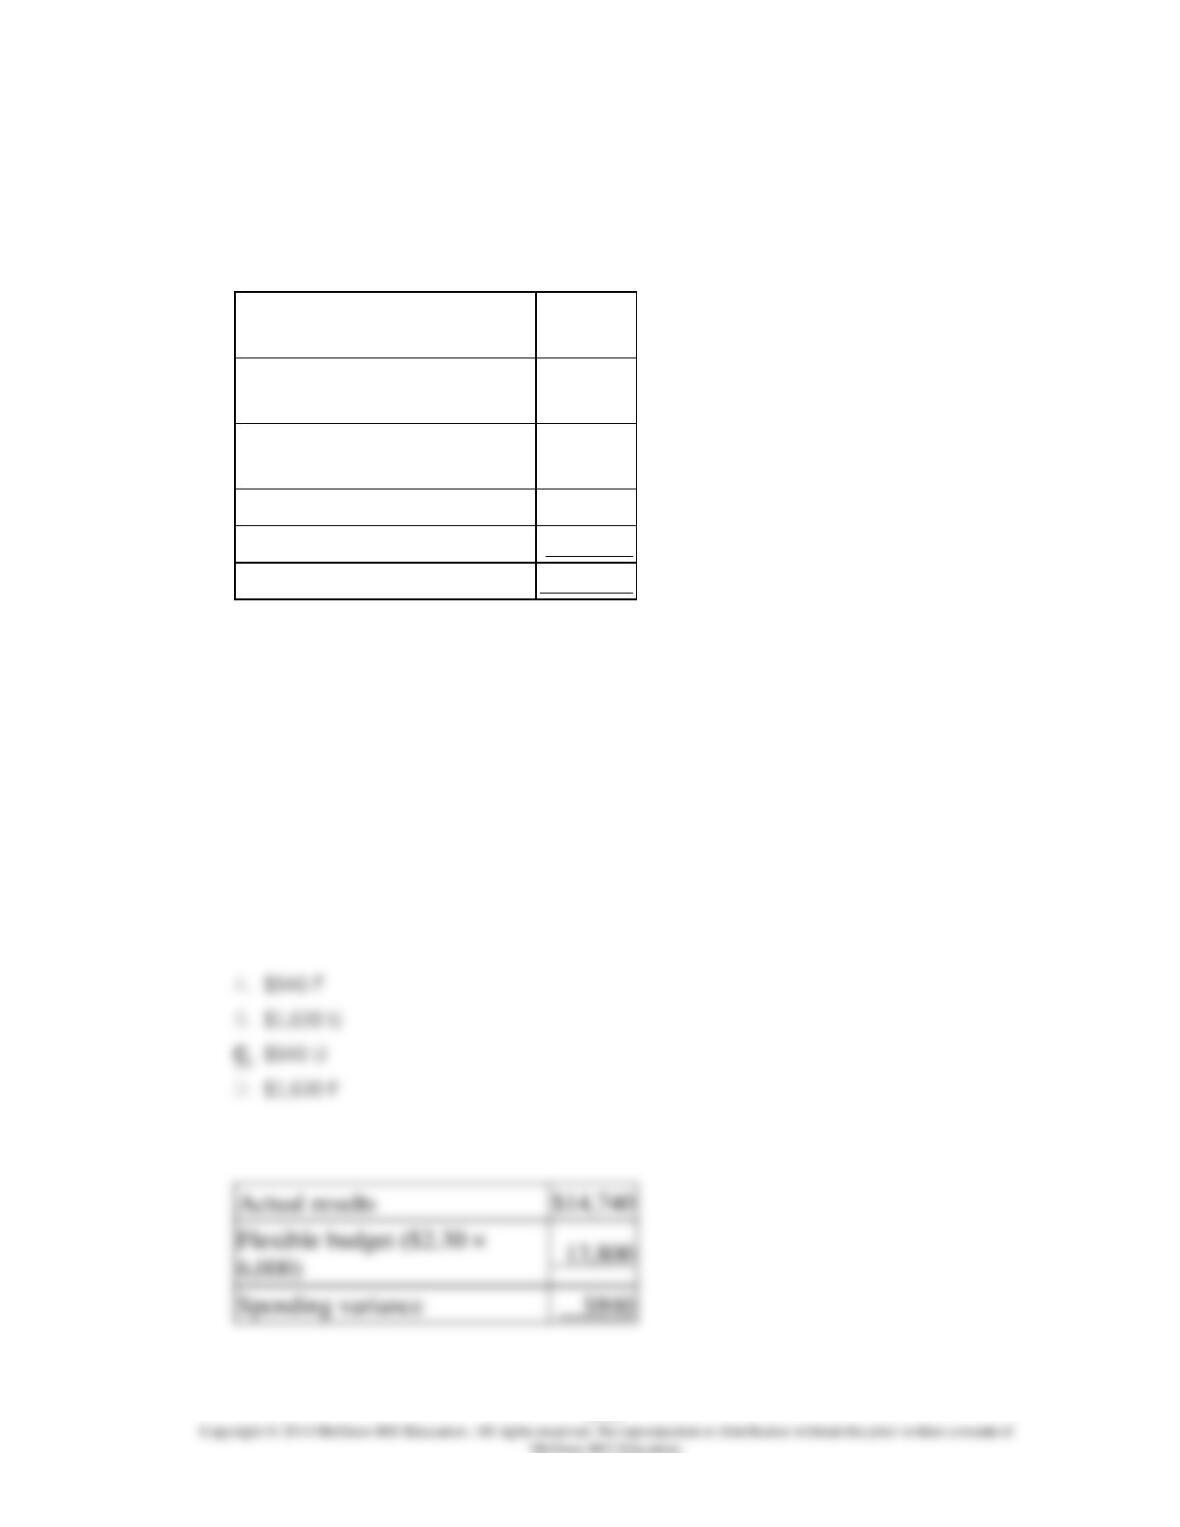
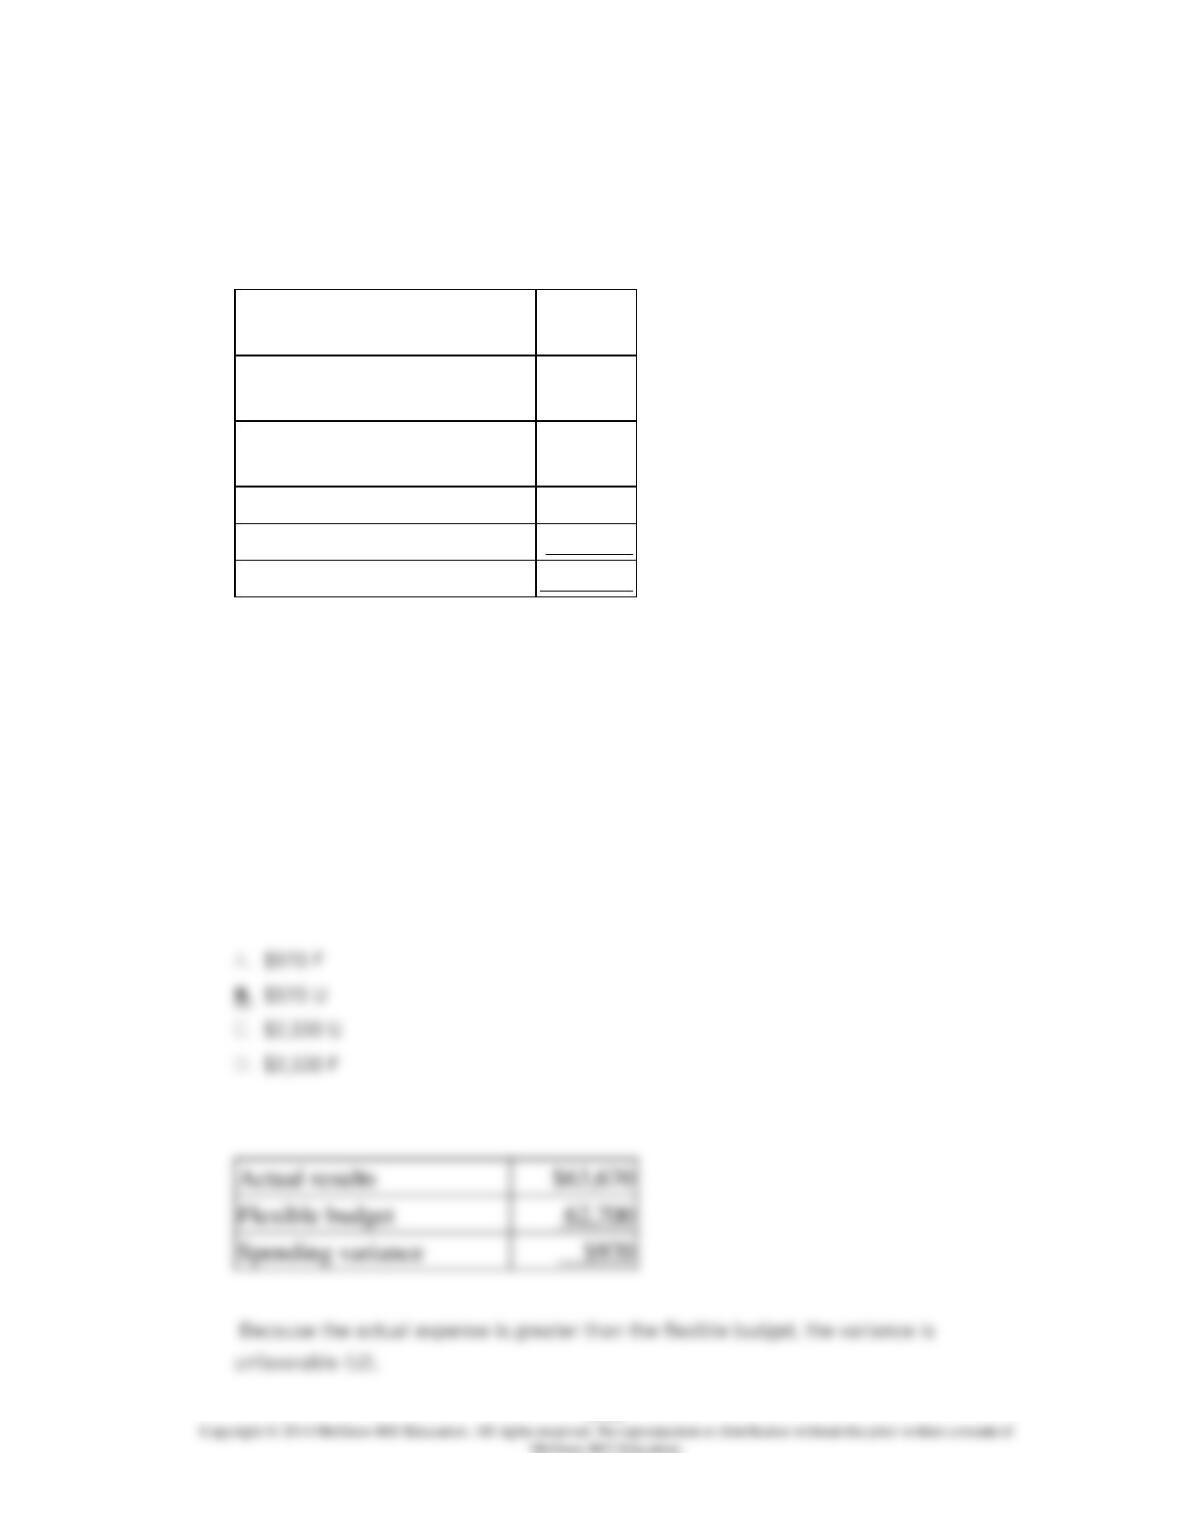
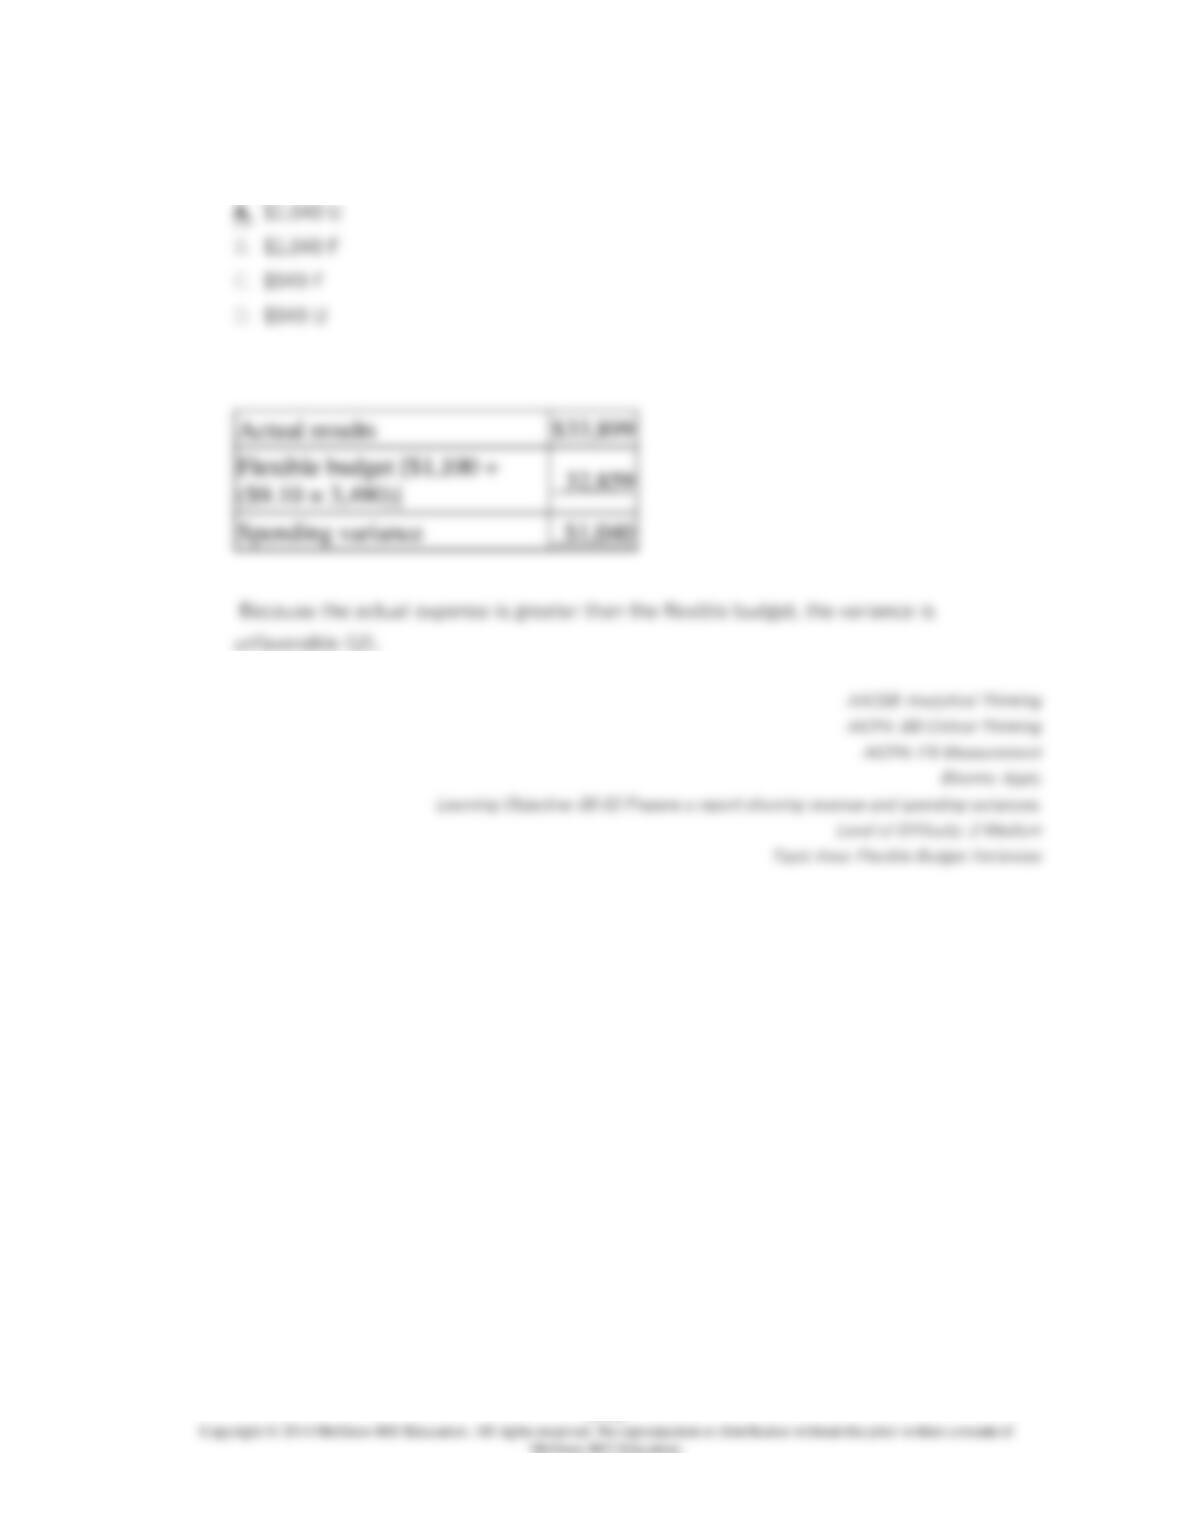
Actual results
$14,740
Flexible budget ($2.30 ×
6,000)
Spending variance
$940
In October, the actual number of machine-hours was 6,000, the actual supplies cost was
$14,740, the actual power cost was $49,170, the actual salaries cost was $15,390, and the
actual equipment depreciation was $63,670.
The spending variance for supplies cost in the performance report for the month should
be:
8-732
8-733
214.
Zike Corporation’s static planning budget for October appears below. The company bases
its budgets on machine-hours.
Budgeted number of
machine-hours
5,700
Supplies (@ $2.30 per
machine-hour)
$13,110
Power (@ $8.00 per
machine-hour)
45,600
Salaries
15,390
Equipment depreciation
62,700
Total
$136,800
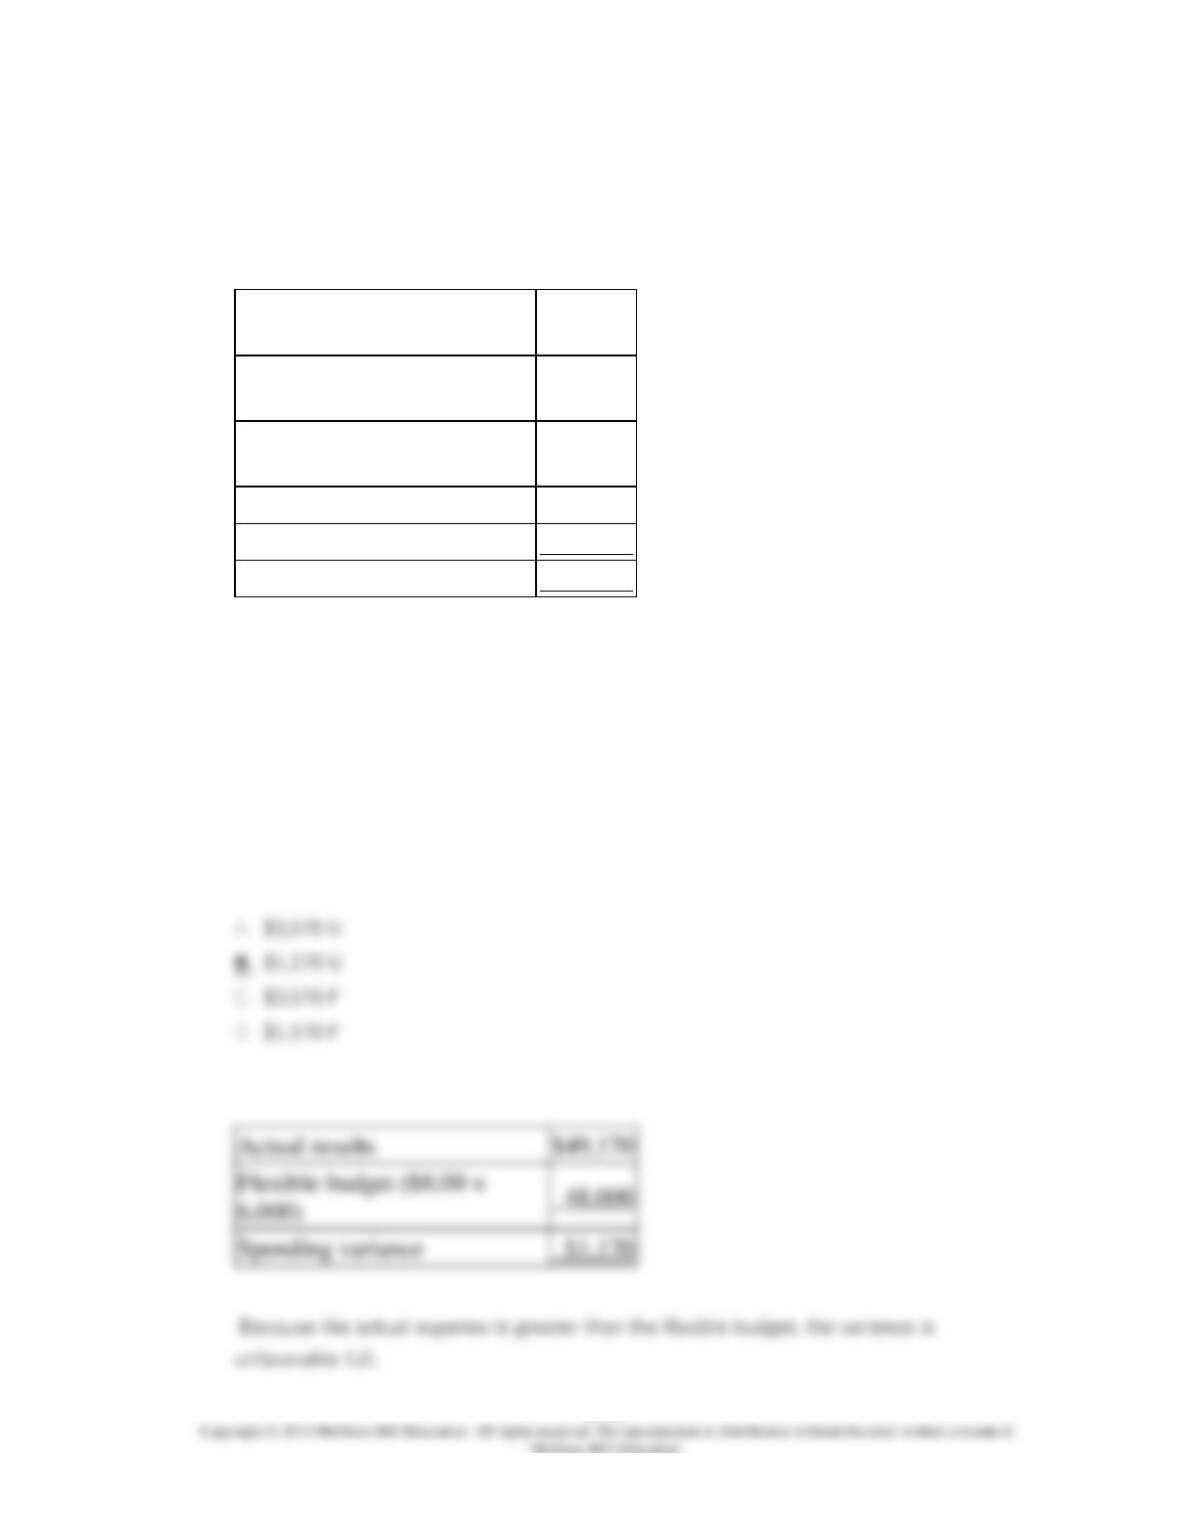
Actual results
$49,170
Flexible budget ($8.00 ×
Spending variance
$1,170
In October, the actual number of machine-hours was 6,000, the actual supplies cost was
$14,740, the actual power cost was $49,170, the actual salaries cost was $15,390, and the
actual equipment depreciation was $63,670.
The spending variance for power cost in the performance report for the month should be:

8-734
8-735
215.
Zike Corporation’s static planning budget for October appears below. The company bases
its budgets on machine-hours.
Budgeted number of
machine-hours
5,700
Supplies (@ $2.30 per
machine-hour)
$13,110
Power (@ $8.00 per
machine-hour)
45,600
Salaries
15,390
Equipment depreciation
62,700
Total
$136,800
Actual results
Flexible budget
In October, the actual number of machine-hours was 6,000, the actual supplies cost was
$14,740, the actual power cost was $49,170, the actual salaries cost was $15,390, and the
actual equipment depreciation was $63,670.
The spending variance for equipment depreciation in the performance report for the
month should be:
8-736
8-737
216.
Smithj Kennel uses tenant-days as its measure of activity; an animal housed in the kennel
for one day is counted as one tenant-day. During February, the kennel budgeted for 3,500
tenant-days, but its actual level of activity was 3,490 tenant-days. The kennel has
provided the following data concerning the formulas used in its budgeting and its actual
results for February:
Data used in budgeting:
Fixed
element
per
month
Variable
element
per
tenant-
day
Revenue
−
$27.80
Wages and
salaries
$2,000
$5.10
Food and
supplies
1,100
9.10
Facility expenses
9,200
4.70
Administrative
expenses
7,600
0.40
Total expenses
$19,900
$19.30
Actual results for February:
Revenue
$96,382
Wages and salaries
$19,529
Food and supplies
$33,899
Facility expenses
$25,203
Administrative expenses
$8,956
8-738
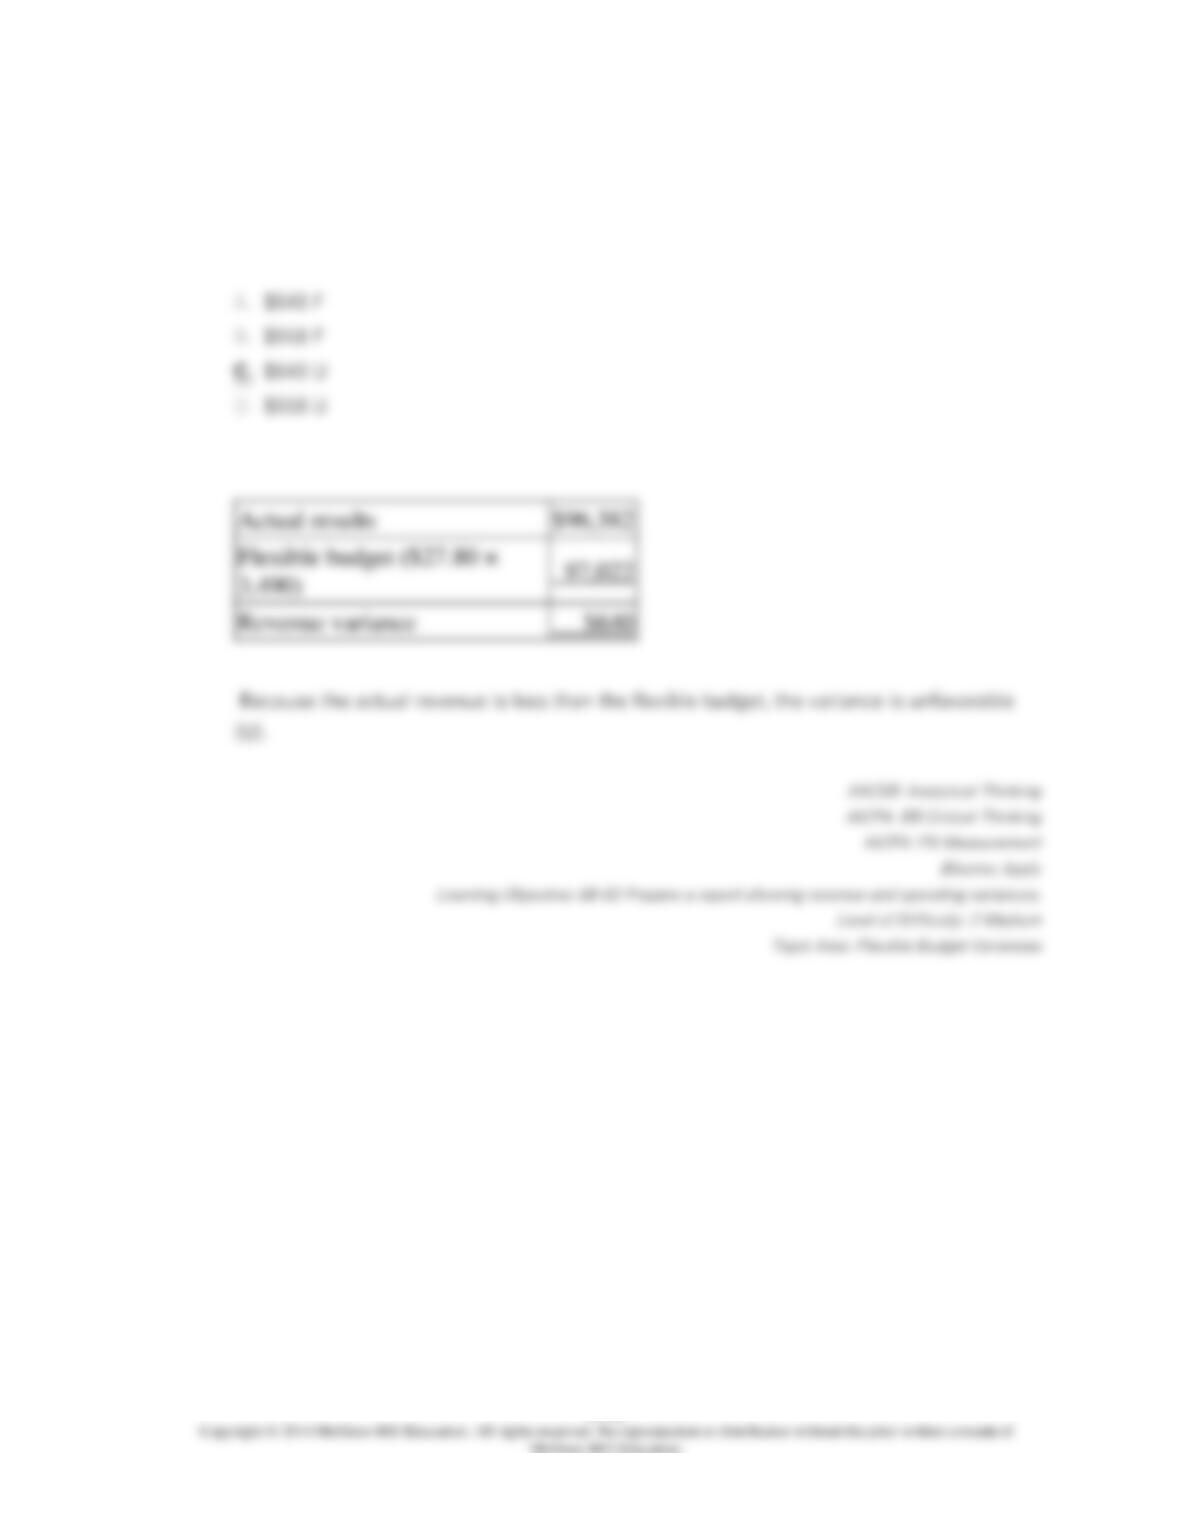
The revenue variance for February would be closest to:
8-739
217.
Smithj Kennel uses tenant-days as its measure of activity; an animal housed in the kennel
for one day is counted as one tenant-day. During February, the kennel budgeted for 3,500
tenant-days, but its actual level of activity was 3,490 tenant-days. The kennel has
provided the following data concerning the formulas used in its budgeting and its actual
results for February:
Data used in budgeting:
Fixed
element
per
month
Variable
element
per
tenant-
day
Revenue
−
$27.80
Wages and
salaries
$2,000
$5.10
Food and
supplies
1,100
9.10
Facility expenses
9,200
4.70
Administrative
expenses
7,600
0.40
Total expenses
$19,900
$19.30
Actual results for February:
Revenue
$96,382
Wages and salaries
$19,529
Food and supplies
$33,899
Facility expenses
$25,203
Administrative expenses
$8,956
The spending variance for food and supplies in February would be closest to:
8-740