101

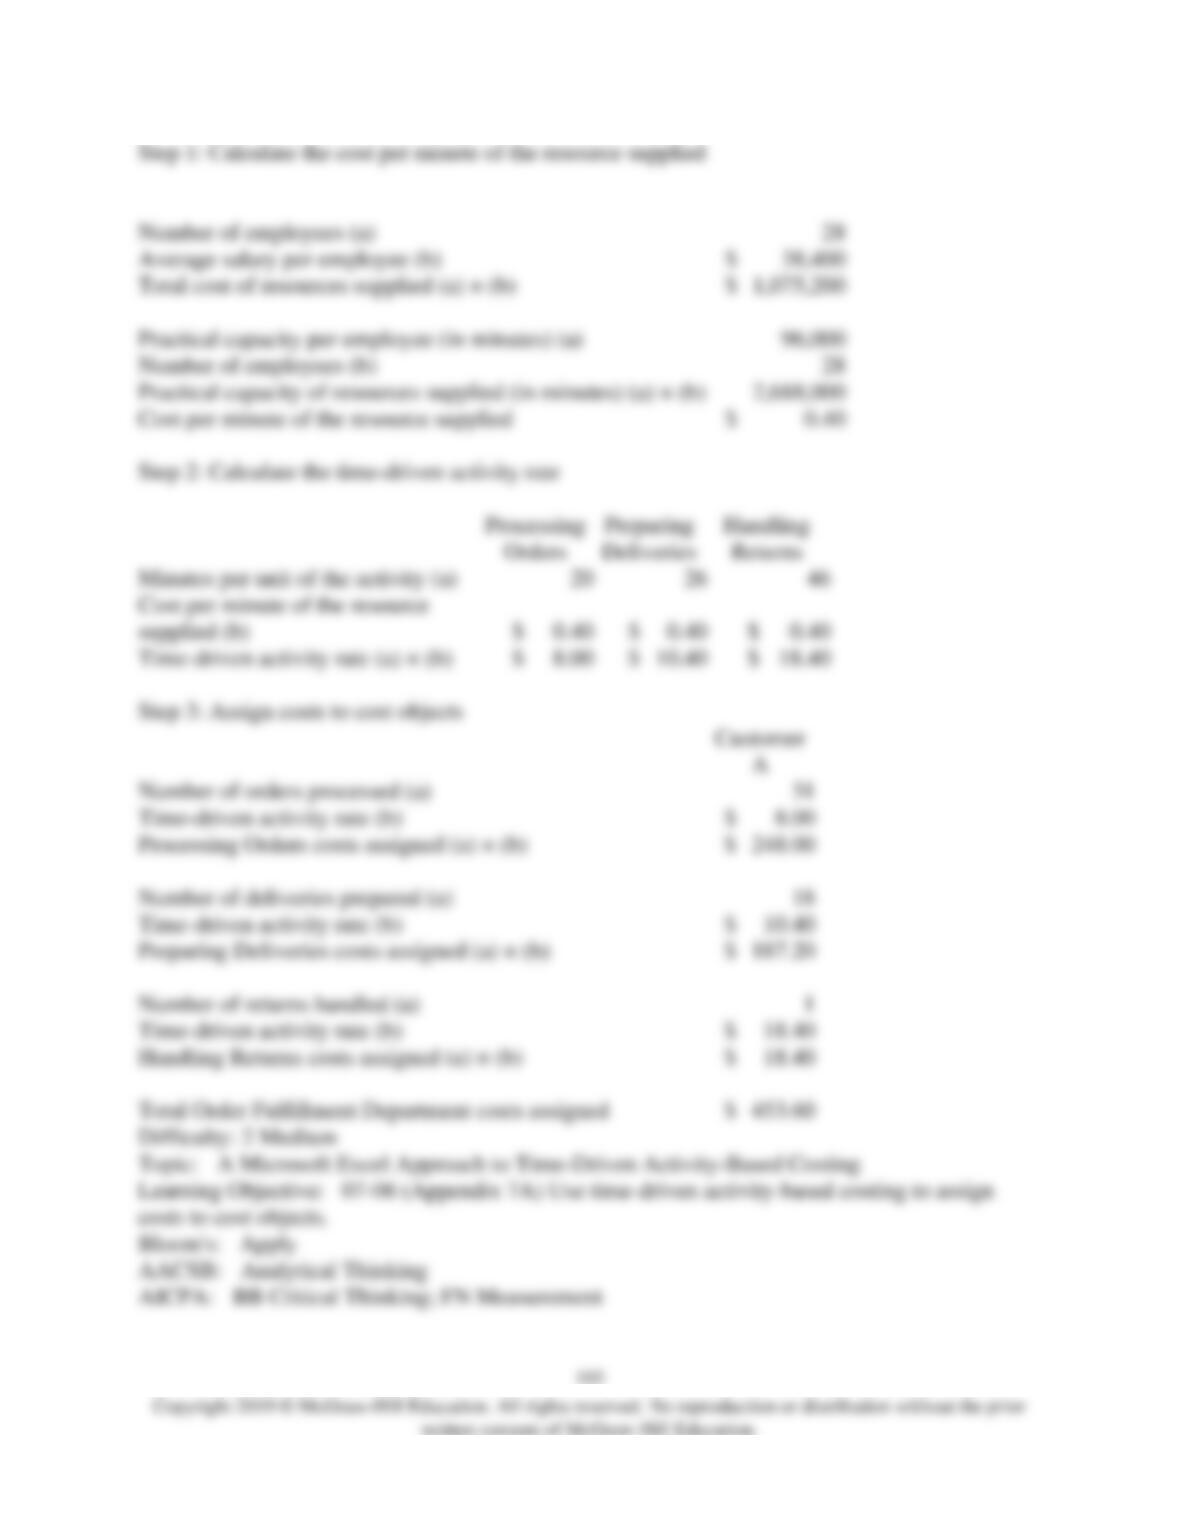
60) Lindenmuth Corporation is conducting a time-driven activity-based costing study in its Order
Fulfillment Department. The company has provided the following data to aid in that study:
Lindenmuth Corporation
Order Fulfillment Department
Data Inputs
Resource Data:
Number of employees
28
Average salary per employee
$
38,400
Weeks of employment per year
50
Minutes available per week (40 hours × 60 minutes)
2,400
Practical capacity percentage
80
%
–
Activity Data:
Processing
Orders
Preparing
Deliveries
Handling
Returns
Minutes per unit of the activity
20
26
46
–
Cost Object Data:
Customer A
Customer B
Customer C
Number of orders processed
31
19
8
Number of deliveries prepared
18
10
7
Number of returns handled
1
1
1
–
On the Customer Cost Analysis report in time-driven activity-based costing, the total cost
assigned to Customer A would be closest to:
A) $248.00
B) $453.60
C) $187.20
D) $18.40
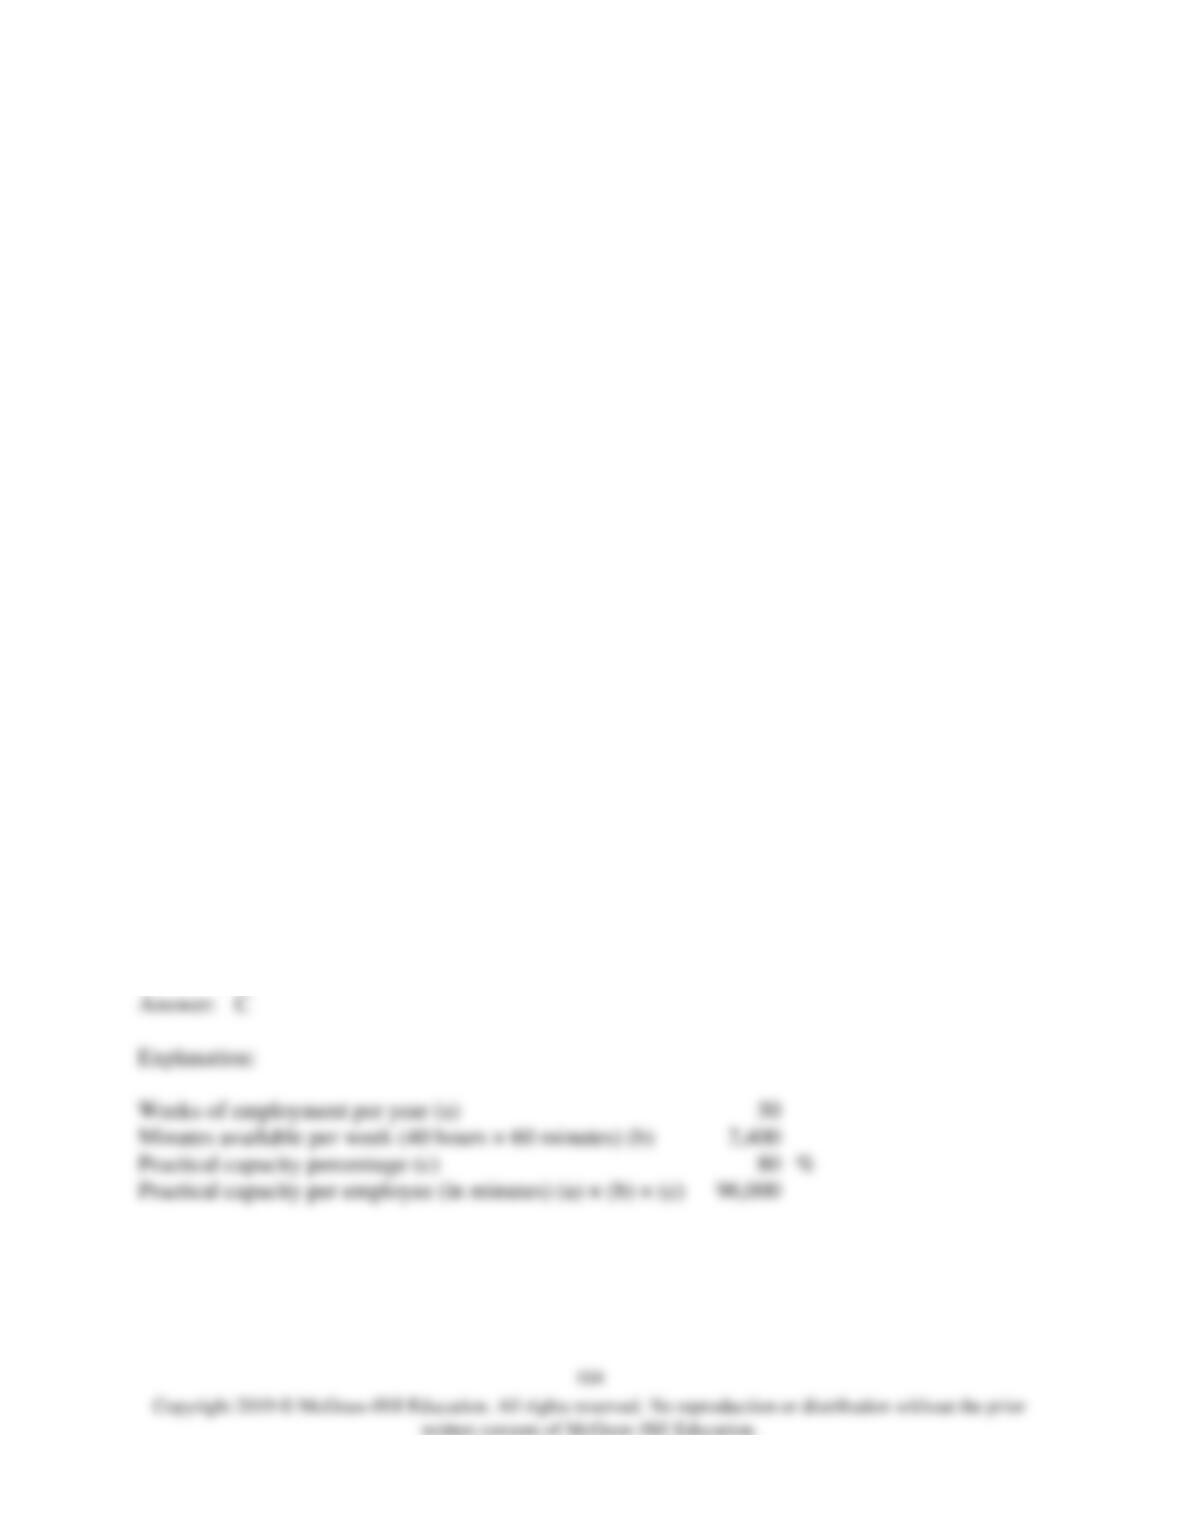
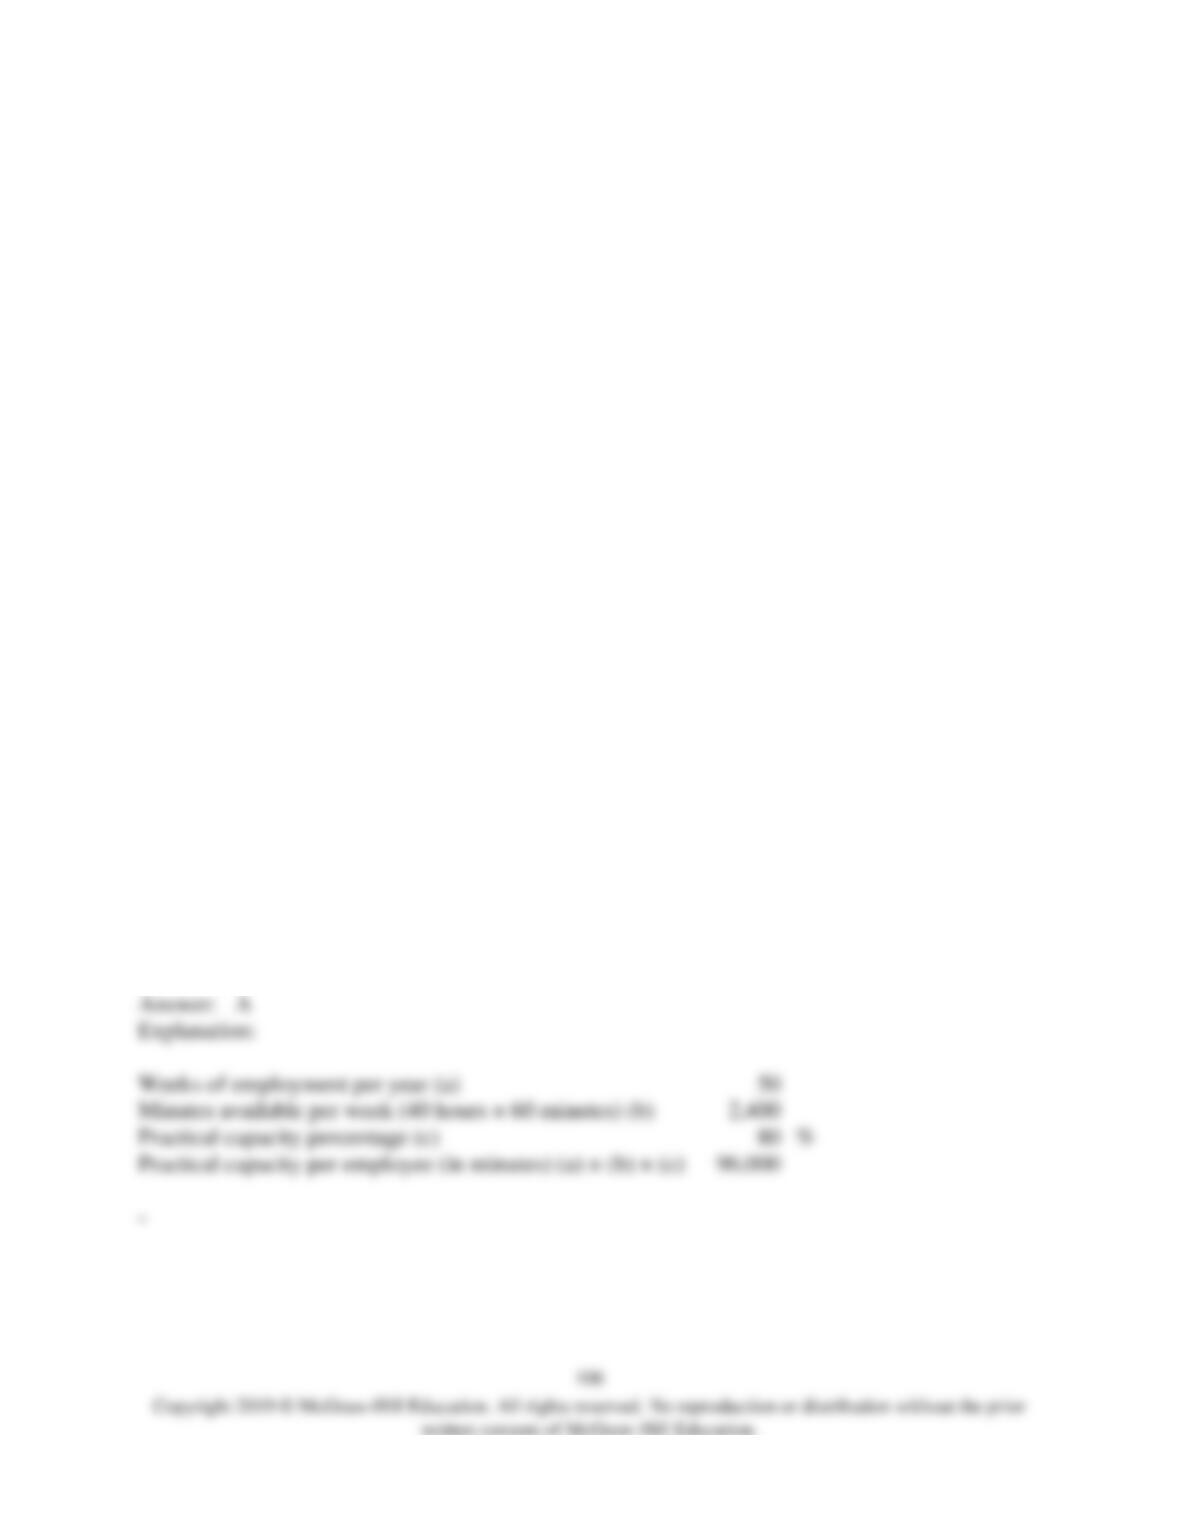
Weeks of employment per year (a)
Minutes available per week (40 hours × 60 minutes) (b)
Practical capacity percentage (c)
Practical capacity per employee (in minutes) (a) × (b) × (c)
–
61) Lindenmuth Corporation is conducting a time-driven activity-based costing study in its Order
Fulfillment Department. The company has provided the following data to aid in that study:
Lindenmuth Corporation
Order Fulfillment Department
Data Inputs
Resource Data:
Number of employees
28
Average salary per employee
$
38,400
Weeks of employment per year
50
Minutes available per week (40 hours × 60 minutes)
2,400
Practical capacity percentage
80
%
–
Activity Data:
Processing
Orders
Preparing
Deliveries
Handling
Returns
Minutes per unit of the activity
20
26
46
–
Cost Object Data:
Customer A
Customer B
Customer C
Number of orders processed
31
19
8
Number of deliveries prepared
18
10
7
Number of returns handled
1
1
1
–
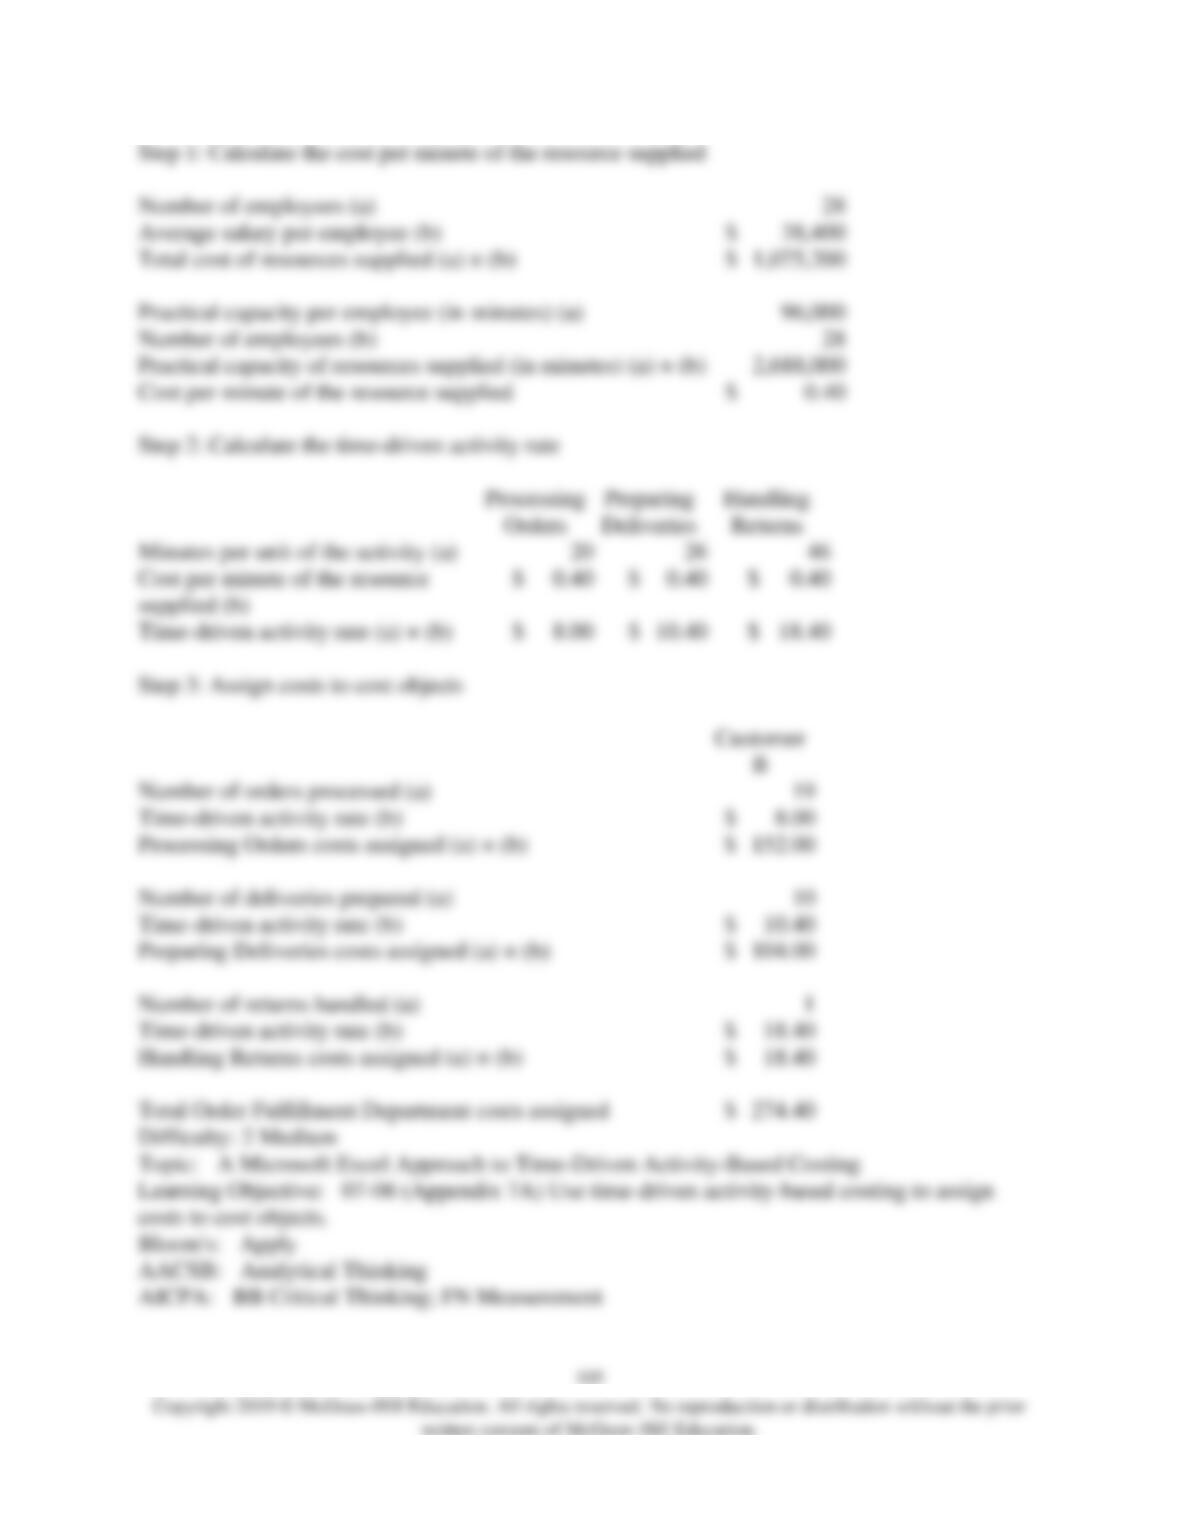
On the Customer Cost Analysis report in time-driven activity-based costing, the total cost
assigned to Customer B would be closest to:
A) $104.00
B) $152.00
C) $274.40
D) $18.40
Weeks of employment per year (a)
Minutes available per week (40 hours × 60 minutes) (b)
Practical capacity percentage (c)
Practical capacity per employee (in minutes) (a) × (b) × (c)
62) Lindenmuth Corporation is conducting a time-driven activity-based costing study in its Order
Fulfillment Department. The company has provided the following data to aid in that study:
Lindenmuth Corporation
Order Fulfillment Department
Data Inputs
Resource Data:
Number of employees
28
Average salary per employee
$
38,400
Weeks of employment per year
50
Minutes available per week (40 hours × 60 minutes)
2,400
Practical capacity percentage
80
%
–
Activity Data:
Processing
Orders
Preparing
Deliveries
Handling
Returns
Minutes per unit of the activity
20
26
46
–
Cost Object Data:
Customer A
Customer B
Customer C
Number of orders processed
31
19
8
Number of deliveries prepared
18
10
7
Number of returns handled
1
1
1
–
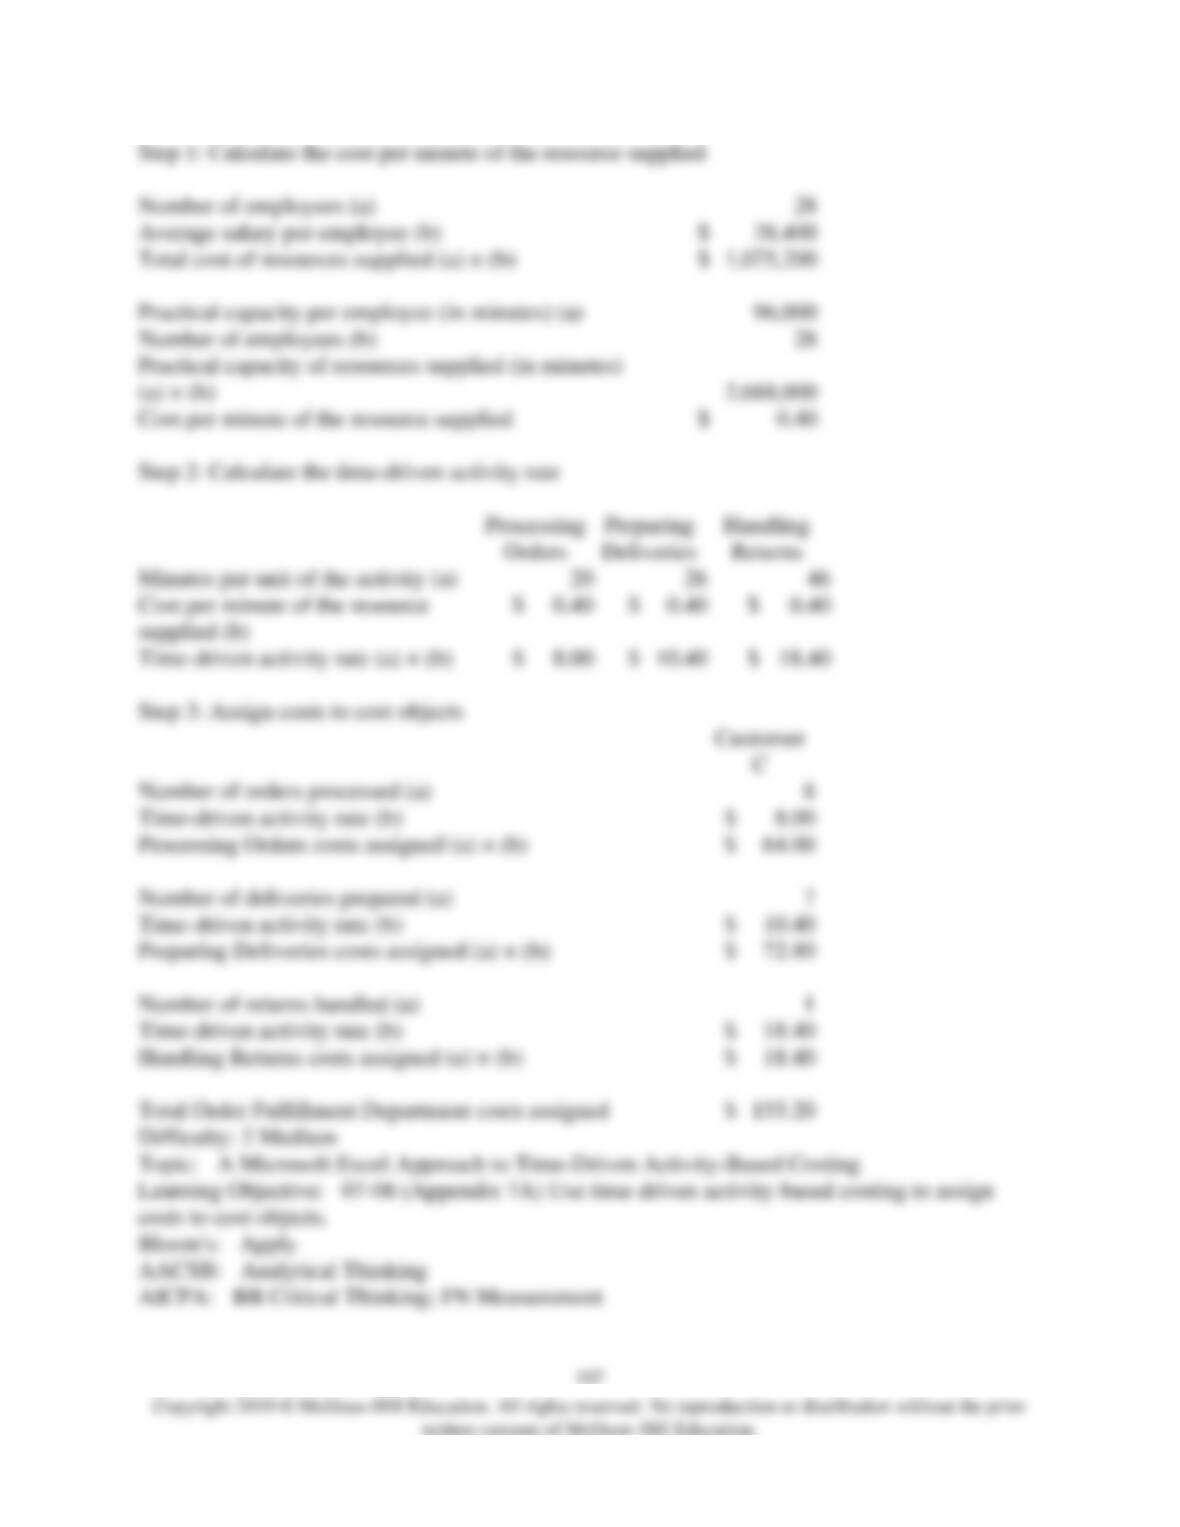
On the Customer Cost Analysis report in time-driven activity-based costing, the total cost
assigned to Customer C would be closest to:
A) $155.20
B) $64.00
C) $18.40
D) $72.80
Weeks of employment per year (a)
Minutes available per week (40 hours × 60 minutes) (b)
Practical capacity percentage (c)
Practical capacity per employee (in minutes) (a) × (b) × (c)
–

63) Krueger Corporation is conducting a time-driven activity-based costing study in its Customer
Support Department. The company has provided the following data to aid in that study:
Krueger Corporation
Customer Support Department
Data Inputs
Resource Data:
Number of employees
12
Average salary per employee
$
48,600
Weeks of employment per year
50
Minutes available per week (40 hours × 60 minutes)
2,400
Practical capacity percentage
90
%
–
Activity Data:
Receiving
Calls
Resolving
Issues
Settling
Disputes
Minutes per unit of the activity
14
26
40
–
Cost Object Data:
Customer S
Customer T
Customer U
Number of calls received
27
20
5
Number of issues resolved
15
12
8
Number of disputes settled
1
1
0
–
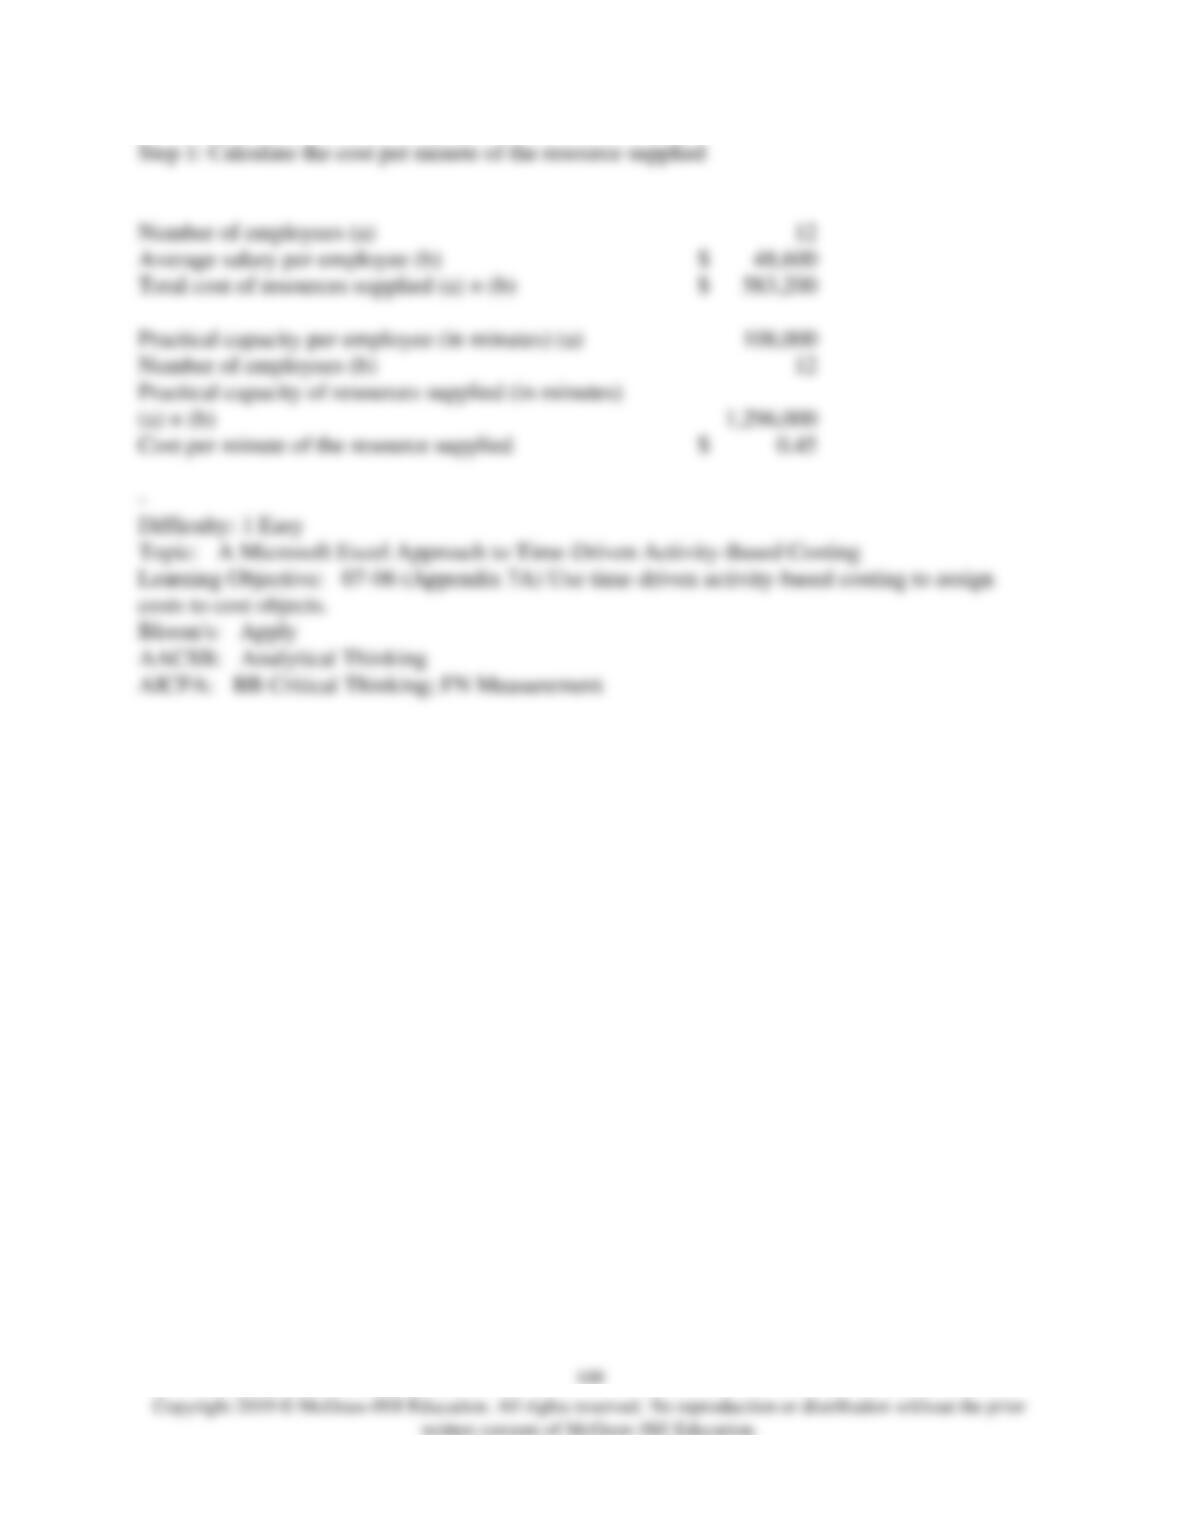
On the Customer Cost Analysis report in time-driven activity-based costing, the cost per minute
of the resource supplied would be closest to:
A) $0.45 per minute
B) $20.25 per minute
C) $0.41 per minute
D) $22.50 per minute
Weeks of employment per year (a)
Minutes available per week (40 hours × 60 minutes) (b)
Practical capacity percentage (c)
Practical capacity per employee (in minutes) (a) × (b) × (c)
–

64) Krueger Corporation is conducting a time-driven activity-based costing study in its Customer
Support Department. The company has provided the following data to aid in that study:
Krueger Corporation
Customer Support Department
Data Inputs
Resource Data:
Number of employees
12
Average salary per employee
$
48,600
Weeks of employment per year
50
Minutes available per week (40 hours × 60 minutes)
2,400
Practical capacity percentage
90
%
–
Activity Data:
Receiving
Calls
Resolving
Issues
Settling
Disputes
Minutes per unit of the activity
14
26
40
–
Cost Object Data:
Customer S
Customer T
Customer U
Number of calls received
27
20
5
Number of issues resolved
15
12
8
Number of disputes settled
1
1
0
–
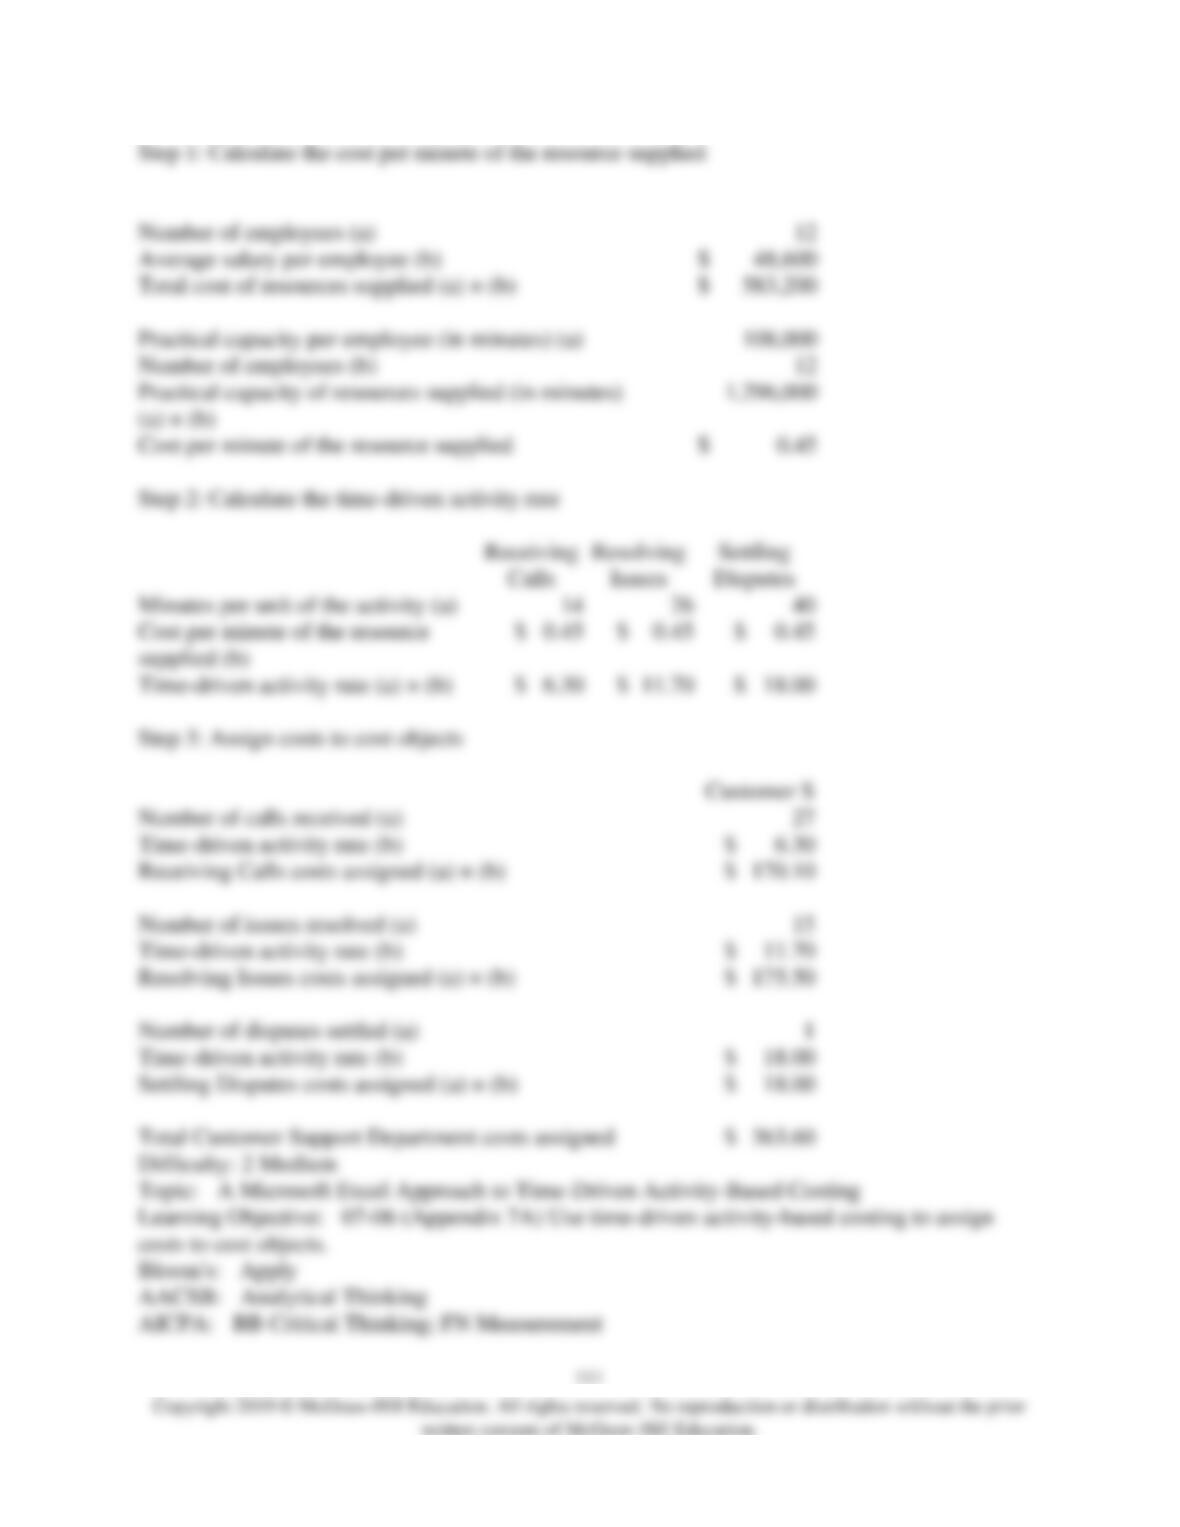
On the Customer Cost Analysis report in time-driven activity-based costing, the total cost
assigned to Customer S would be closest to:
A) $363.60
B) $18.00
C) $170.10
D) $175.50
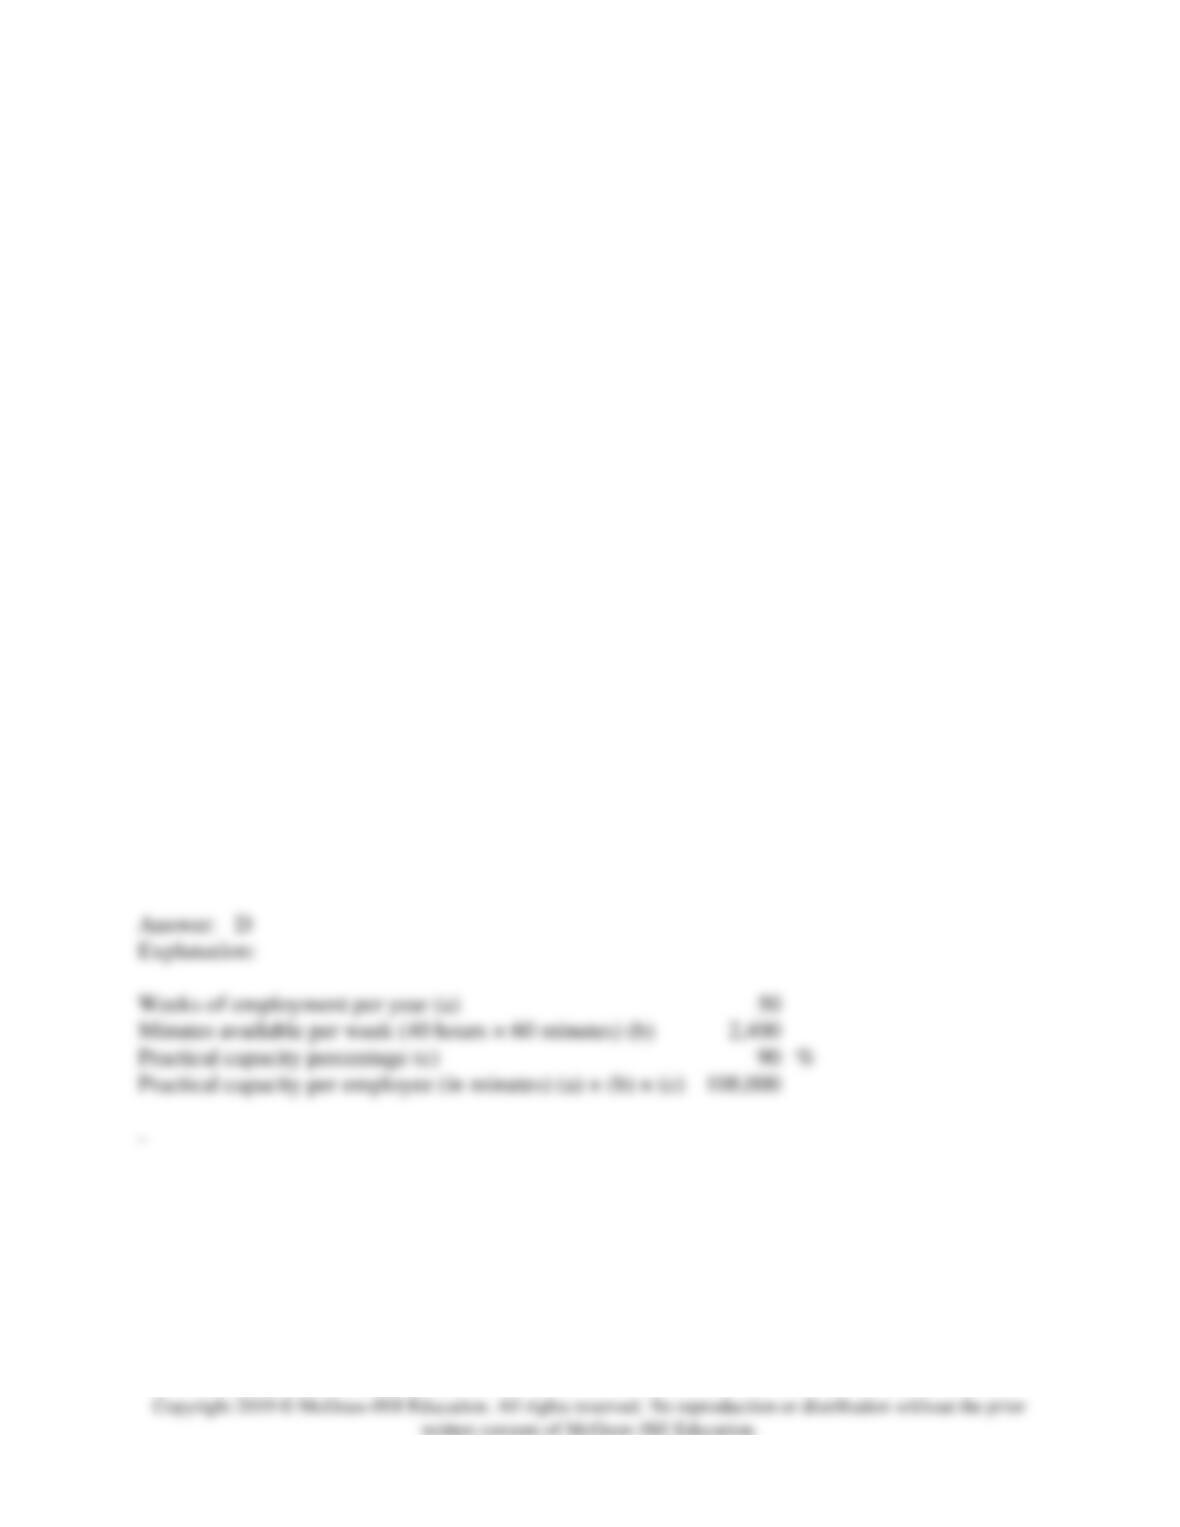
Weeks of employment per year (a)
Minutes available per week (40 hours × 60 minutes) (b)
Practical capacity percentage (c)
Practical capacity per employee (in minutes) (a) × (b) × (c)
–
112
65) Krueger Corporation is conducting a time-driven activity-based costing study in its Customer
Support Department. The company has provided the following data to aid in that study:
Krueger Corporation
Customer Support Department
Data Inputs
Resource Data:
Number of employees
12
Average salary per employee
$
48,600
Weeks of employment per year
50
Minutes available per week (40 hours × 60 minutes)
2,400
Practical capacity percentage
90
%
Activity Data:
Receiving
Calls
Resolving
Issues
Settling
Disputes
Minutes per unit of the activity
14
26
40
Cost Object Data:
Customer S
Customer T
Customer U
Number of calls received
27
20
5
Number of issues resolved
15
12
8
Number of disputes settled
1
1
0
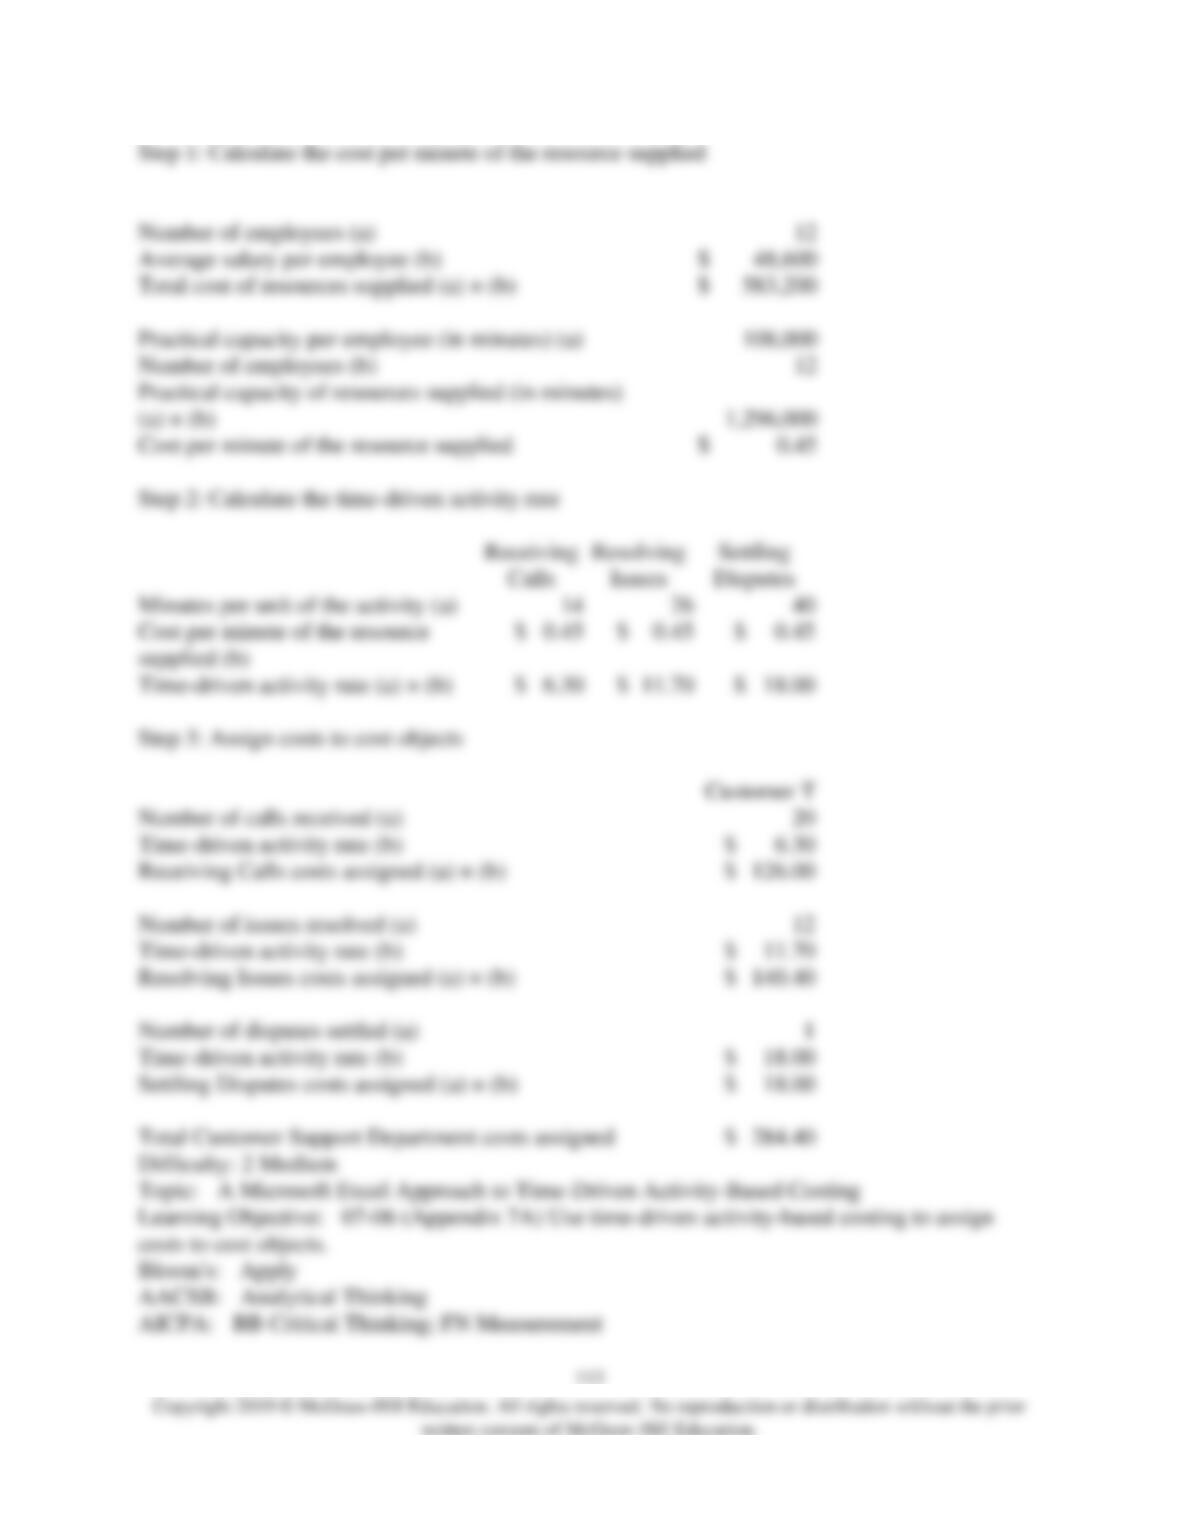
On the Customer Cost Analysis report in time-driven activity-based costing, the total cost
assigned to Customer T would be closest to:
A) $126.00
B) $140.40
C) $18.00
D) $284.40
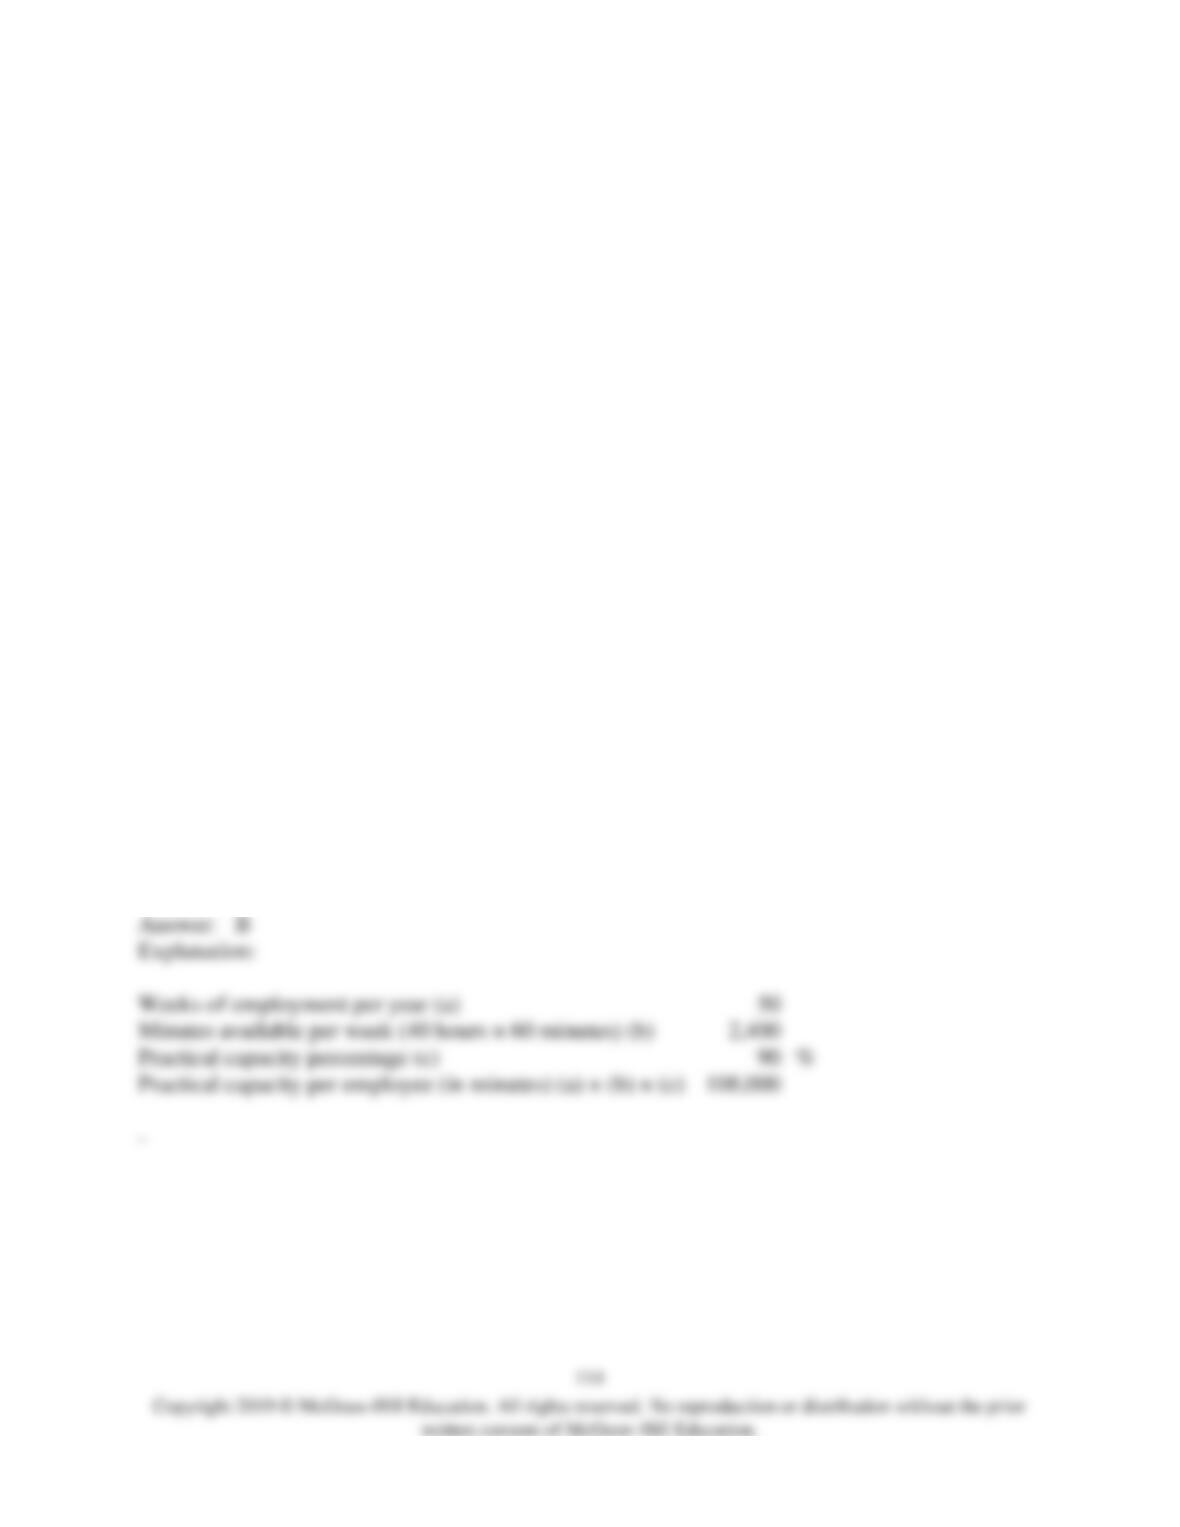
Weeks of employment per year (a)
Minutes available per week (40 hours × 60 minutes) (b)
2,400
Practical capacity percentage (c)
Practical capacity per employee (in minutes) (a) × (b) × (c)
–
66) Krueger Corporation is conducting a time-driven activity-based costing study in its Customer
Support Department. The company has provided the following data to aid in that study:
Krueger Corporation
Customer Support Department
Data Inputs
Resource Data:
Number of employees
12
Average salary per employee
$
48,600
Weeks of employment per year
50
Minutes available per week (40 hours × 60 minutes)
2,400
Practical capacity percentage
90
%
Activity Data:
Receiving
Calls
Resolving
Issues
Settling
Disputes
Minutes per unit of the activity
14
26
40
Cost Object Data:
Customer S
Customer T
Customer U
Number of calls received
27
20
5
Number of issues resolved
15
12
8
Number of disputes settled
1
1
0
On the Customer Cost Analysis report in time-driven activity-based costing, the total cost
assigned to Customer U would be closest to:
A) $93.60
B) $125.10
C) $0.00
D) $31.50
Weeks of employment per year (a)
Minutes available per week (40 hours × 60 minutes) (b)
2,400
Practical capacity percentage (c)
Practical capacity per employee (in minutes) (a) × (b) × (c)
–

67) Pierceall Corporation is conducting a time-driven activity-based costing study in its Tech
Support Department. The company has provided the following data to aid in that study:
Activity Data:
Routing Calls
Resolving
Problems
Preparing
Change
Orders
Minutes per unit of the activity
16
28
38
Cost Object Data:
Customer J
Customer K
Customer L
Number of calls received
25
24
3
Number of issues resolved
14
11
8
Number of disputes settled
0
0
1
The cost per minute of the resource supplied is $0.42.
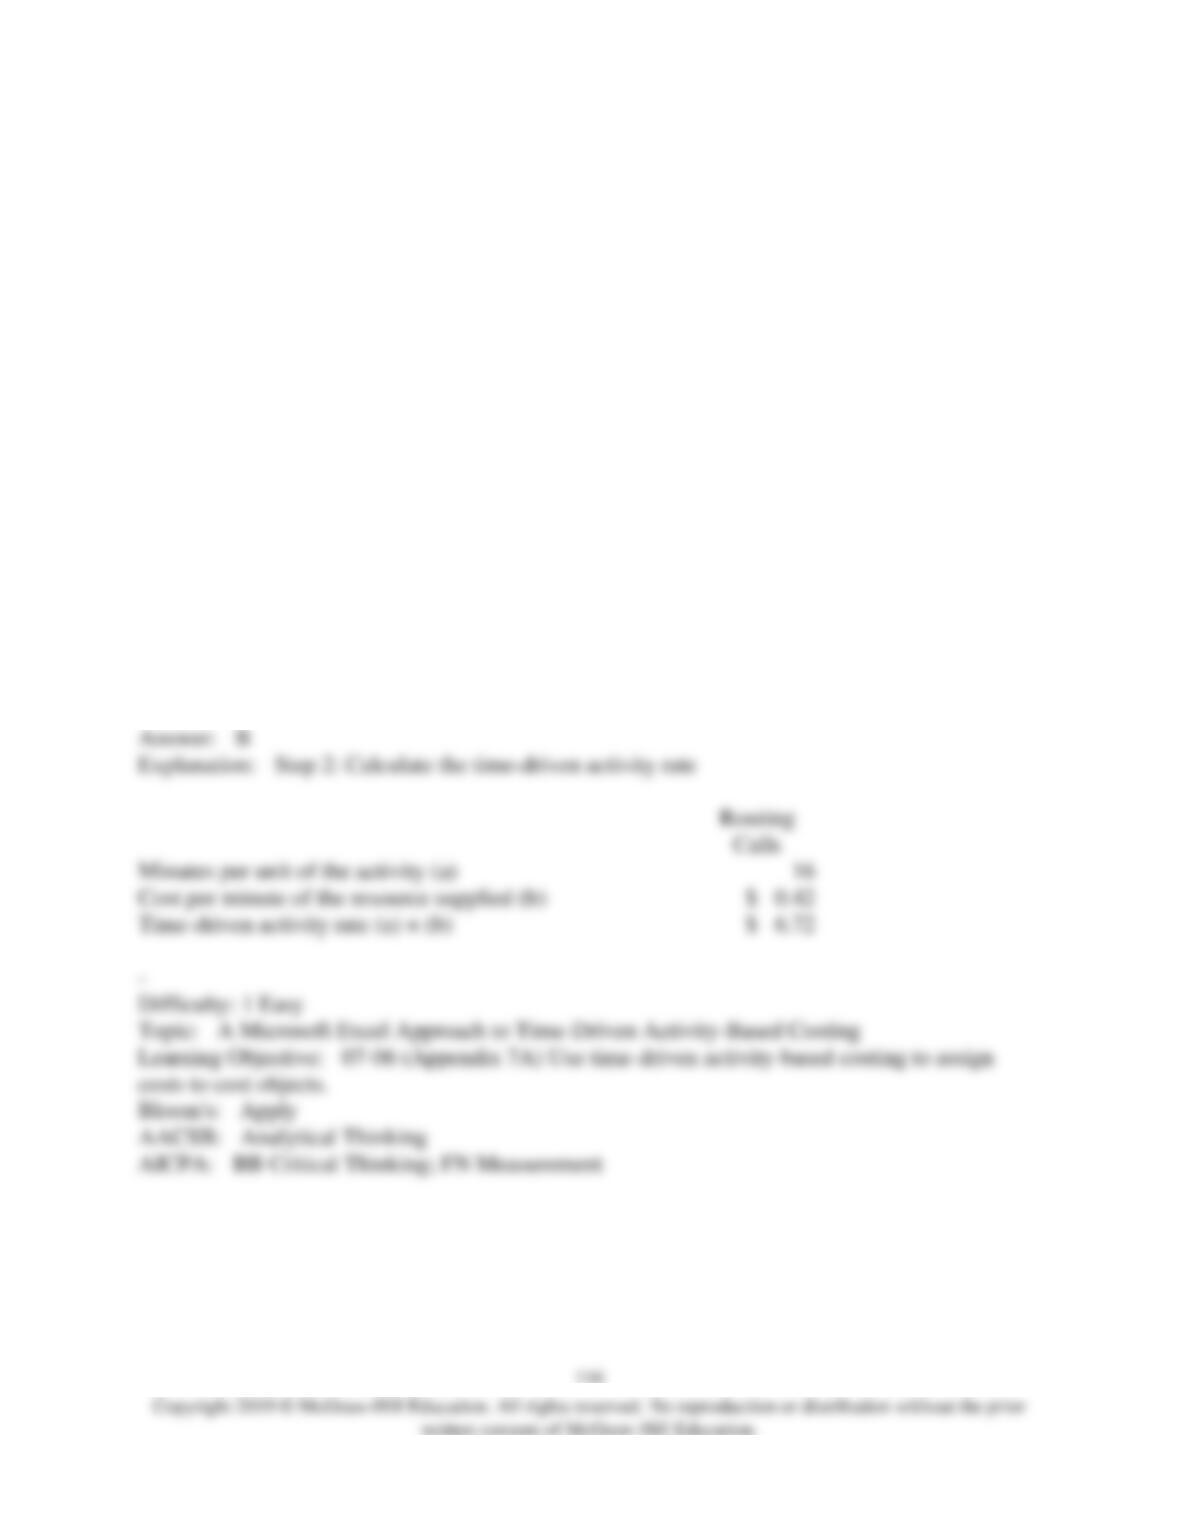
On the Customer Cost Analysis report in time-driven activity-based costing, the time-driven
activity rate for Routing Calls would be closest to:
A) $0.42 per call routed
B) $6.72 per call routed
C) $3.63 per call routed
D) $16.00 per call routed
Calls
Minutes per unit of the activity (a)
16
Cost per minute of the resource supplied (b)
Time-driven activity rate (a) × (b)
–
68) Pierceall Corporation is conducting a time-driven activity-based costing study in its Tech
Support Department. The company has provided the following data to aid in that study:
Activity Data:
Routing Calls
Resolving
Problems
Preparing
Change
Orders
Minutes per unit of the activity
16
28
38
–
Cost Object Data:
Customer J
Customer K
Customer L
Number of calls received
25
24
3
Number of issues resolved
14
11
8
Number of disputes settled
0
0
1
The cost per minute of the resource supplied is $0.42.
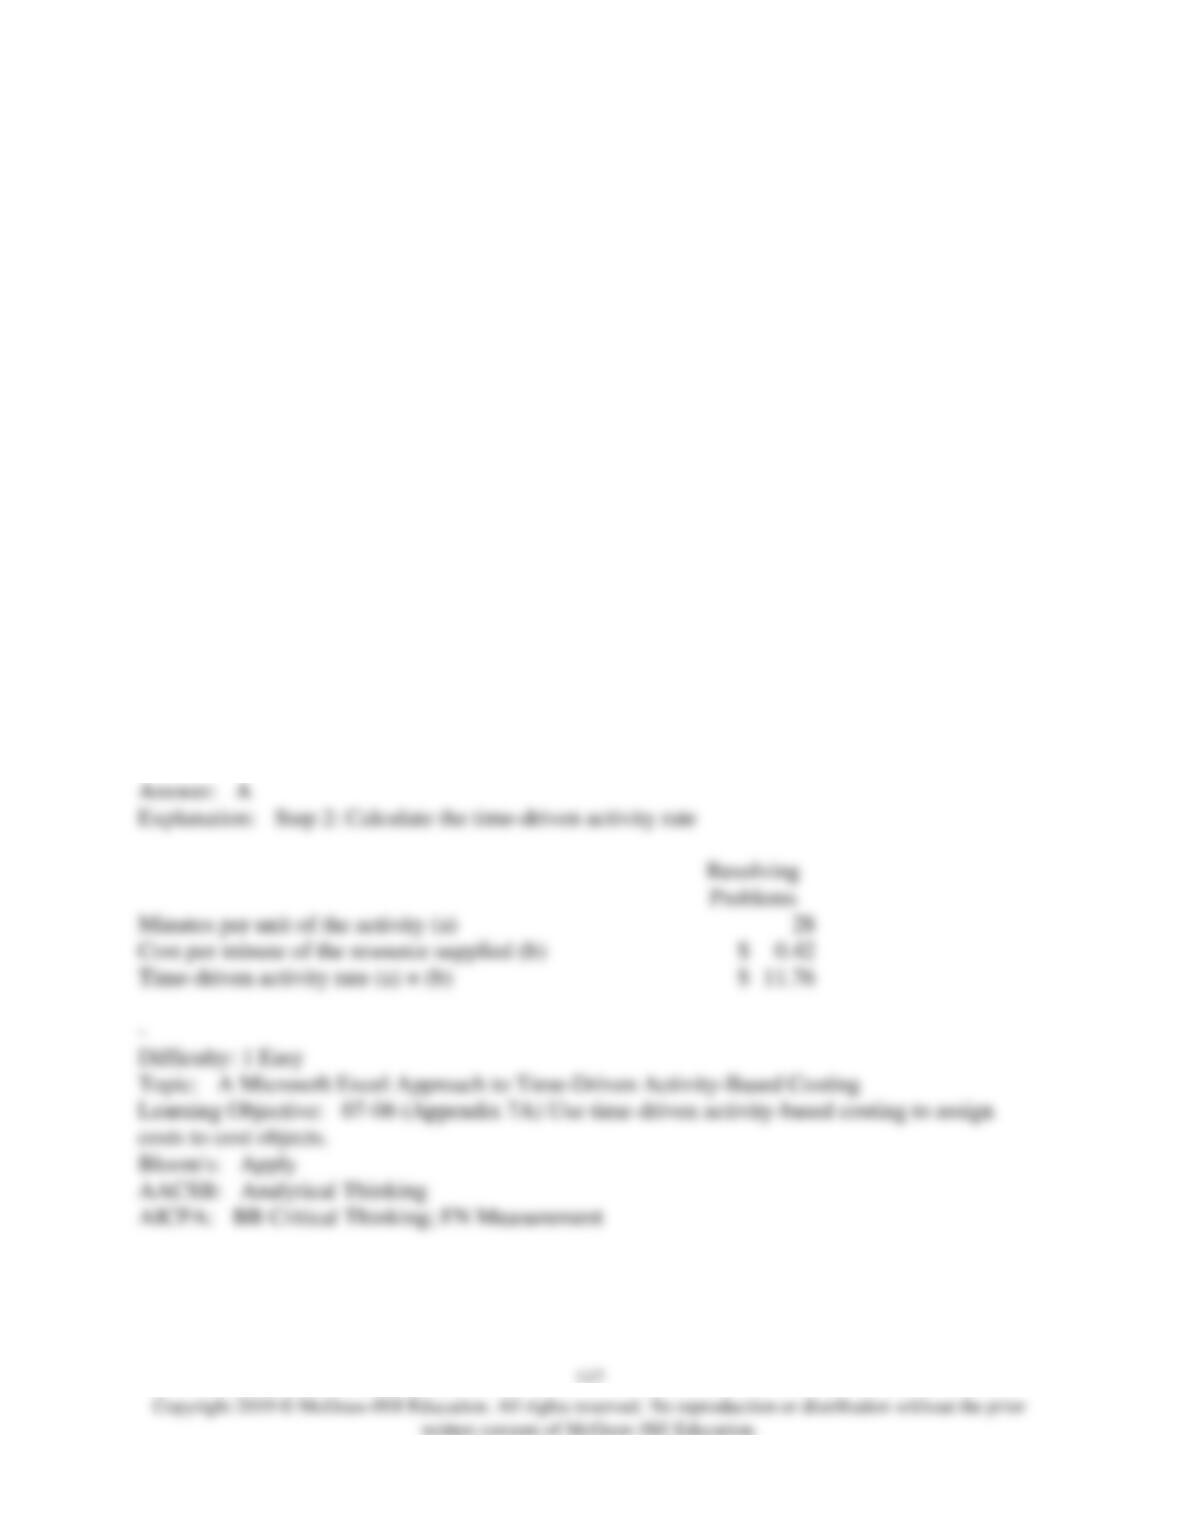
On the Customer Cost Analysis report in time-driven activity-based costing, the time-driven
activity rate for Resolving Problems would be closest to:
A) $11.76 per problem resolved
B) $28.00 per problem resolved
C) $0.42 per problem resolved
D) $1.50 per problem resolved
Minutes per unit of the activity (a)
Cost per minute of the resource supplied (b)
Time-driven activity rate (a) × (b)
–
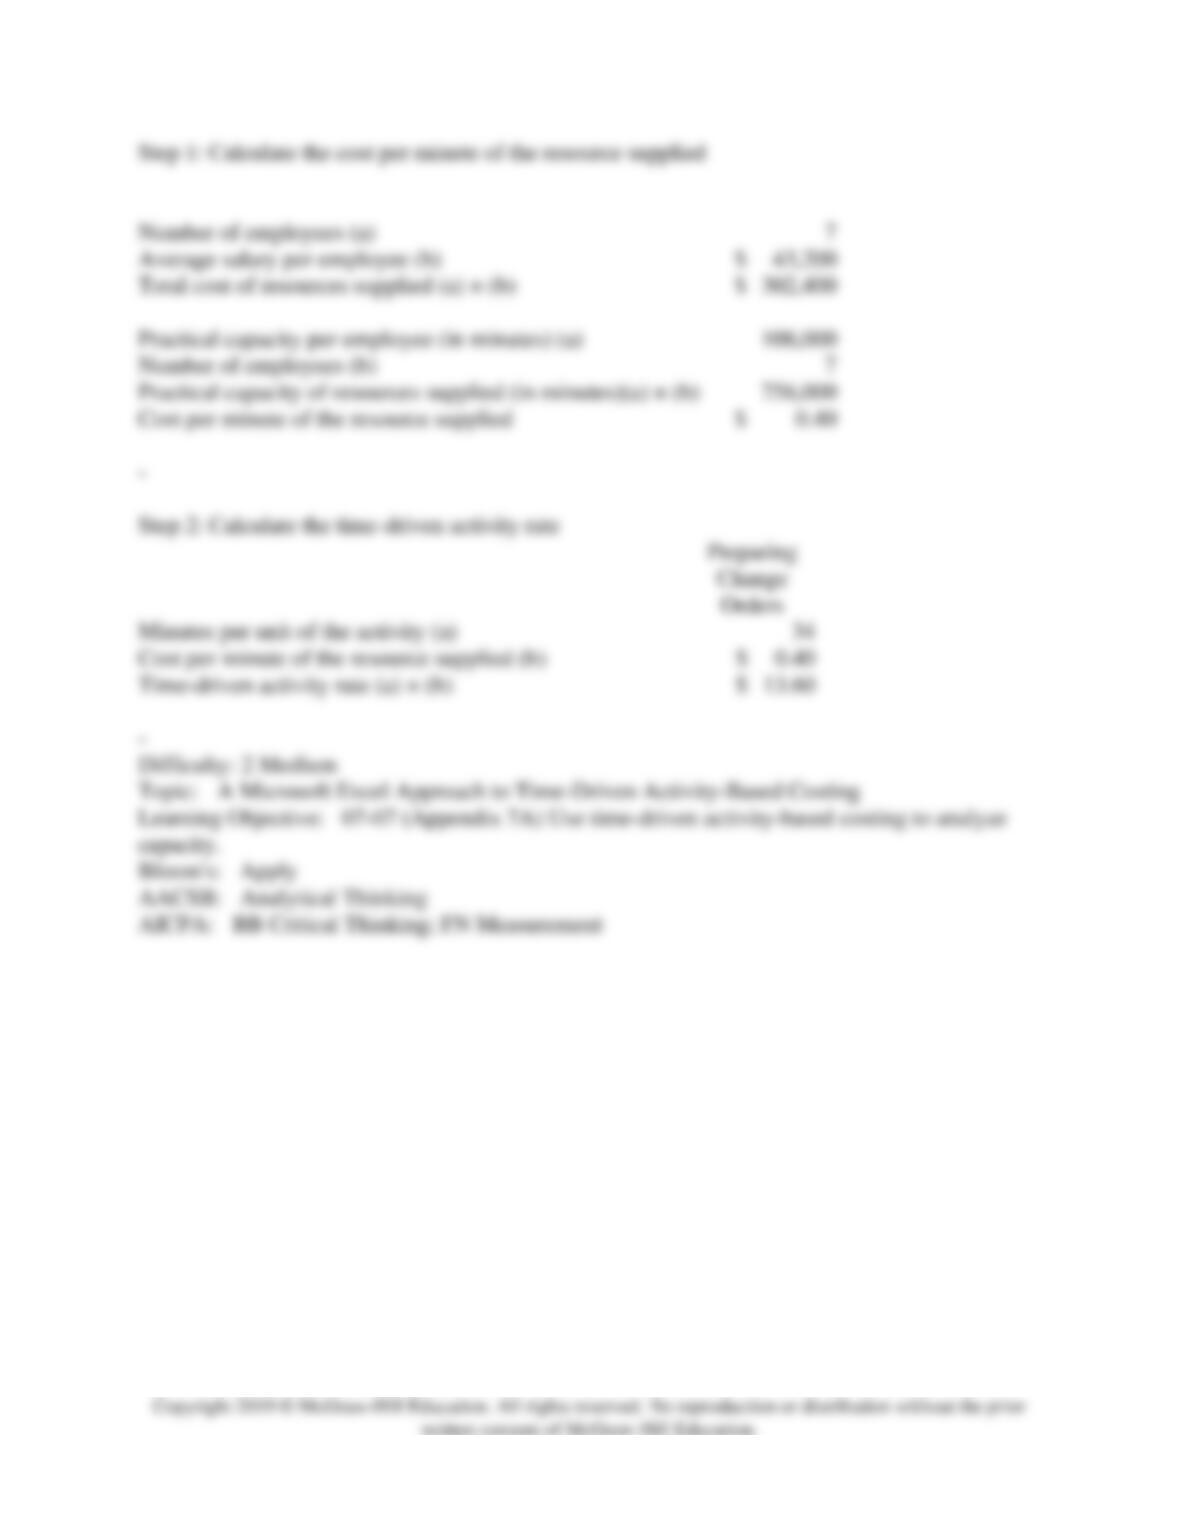
69) Pierceall Corporation is conducting a time-driven activity-based costing study in its Tech
Support Department. The company has provided the following data to aid in that study:
Activity Data:
Routing Calls
Resolving
Problems
Preparing
Change
Orders
Minutes per unit of the activity
16
28
38
–
Cost Object Data:
Customer J
Customer K
Customer L
Number of calls received
25
24
3
Number of issues resolved
14
11
8
Number of disputes settled
0
0
1
The cost per minute of the resource supplied is $0.42.
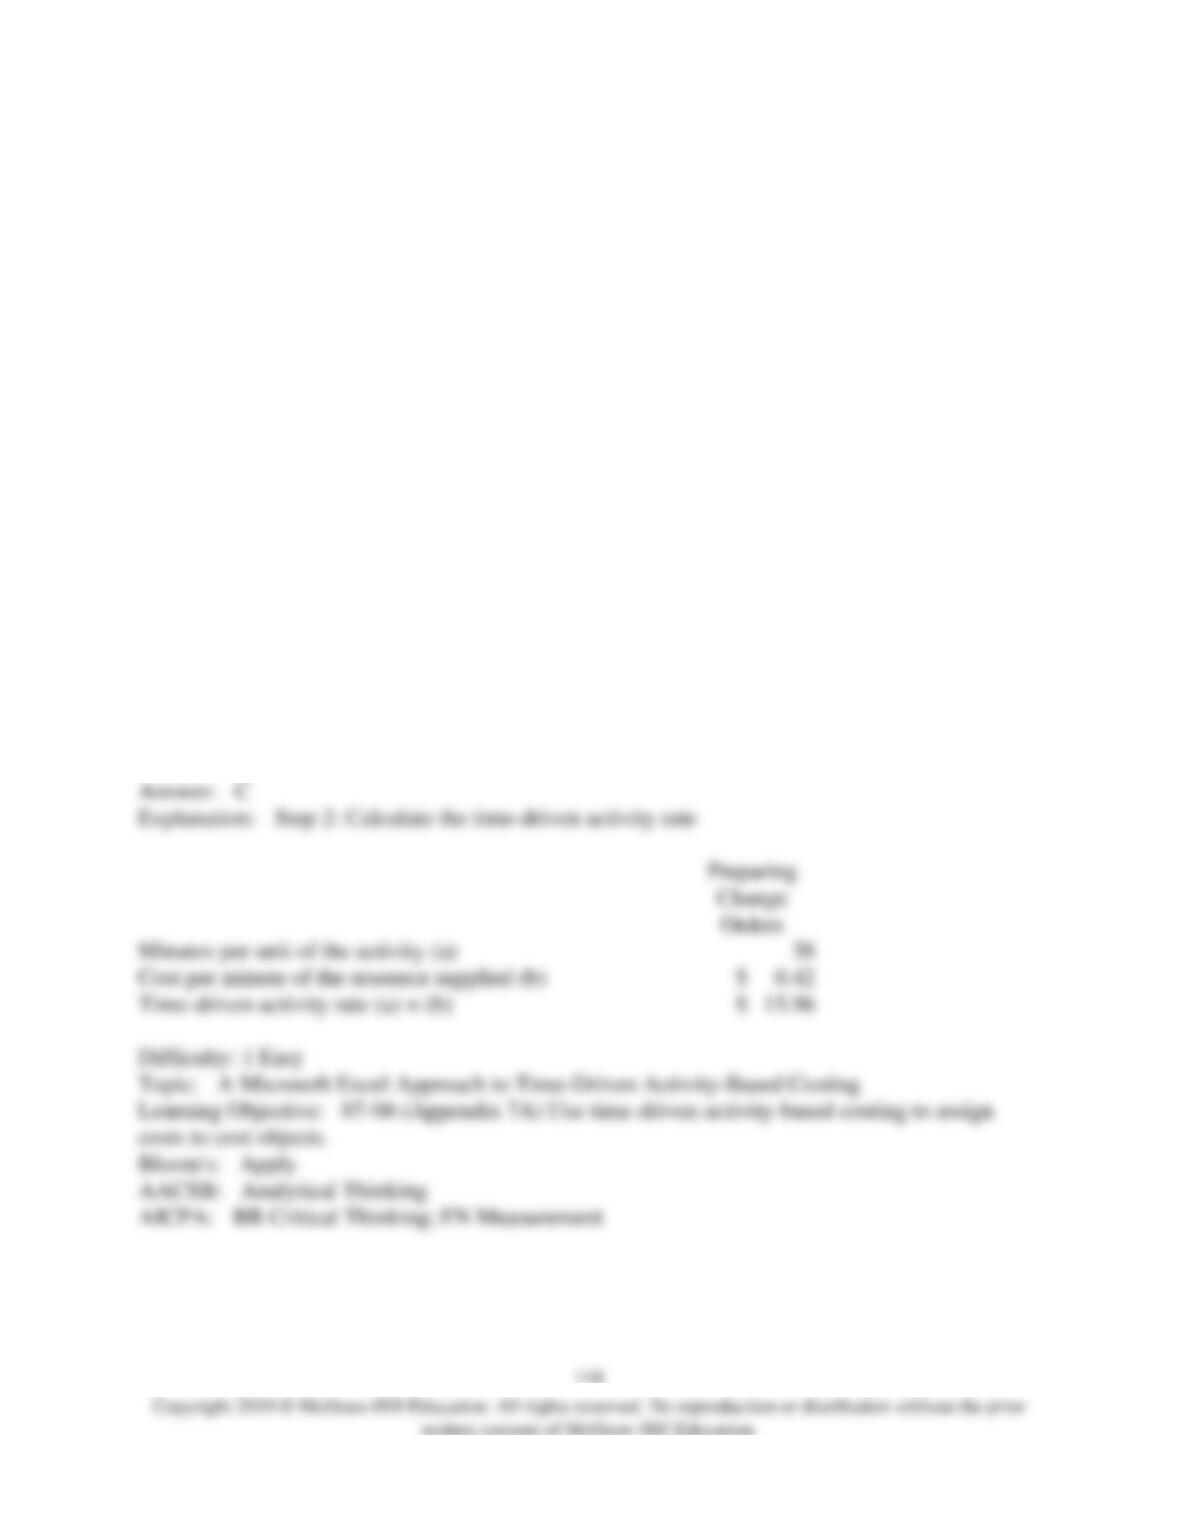
On the Customer Cost Analysis report in time-driven activity-based costing, the time-driven
activity rate for Preparing Change Orders would be closest to:
A) $0.42 per change order prepared
B) $1.11 per change order prepared
C) $15.96 per change order prepared
D) $38.00 per change order prepared
Minutes per unit of the activity (a)
Cost per minute of the resource supplied (b)
Time-driven activity rate (a) × (b)
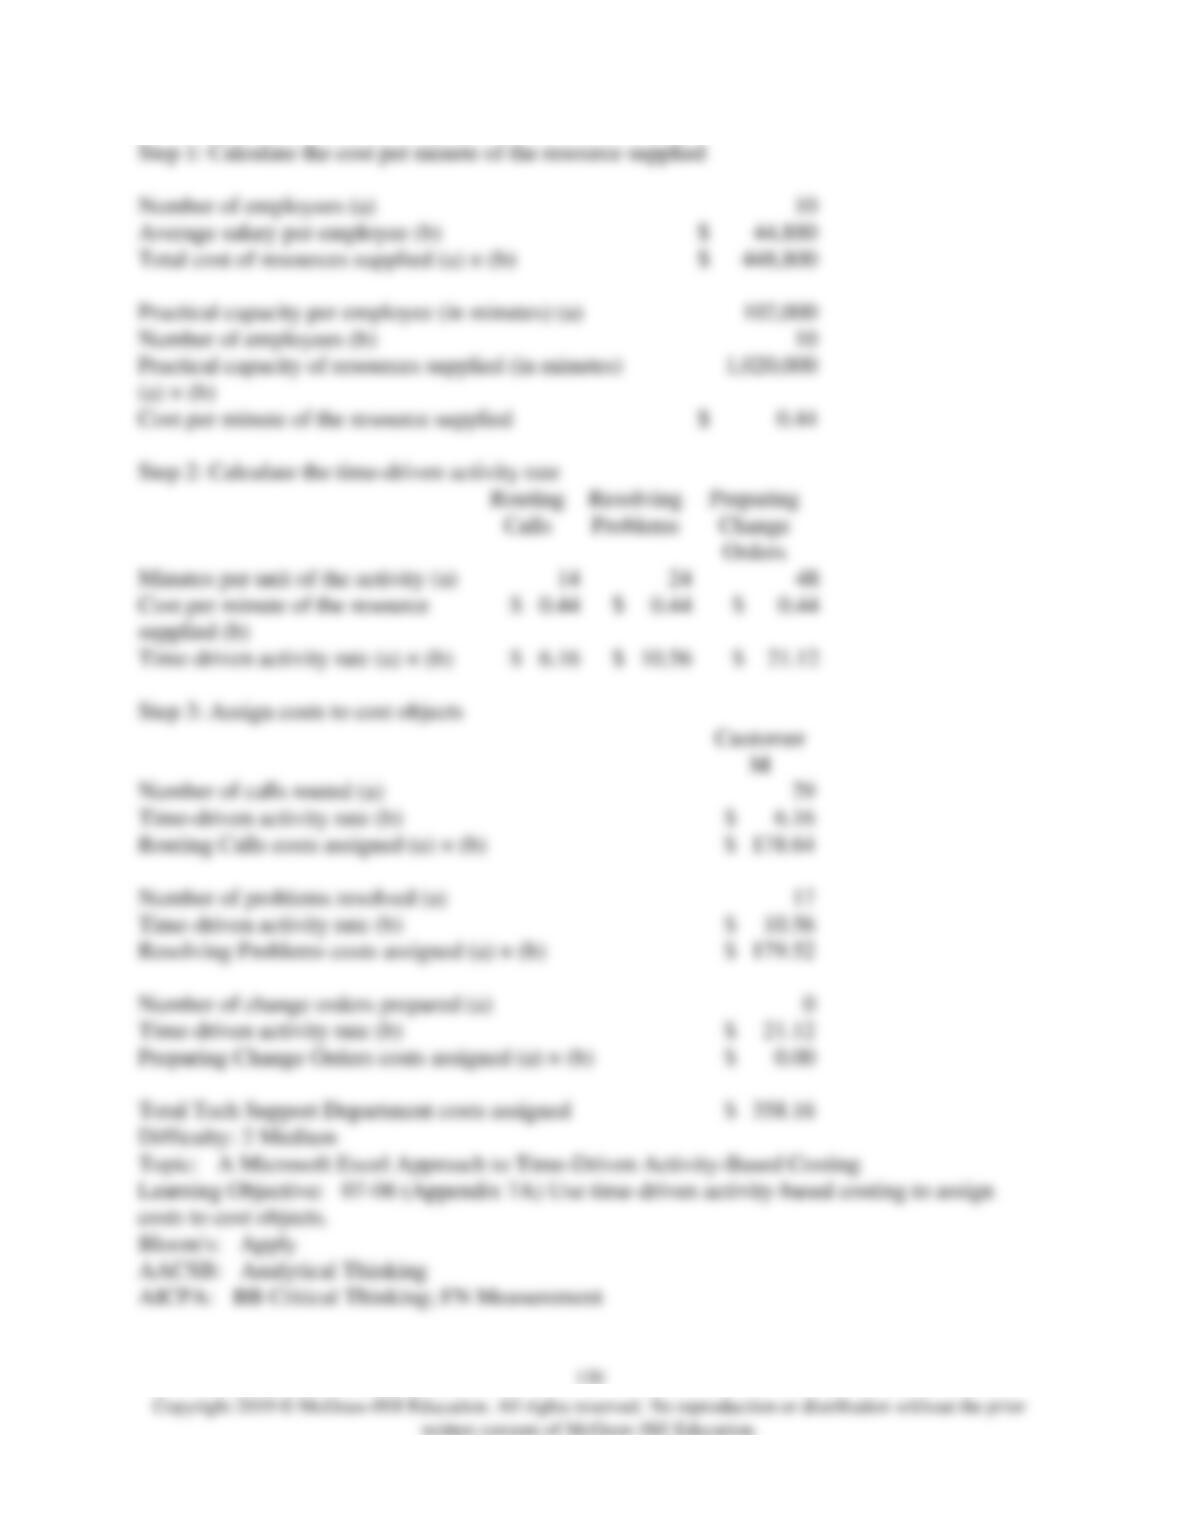
70) Callum Corporation is conducting a time-driven activity-based costing study in its Tech
Support Department. The company has provided the following data to aid in that study:
Callum Corporation
Tech Support Department
Data Inputs
Resource Data:
Number of employees
10
Average salary per employee
$
44,880
Weeks of employment per year
50
Minutes available per week (40 hours × 60 minutes)
2,400
Practical capacity percentage
85
%
Activity Data:
Routing Calls
Resolving
Problems
Preparing
Change
Orders
Minutes per unit of the activity
14
24
48
–
Cost Object Data:
Customer
M
Customer
N
Customer
O
All
Customers
Number of calls routed
29
21
6
14,210
Number of problems resolved
17
11
9
10,440
Number of change orders
prepared
0
1
0
410
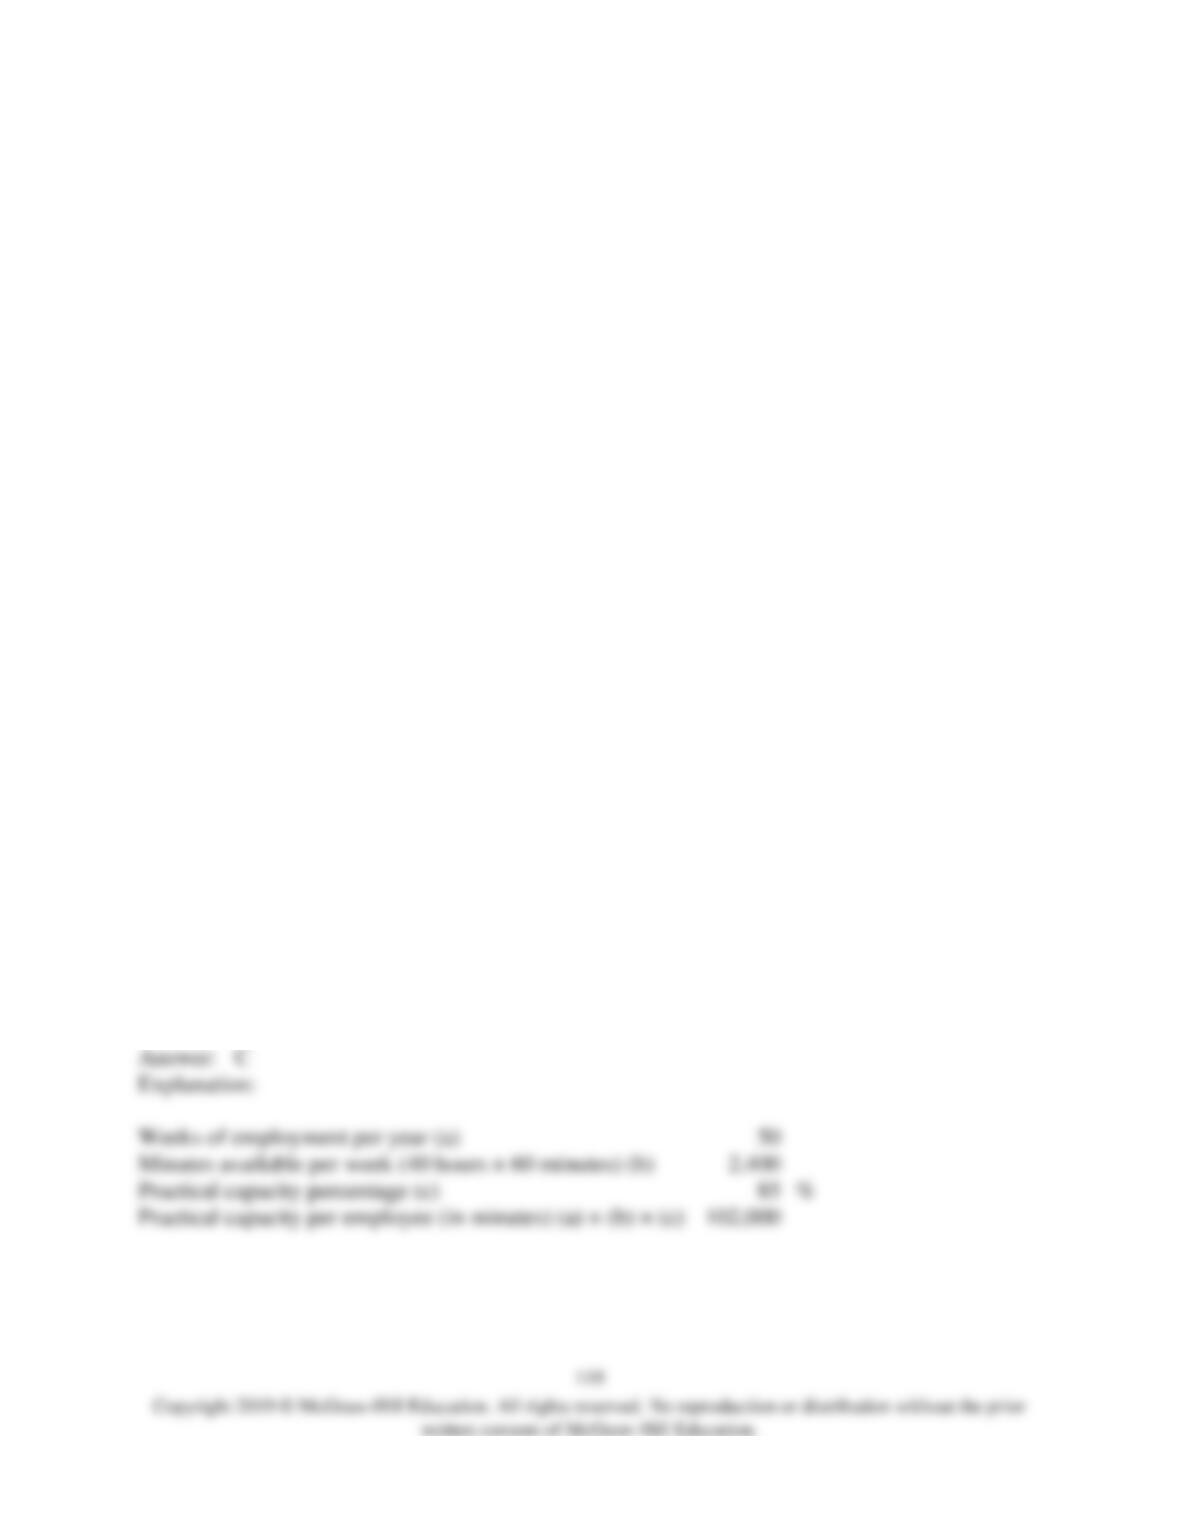
On the Customer Cost Analysis report in time-driven activity-based costing, the total cost
assigned to Customer M would be closest to:
A) $178.64
B) $0.00
C) $358.16
D) $179.52
Weeks of employment per year (a)
50
Minutes available per week (40 hours × 60 minutes) (b)
Practical capacity percentage (c)
85
Practical capacity per employee (in minutes) (a) × (b) × (c)