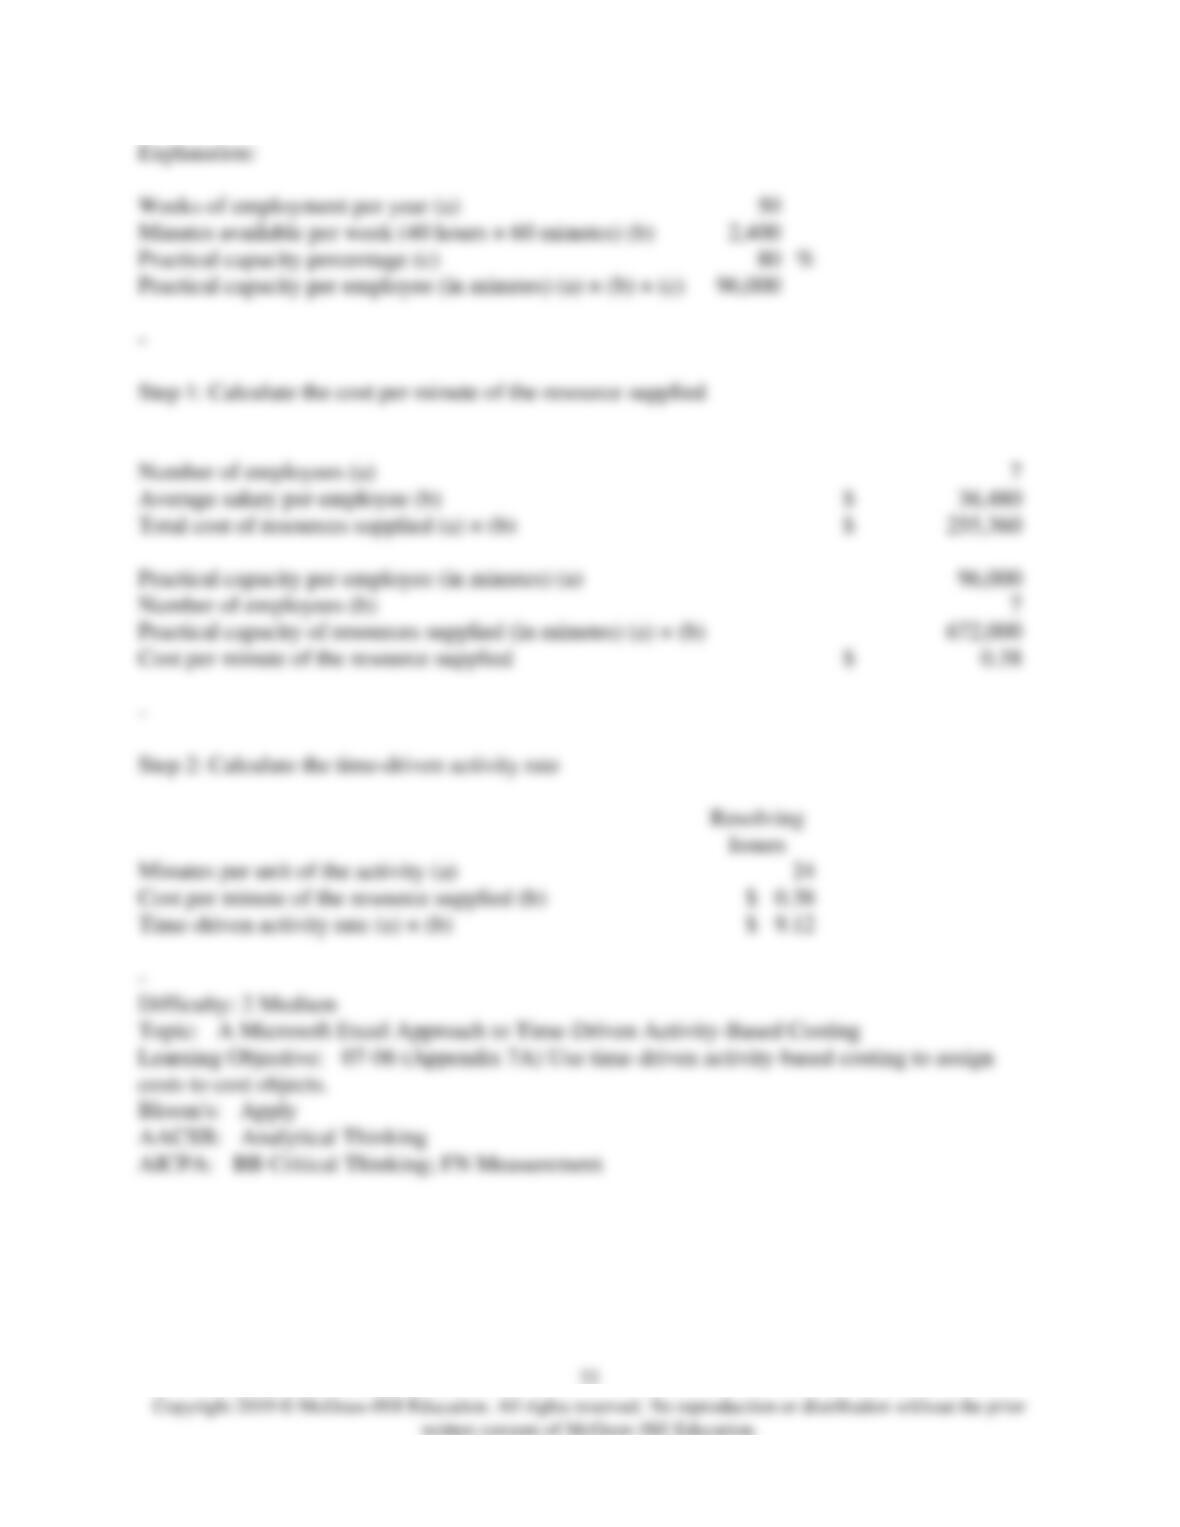
16) Mongiello Corporation is conducting a time-driven activity-based costing study in its
Customer Support Department. The company has provided the following data to aid in that
study:
Mongiello Corporation
Customer Support Department
Data Inputs
Resource Data:
Number of employees
7
Average salary per employee
$
36,480
Weeks of employment per year
50
Minutes available per week (40 hours × 60 minutes)
2,400
Practical capacity percentage
80
%
–
Activity Data:
Receiving
Calls
Resolving
Issues
Settling
Disputes
Minutes per unit of the activity
18
24
36
–
On the Customer Cost Analysis report in time-driven activity-based costing, the time-driven
activity rate for Resolving Issues would be closest to:
A) $9.12 per issue resolved
B) $0.38 per issue resolved
C) $24.00 per issue resolved
D) $1.58 per issue resolved
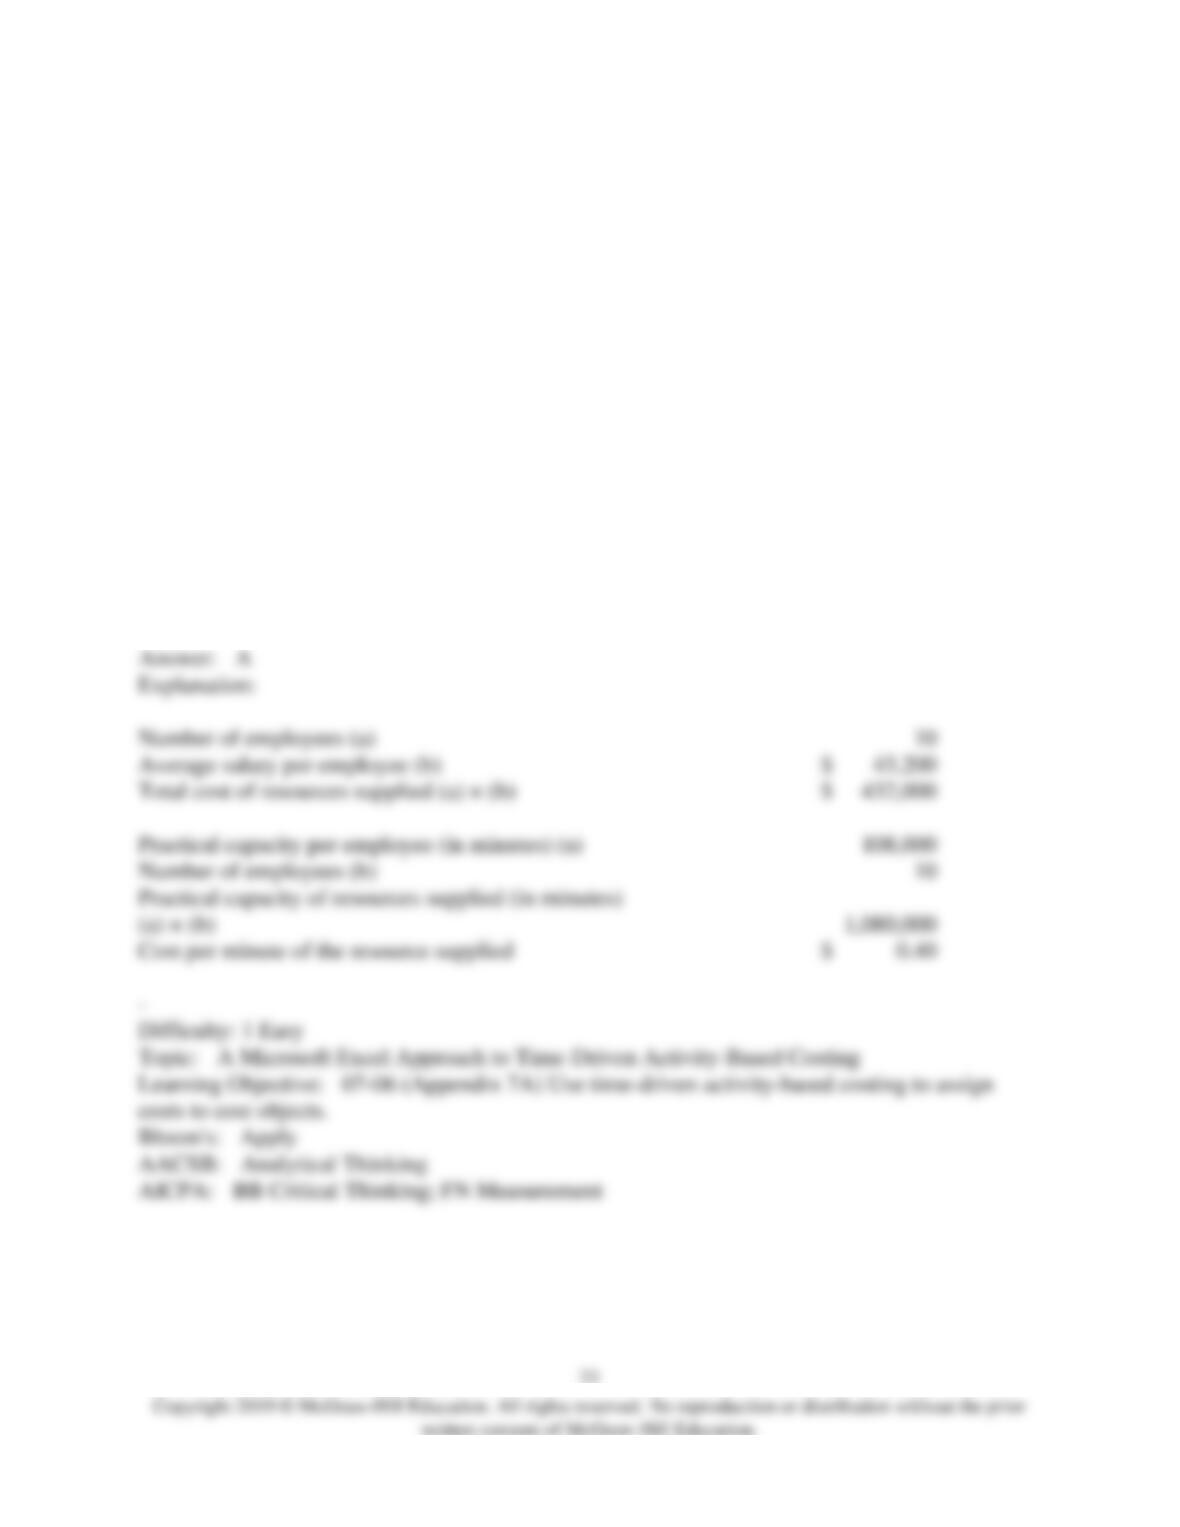
17) Stapel Corporation is conducting a time-driven activity-based costing study in its Customer
Service Department. The company has provided the following data to aid in that study:
Stapel Corporation
Customer Service Department
Data Inputs
Resource Data:
Number of employees
10
Average salary per employee
$
43,200
Practical capacity per employee (in minutes)
108,000
–
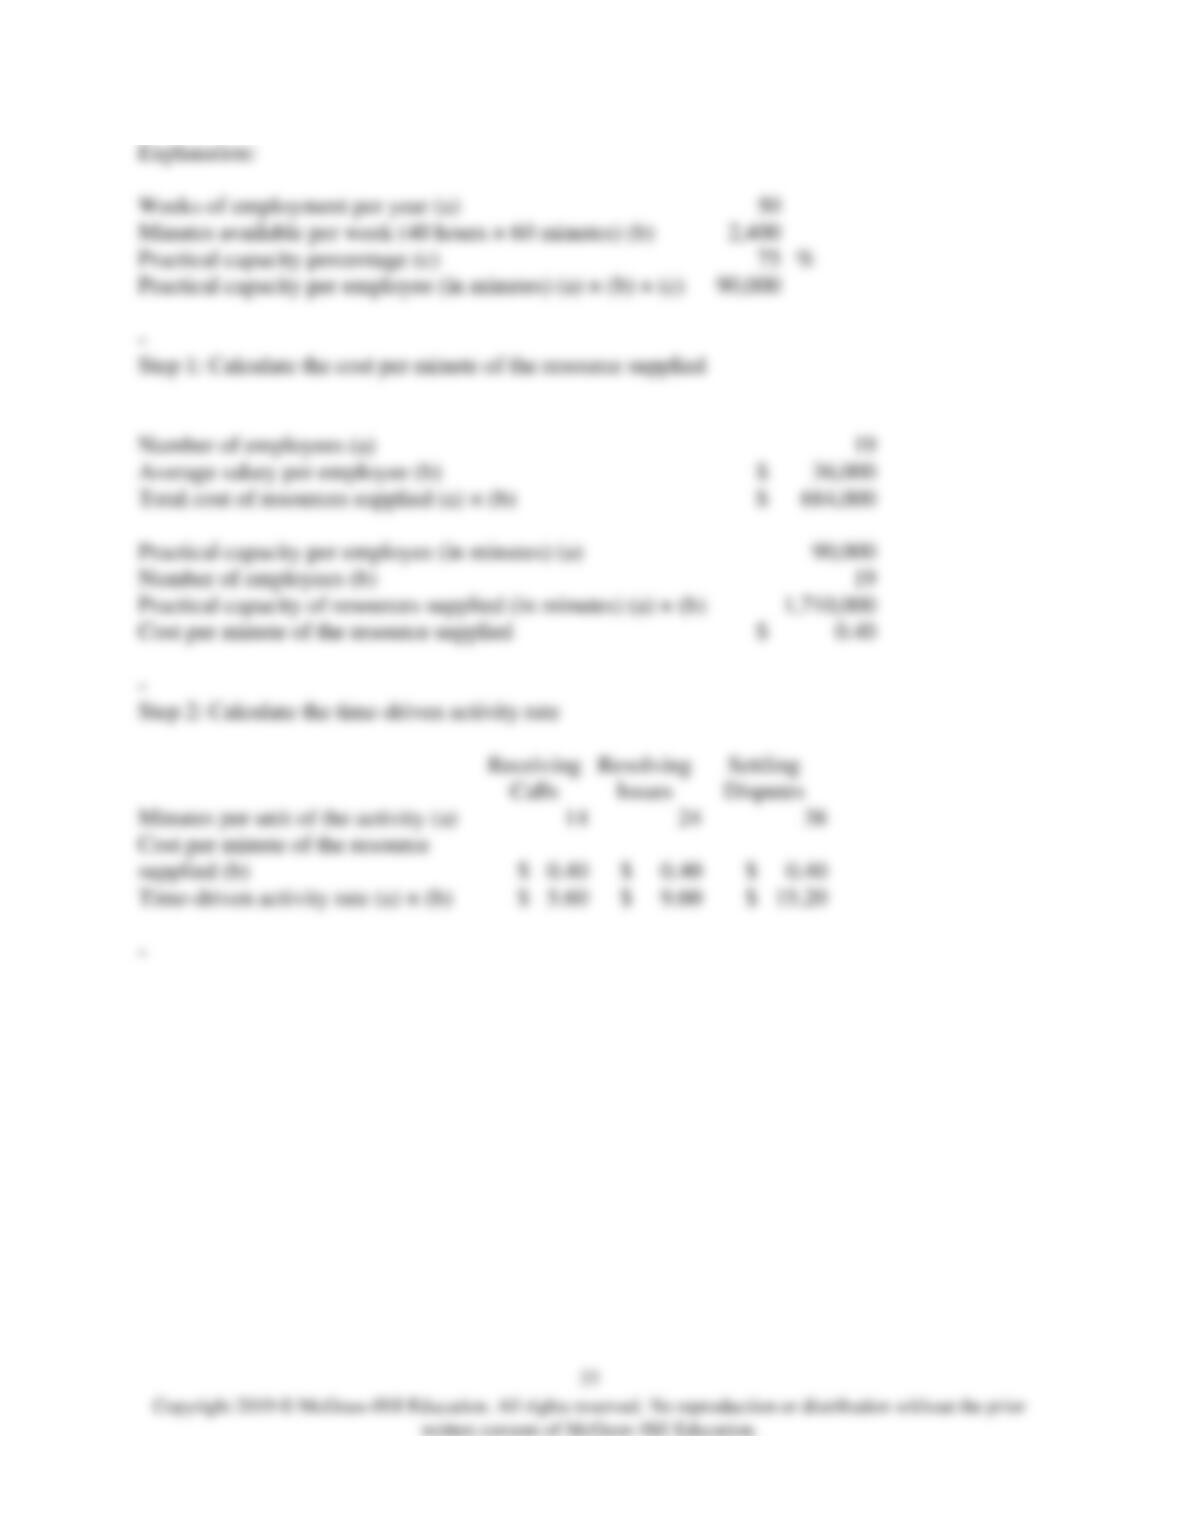
On the Customer Cost Analysis report in time-driven activity-based costing, the cost per minute
of the resource supplied would be closest to:
A) $0.40 per minute
B) $20.00 per minute
C) $0.36 per minute
D) $18.00 per minute
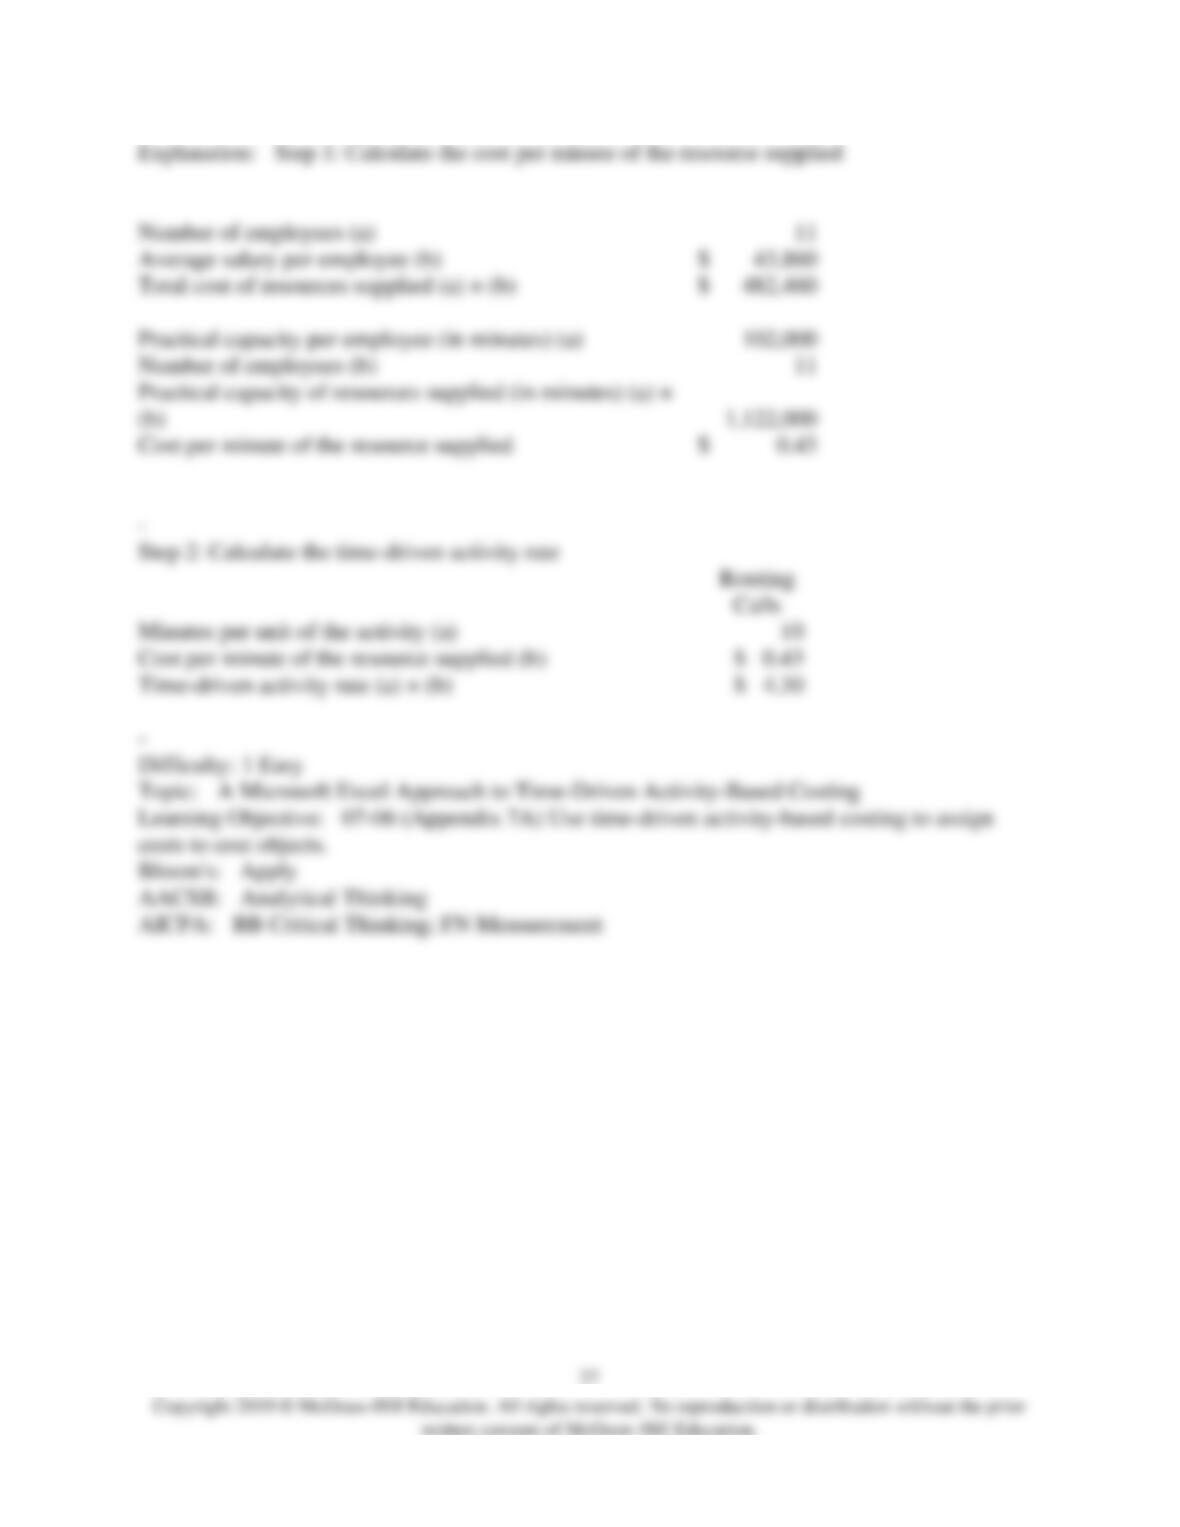
Number of employees (a)
Average salary per employee (b)
$
Total cost of resources supplied (a) × (b)
$
Practical capacity per employee (in minutes) (a)
Number of employees (b)
(a) × (b)
Cost per minute of the resource supplied
$
–

18) Doell Corporation is conducting a time-driven activity-based costing study in its Tech
Support Department. The company has provided the following data to aid in that study:
Doell Corporation
Tech Support Department
Data Inputs
Resource Data:
Number of employees
19
Average salary per employee
$
36,480
Weeks of employment per year
50
Minutes available per week (40 hours × 60 minutes)
2,400
Practical capacity percentage
80
%
–
Activity Data:
Routing Calls
Resolving
Problems
Preparing
Change
Orders
Minutes per unit of the activity
18
22
42
–
On the Customer Cost Analysis report in time-driven activity-based costing, the time-driven
activity rate for Routing Calls would be closest to:
A) $6.84 per call routed
B) $0.38 per call routed
C) $18.00 per call routed
D) $3.11 per call routed
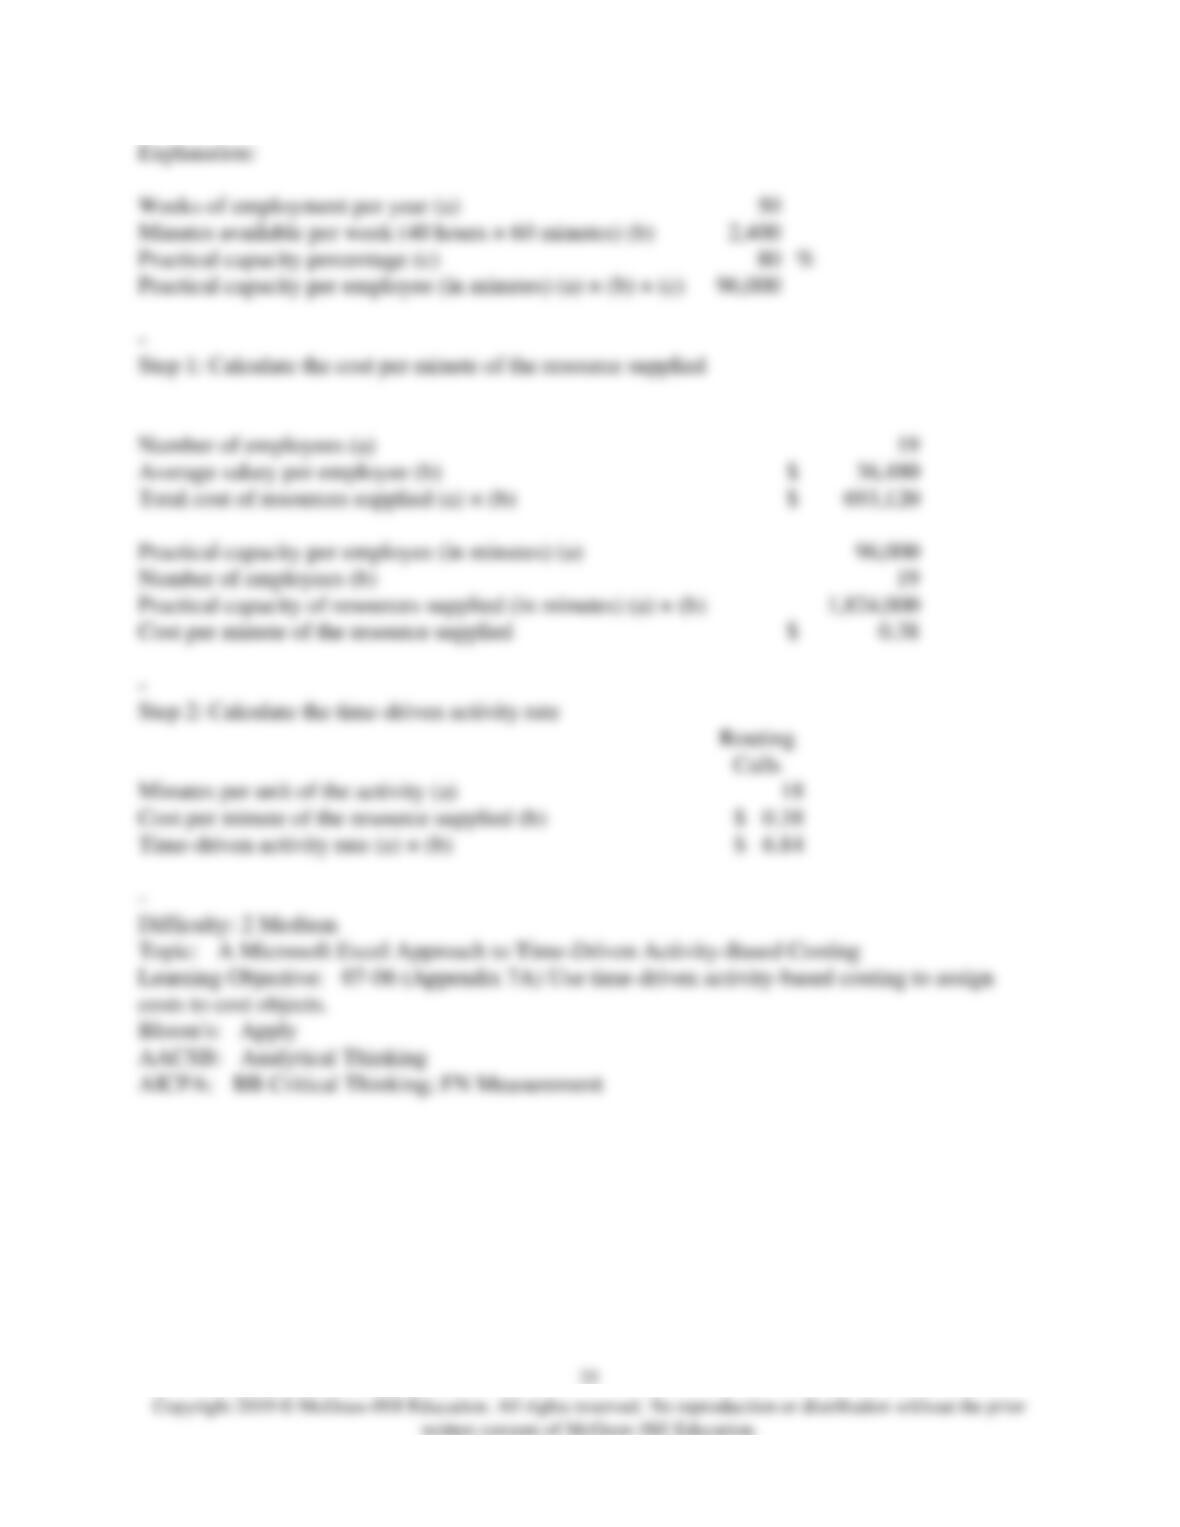

19) McCluer Corporation is conducting a time-driven activity-based costing study in its Tech
Support Department. The company has provided the following data to aid in that study:
McCluer Corporation
Tech Support Department
Data Inputs
Resource Data:
Number of employees
11
Average salary per employee
$
43,860
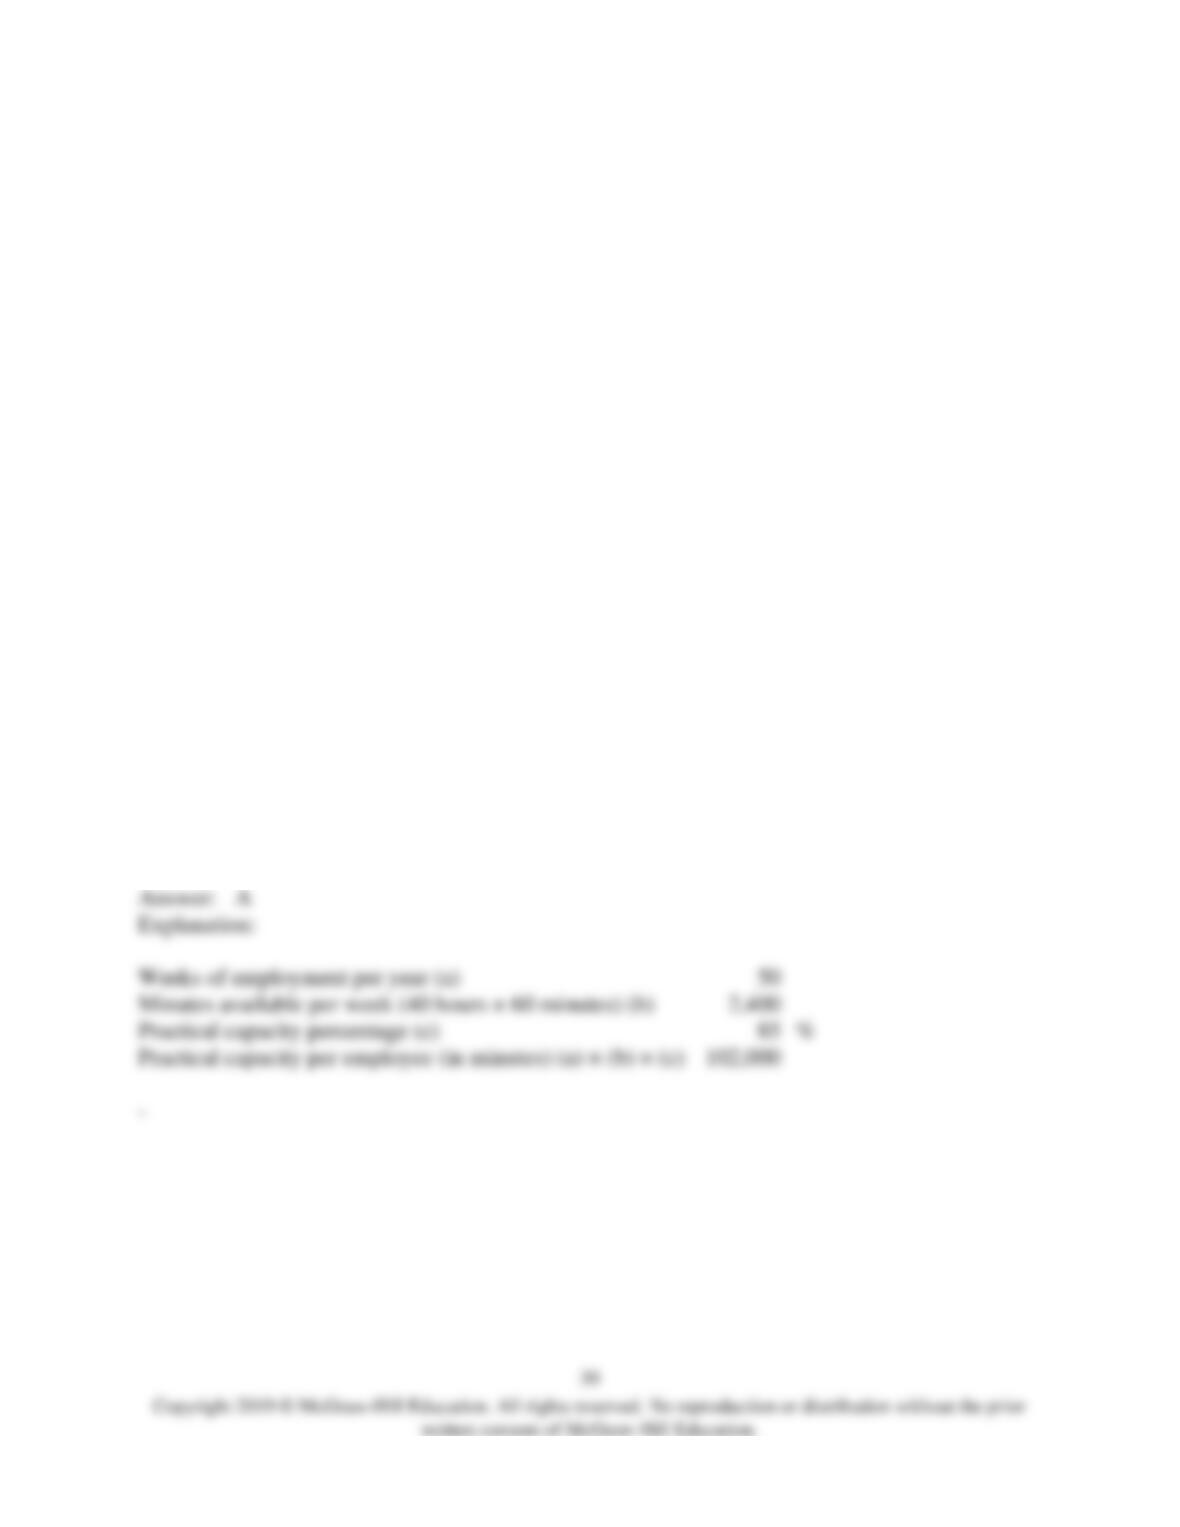
Practical capacity per employee (in minutes)
102,000
–
Activity Data:
Routing Calls
Minutes per unit of the activity
10
On the Customer Cost Analysis report in time-driven activity-based costing, the time-driven
activity rate for Routing Calls would be closest to:
A) $10.00 per call routed
B) $0.43 per call routed
C) $5.30 per call routed
D) $4.30 per call routed
20) Bernosky Corporation is conducting a time-driven activity-based costing study in its Tech
Support Department. The company has provided the following data to aid in that study:
Bernosky Corporation
Tech Support Department
Data Inputs
Resource Data:
Number of employees
12
Average salary per employee
$
38,400
Practical capacity per employee (in minutes)
96,000
Activity Data:
Routing Calls
Resolving
Problems
Preparing
Change
Orders
Minutes per unit of the activity
20
24
34
–
Cost Object Data:
Customer P
Customer Q
Number of calls routed
30
18
Number of problems resolved
17
8
Number of change orders prepared
1
1
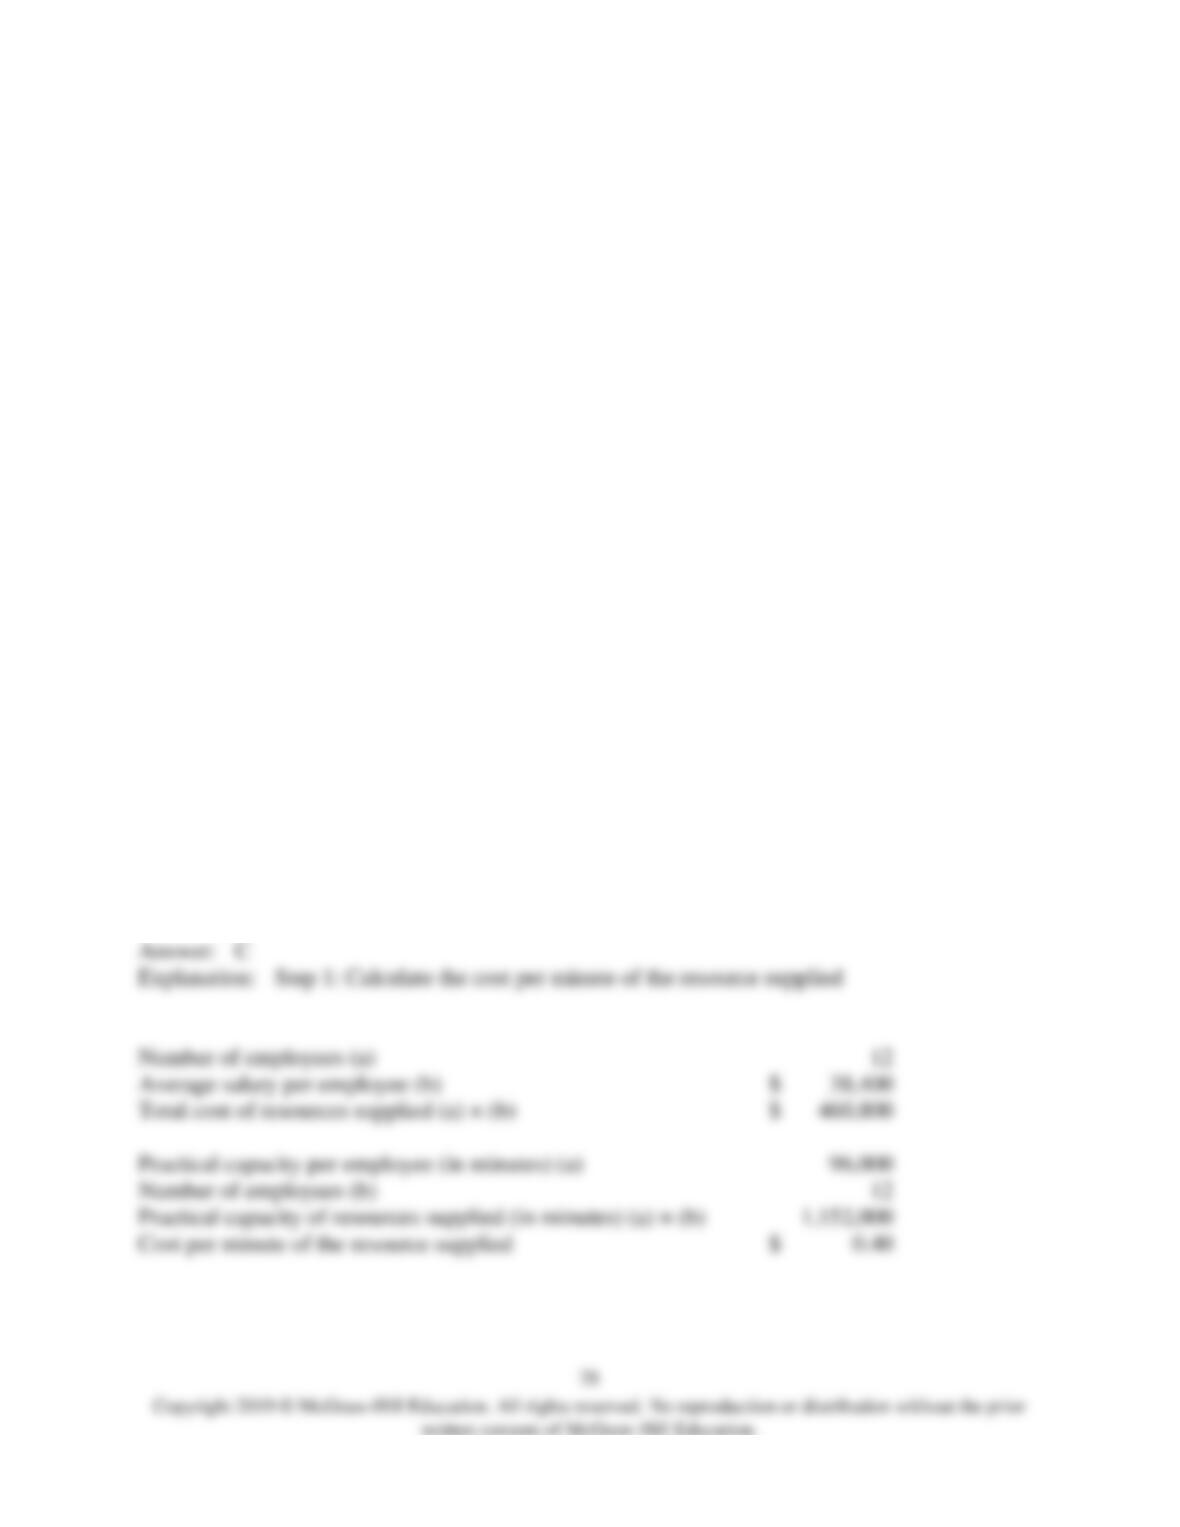
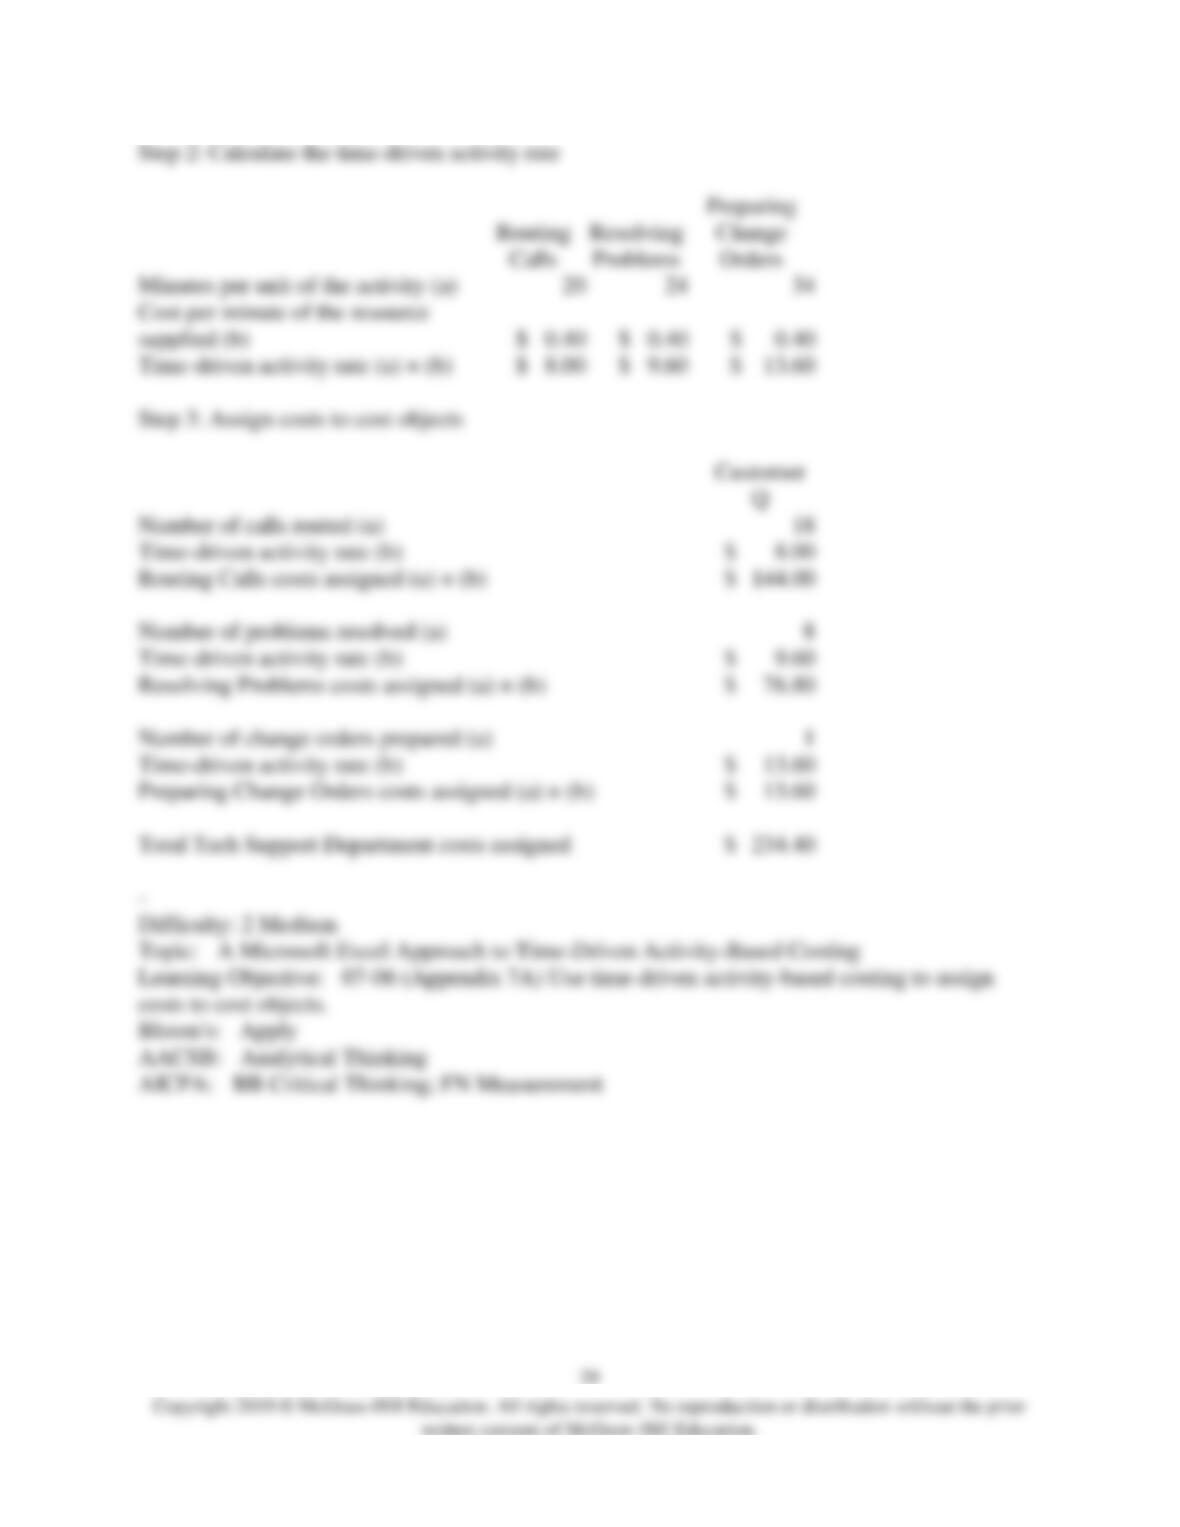
On the Customer Cost Analysis report in time-driven activity-based costing, the total cost
assigned to Customer Q would be closest to:
A) $13.60
B) $76.80
C) $234.40
D) $144.00
Number of employees (a)
Average salary per employee (b)
Total cost of resources supplied (a) × (b)
Practical capacity per employee (in minutes) (a)
Number of employees (b)
Practical capacity of resources supplied (in minutes) (a) × (b)
Cost per minute of the resource supplied
0.40
21) Lopresto Corporation is conducting a time-driven activity-based costing study in its Order
Fulfillment Department. The company has provided the following data to aid in that study:
Lopresto Corporation
Order Fulfillment Department
Data Inputs
Resource Data:
Number of employees
14
Average salary per employee
$
38,760
Weeks of employment per year
50
Minutes available per week (40 hours × 60 minutes)
2,400
Practical capacity percentage
85
%
–
Activity Data:
Processing
Orders
Preparing
Deliveries
Handling
Returns
Minutes per unit of the activity
14
28
36
–
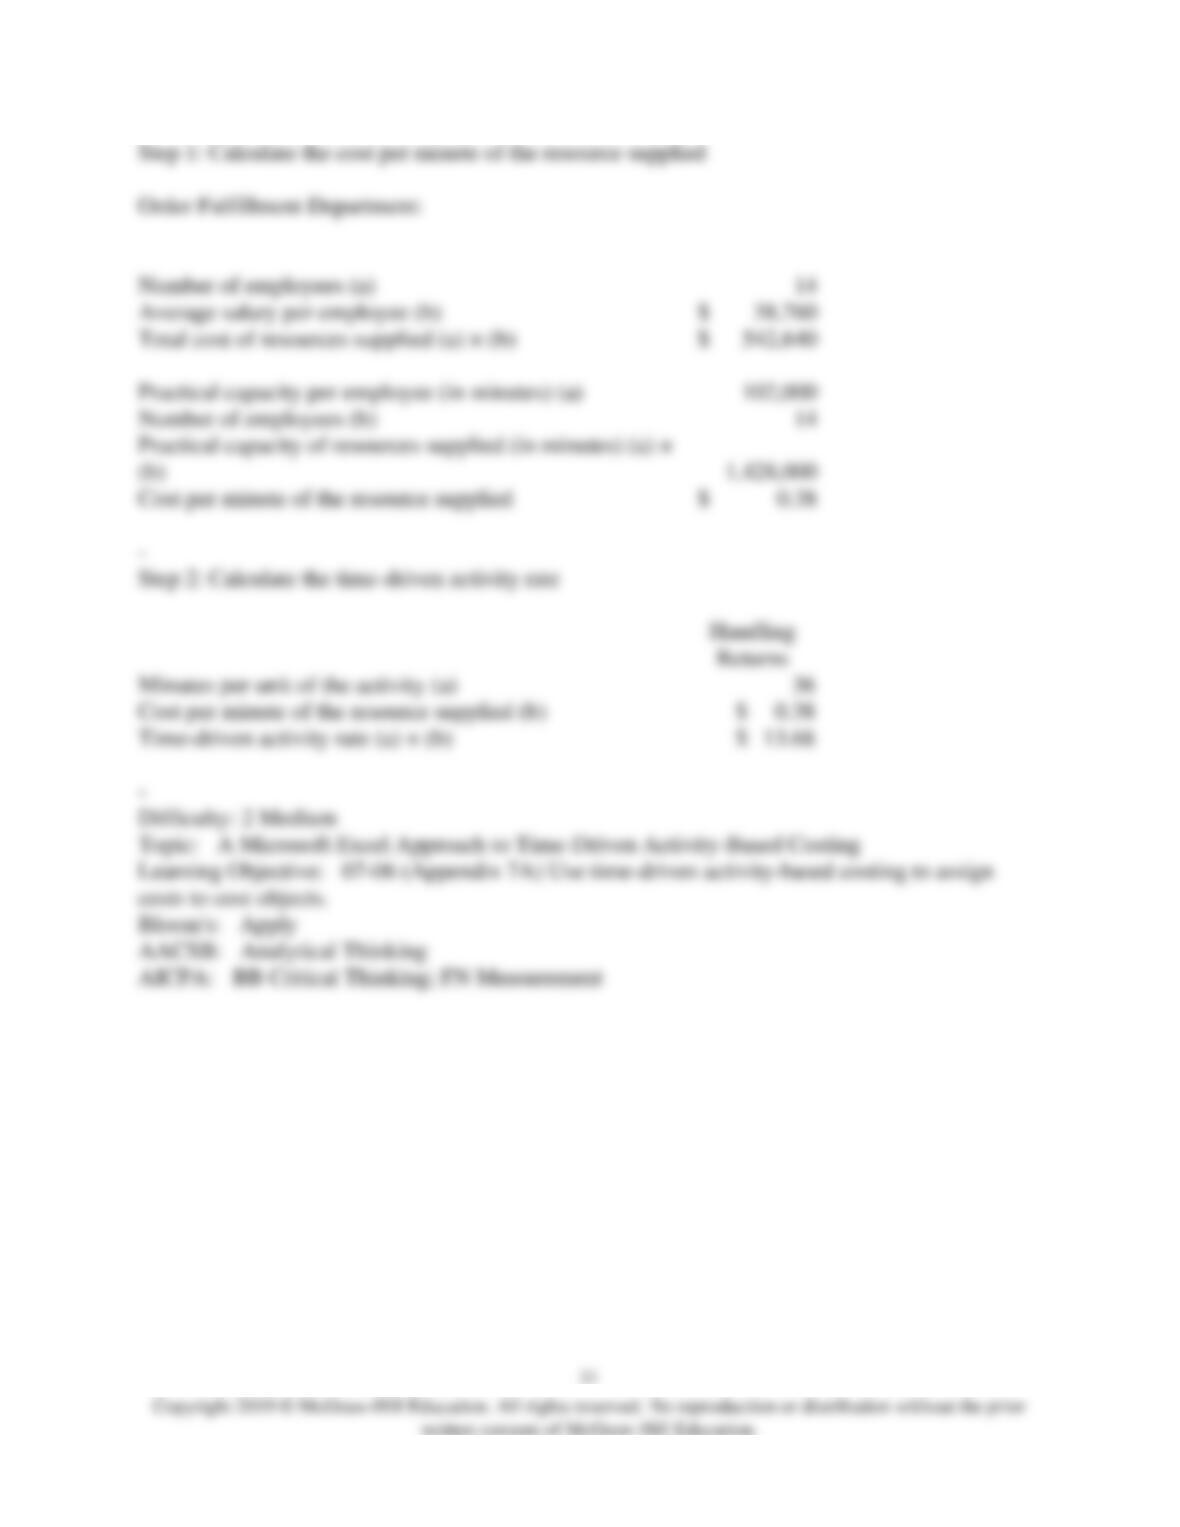
On the Customer Cost Analysis report in time-driven activity-based costing, the time-driven
activity rate for Handling Returns would be closest to:
A) $13.68 per return handled
B) $1.06 per return handled
C) $36.00 per return handled
D) $0.38 per return handled
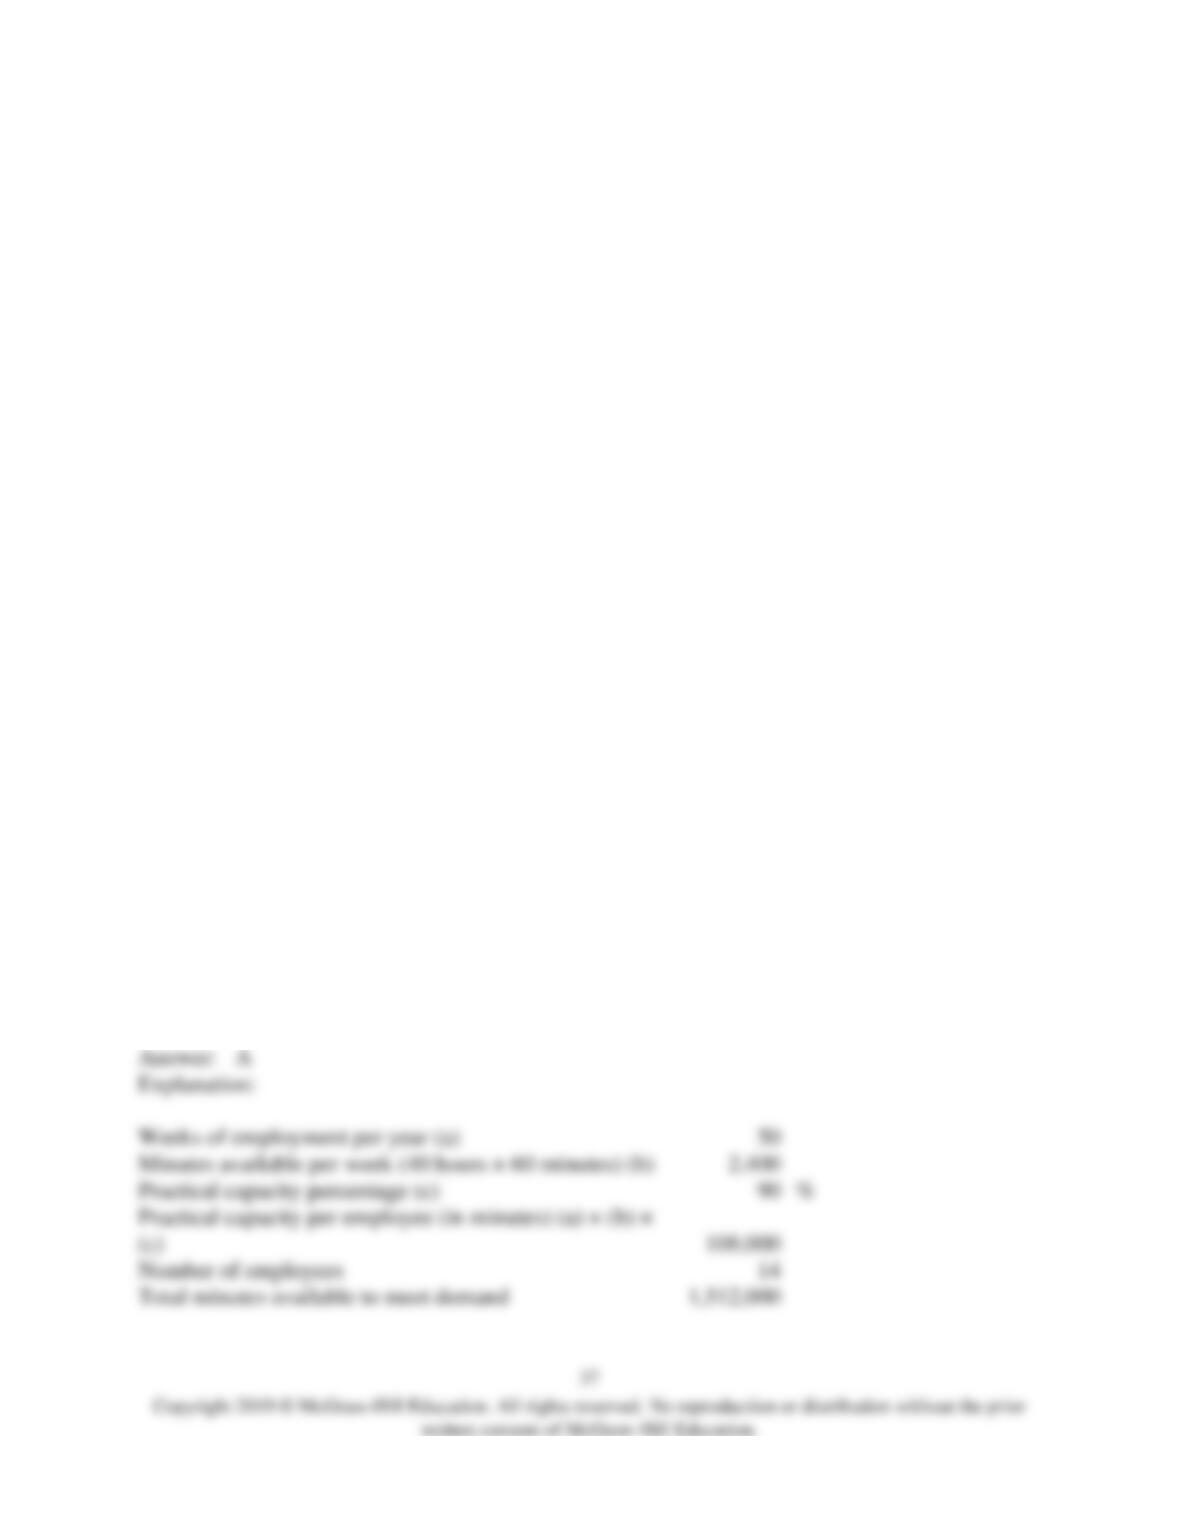
Weeks of employment per year (a)
50
Minutes available per week (40 hours × 60 minutes) (b)
Practical capacity percentage (c)
85
Practical capacity per employee (in minutes) (a) × (b) × (c)
–

22) Heyl Corporation is conducting a time-driven activity-based costing study in its Customer
Support Department. The company has provided the following data to aid in that study:
Heyl Corporation
Customer Support Department
Data Inputs
Resource Data:
Number of employees
19
Average salary per employee
$
36,000
Weeks of employment per year
50
Minutes available per week (40 hours × 60 minutes)
2,400
Practical capacity percentage
75
%
–
Activity Data:
Receiving
Calls
Resolving
Issues
Settling
Disputes
Minutes per unit of the activity
14
24
38
Cost Object Data:
Customer A
Customer B
Customer C
Number of calls received
27
23
4
Number of issues resolved
15
8
8
Number of disputes settled
1
1
1
–
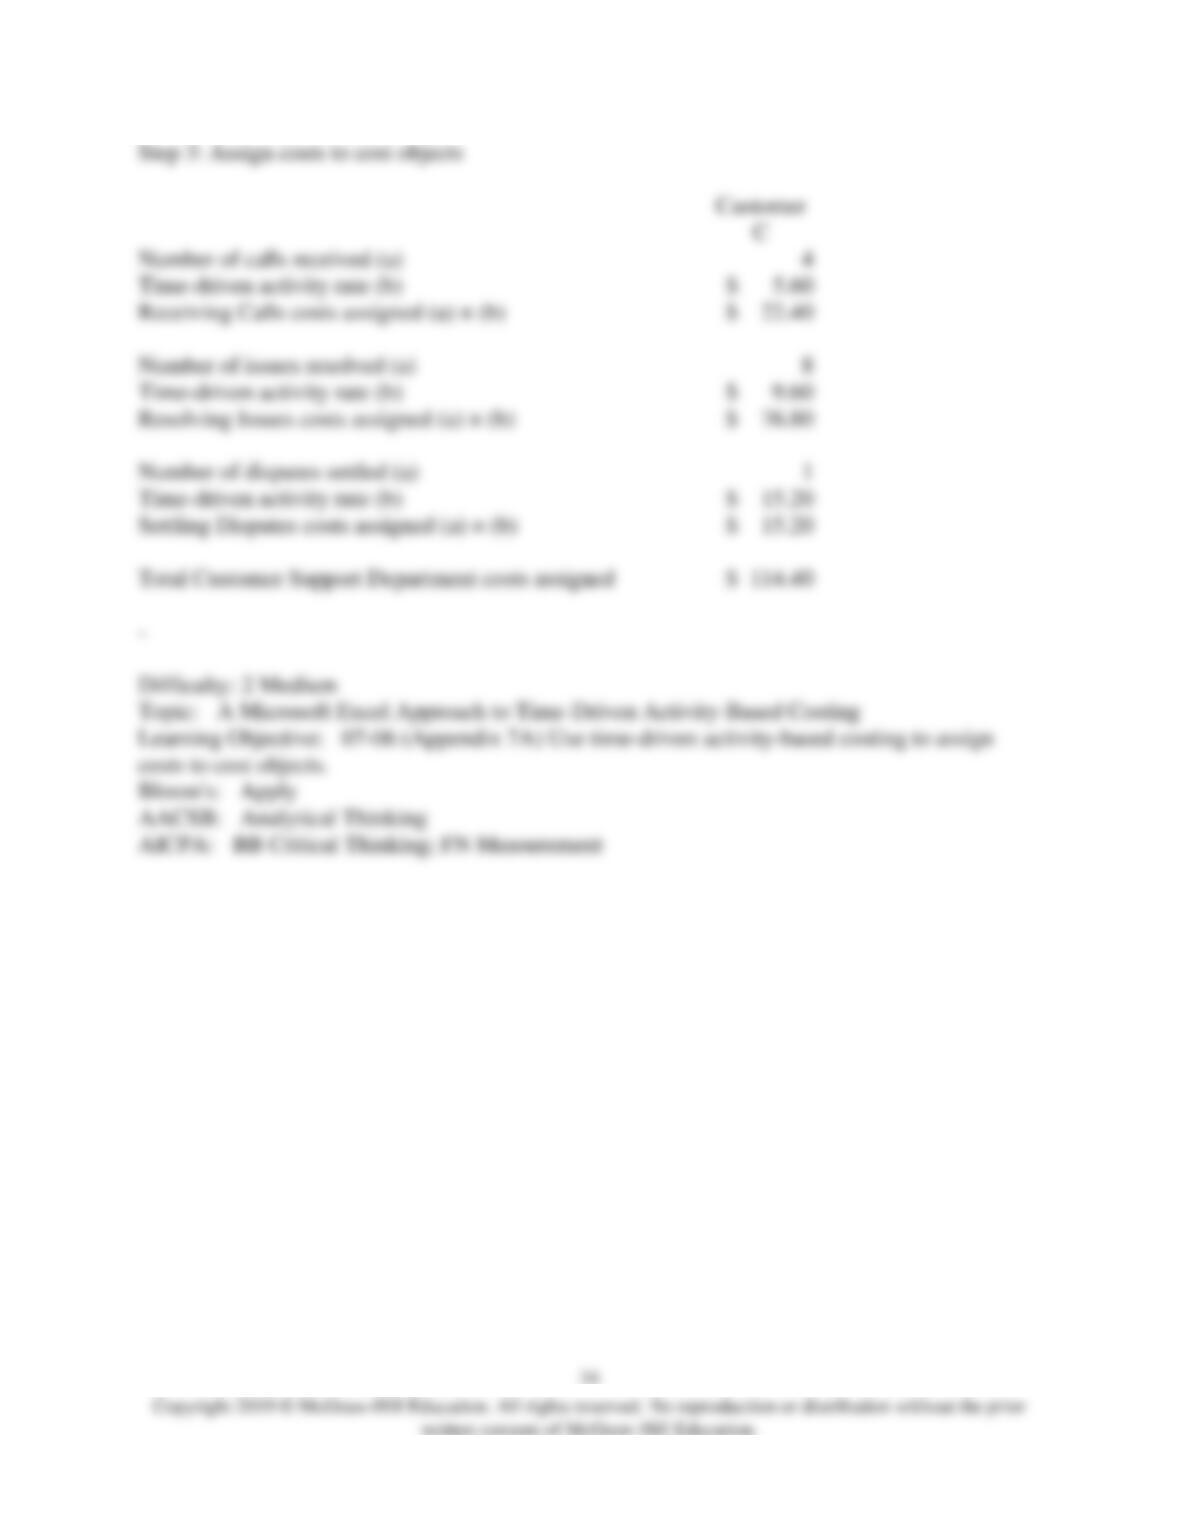
On the Customer Cost Analysis report in time-driven activity-based costing, the total cost
assigned to Customer C would be closest to:
A) $114.40
B) $15.20
C) $76.80
D) $22.40

23) Campanaro Corporation is conducting a time-driven activity-based costing study in its Tech
Support Department. The company has provided the following data to aid in that study:
Campanaro Corporation
Tech Support Department
Data Inputs
Resource Data:
Number of employees
14
Average salary per employee
$
48,600
Weeks of employment per year
50
Minutes available per week (40 hours × 60 minutes)
2,400
Practical capacity percentage
90
%
–
Activity Data:
Routing Calls
Resolving
Problems
Preparing
Change
Orders
Minutes per unit of the activity
20
28
32
–
Cost Object Data:
All Customers
Number of calls routed
41,360
Number of problems resolved
18,260
Number of change orders prepared
670
–
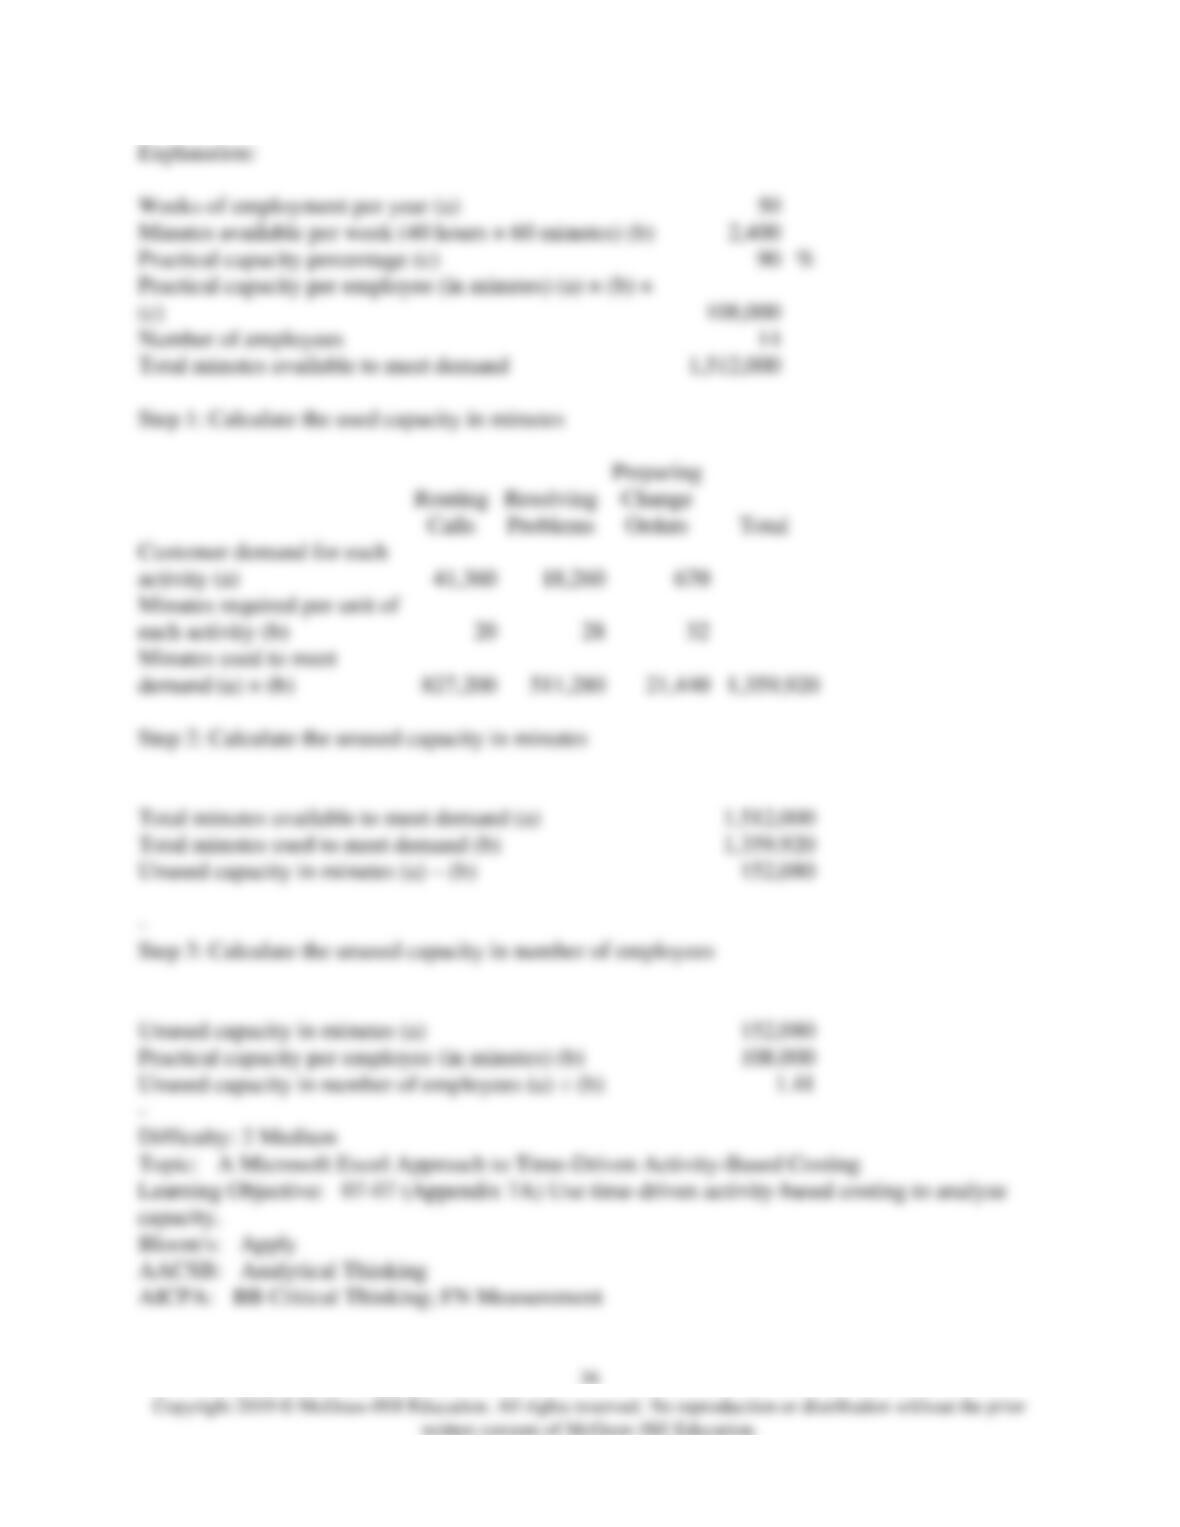
On the Capacity Analysis report in time-driven activity-based costing, the “unused capacity in
number of employees” would be closest to:
A) 1.41 employees
B) 14.00 employees
C) (12.59) employees
D) 12.59 employees
24) Grassie Corporation is conducting a time-driven activity-based costing study in its Customer
Service Department. The company has provided the following data to aid in that study:
Grassie Corporation
Customer Service Department
Data Inputs
Resource Data:
Number of employees
14
Average salary per employee
$
45,360
Weeks of employment per year
50
Minutes available per week (40 hours × 60 minutes)
2,400
Practical capacity percentage
90
%
–
Activity Data:
Processing
Orders
Resolving
Queries
Processing
Credit
Reviews
Minutes per unit of the activity
14
26
46
–
Cost Object Data:
All Customers
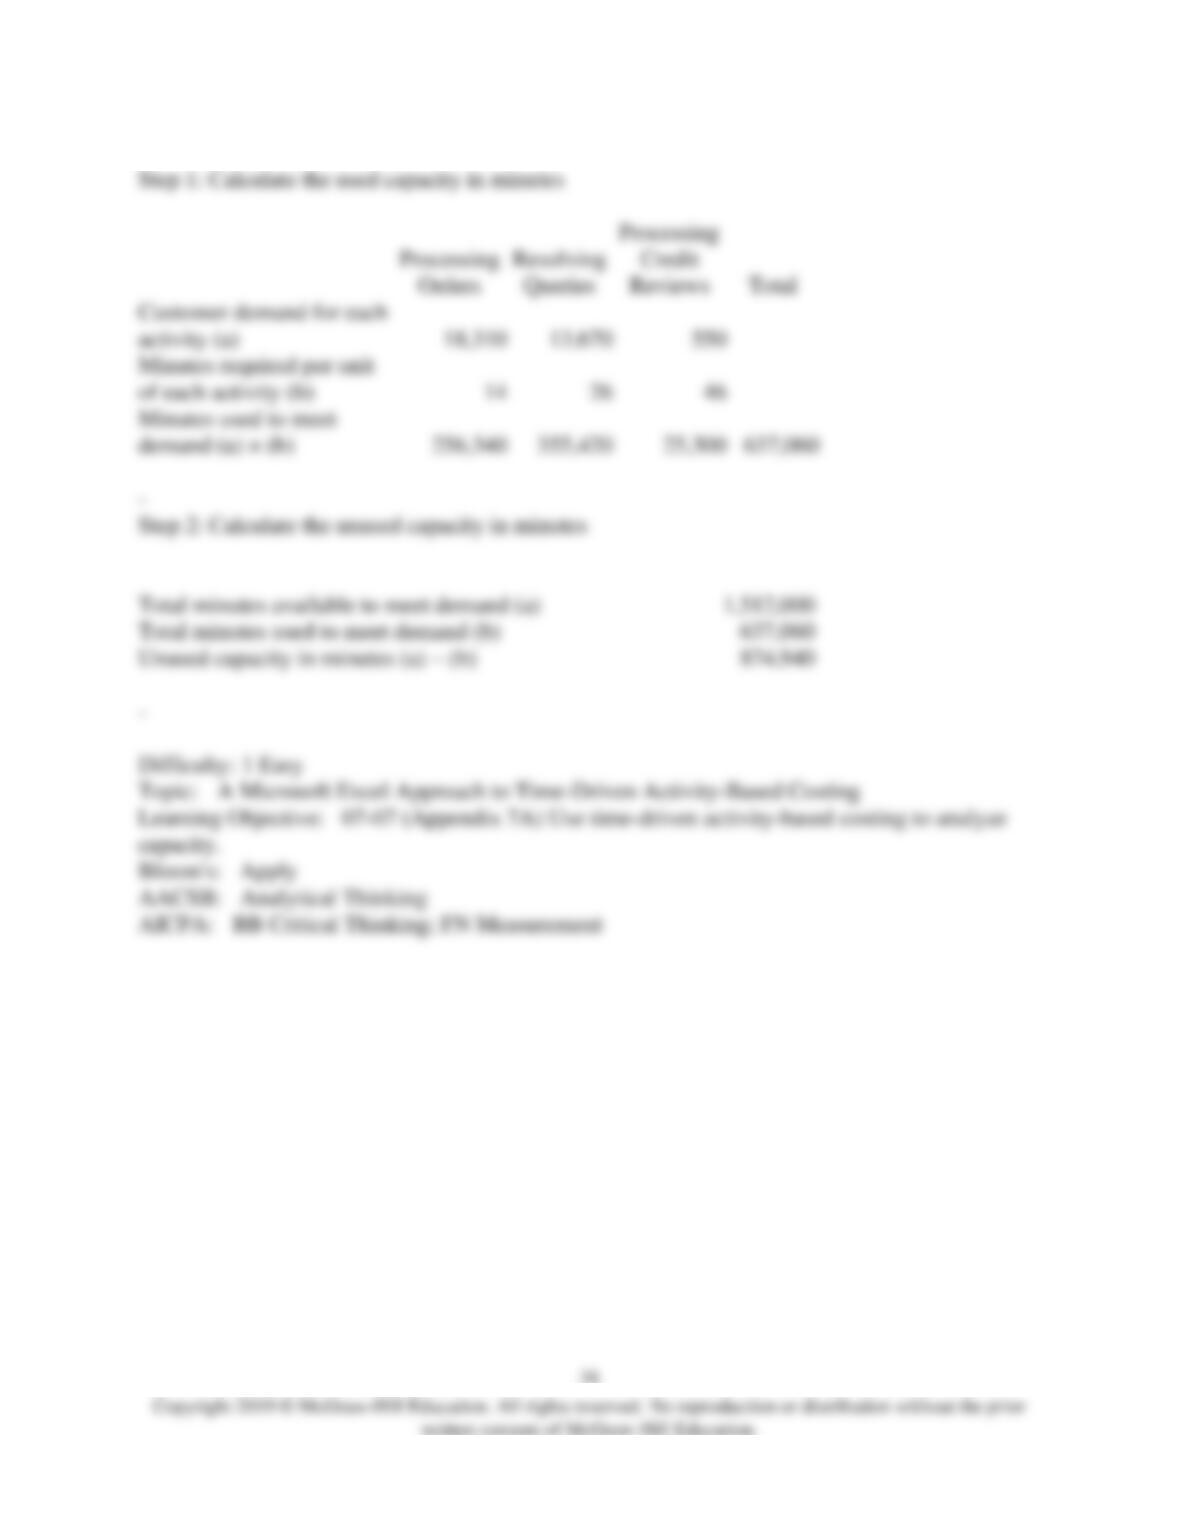
Number of orders processed
18,310
Number of queries resolved
13,670
Number of credit reviews processed
550
–
On the Capacity Analysis report in time-driven activity-based costing, the”unused capacity in
minutes” would be closest to:
A) 874,940 minutes
B) 815,470 minutes
C) 756,000 minutes
D) 637,060 minutes
Weeks of employment per year (a)
Minutes available per week (40 hours × 60 minutes) (b)
Practical capacity percentage (c)
(c)
Number of employees
Total minutes available to meet demand
–
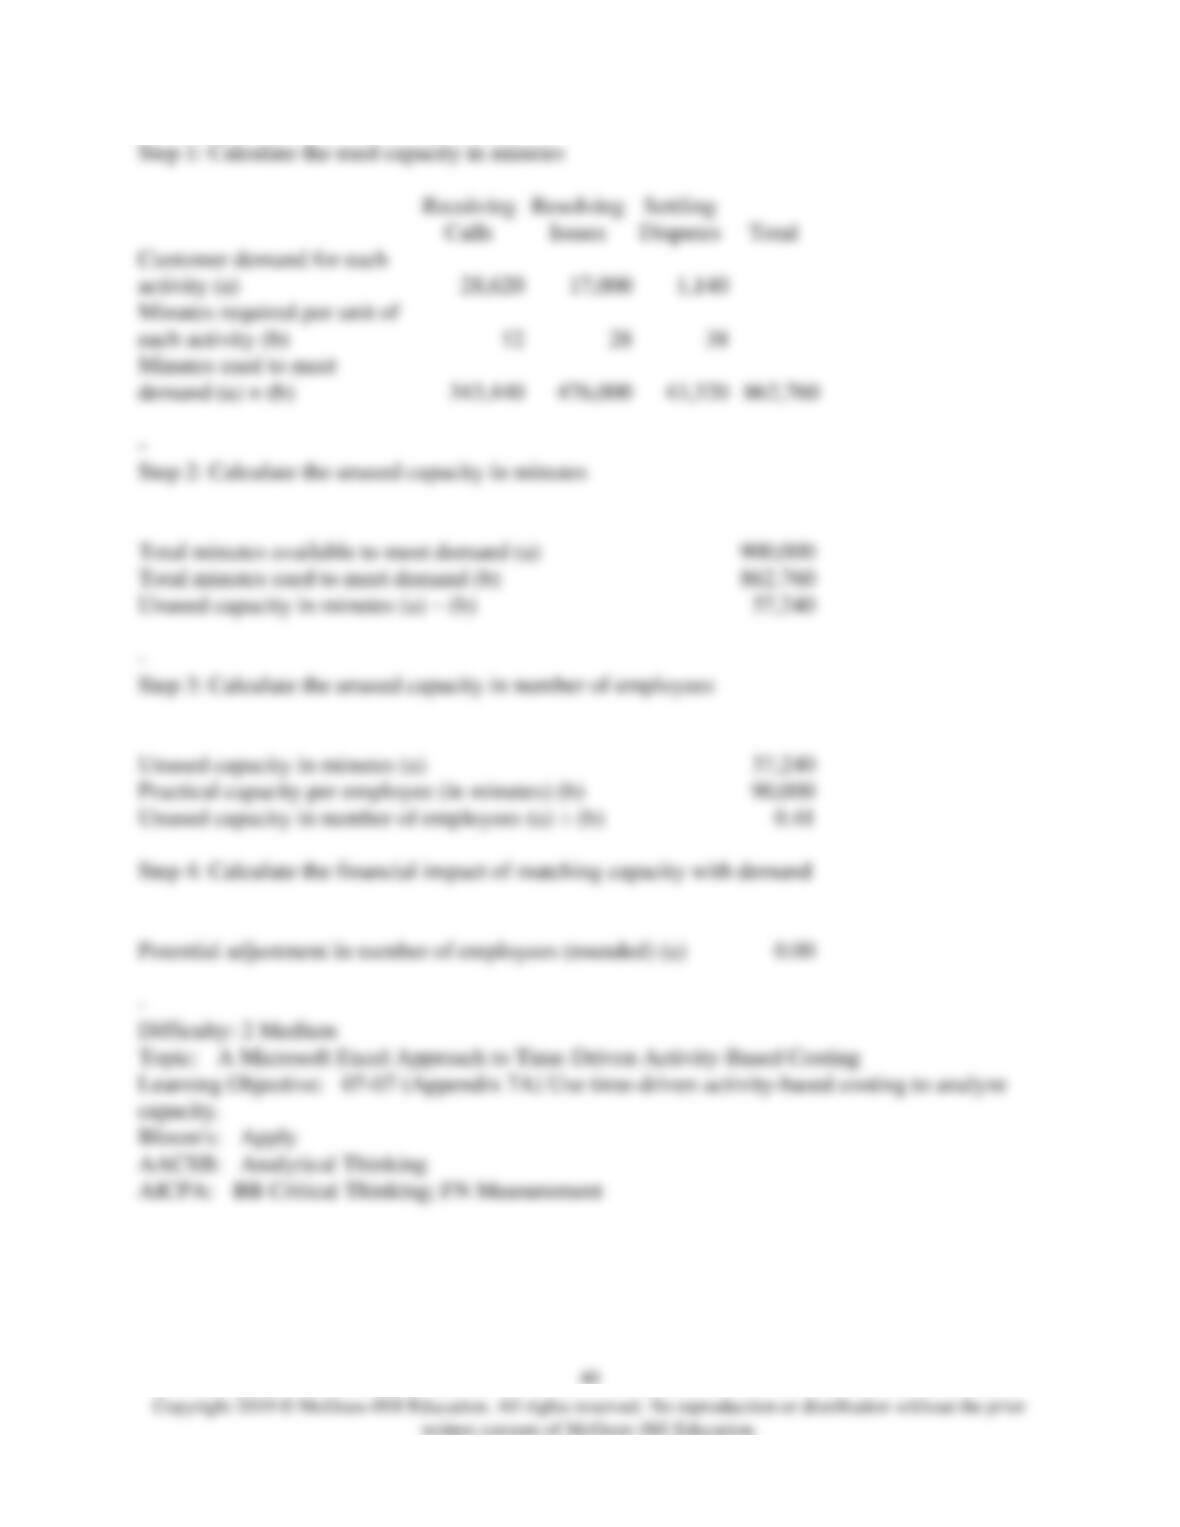
25) Wrench Corporation is conducting a time-driven activity-based costing study in its Customer
Support Department. The company has provided the following data to aid in that study:
Wrench Corporation
Customer Support Department
Data Inputs
Resource Data:
Number of employees
10
Average salary per employee
$
35,100
Weeks of employment per year
50
Minutes available per week (40 hours × 60 minutes)
2,400
Practical capacity percentage
75
%
–
Activity Data:
Receiving
Calls
Resolving
Issues
Settling
Disputes
Minutes per unit of the activity
12
28
38
–
Cost Object Data:
All Customers
Number of calls routed
28,620
Number of issues resolved
17,000
Number of disputes settled
1,140
–
On the Capacity Analysis report in time-driven activity-based costing, the “potential adjustment
in the number of employees” would be closest to:
A) 0.00 employees
B) 2.00 employees
C) 1.00 employees
D) (1.00) employees
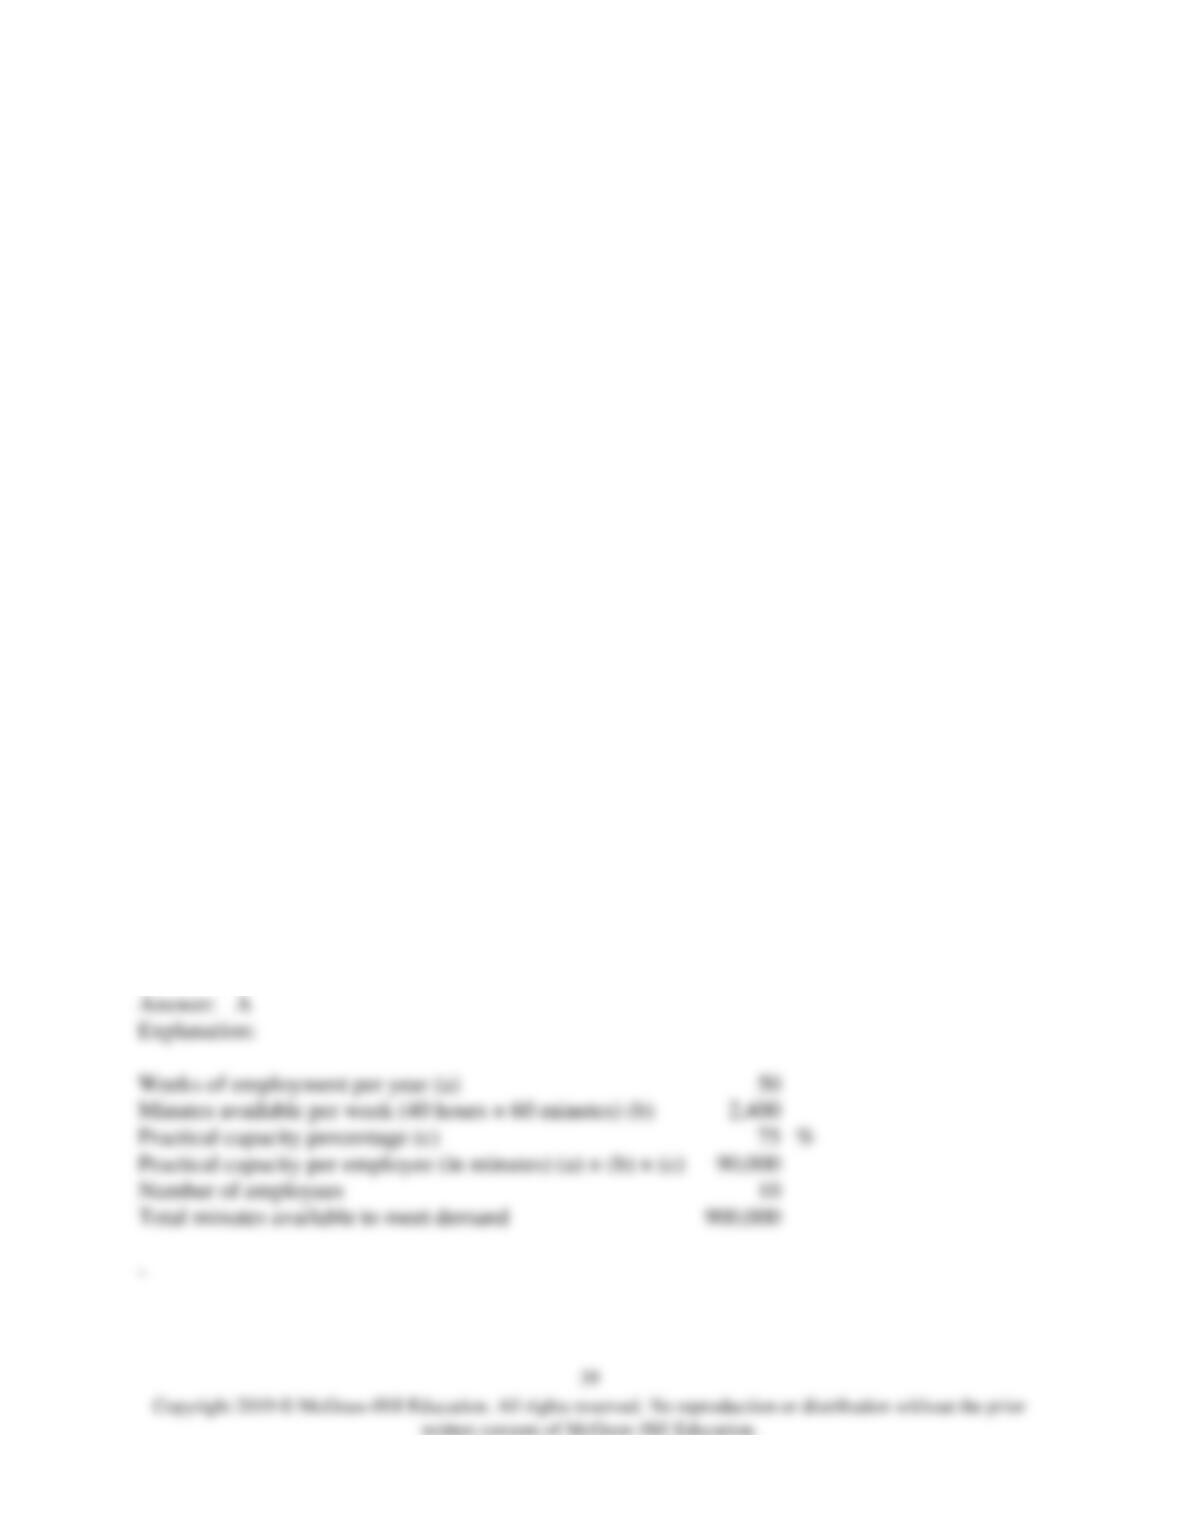
Weeks of employment per year (a)
Minutes available per week (40 hours × 60 minutes) (b)
Practical capacity percentage (c)
Practical capacity per employee (in minutes) (a) × (b) × (c)
Number of employees
Total minutes available to meet demand
–