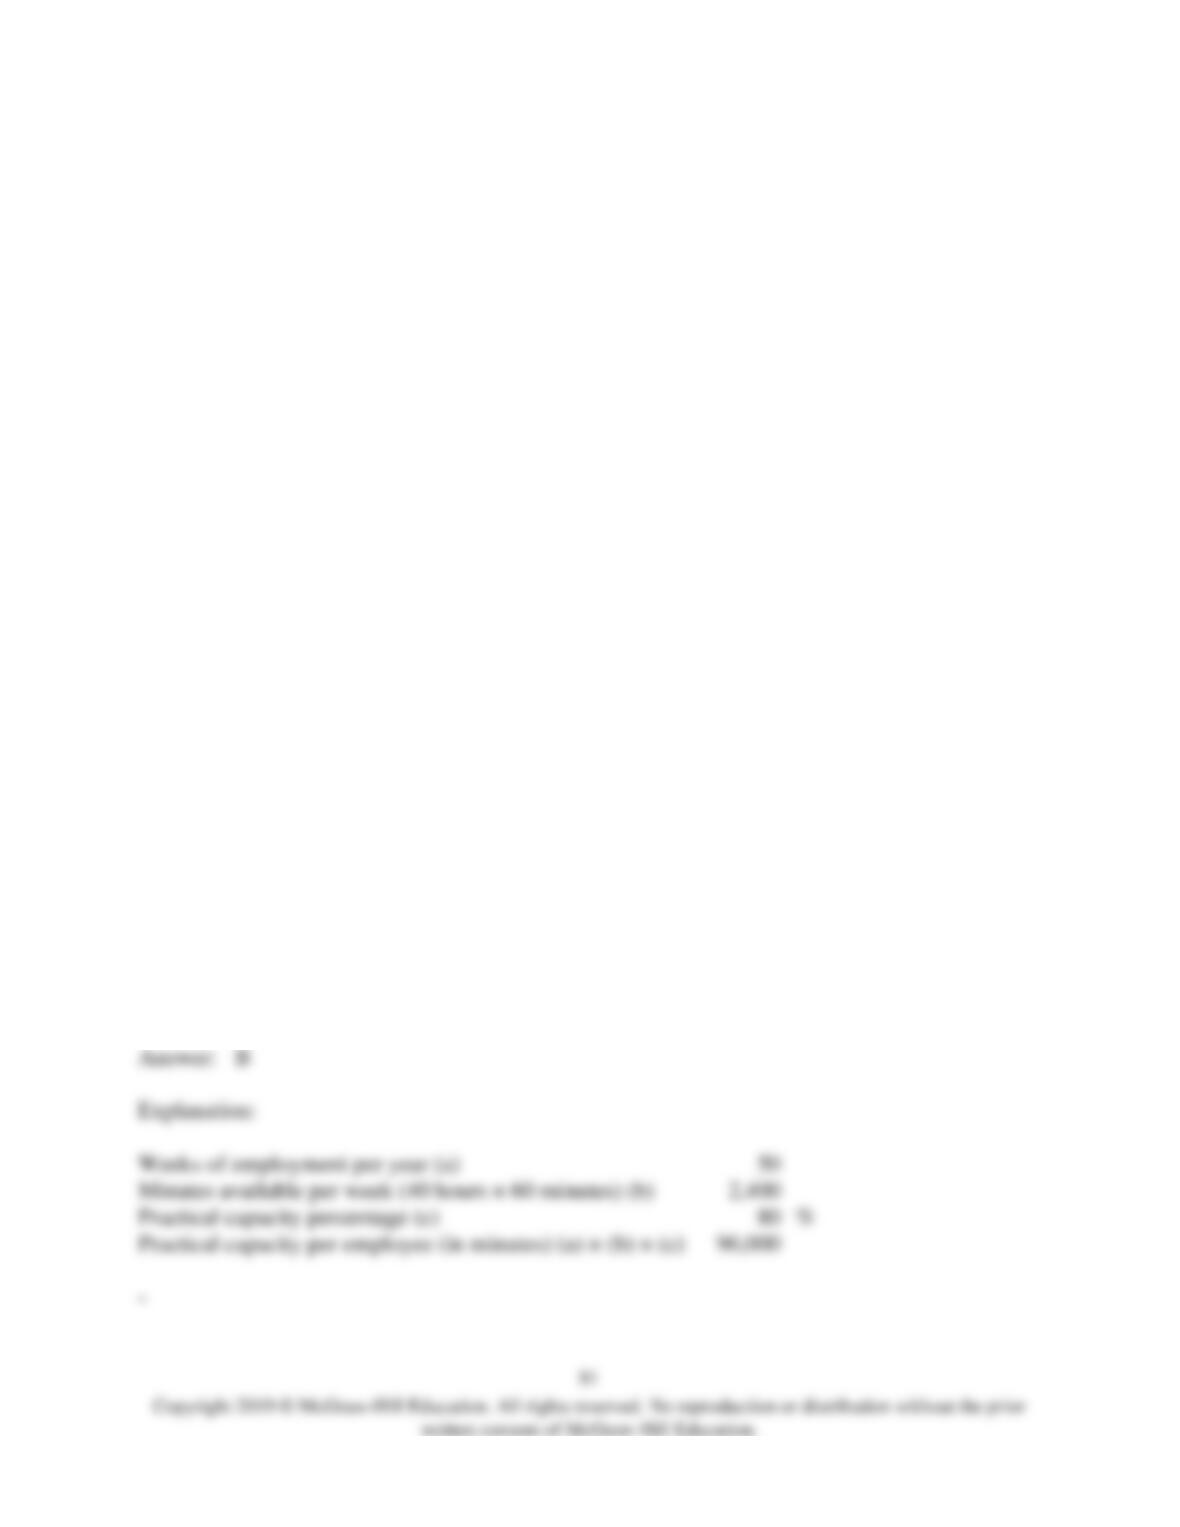
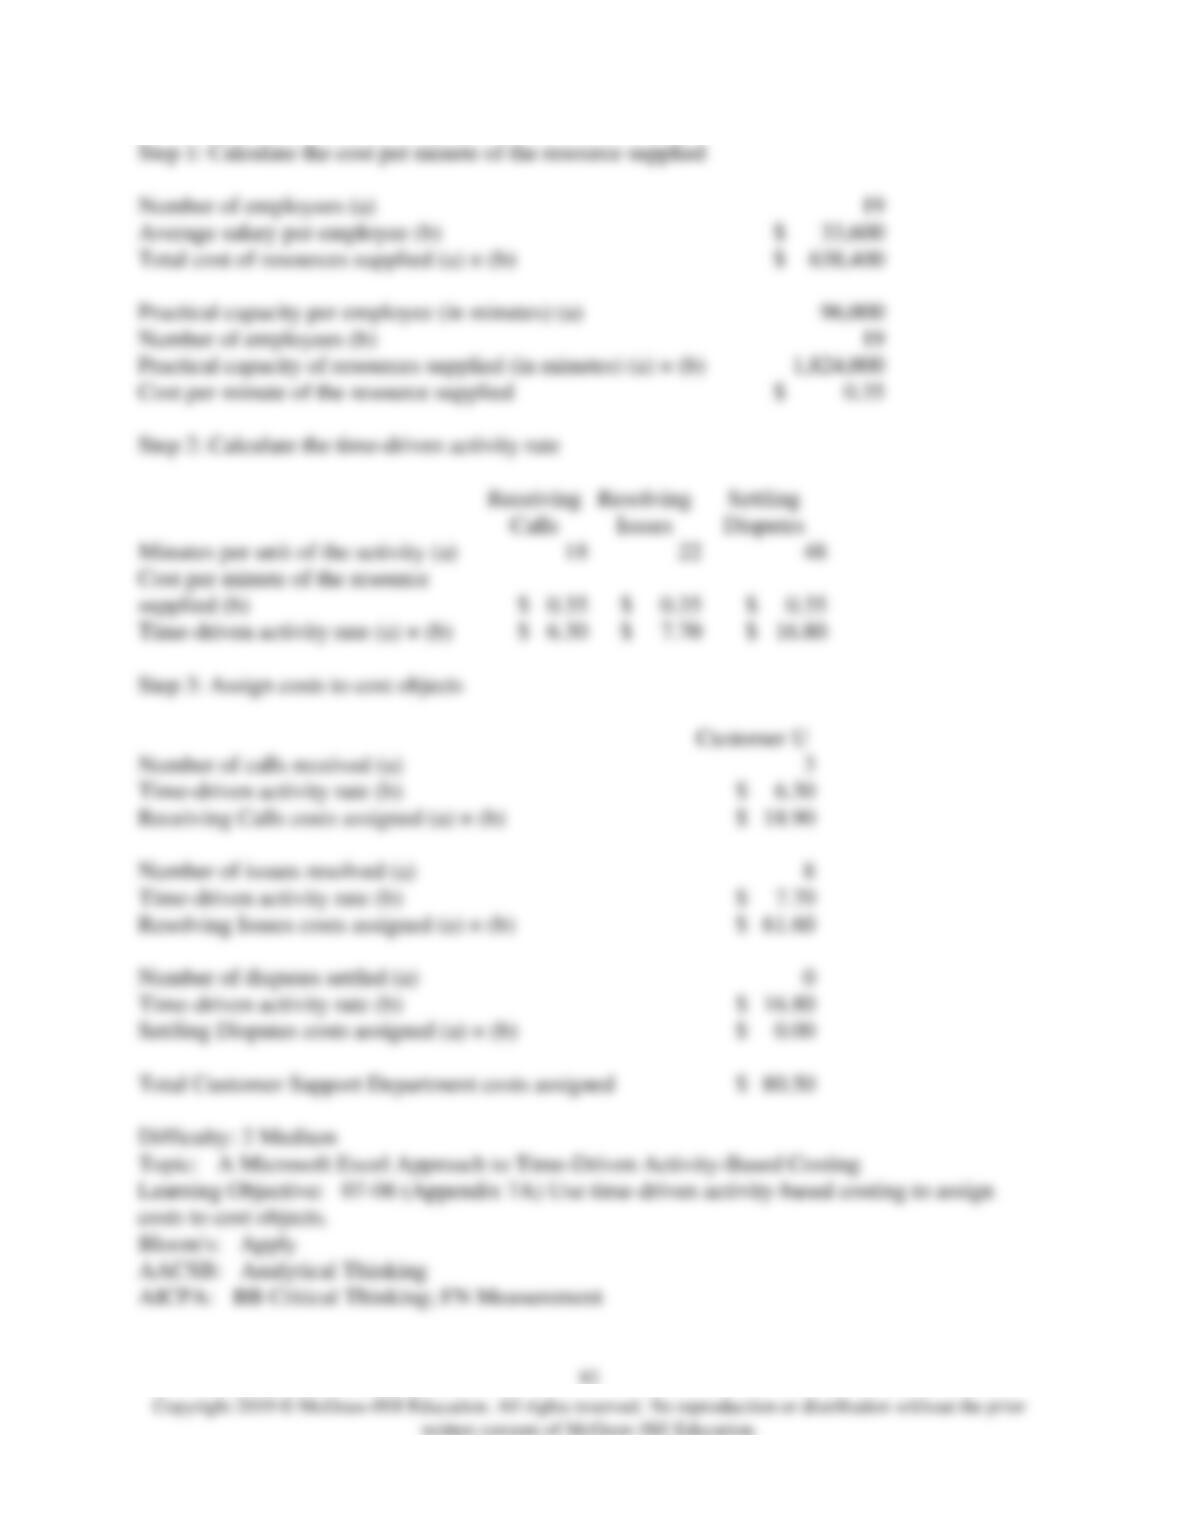
48) Fleisher Corporation is conducting a time-driven activity-based costing study in its Customer
Support Department. The company has provided the following data to aid in that study:
Fleisher Corporation
Customer Support Department
Data Inputs
Resource Data:
Number of employees
19
Average salary per employee
$
33,600
Weeks of employment per year
50
Minutes available per week (40 hours × 60 minutes)
2,400
Practical capacity percentage
80
%
–
Activity Data:
Receiving
Calls
Resolving
Issues
Settling
Disputes
Minutes per unit of the activity
18
22
48
–
Cost Object Data:
Customer S
Customer T
Customer U
Number of calls received
30
24
3
Number of issues resolved
17
11
8
Number of disputes settled
1
0
0
–
On the Customer Cost Analysis report in time-driven activity-based costing, the total cost
assigned to Customer U would be closest to:
A) $0.00
B) $80.50
C) $61.60
D) $18.90
Weeks of employment per year (a)
Minutes available per week (40 hours × 60 minutes) (b)
Practical capacity percentage (c)
Practical capacity per employee (in minutes) (a) × (b) × (c)
–

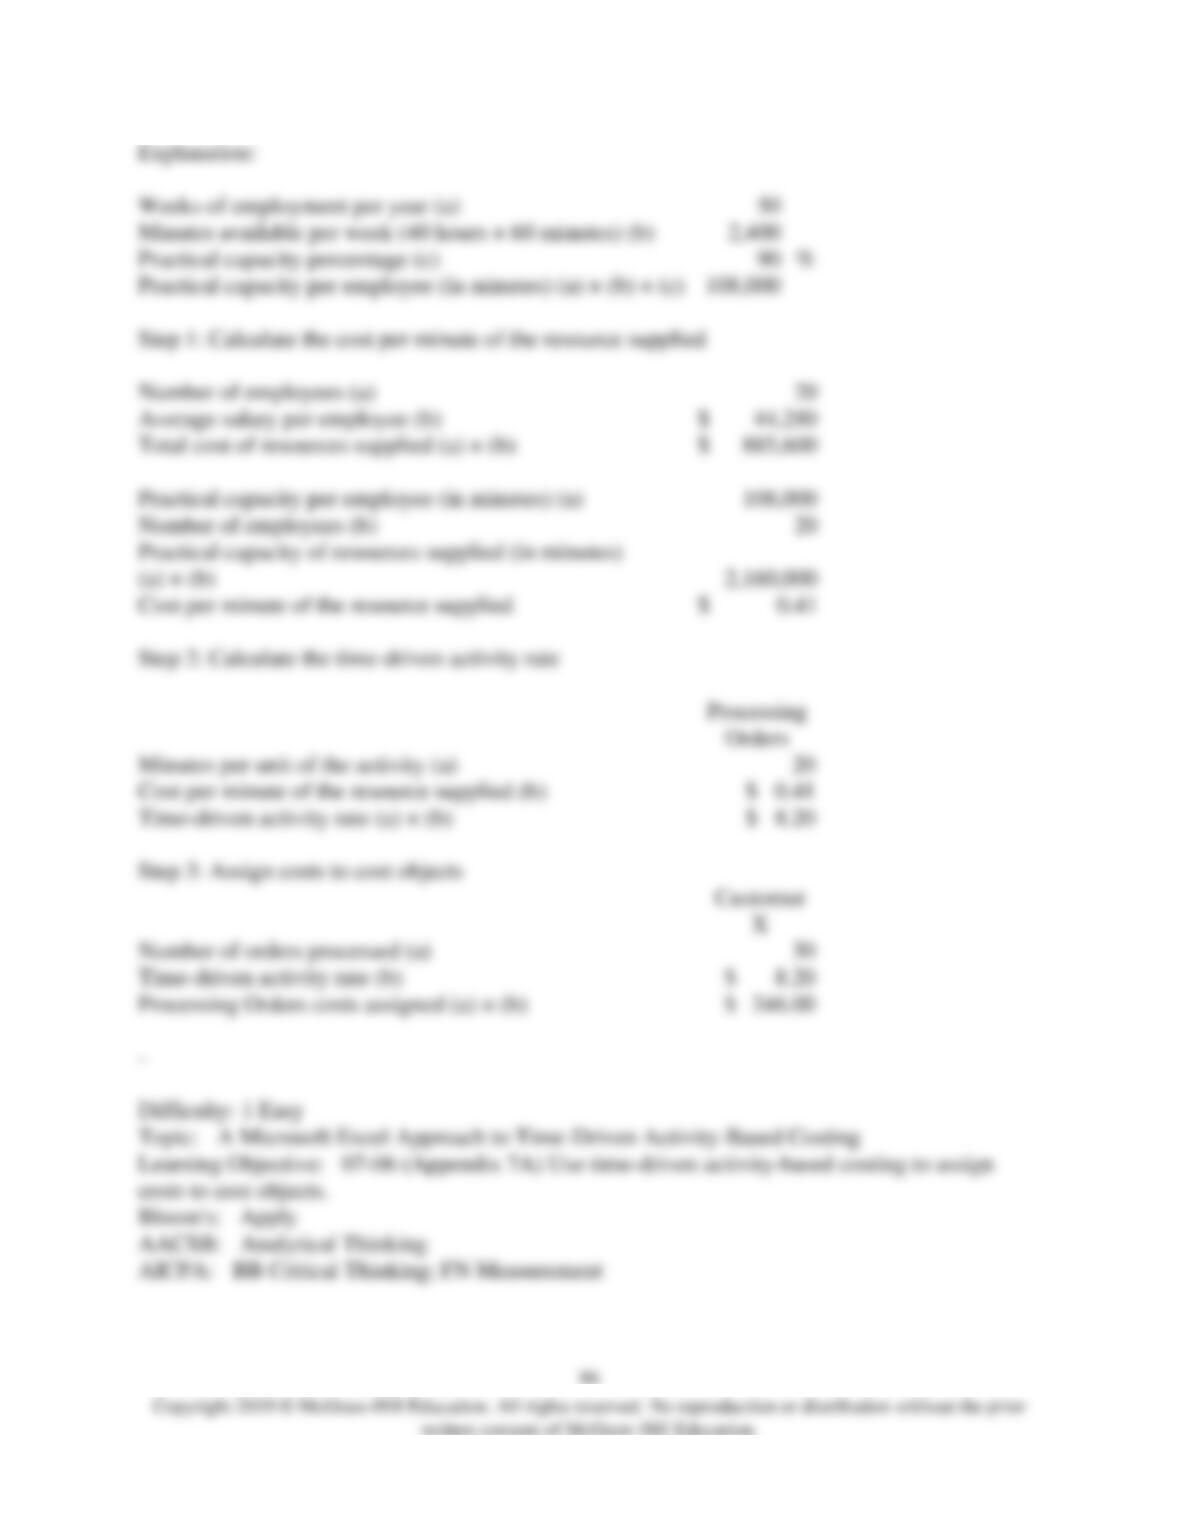
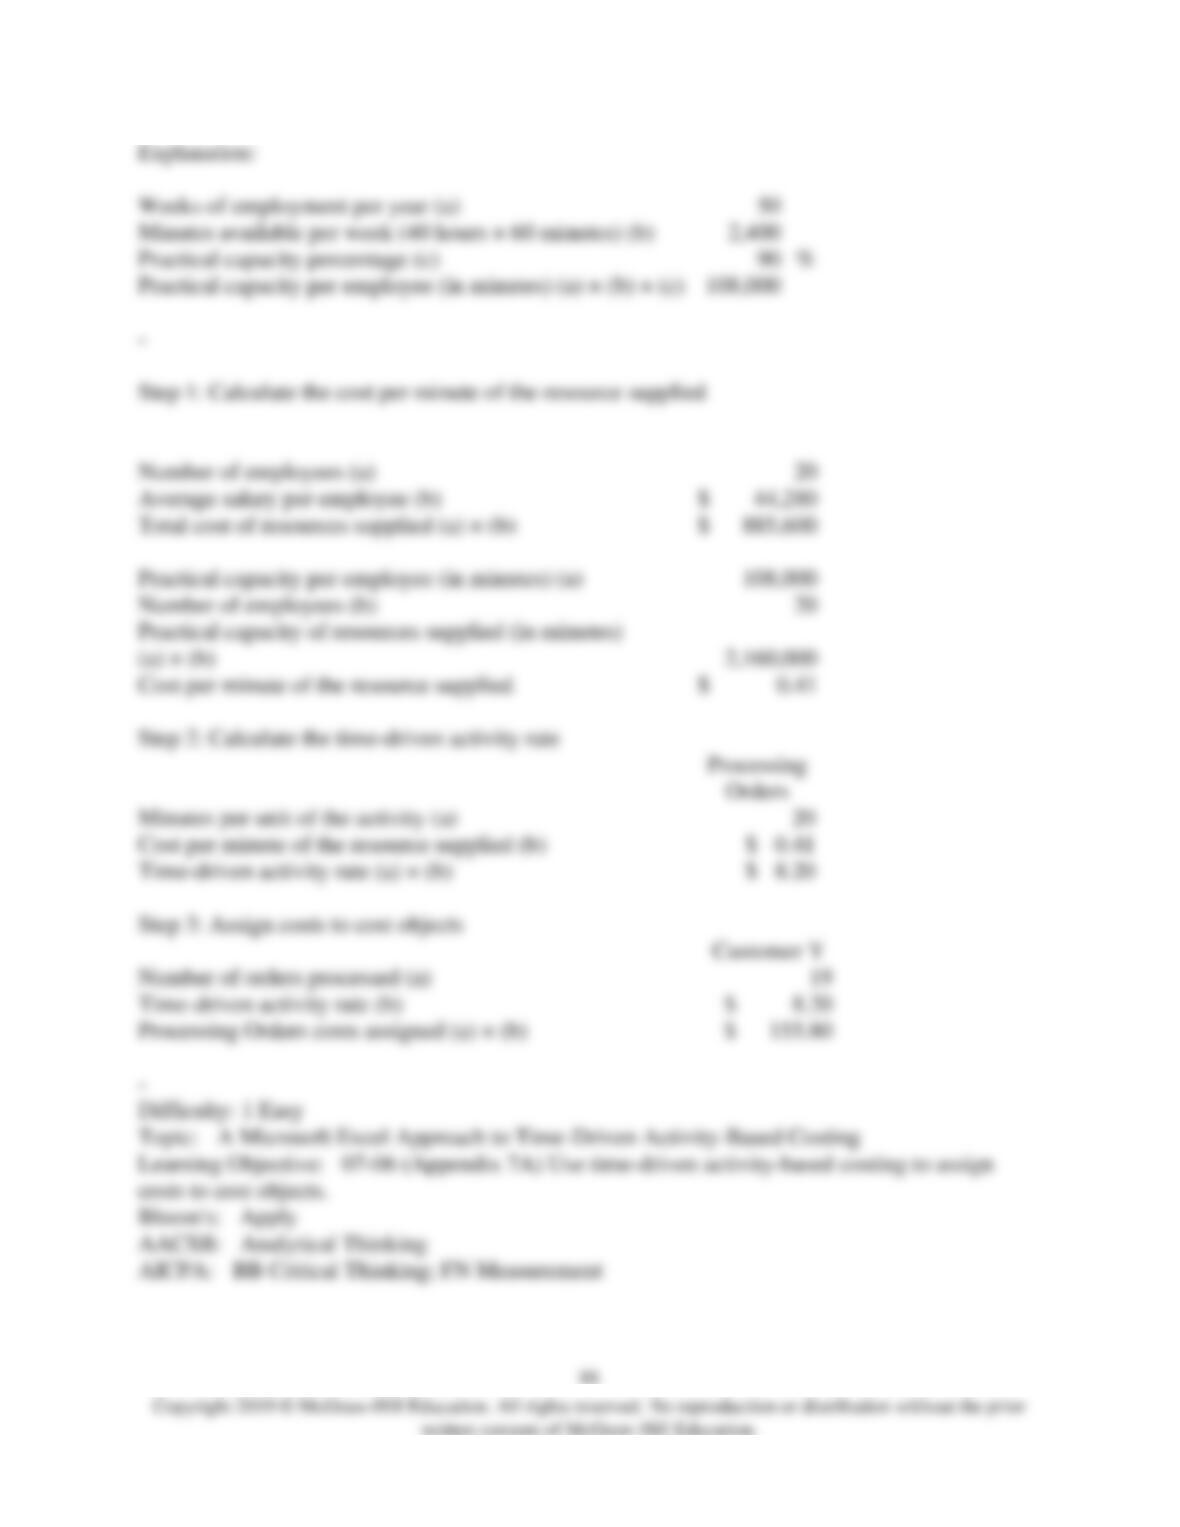
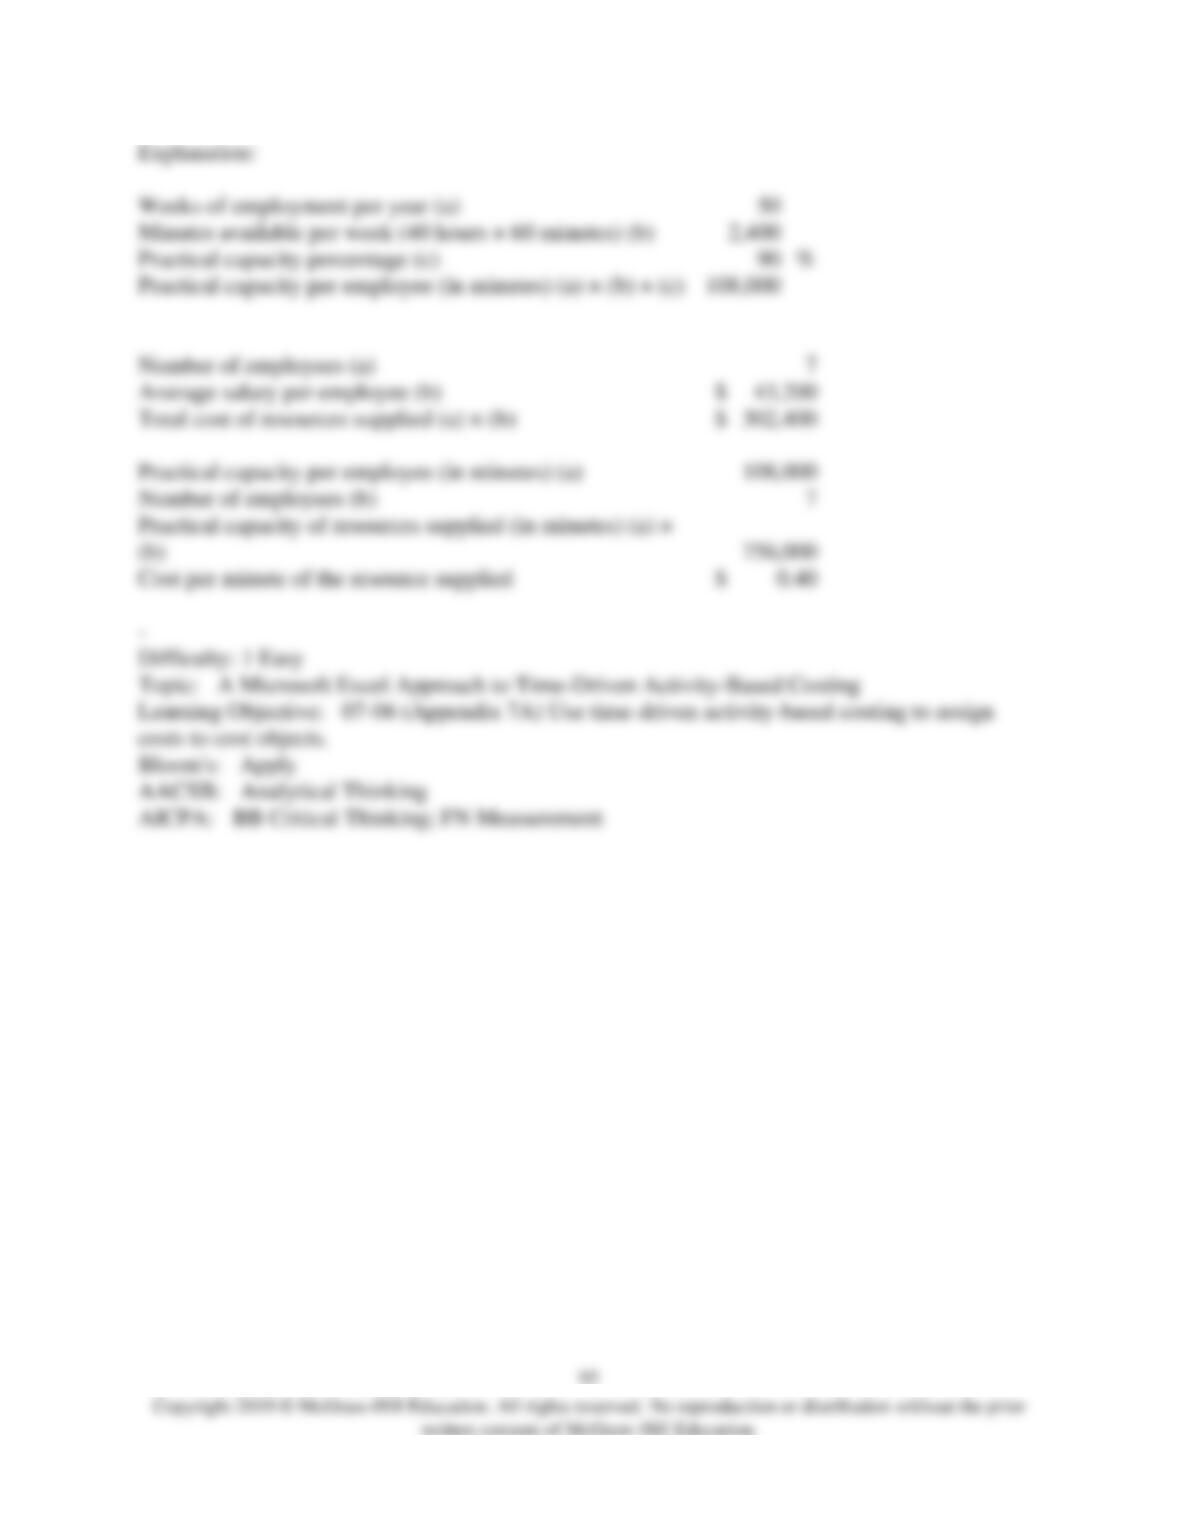
49) Lamorte Corporation is conducting a time-driven activity-based costing study in its Order
Fulfillment Department. The company has provided the following data to aid in that study:
Lamorte Corporation
Order Fulfillment Department
Data Inputs
Resource Data:
Number of employees
20
Average salary per employee
$
44,280
Weeks of employment per year
50
Minutes available per week (40 hours × 60 minutes)
2,400
Practical capacity percentage
90
%
–
Activity Data:
Processing
Orders
Preparing
Deliveries
Handling
Returns
Minutes per unit of the activity
20
22
36
–
Cost Object Data:
Customer X
Customer Y
Customer Z
Number of orders processed
30
19
6
–
On the Customer Cost Analysis report in time-driven activity-based costing, the cost per minute
of the resource supplied would be closest to:
A) $0.41 per minute
B) $18.45 per minute
C) $20.50 per minute
D) $0.37 per minute

50) Lamorte Corporation is conducting a time-driven activity-based costing study in its Order
Fulfillment Department. The company has provided the following data to aid in that study:
Lamorte Corporation
Order Fulfillment Department
Data Inputs
Resource Data:
Number of employees
20
Average salary per employee
$
44,280
Weeks of employment per year
50
Minutes available per week (40 hours × 60 minutes)
2,400
Practical capacity percentage
90
%
–
Activity Data:
Processing
Orders
Preparing
Deliveries
Handling
Returns
Minutes per unit of the activity
20
22
36
–
Cost Object Data:
Customer X
Customer Y
Customer Z
Number of orders processed
30
19
6
–
On the Customer Cost Analysis report in time-driven activity-based costing, the Processing
Orders cost assigned to Customer X would be closest to:
A) $246.00
B) $150.33
C) $8.20
D) $134.84

51) Lamorte Corporation is conducting a time-driven activity-based costing study in its Order
Fulfillment Department. The company has provided the following data to aid in that study:
Lamorte Corporation
Order Fulfillment Department
Data Inputs
Resource Data:
Number of employees
20
Average salary per employee
$
44,280
Weeks of employment per year
50
Minutes available per week (40 hours × 60 minutes)
2,400
Practical capacity percentage
90
%
–
Activity Data:
Processing
Orders
Preparing
Deliveries
Handling
Returns
Minutes per unit of the activity
20
22
36
–
Cost Object Data:
Customer X
Customer Y
Customer Z
Number of orders processed
30
19
6
On the Customer Cost Analysis report in time-driven activity-based costing, the Processing
Orders cost assigned to Customer Y would be closest to:
A) $155.80
B) $104.78
C) $150.33
D) $8.20
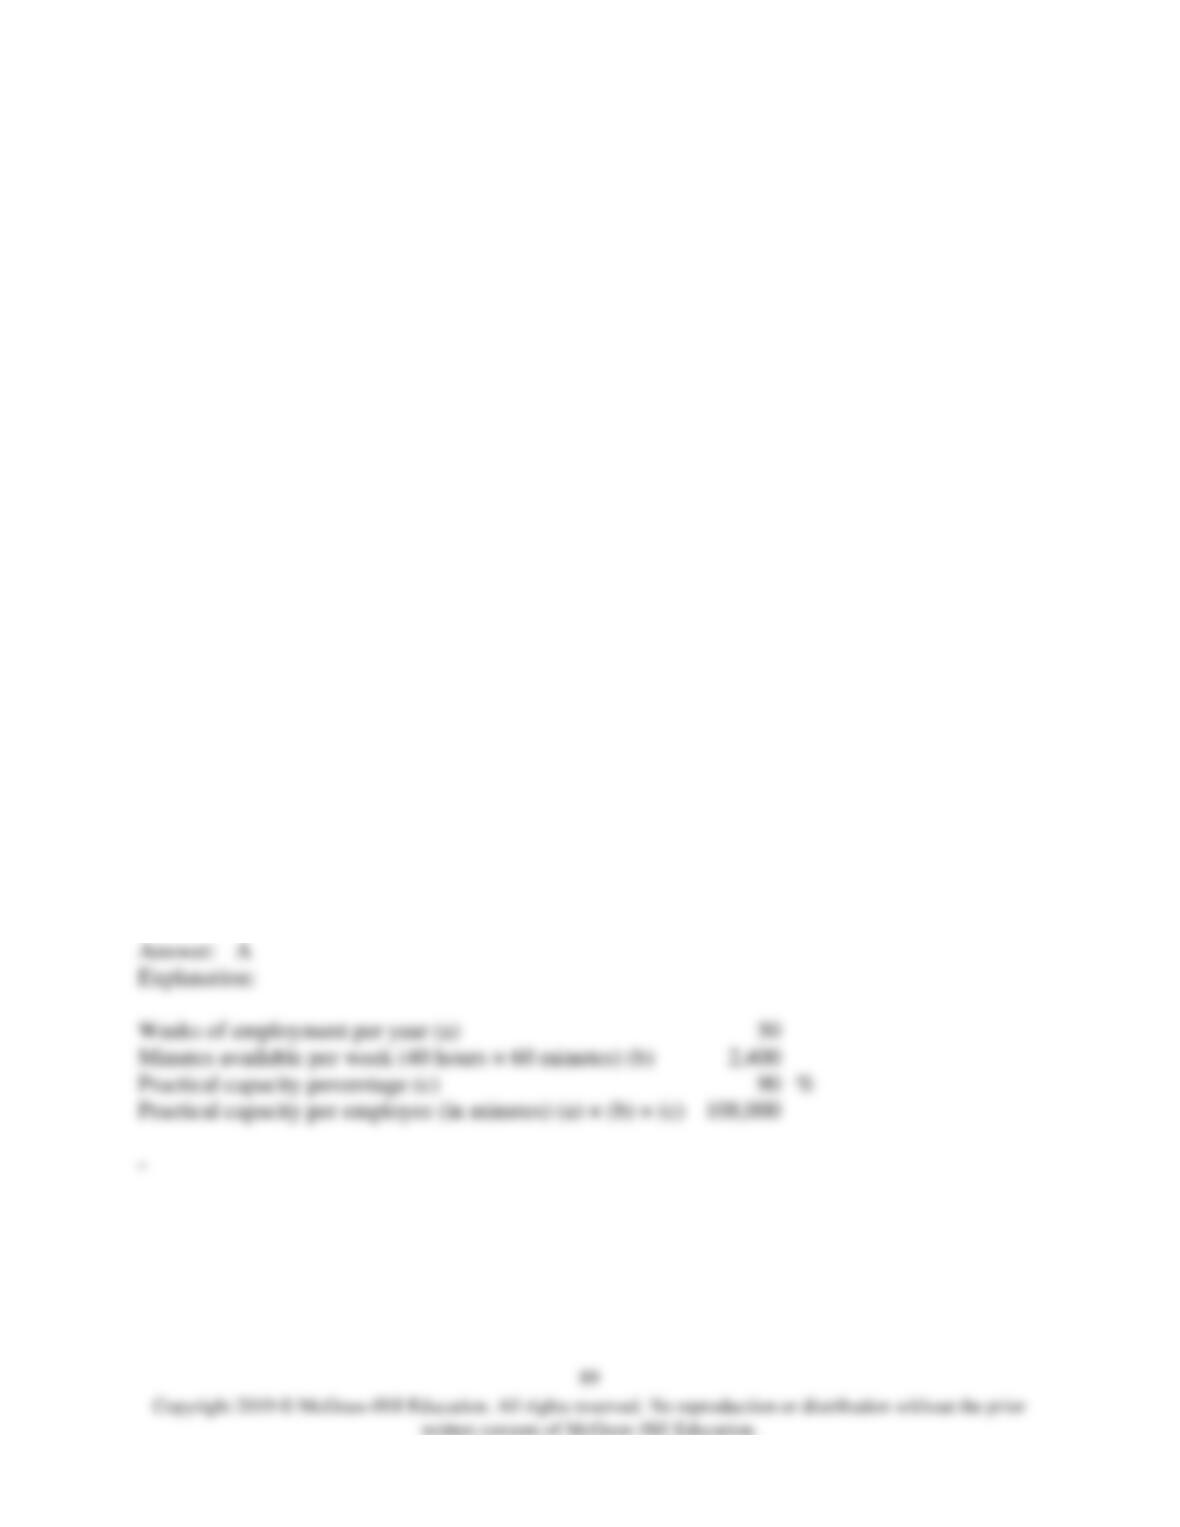
52) Lamorte Corporation is conducting a time-driven activity-based costing study in its Order
Fulfillment Department. The company has provided the following data to aid in that study:
Lamorte Corporation
Order Fulfillment Department
Data Inputs
Resource Data:
Number of employees
20
Average salary per employee
$
44,280
Weeks of employment per year
50
Minutes available per week (40 hours × 60 minutes)
2,400
Practical capacity percentage
90
%
–
Activity Data:
Processing
Orders
Preparing
Deliveries
Handling
Returns
Minutes per unit of the activity
20
22
36
–
Cost Object Data:
Customer X
Customer Y
Customer Z
Number of orders processed
30
19
6
On the Customer Cost Analysis report in time-driven activity-based costing, the Processing
Orders cost assigned to Customer Z would be closest to:
A) $49.20
B) $8.20
C) $69.24
D) $150.33
Weeks of employment per year (a)
Minutes available per week (40 hours × 60 minutes) (b)
Practical capacity percentage (c)
Practical capacity per employee (in minutes) (a) × (b) × (c)
–
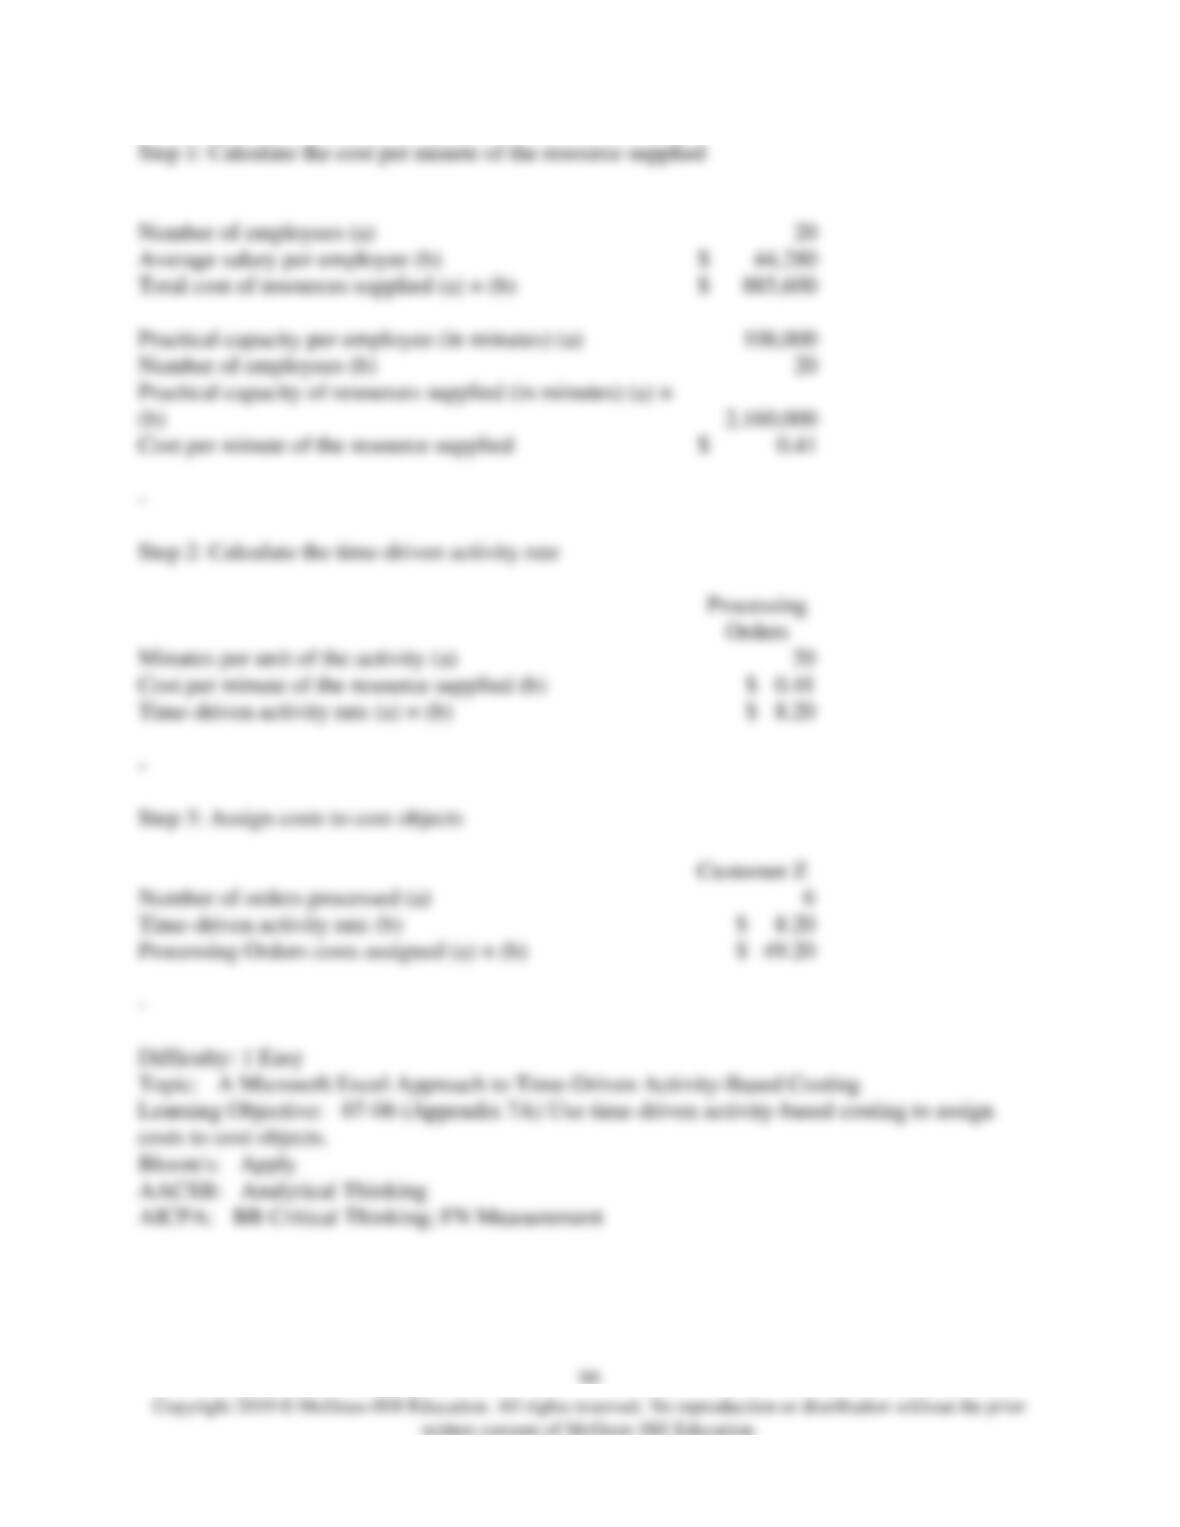
53) Gauch Corporation is conducting a time-driven activity-based costing study in its Customer
Support Department. The company has provided the following data to aid in that study:
Activity Data:
Receiving
Calls
Resolving
Issues
Settling
Disputes
Minutes per unit of the activity
18
30
48
Cost Object Data:
Customer M
Customer N
Customer O
Number of calls received
30
15
4
Number of issues resolved
19
12
8
Number of disputes settled
1
1
1
The cost per minute of the resource supplied is $0.40.
On the Customer Cost Analysis report in time-driven activity-based costing, the Receiving Calls
cost assigned to Customer M would be closest to:
A) $216.00
B) $117.60
C) $7.20
D) $113.60
Receiving
Minutes per unit of the activity (a)
Cost per minute of the resource supplied (b)
Time-driven activity rate (a) × (b)
Number of calls received (a)
Time-driven activity rate (b)
Receiving Calls costs assigned (a) × (b)
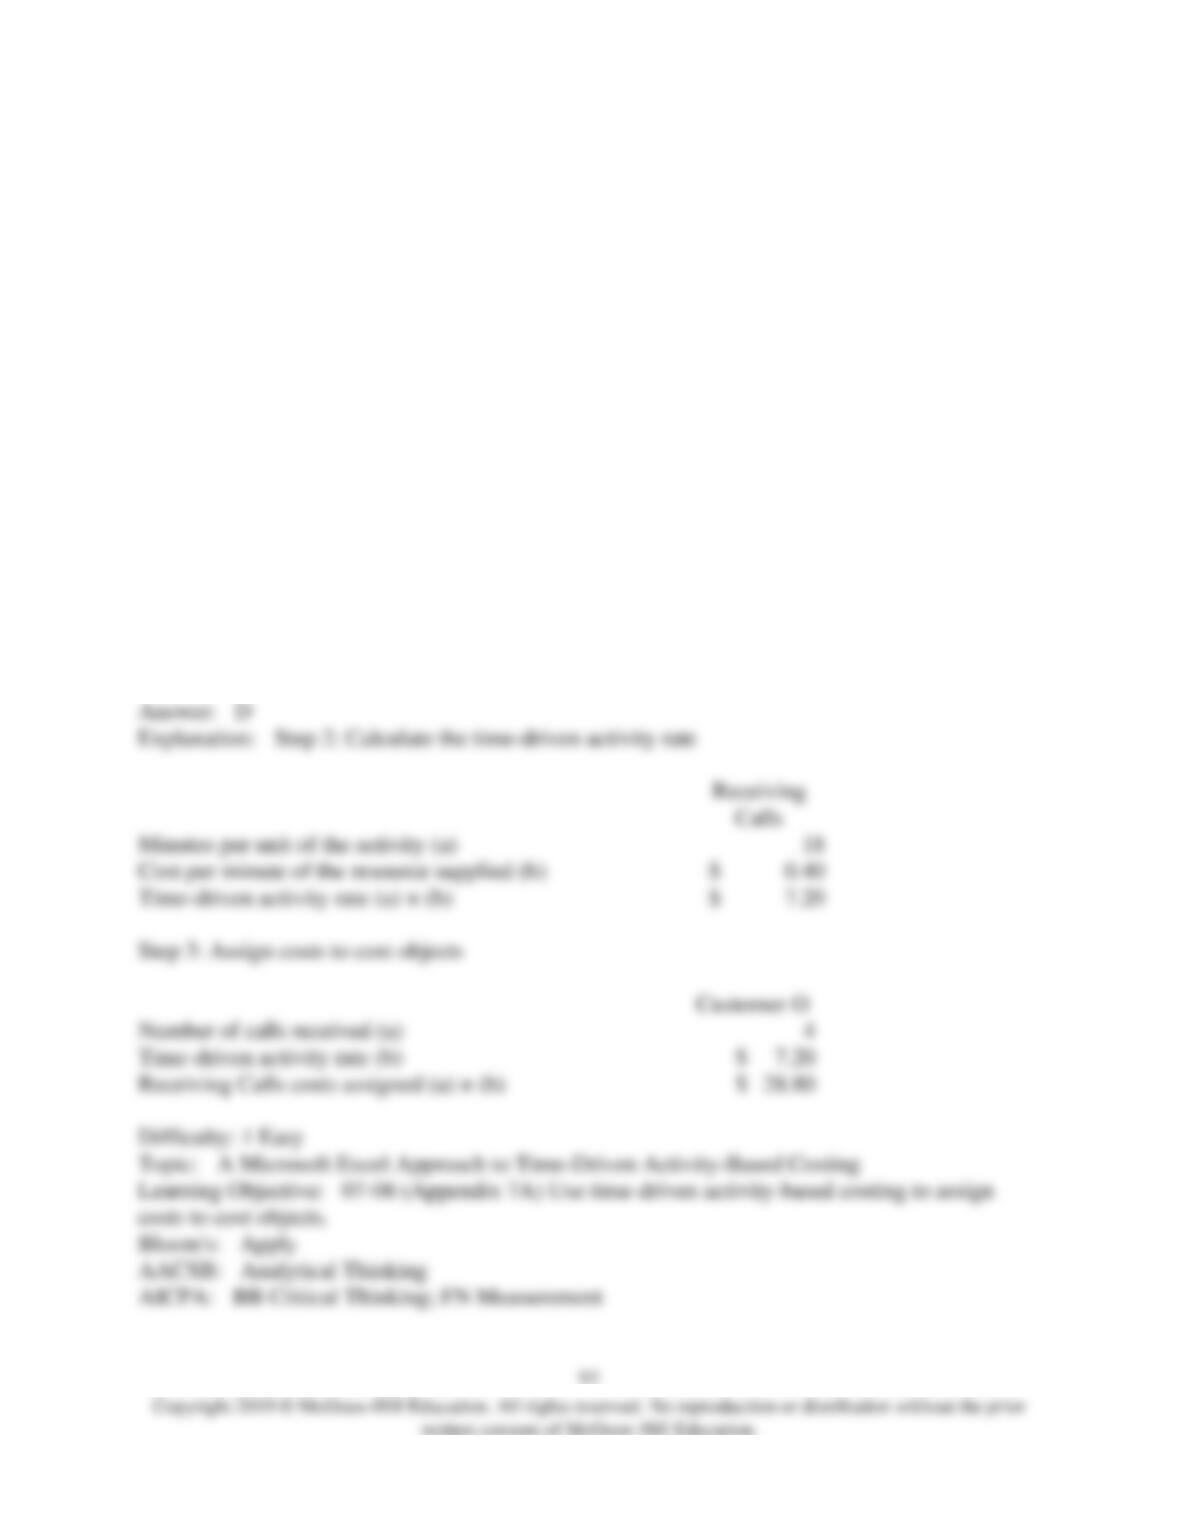
54) Gauch Corporation is conducting a time-driven activity-based costing study in its Customer
Support Department. The company has provided the following data to aid in that study:
Activity Data:
Receiving
Calls
Resolving
Issues
Settling
Disputes
Minutes per unit of the activity
18
30
48
Cost Object Data:
Customer M
Customer N
Customer O
Number of calls received
30
15
4
Number of issues resolved
19
12
8
Number of disputes settled
1
1
1
The cost per minute of the resource supplied is $0.40.
On the Customer Cost Analysis report in time-driven activity-based costing, the Receiving Calls
cost assigned to Customer N would be closest to:
A) $117.60
B) $108.00
C) $77.60
D) $7.20
Minutes per unit of the activity (a)
Cost per minute of the resource supplied (b)
Time-driven activity rate (a) × (b)
Number of calls received (a)
Time-driven activity rate (b)
7.20
Receiving Calls costs assigned (a) × (b)
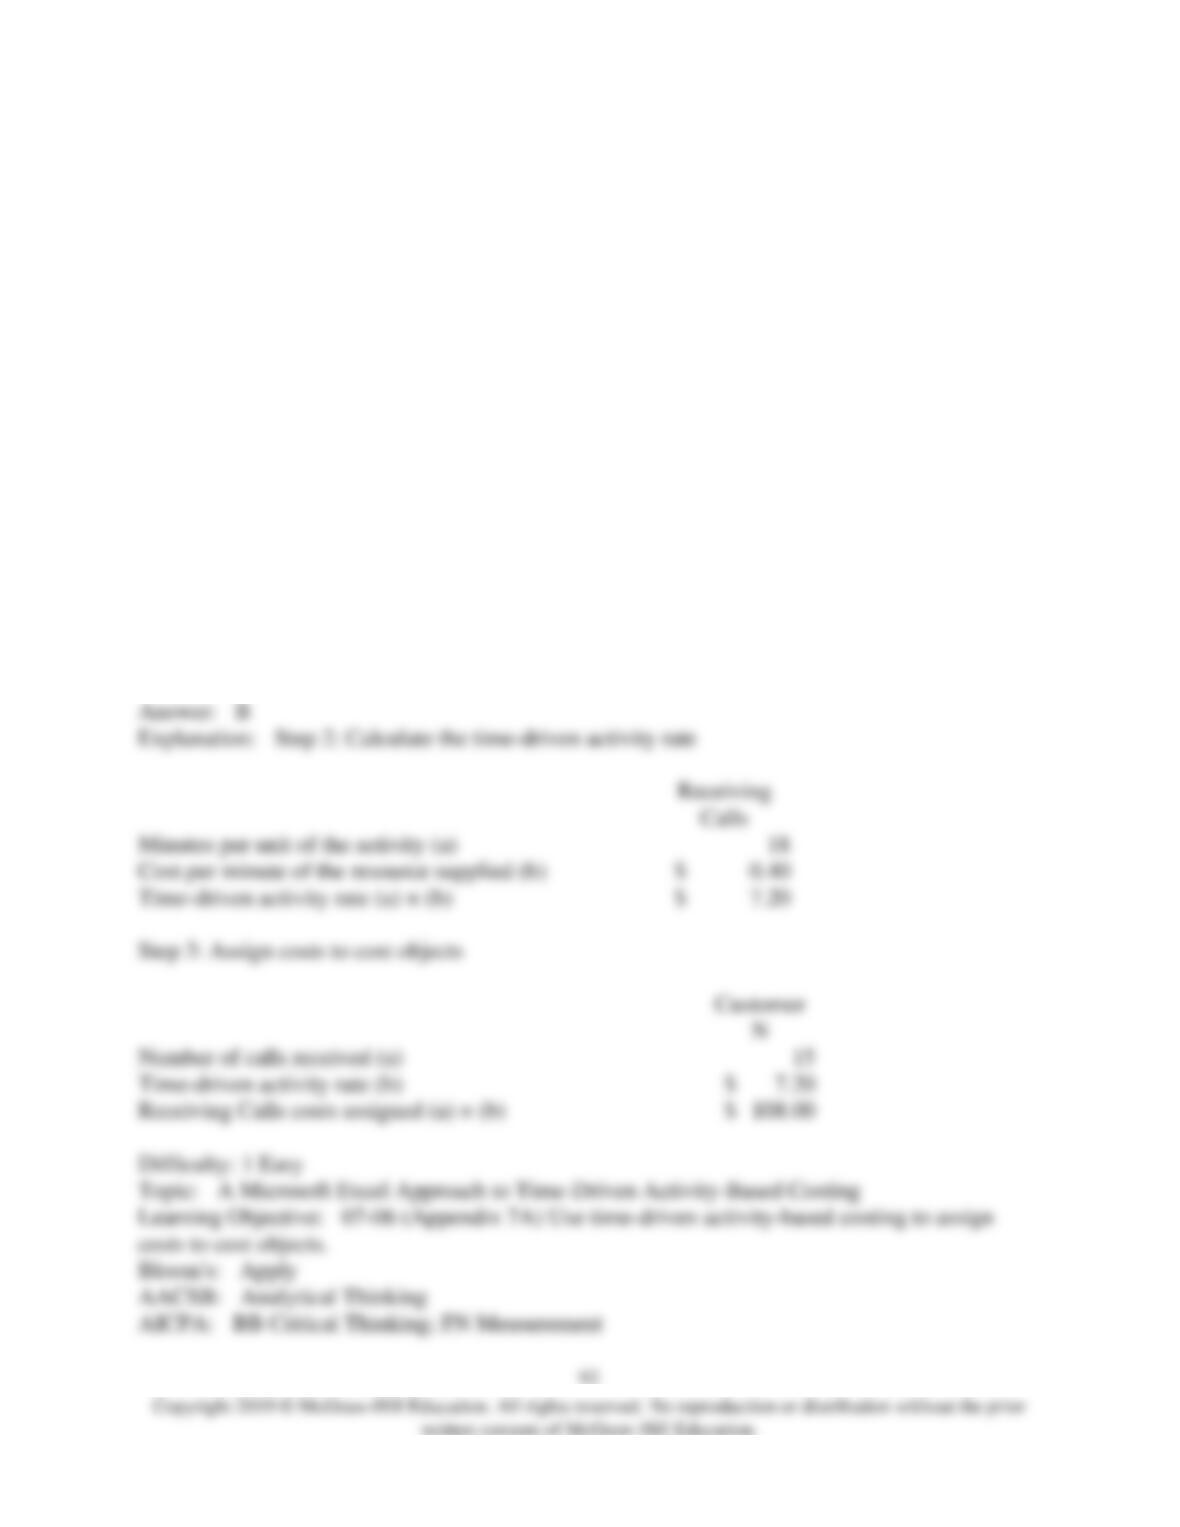
55) Gauch Corporation is conducting a time-driven activity-based costing study in its Customer
Support Department. The company has provided the following data to aid in that study:
Activity Data:
Receiving
Calls
Resolving
Issues
Settling
Disputes
Minutes per unit of the activity
18
30
48
Cost Object Data:
Customer M
Customer N
Customer O
Number of calls received
30
15
4
Number of issues resolved
19
12
8
Number of disputes settled
1
1
1
The cost per minute of the resource supplied is $0.40.
On the Customer Cost Analysis report in time-driven activity-based costing, the Receiving Calls
cost assigned to Customer O would be closest to:
A) $117.60
B) $51.20
C) $7.20
D) $28.80
Minutes per unit of the activity (a)
Cost per minute of the resource supplied (b)
Time-driven activity rate (a) × (b)
Number of calls received (a)
Time-driven activity rate (b)
Receiving Calls costs assigned (a) × (b)

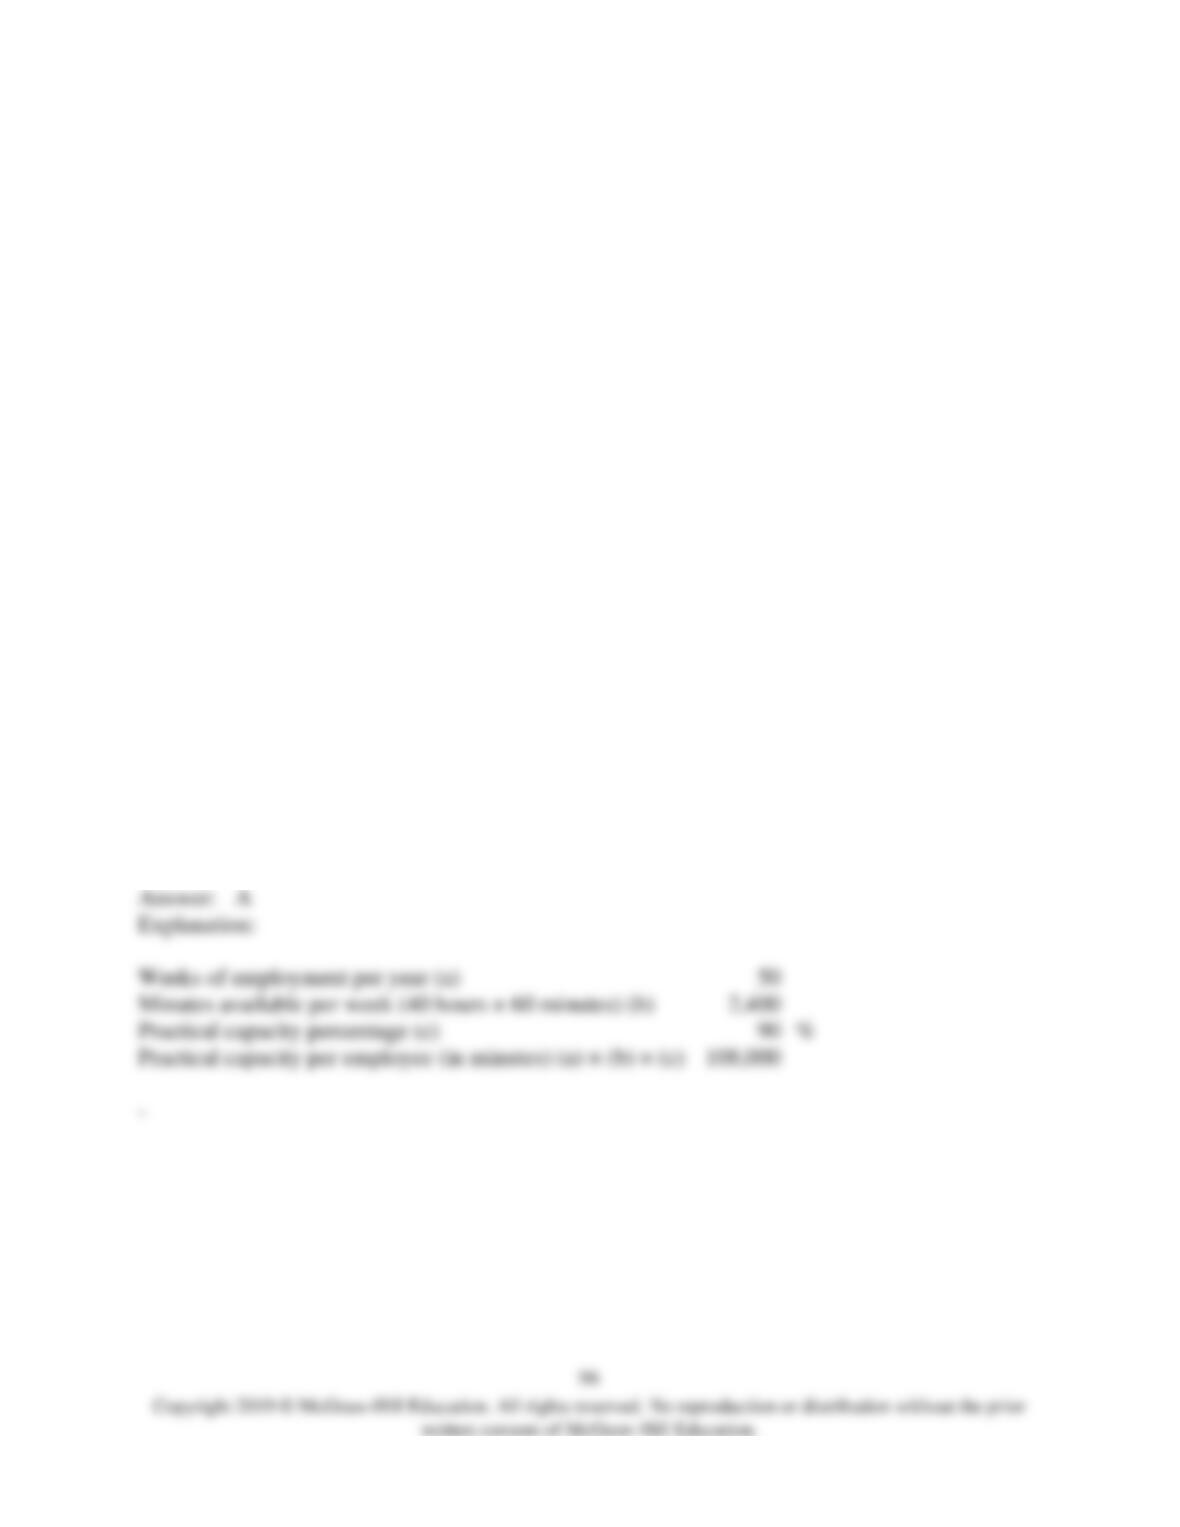
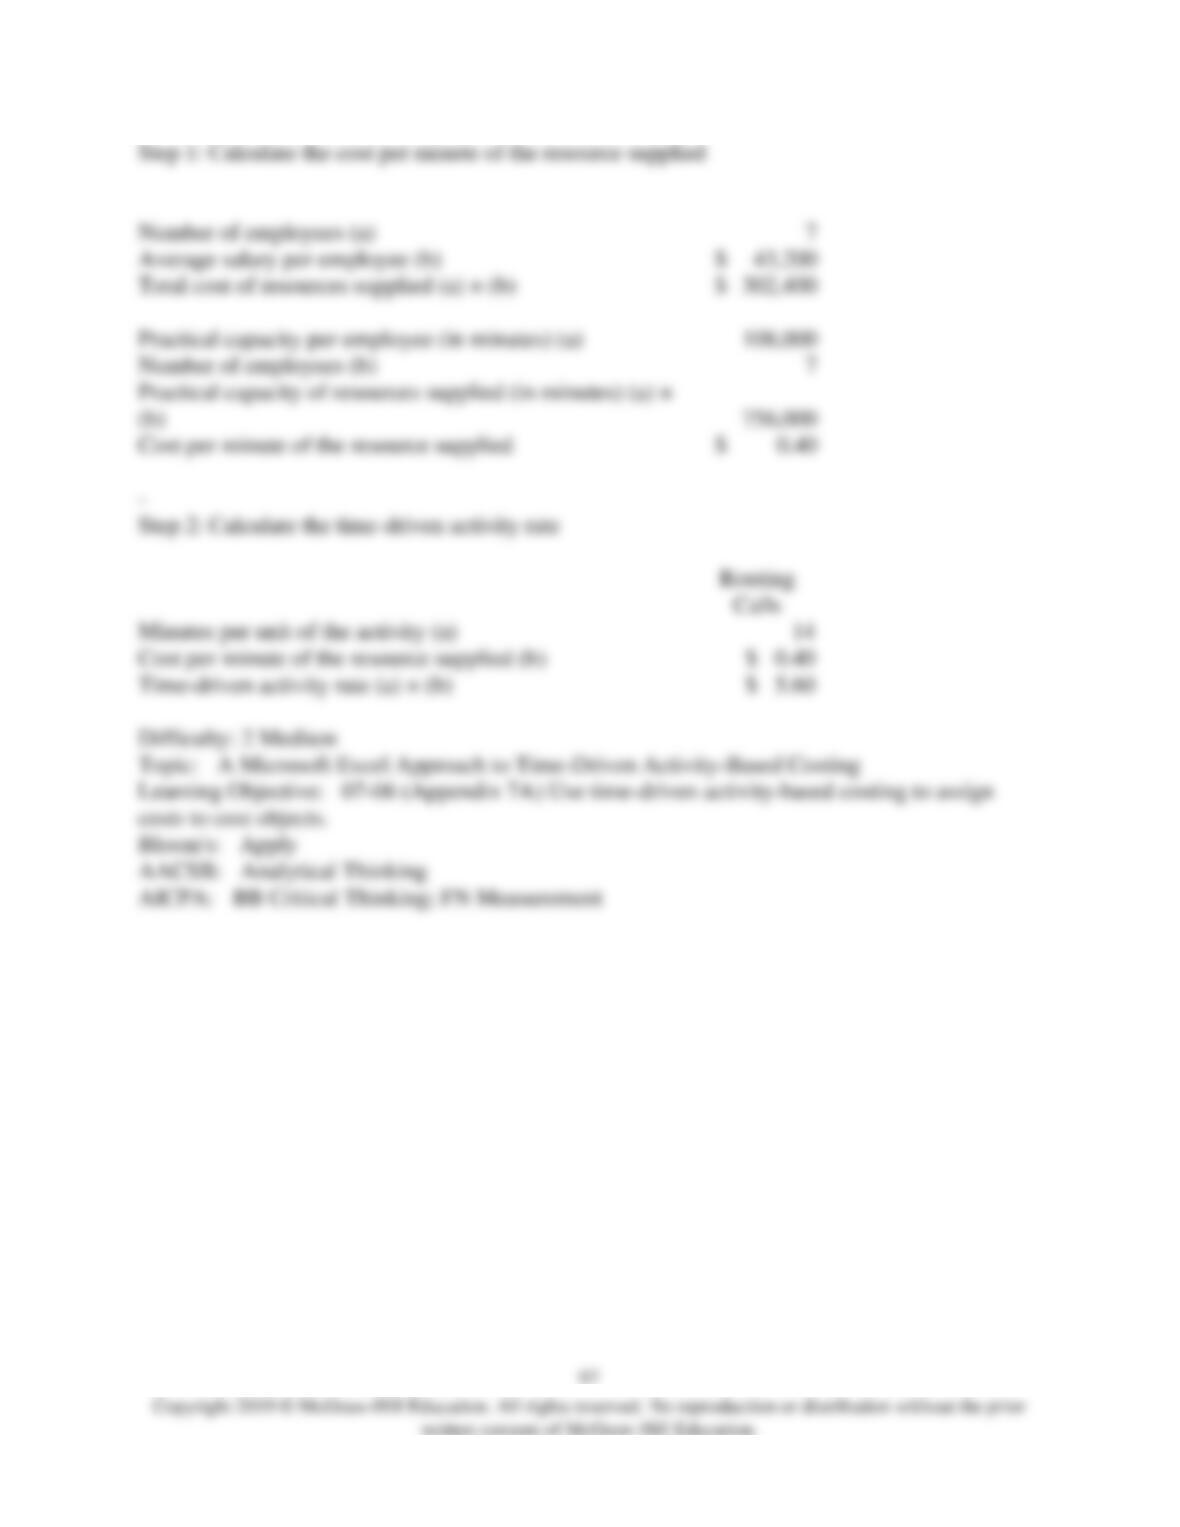
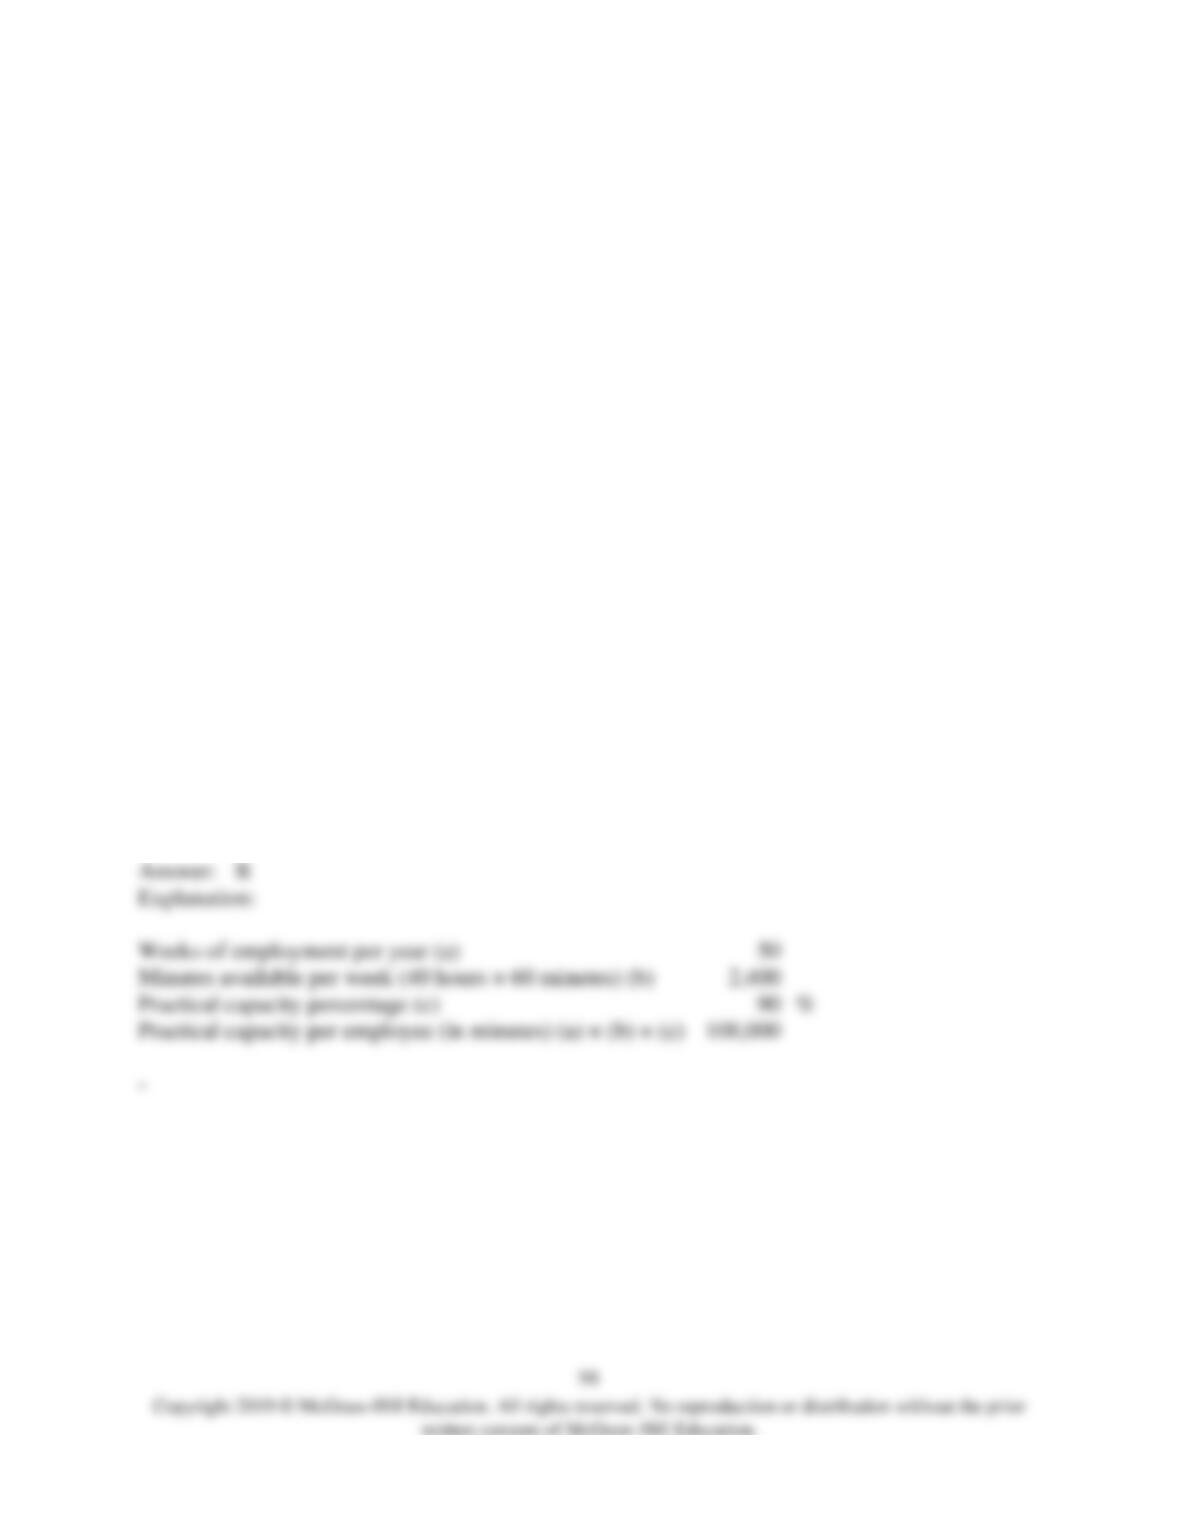
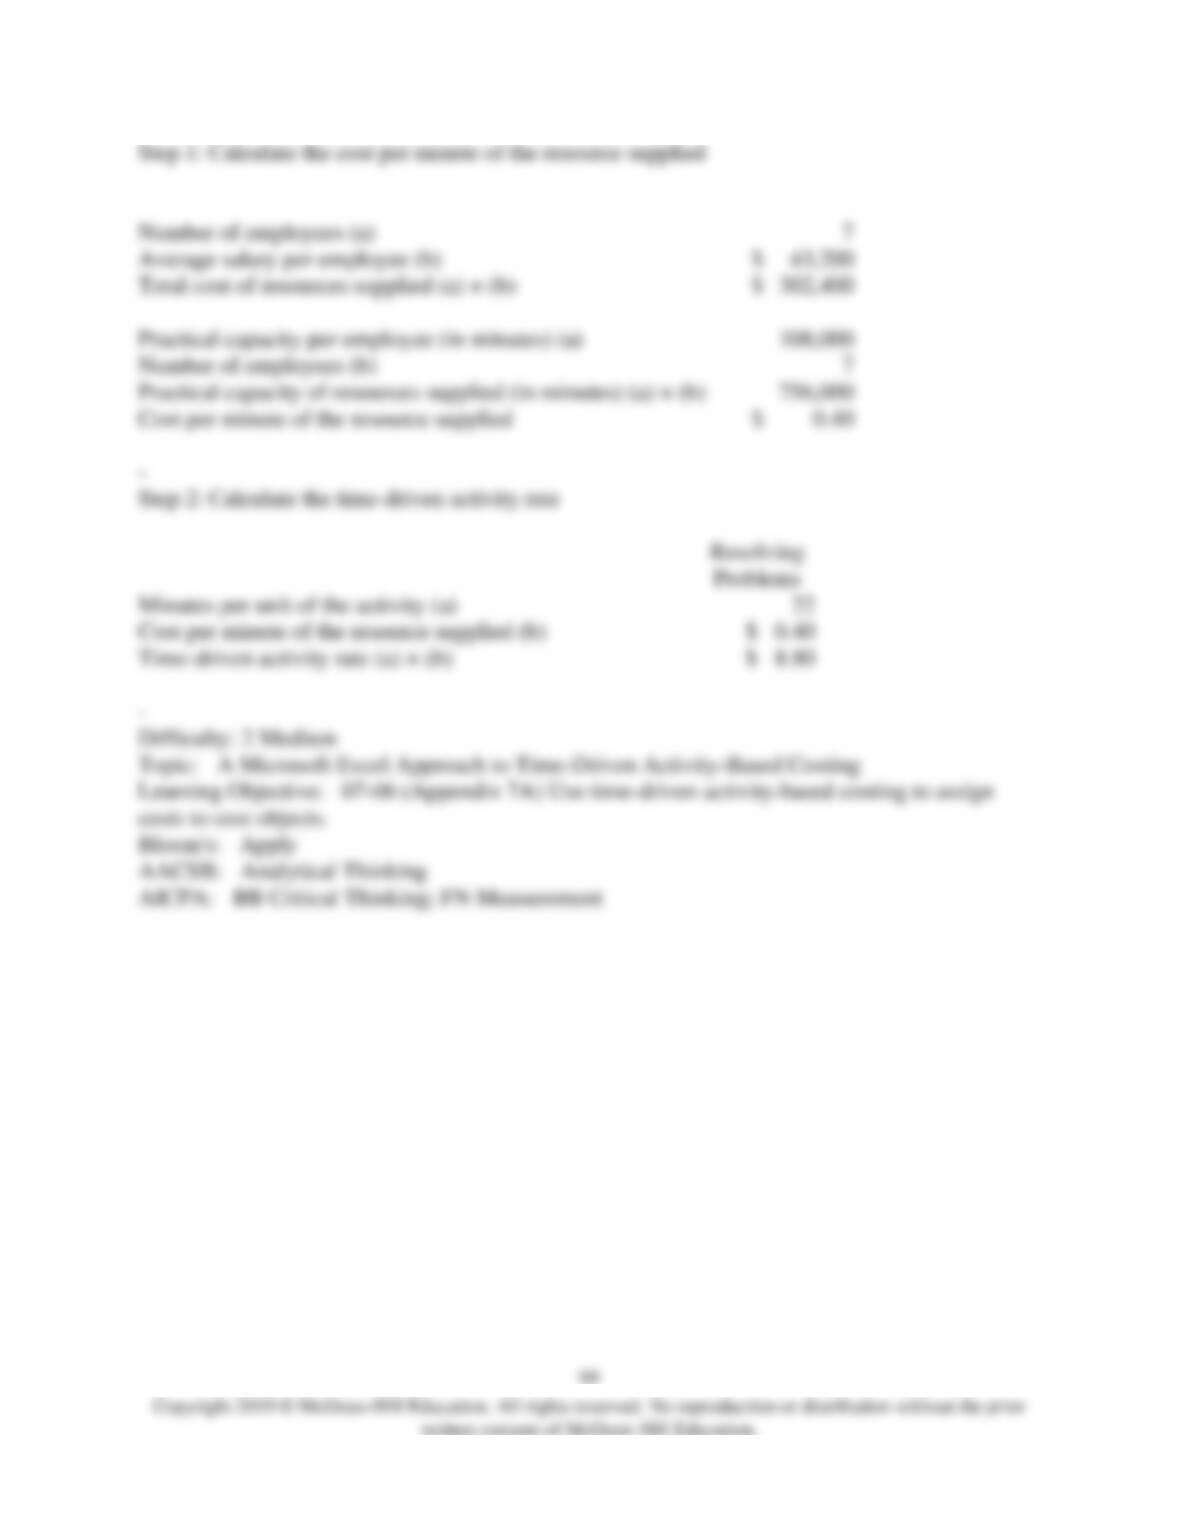
56) Jahnel Corporation is conducting a time-driven activity-based costing study in its Tech
Support Department. The company has provided the following data to aid in that study:
Jahnel Corporation
Tech Support Department
Data Inputs
Resource Data:
Number of employees
7
Average salary per employee
$
43,200
Weeks of employment per year
50
Minutes available per week (40 hours × 60 minutes)
2,400
Practical capacity percentage
90
%
Activity Data:
Routing Calls
Resolving
Problems
Preparing
Change
Orders
Minutes per unit of the activity
14
22
34
On the Customer Cost Analysis report in time-driven activity-based costing, the cost per minute
of the resource supplied would be closest to:
A) $0.40 per minute
B) $0.36 per minute
C) $20.00 per minute
D) $18.00 per minute
57) Jahnel Corporation is conducting a time-driven activity-based costing study in its Tech
Support Department. The company has provided the following data to aid in that study:
Jahnel Corporation
Tech Support Department
Data Inputs
Resource Data:
Number of employees
7
Average salary per employee
$
43,200
Weeks of employment per year
50
Minutes available per week (40 hours × 60 minutes)
2,400
Practical capacity percentage
90
%
–
Activity Data:
Routing Calls
Resolving
Problems
Preparing
Change
Orders
Minutes per unit of the activity
14
22
34
–
On the Customer Cost Analysis report in time-driven activity-based costing, the time-driven
activity rate for Routing Calls would be closest to:
A) $5.60 per call routed
B) $14.00 per call routed
C) $0.40 per call routed
D) $3.86 per call routed
Weeks of employment per year (a)
Minutes available per week (40 hours × 60 minutes) (b)
Practical capacity percentage (c)
Practical capacity per employee (in minutes) (a) × (b) × (c)
–
58) Jahnel Corporation is conducting a time-driven activity-based costing study in its Tech
Support Department. The company has provided the following data to aid in that study:
Jahnel Corporation
Tech Support Department
Data Inputs
Resource Data:
Number of employees
7
Average salary per employee
$
43,200
Weeks of employment per year
50
Minutes available per week (40 hours × 60 minutes)
2,400
Practical capacity percentage
90
%
–
Activity Data:
Routing Calls
Resolving
Problems
Preparing
Change
Orders
Minutes per unit of the activity
14
22
34
–
On the Customer Cost Analysis report in time-driven activity-based costing, the time-driven
activity rate for Resolving Problems would be closest to:
A) $0.40 per problem resolved
B) $8.80 per problem resolved
C) $1.82 per problem resolved
D) $22.00 per problem resolved
Weeks of employment per year (a)
Minutes available per week (40 hours × 60 minutes) (b)
Practical capacity percentage (c)
Practical capacity per employee (in minutes) (a) × (b) × (c)
–

59) Jahnel Corporation is conducting a time-driven activity-based costing study in its Tech
Support Department. The company has provided the following data to aid in that study:
Jahnel Corporation
Tech Support Department
Data Inputs
Resource Data:
Number of employees
7
Average salary per employee
$
43,200
Weeks of employment per year
50
Minutes available per week (40 hours × 60 minutes)
2,400
Practical capacity percentage
90
%
–
Activity Data:
Routing Calls
Resolving
Problems
Preparing
Change
Orders
Minutes per unit of the activity
14
22
34
–
On the Customer Cost Analysis report in time-driven activity-based costing, the time-driven
activity rate for Preparing Change Orders would be closest to:
A) $13.60 per change order prepared
B) $1.18 per change order prepared
C) $0.40 per change order prepared
D) $34.00 per change order prepared
Weeks of employment per year (a)
Minutes available per week (40 hours × 60 minutes) (b)
Practical capacity percentage (c)
Practical capacity per employee (in minutes) (a) × (b) × (c)
–