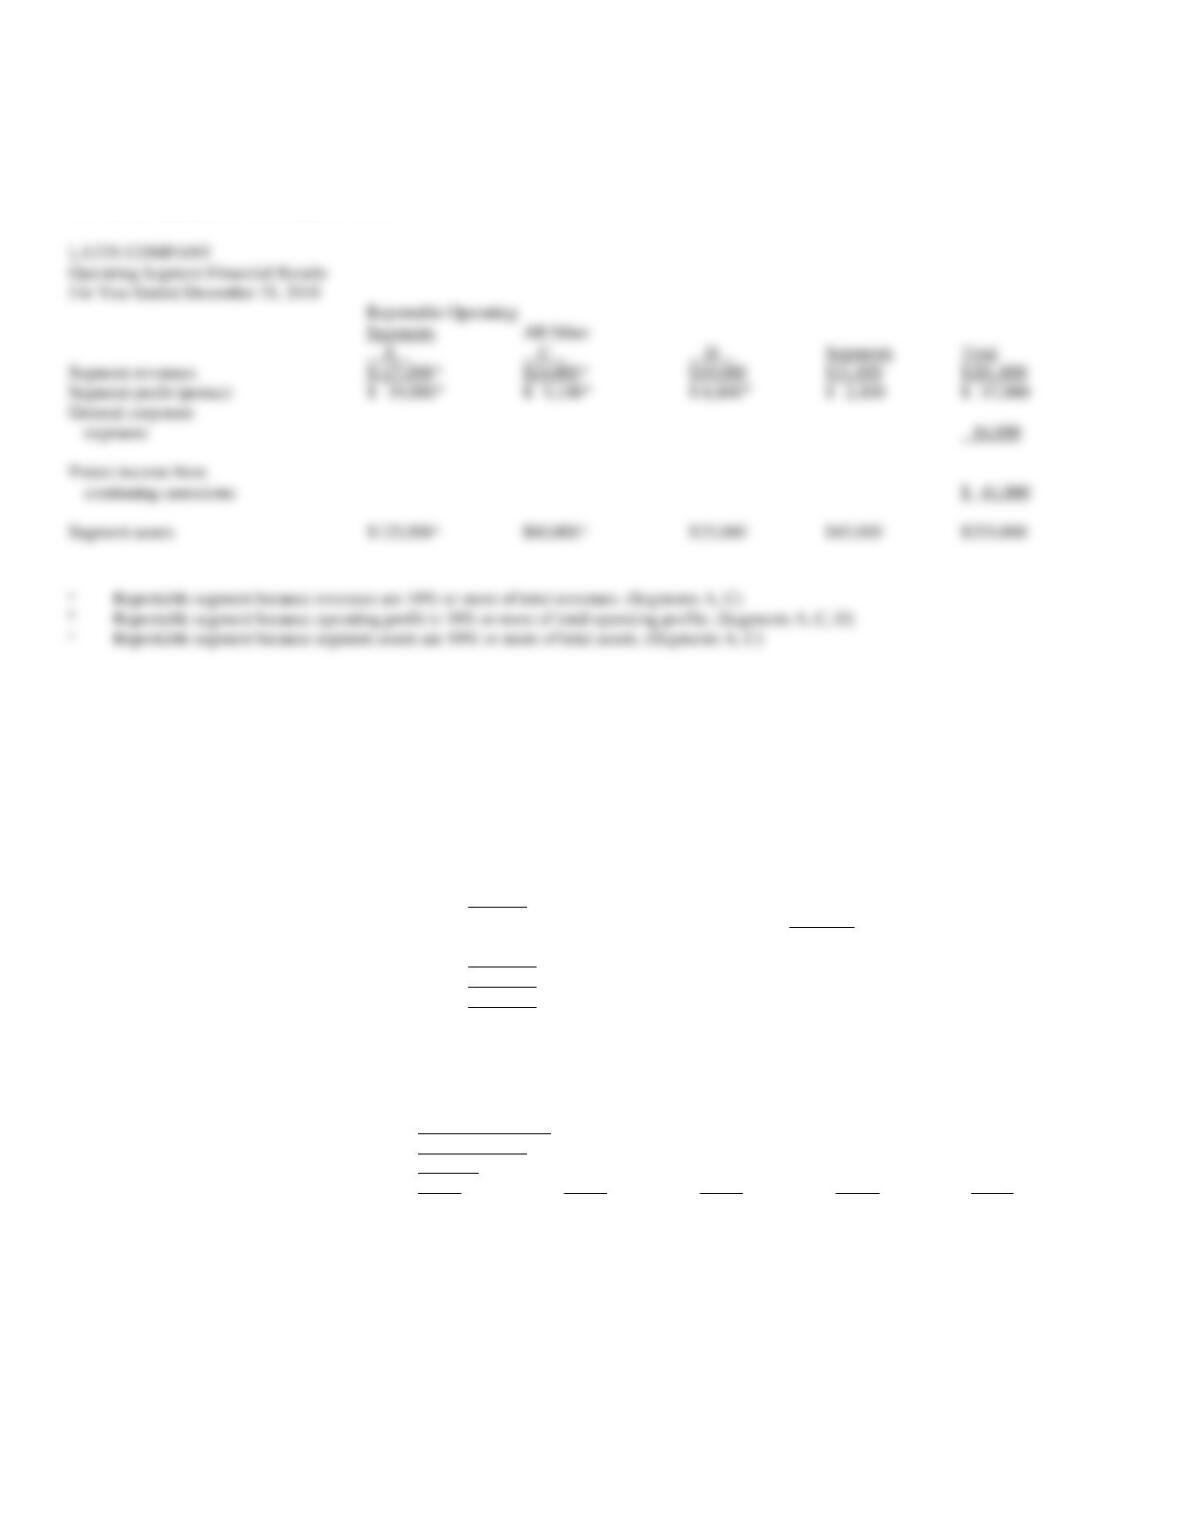
Included in Latin’s operating expenses are general corporate expenses of $16,000.
Required:
Based on the provisions of current GAAP, prepare a schedule that reflects required disclosures about operating segments from the above information
for Latin Company exclusive of any footnotes.
76. The Hope Company’s condensed 2010 income statement is presented below:
Sales
$500,000
Less: Cost of goods sold
300,000
Gross profit
$200,000
Less:
Operating expenses
$50,000
Depreciation expense
20,000
Total expenses
(70,000)
Pretax income
$130,000
Income tax expense
52,000
Net income
$ 78,000
Earnings per share
(40,000 shares)
$ 1.95
The following operating segment information is available for Hope Company:
Amount Identified
with Operating
Segment
A
B
C
D
E
Segment assets
$60,000
$130,000
$325,000
$63,500
$71,500
Revenues
45,000
45,000
295,000
40,000
75,000
Cost of goods sold
45,000
28,000
152,000
30,000
45,000
Operating expenses
2,500
2,500
32,500
2,500
10,000
Depreciation expense
3,000
1,100
10,900
2,000
3,000
LATIN COMPANY
Reportable Operating
Segments
All Other
A
C
D
Segments
Total
Segment revenues
$19,000
$31,000
$201,000
Segment profit (pretax)
$ 2,100
$ 57,000
General corporate
expenses
16,000
Pretax income from
continuing operations
$ 41,000
Segment assets
$25,000
$45,000
$255,000
Reportable segment because revenues are 10% or more of total revenues. (Segments A, C)
Reportable segment because operating profit is 10% or more of total operating profits. (Segments A, C, D)
Reportable segment because segment assets are 10% or more of total assets. (Segments A, C)
Required:
Indicate which operating segment(s) of Hope Company should be reported under:
a.
the revenue test
b.
the profit test
c.
the asset test
77. Falconhead Supply had three operating segments during 2010. In determining whether these segments are
considered reportable segments, Falconhead has gathered the following information:
Segment
A
B
C
Revenues
$ 60,000
$ 80,000
$160,000
Expenses
30,000
50,000
85,000
Assets
200,000
180,000
420,000
Segments C and E have revenues greater than 10% of combined revenues.
Segment A: $45,000 – $45,000 – $2,500 – $ 3,000 = $(5,500)
Segment B: $45,000 – $28,000 – $2,500 – $1,100 = $13,400
Segment C: $295,000 – $152,000 – $32,500 – $10,900 = $99,600
Segment D: $40,000 – $30,000 – $2,500 – $2,000 = $5,500
Segment E: $75,000 – $45,000 – $10,000 – $3,000 = $17,000
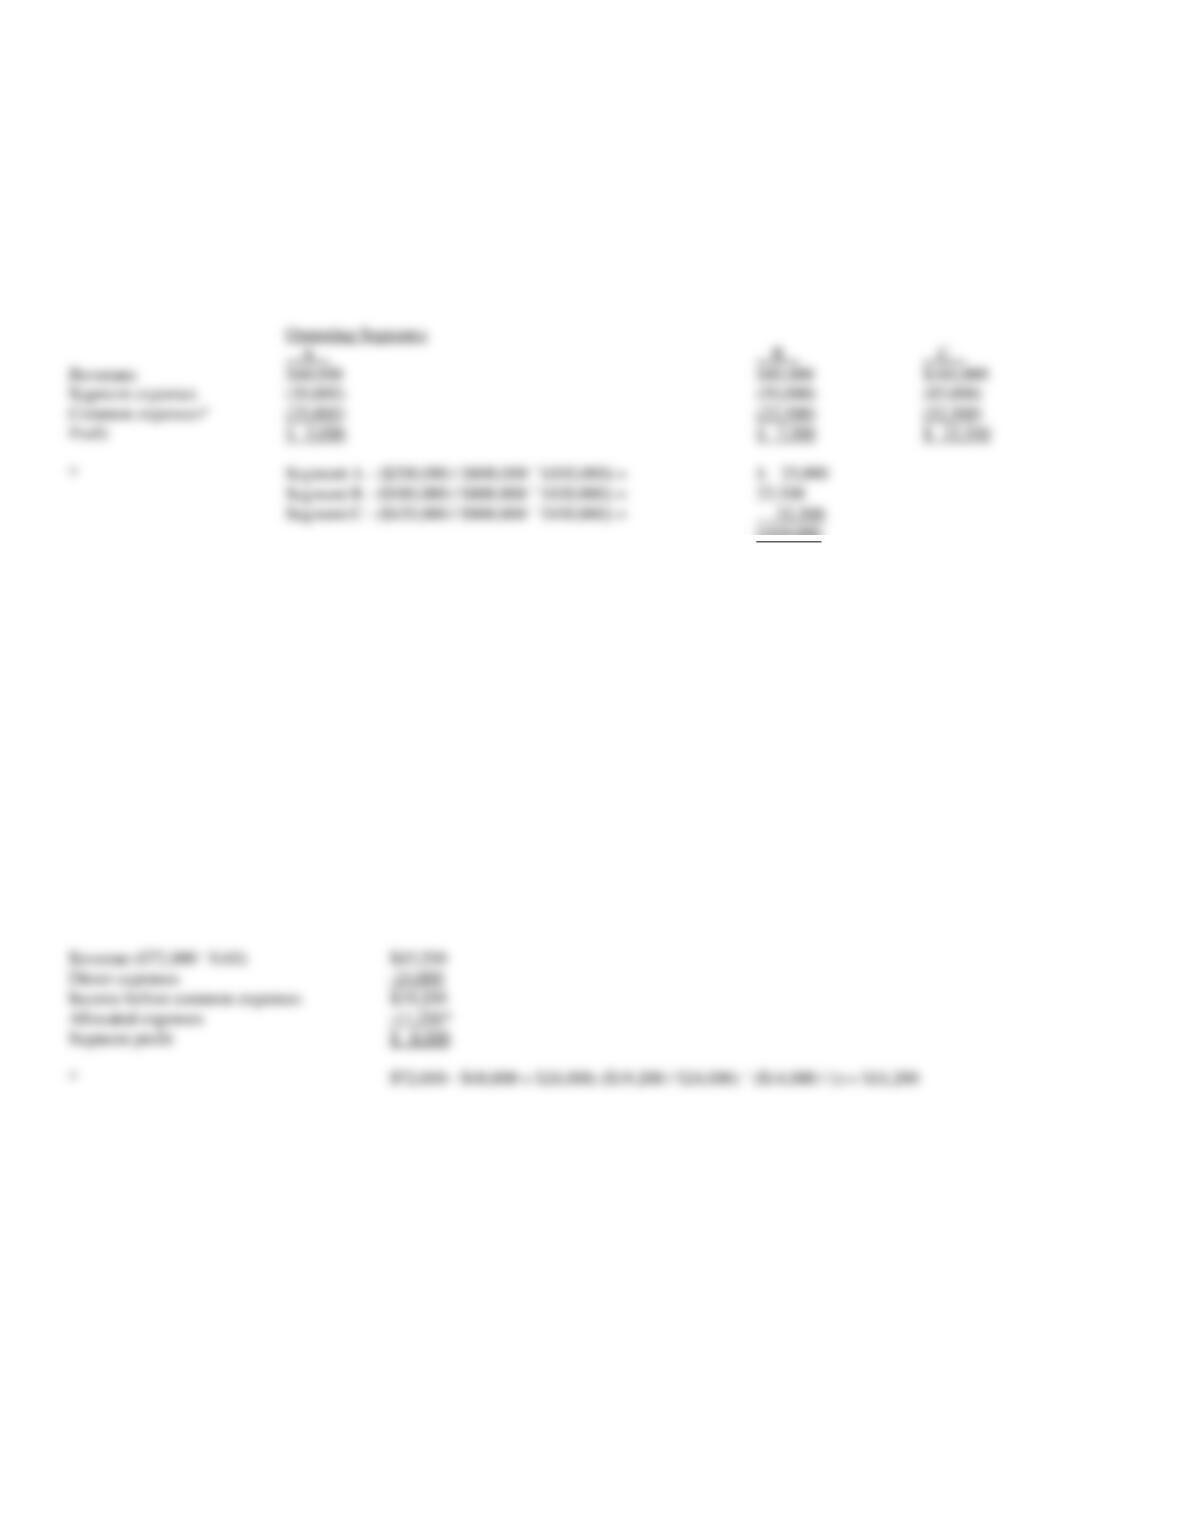
In addition, Falconhead has incurred $100,000 of common expenses that can be reasonably allocated to the three segments. Since most of the
common costs relate to the physical operating capability of Falconhead, a reasonable allocation method is to allocate the common costs to each
segment based on the ratio of a segment’s assets to total assets of the three segments.
Required:
Compute the profit (loss) for each operating segment under current GAAP provisions.
$100,000
78. Wellington, Inc. has three reportable segments. Company revenues amounted to $72,000 in 2010, of which
Segment C contributed 60%. Direct expenses were $24,000 for Segment C out of a total of $48,000 for the
company as a whole. In addition, $14,000 of common expenses were incurred with a portion allocated to
Segment C based on the ratio of Segment C’s income before common expenses to the total income before
common expenses.
Required:
Compute Segment C’s profit.
Revenue ($72,000 ´ 0.60)
Income before common expenses
Allocated expenses
Segment profit
*
Operating Segments
A
B
C
Revenues
$60,000
$80,000
$160,000
Segment expenses
(30,000)
(50,000)
(85,000)
Profit
$ 5,000
$ 7,500
$ 22,500
*
Segment A – ($200,000 / $800,000 ´ $100,000) =
$ 25,000
Segment C – ($420,000 / $800,000 ´ $100,000) =
52,500
79. The following information was obtained from the Clovis Company:
Operating
Segment
Profit
Segment
Revenue
Assets
(Loss)
A
$ 640
$ 520
$ 88
B
124
120
32
C
760
680
40
D
160
240
(8)
E
32
64
(4)
F
80
96
16
G
480
400
16
H
120
160
(48)
$2,396
$2,280
$132
Required:
a.
Using the revenue test, which segments should be separately reported?
b.
Using the asset test, which segments should be separately reported?
c.
Using the profit (loss) test, which segments should be separately reported?
80. Selected account balances of Waltman Company on June 30, 2010 and information about the company’s
second-quarter operations are as follows:
Sales (net)
$200,000
Purchases (net)
125,000
Selling expenses
25,000
General and administrative expenses
18,000
Inventory (3/31/10)
20,000
Note payable, 12% interest payable each
December 31, principal due December 31, 2013
20,000
Common stock, $10 par
30,000
Additional information:
·
Waltman uses the gross profit method to determine the interim inventory balance. In the past, gross profit rates have averaged 40% of
net sales.
·
In May, a competitor began distribution of an item that makes a product sold by Waltman obsolete. Waltman estimates that the
historical cost of this product in inventory at the end of June is $15,000, and the net realizable value (and current market value) is
$2,000.
·
In April, Waltman sold a large piece of manufacturing equipment for a gain of $40,000.
·
The company owns buildings and equipment with a historical cost of $220,000. These assets are being depreciated by the straight-line
method (no residual value) over a 25-year period.
·
Waltman currently expects an annual income tax rate of 30%. In the first quarter, the company reported pretax earnings of $30,000 and
income tax expense of $12,000, based on a 40% estimated tax rate.
a.
A, C, and G (Test = 0.10 ´ $2,396 = $240; any segment with revenues > $240)
A, C, D, and G (Test = 0.10 ´ $2,280 = $228; any segment with assets > $228)
c.
A, B, C, and H [Test = 0.10 ´ ($16 + $16 + $88 + $32 + $40) = $19.2; any segment with absolute amount of profit or loss > $19.2]
Required:
Prepare an income statement for the Waltman Company for the second quarter of 2010.
81. In the first quarter of 2010, Hill Caterpillar Sales reported $900 of income before taxes. The estimated
effective tax rate was 20%. In the second quarter, the company reported $800 of income before taxes, and the
estimated effective tax rate increased to 25%.
Required:
Compute the second quarter tax expense for Hill Caterpillar Sales.
82. Ralph Mechanical has just completed a year during which legislative action has changed the tax laws twice.
As a result Ralph’s estimated tax rate has varied somewhat. The table below shows management’s best estimates
of the effective tax rate at the end of each quarter along with quarterly income before tax.
Tax Rate
Income before
Estimated for
Tax for Current
Quarter
Quarterly Report
Quarter
1
25%
$1,500
2
35%
1,200
3
30%
1,900
4
30%
2,500
Required:
Using guidelines from current GAAP, calculate the tax expense that would be reported in the
a.
first quarter financial results
b.
second quarter financial results
c.
third quarter financial results
d.
fourth quarter financial results
83. The Wilson Company’s financial statements are presented below for 2011 and 2010.
WILSON COMPANY
Income Statements
For Years Ended December 31, 2011 and 2010
2011
2010
Sales
$90,000
$100,000
Cost of goods sold
(67,000)
(75,000)
Gross profit
$23,000
$ 25,000
Operating expenses
(12,000)
(14,000)
Income taxes
(5,000)
(4,000)
Income from continuing operations
$ 6,000
$ 7,000
Extraordinary items (net of taxes)
(2,000)
2,000
Net income
$ 4,000
$ 9,000
Earnings per share
$ 1.00
$ 2.25
a.
$375 ($1,500 ´ 0.25)
b.
$570 [($1,500 + $1,200) ´ 0.35] – $375
c.
$435 [($1,500 + $1,200 + $1,900) ´ 0.30] – ($375 + $570)
d.
$750 ($2,500 ´ 0.30)
WILSON COMPANY
Balance Sheets
December 31, 2011 and 2010
2011
2010
Cash
$ 4,000
$ 8,000
Receivables
4,000
2,000
Inventories
5,000
5,000
Long-term investments
8,000
5,000
Property and equipment (net)
90,000
80,000
Total assets
$111,000
$100,000
Current liabilities
$ 5,000
$ 3,000
Bonds payable
50,000
45,000
Common stock, $10 par
40,000
40,000
Premium on common stock
2,000
2,000
Retained earnings
14,000
10,000
Total liabilities and stockholders’ equity
$111,000
$100,000
Required:
Prepare vertical analyses of the income statements and balance sheets for 2011 and 2010.
WILSON COMPANY
Income Statements
For Years Ended December 31, 2011 and 2010
2011
2010
Amount
%
Amount
%
Sales
$90,000
100.0
$100,000
100.0
Cost of goods sold
(67,000)
(74.4)
(75,000)
(75.0)
Gross profit
$23,000
25.6
$ 25,000
25.0
Operating expenses
(12,000)
(13.3)
(14,000)
(14.0)
Income taxes
(5,000)
(5.6)
(4,000)
(4.0)
Income from continuing operations
$ 6,000
6.7
$ 7,000
7.0
Net income
$ 4,000
$ 9,000
9.0
Rounded up to balance
WILSON COMPANY
2011
2010
Amount
%
Amount
%
Cash
$ 4,000
3.6
$ 8,000
8.0
Receivables
4,000
3.6
2,000
2.0
Inventories
5,000
4.5
5,000
5.0
Long-term investments
8,000
7.2
5,000
5.0
Property and equipment (net)
90,000
81.1
80,000
80.0
Total assets
$111,000
100.0
$100,000
100.0
Current liabilities
$ 5,000
4.5
$ 3,000
3.0
Bonds payable
50,000
45.0
45,000
45.0
Common stock, $10 par
40,000
36.0
40,000
40.0
Premium on common stock
2,000
1.8
2,000
2.0
Retained earnings
14,000
12.6
10,000
10.0
Total liabilities and
stockholders’ equity
$111,000
100.0*
$100,000
100.0
*
Rounded up to balance
84. Hunter Company presented the following summarized data on its comparative balance sheets for 2012,
2011, and 2010:
2012
2011
2010
Current assets
$ 30,000
$ 15,000
$ 20,000
Long-term investments
8,000
7,000
5,000
Prop., plant, & equip.
100,000
90,000
80,000
Intangible assets
3,000
2,500
2,000
Total assets
$141,000
$114,500
$107,000
Current liabilities
$ 20,000
$ 12,000
$ 15,000
Long-term liabilities
10,000
20,000
30,000
Contributed capital
70,000
60,000
50,000
Retained earnings
41,000
22,500
12,000
Total liab. & stock-
holders’ equity
$141,000
$114,500
$107,000
Required:
Prepare horizontal analyses for the years 2012, 2011, and 2010 using
a.
a year-to-year approach
b.
a base-year approach
holders’ equity
$26,500
23.1
$ 7,500
7.0
$34,000
31.8
a.
(Decr.)
2011-2012
2010-2011
2010-2012
Amount
%
Amount
%
Amount
%
Current assets
$15,000
100.0
$(5,000)
(25.0)
$10,000
50.0
Long-term investments
1,000
14.3
2,000
40.0
3,000
60.0
Prop, plant & equip.
10,000
11.1
10,000
12.5
20,000
25.0
Intangible assets
500
20.0
500
25.0
1,000
50.0
Total assets
$26,500
23.1
$ 7,500
7.0
$34,000
31.8
Current liabilities
$ 8,000
66.7
$(3,000)
(20.0)
$ 5,000
33.3
Long-term liabilities
(10,000)
(50.0)
(10,000)
(33.3)
(20,000)
(66.7)
Contributed capital
10,000
16.7
10,000
20.0
20,000
40.0
Retained earnings
18,500
82.2
10,500
87.5
29,000
241.7
Total liab. & stock-

85. The financial statements for the Ozzie Company are presented below.
OZZIE COMPANY
Income Statement
For Year Ended December 31, 2011
Sales (net)
$650,000
Cost of goods sold
(400,000)
Gross profit
$250,000
Operating expenses
(199,000)
Interest expense
(8,000)
Income before income taxes
$ 43,000
Income taxes
(17,200)
Net income
$ 25,800
OZZIE COMPANY
Balance Sheet
December 31, 2011
Cash
$ 10,000
Marketable securities (short-term)
16,000
Receivables
20,000
Inventory
50,000
Property, plant, and equipment (net)
174,000
Total assets
$270,000
Current liabilities
$ 61,000
Bonds payable, 7%
50,000
Common stock, $10 par
60,000
Additional paid-in capital
2,000
Retained earnings
97,000
Total liabilities and stockholders’ equity
$270,000
The common stock was outstanding the entire year and is selling for $28 per share at year-end. The company has declared and paid dividends of
$4.00 per share for the year. The income tax rate is 40%. Assume a business year of 360 days. Balances for certain items at December 31, 2010,
were:
Inventory
$ 48,000
Total assets
260,000
Total stockholders’ equity
157,200
Required:
Based on the data provided for Ozzie Company, compute the following ratios for 2011:
a.
price/earnings
b.
dividend yield
c.
profit margin
d.
return on total assets
e.
current
f.
inventory turnover
g.
debt
86. The condensed financial statements of the Stetson Company for 2011 are as follows:
STETSON COMPANY
Income Statement
For Year Ended December 31, 2011
Sales (net)
$520,000
Less: Cost of goods sold
(300,000)
Gross profit
$220,000
Operating expenses
$122,000
Interest expense
14,000
Income taxes
34,000
(170,000)
Net income
$ 50,000
STETSON COMPANY
Balance Sheet
December 31, 2011
Cash
$ 10,000
Marketable securities
10,000
Receivables
45,000
Allowance for doubtful accounts
(5,000)
Inventory
65,000
Investment in bonds
20,000
Property, plant, and equipment
550,000
Accumulated depreciation
(50,000)
Total assets
$645,000
Accounts payable
$ 20,000
Other current liabilities
60,000
Bonds payable
56,000
Preferred stock, $50 par
100,000
Common stock, $15 par
150,000
Additional paid-in capital
69,000
Retained earnings
190,000
Total liabilities and stockholders’ equity
$645,000
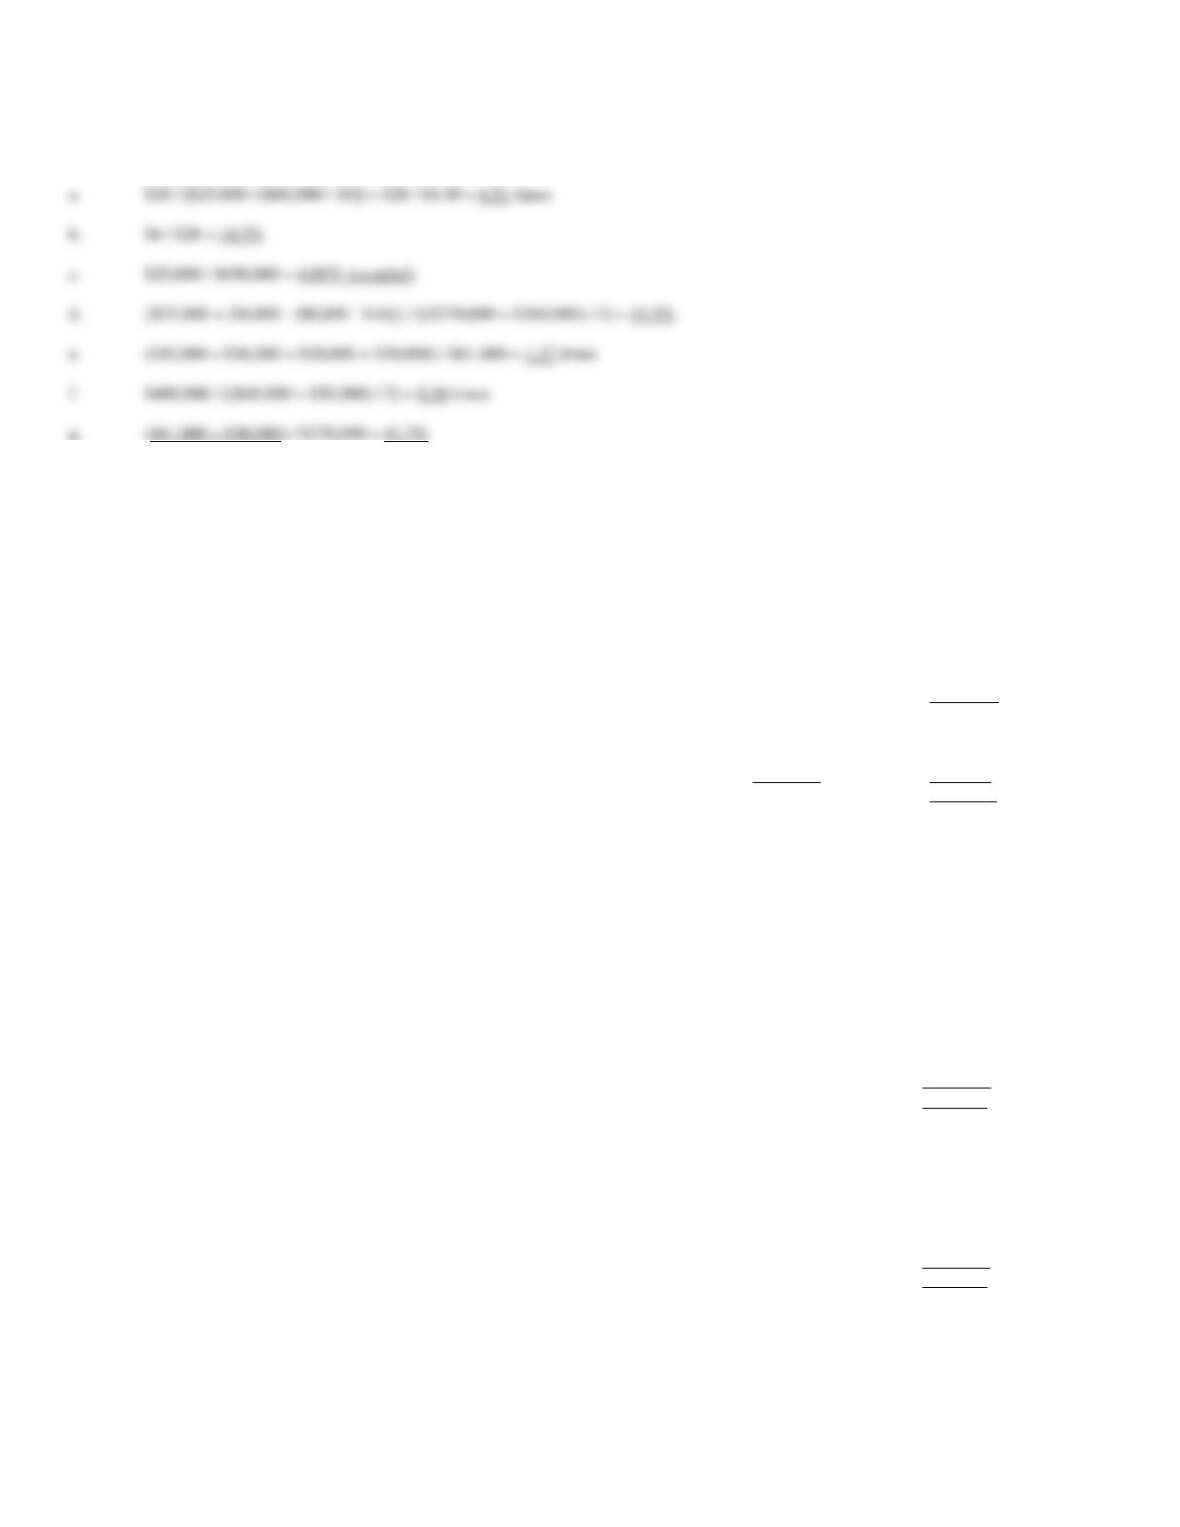
$28 / [$25,800 / ($60,000 / 10)] = $28 / $4.30 = 6.51 times
$4 / $28 = 14.3%
$25,800 / $650,000 = 4.00% (rounded)
{$25,800 + [$8,000 – ($8,000 ´ 0.4)]} / [($270,000 + $260,000) / 2] = 11.5%
($10,000 + $16,000 + $20,000 + $50,000) / $61,000 = 1.57 times
$400,000 / [($48,000 + $50,000) / 2] = 8.16 times
($61,000 + $50,000) / $270,000 = 41.7%
Additional Information:
·
The common stock and the preferred stock were outstanding the entire year. Stockholders’ equity on December 31, 2010 was $491,000.
·
In December 2011, Stetson declared dividends of $2.40 per share on the common stock and $4 per share on the preferred stock.
·
The common stock was selling for $60 per share on December 31, 2011.
·
The company made 90% of its sales on credit. The accounts receivable balance on December 31, 2010, was $32,000.
·
The par value of the preferred stock is also its liquidation value.
Required:
Compute the following ratios for 2011:
a.
earnings per share
b.
dividend yield
c.
return on stockholders’ equity
d.
acid-test ratio
e.
receivables turnover
f.
times interest earned
g.
book value per common share
87. The following information was obtained from the financial records of the Butler Company:
Ending inventory
$ 8,000
Business days in year
360
Net income
$ 40,000
Number of shares outstanding
3,000
Prepaid insurance
$ 1,000
Current liabilities
$ 9,000
Cost of goods sold
$ 38,000
Accounts receivable
$ 7,000
Investments (long-term)
$ 5,000
Sales
$104,000
Price per share of stock
$ 80
Beginning inventory
$ 5,000
Interest expense
$ 3,000
Cash
$ 10,000
Income tax expense
$ 6,000
a.
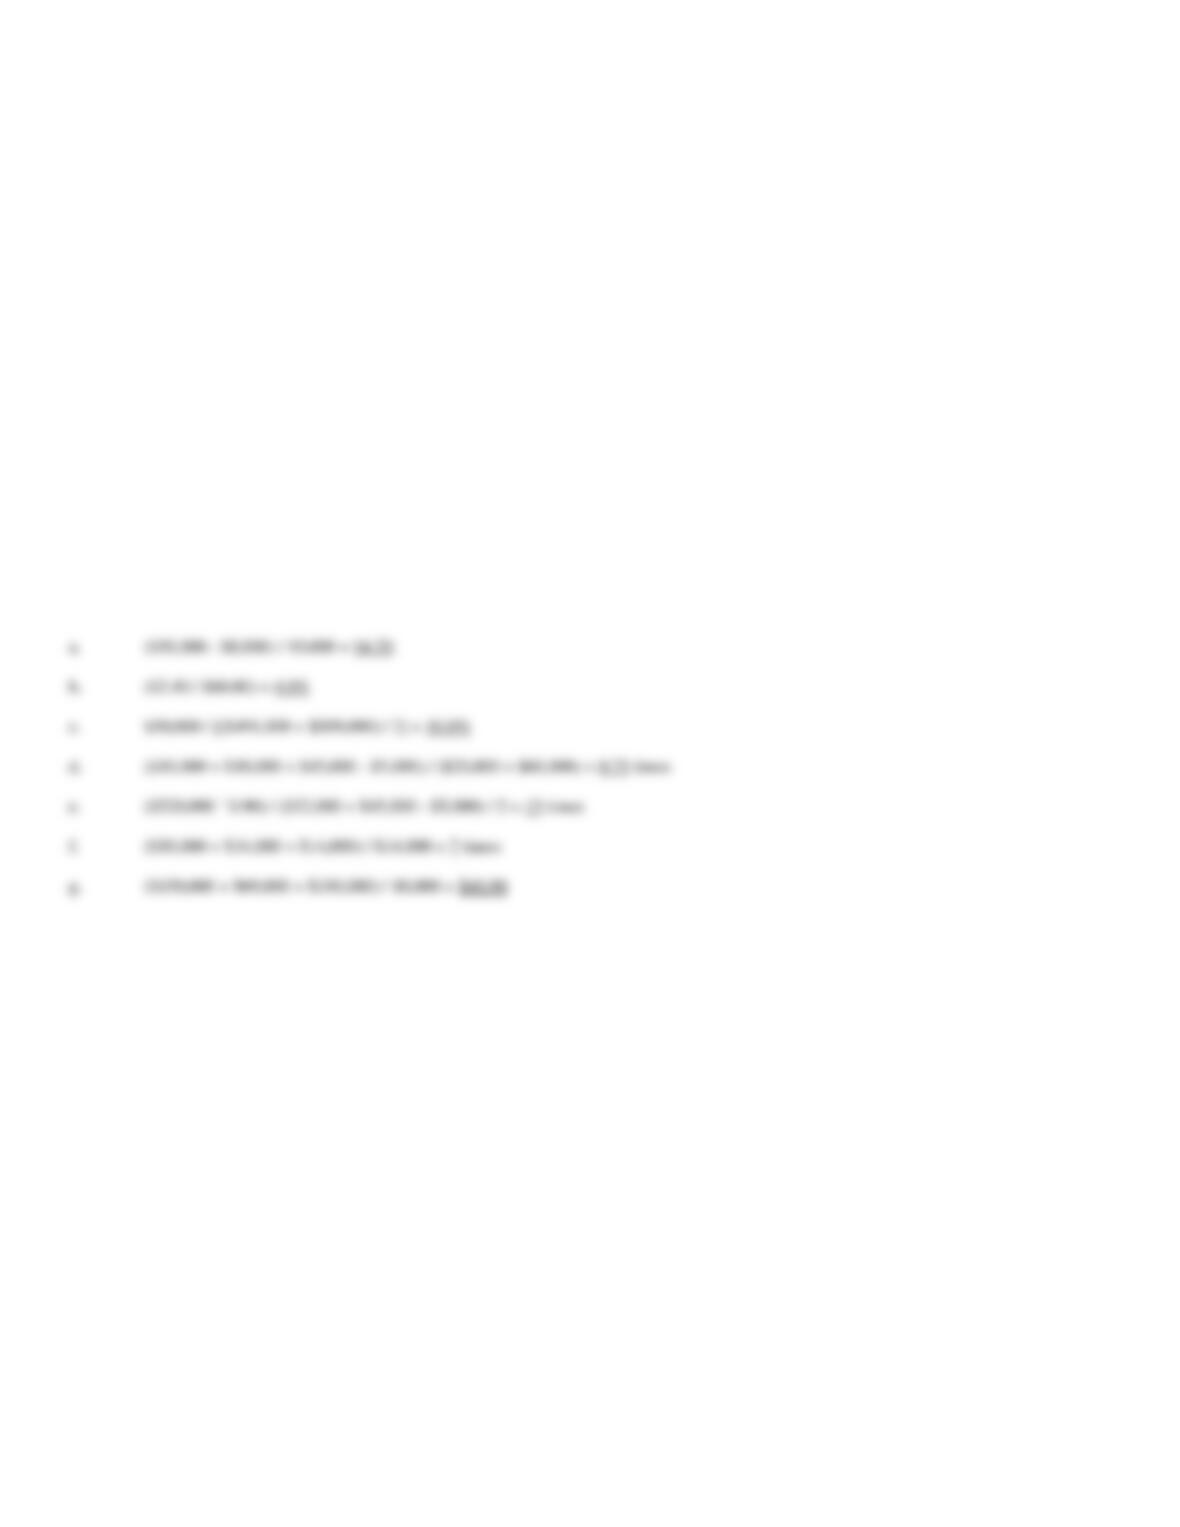
($50,000 – $8,000) / 10,000 = $4.20
b.
($2.40 / $60.00) = 4.0%
c.
$50,000 / [($491,000 + $509,000) / 2] = 10.0%
d.
($10,000 + $10,000 + $45,000 – $5,000) / ($20,000 + $60,000) = 0.75 times
e.
($520,000 ´ 0.90) / ($32,000 + $45,000 – $5,000) / 2 = 13 times
($50,000 + $34,000 + $14,000) / $14,000 = 7 times
g.
($150,000 + $69,000 + $190,000) / 10,000 = $40.90
Required:
Compute:
a.
Inventory turnover in days
b.
Acid-test ratio
c.
Current ratio
d.
Times interest earned
e.
Profit margin
f.
Price/earnings ratio
88. The following codes are used to compute the ratios below:
A
= Accounts receivable (beginning)
B
= Net income
C
= Cash
D
= Earnings per share
E
= Common stockholders’ equity
F
= Marketable securities (short-term)
G
= Total assets
H
= Current liabilities
I
= Net sales, credit
J
= Inventory
K
= Market price per common share
L
= Outstanding common shares
M
= Prepaid insurance
N
= Net sales, cash
O
= Common stock outstanding
P
= Accounts receivable (ending)
Q
= Long-term liabilities
Required:
Use the letters above to indicate how the following ratios would be calculated:
a.
Price/earnings
b.
Profit margin
c.
Acid-test
d.
Receivables turnover
e.
Book value per common share
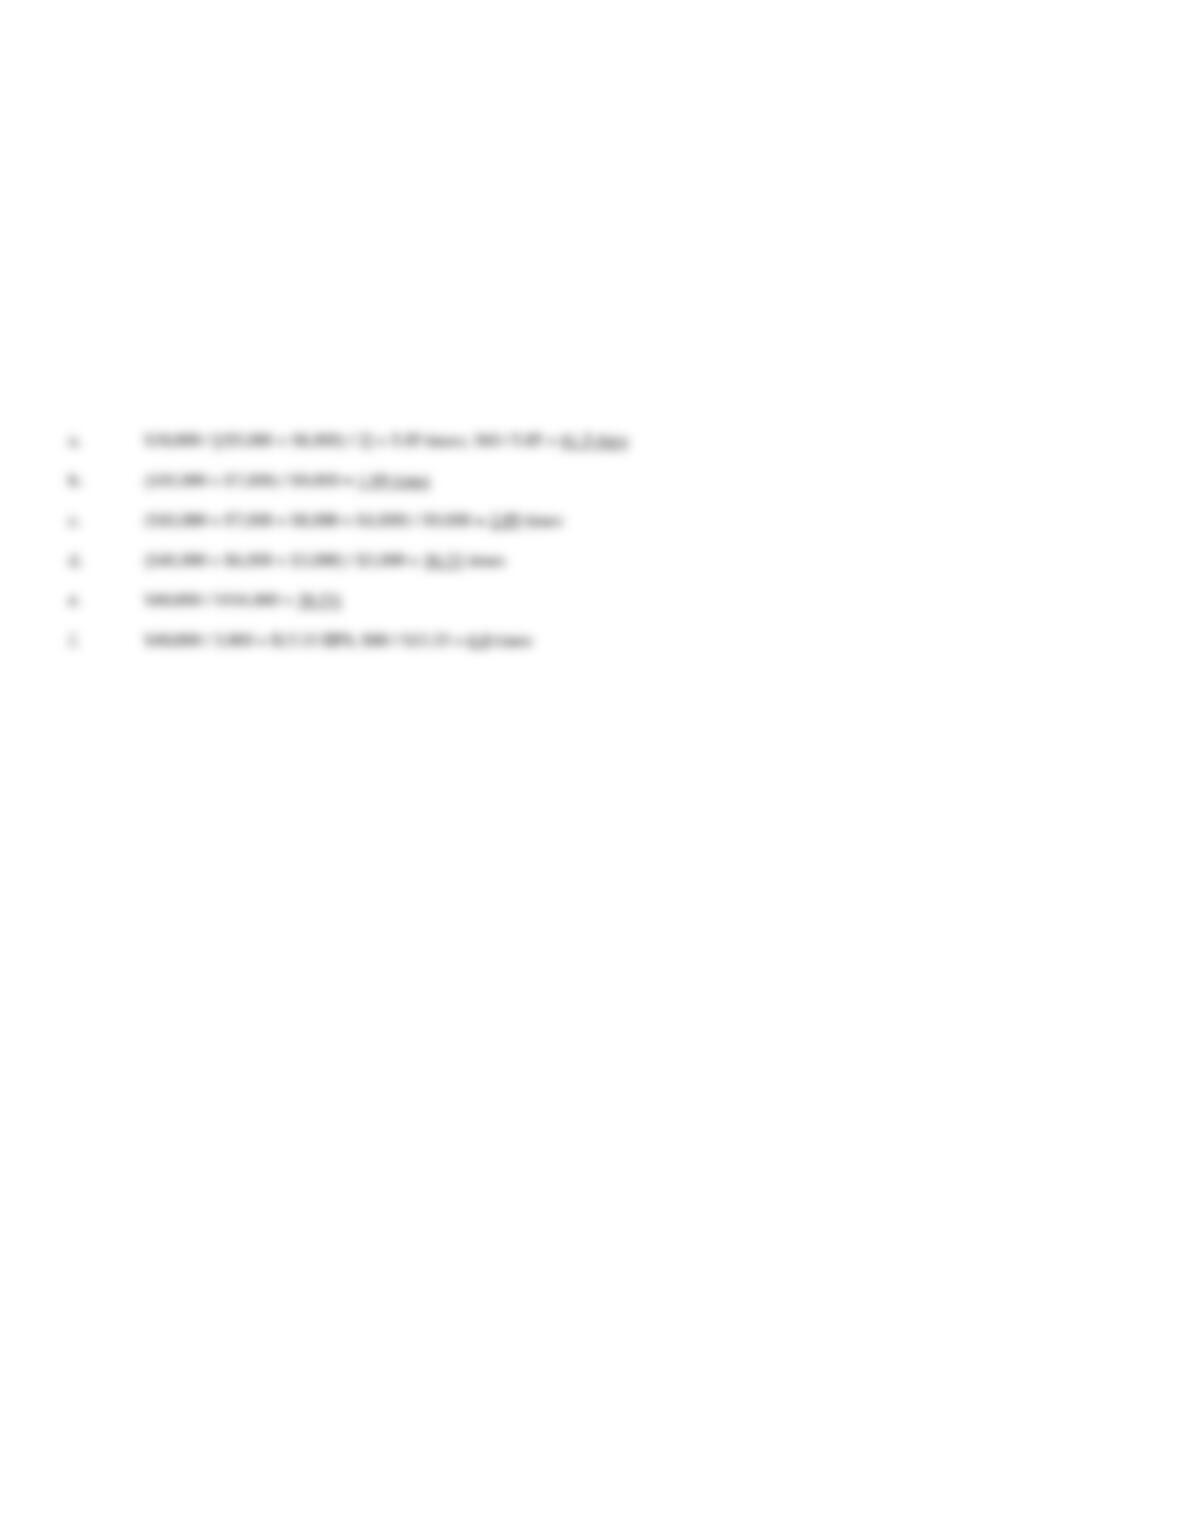
$38,000 / [($5,000 + $8,000) / 2] = 5.85 times; 360 / 5.85 = 61.5 days
b.
($10,000 + $7,000) / $9,000 = 1.89 times
($10,000 + $7,000 + $8,000 + $1,000) / $9,000 = 2.89 times
d.
($40,000 + $6,000 + $3,000) / $3,000 = 16.33 times
$40,000 / $104,000 = 38.5%
$40,000 / 3,000 = $13.33 EPS; $80 / $13.33 = 6.0 times

89. The following codes are used to compute the ratios below:
A
= Intangible assets
B
= Accounts receivable
C
= Cash flow from operations
D
= Cost of goods sold
E
= Average common shares outstanding
F
= Cash
G
= Current liabilities
H
= Net income
I
= Inventory, beginning
J
= Property, plant, and equipment
K
= Prepaid insurance
L
= Common dividends
M
= Long-term liabilities
N
= Interest expense
O
= Inventory, ending
P
= Preferred dividends
Q
= Investment in stock of subsidiary
T
= Pretax operating income
Required:
Use the letters above to indicate how the following ratios would be calculated:
a.
Debt ratio
b.
Inventory turnover
c.
Quick ratio
d.
Earnings per share
e.
Cash flows from operations to net income
90. Listed below are the cash flow ratios, followed by a series of descriptive statements.
a.
Cash flow from operations to sales
b.
Cash flow from operations to net income
c.
Cash flow from operations per share
d.
Cash flow from operations to maturing debt
____
1.
Allows users to understand how the earning of net income relates to the receipt of cash from operations.
____
2.
Allows users to understand how much cash was generated from operations per common share.
____
3.
Allows users to understand how much of each sales dollar is available for financing and investing activities.
____
4.
Allows users to measure the ability of a company to make principal payments.
Required:
Match the cash flow ratios to the appropriate descriptive statement by placing the appropriate letter in the space provided.
1.
b
2.
c
3.
a

91. Listed below are a number of ratios, followed by a series of descriptive statements.
a.
Acid-test ratio
f.
Price/earnings ratio
b.
Current ratio
g.
Profit margin
c.
Debt ratio
h.
Receivables turnover
d.
Dividend yield
i.
Return on total assets
e.
Equity ratio
j.
Times interest earned
____
1.
Evaluates the attractiveness of an investment in a particular stock.
____
2.
Indicates how effectively a company uses its economic resources.
____
3.
Indicates how efficiently a company collects its receivables.
____
4.
Evaluates a company’s efficiency in controlling costs and expenses.
____
5.
A severe test of a company’s short-term debt-paying ability.
____
6.
Indicates the percentage of assets contributed by creditors.
____
7.
Indicates the rate of return on individual stock purchases.
____
8.
Indicates a company’s ability to cover its interest obligations.
____
9.
Indicates a company’s short-term liquidity.
____
10.
Indicates the percentage of assets contributed by stockholders.
Required:
Match the ratios to their respective descriptive statements by placing the appropriate letter in the space provided.
92. The PCAOB and FASB are involved in establishing standards used in preparing a company’s annual report.
Required:
a.
Which standards are established by the PCAOB? Why are these types of standards established?
b.
Which standards are established by the FASB? Why are these types of standards established?
1.
f
6.
c
2.
i
7.
d
3.
h
8.
j
4.
g
9.
b
5.
a
10.
e
93. Following the audit standards set by the PCAOB, the independent CPA conducts audits of public
companies. The auditor then issues the audit report.
Required:
Describe the three opinions that the auditor expresses in the audit report.
The three opinions expressed by the auditor upon completion of the audit of a public company are
94. GAAP mandates certain segment information disclosures. Describe the procedure a company would follow
in determining whether an operating segment is reportable.
An operating segment is reportable if it satisfies at least one of the three following tests:
95. Under GAAP, a company should identify its operating segments for financial reporting through the use of
the “management approach.” The management approach is based on the way a company’s management
organizes the company’s segments for making operating decisions and for assessing performance.
Required:
Describe how a company determines an operating segment using the “management approach.”
96. Your firm recently completed a set of interim financial statements for one of your clients. Your client has
just asked you if there are any differences in the procedures used in the preparation of interim reports as
compared to annual reports.
Required:
Write an explanation of how the interim accounting procedures differ from those performed at year-end.
First, for companies using a periodic inventory system, the interim ending inventory is usually based on an
estimation technique, rather than a physical count. Second, interim adjusting entries are not formally recorded;
they are only shown on the working papers. Third, the temporary accounts are not closed for each interim
period. And, finally, interim reports are usually not audited because of time and cost constraints.
97. In the preparation of interim income statements, the treatment of expenses is recognized differently
depending on whether or not they are directly related to product sales or services.
Required:
Discuss the general treatment of expenses in interim statements when they
a.
are directly related to product sales or services.
b.
are not directly related to product sales or services.
·
that engages in business activities to earn revenues and incur expenses
·
for which financial information is available
98. Discuss how intracompany and intercompany comparisons help fulfill the qualitative characteristics of
consistency and comparability.
99. A marketing major has just asked you why accountants waste so much time preparing comparative financial
statements when single-year statements should be sufficient.
Required:
Explain why single-year financial statements do not provide sufficient information for analysis and
interpretation.