Chapter 6 – Activity Analysis, Cost Behavior, and Cost Estimation
6-40
Essay Questions
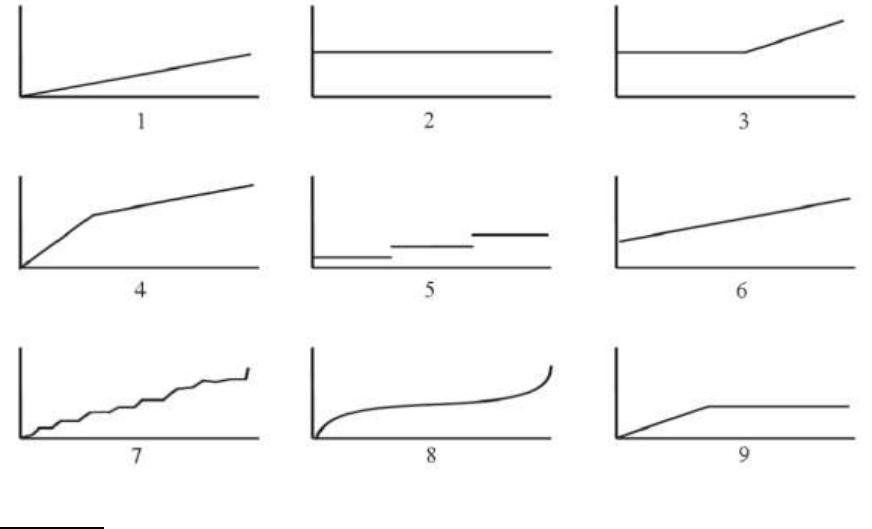
87. Consider the graphs that follow (the horizontal axis represents activity; the vertical axis
represents total dollars).
Required:
For items A-I that follow, choose the graph that best represents the cost behavior pattern
described. Note: Graphs can be used more than once.
A. Straight-line depreciation on machinery.
B. The cost of chartering a private airplane. The cost is $800 per hour for the first 6 hours of a
flight; it then drops to $600 per hour.
C. The wages of table service personnel in a restaurant. The employees are part-time workers
who can be called upon for as little as 4 hours at a time.
D. Weekly wages of store clerks who work 40 hours each week. One clerk is hired for every
125 sales made during the month.
E. The cost of tires used in the production of trucks.
F. Outbound shipping charges that increase at a decreasing rate as sales rise because the firm
can use more efficient modes of transportation (e.g., full trailer loads, full rail cars, etc.).
Gradually, however, at high levels of sales, freight costs start to increase at an increasing rate,
which reflects more transactions made to customers in far-away locations.
G. Equipment leasing costs that are computed at $2 per machine hour worked. The company
pays a maximum of $120,000 per month.
H. The monthly cost of a franchise fee for a fast-food restaurant. The franchisee must pay
$20,000 plus 5% of gross dollar sales.
I. The cost of electricity during peak demand periods, which is based on the following
schedule:
Chapter 6 – Activity Analysis, Cost Behavior, and Cost Estimation
Up to 20,000 kilowatt hours (KWH): $4,000
Above 20,000 kilowatt hours: $4,000 + $0.02 per KWH
Solution:
88. Consider the six costs that follow.
1. Advertising and promotion costs of a do-it-yourself retailer
2. Surgical supplies used in a hospital’s operating room
3. Aircraft depreciation charges of an airline
4. Utility charges that include a minimum-use fee, for a small business
5. Annual business licensing fee paid by a daycare center
6. Truck fuel consumed by a road construction company
Required:
A. Classify each of these costs as variable, committed fixed, discretionary fixed, or
semivariable.
B. Briefly describe the behavior of a per-unit variable cost as activity changes.
C. What elements are present in a semivariable cost that cause it to behave in a semivariable
manner?
D. Generally speaking, does management have more flexibility when dealing with committed
fixed costs or discretionary fixed costs?
Solution:
89. Rolling Hills Bistro produces one of the best sausage products in Tennessee. The
company’s controller compiled the following information by analyzing the accounting
records:
1. Meat costs the company $3.25 per pound of sausage produced.
2. Compensation of production employees is $2.25 per pound of sausage produced.
3. Supervisory salaries total $23,000 per month.
4. The company incurs utility costs of $9,000 per month plus $0.35 per pound of sausage
produced.
5. Insurance and property taxes average $6,400 per month.
Required:
A. Classify each cost as variable, fixed, or semivariable.
B. Write a formula to express the behavior of the firm’s production costs. (Use the form Y = a
+ bX, where X denotes the quantity of sausage produced.)
Solution:
B.
6-43
90. Vargis Corporation has a machining capacity of 200,000 hours per year. Utilization of
capacity is normally 75%; it has been as low as 40% and as high as 90%. An analysis of the
accounting records revealed the following selected costs:
At a 40%
Utilization Rate
At a 90%
Utilization Rate
Cost A:
Total
$440,000
$440,000
Per hour
$5.50
?
Cost B:
Total
?
$1,944,000
Per hour
$10.80
$10.80
Cost C:
Total
$680,000
$1,330,000
Per hour
$8.50
$7.39
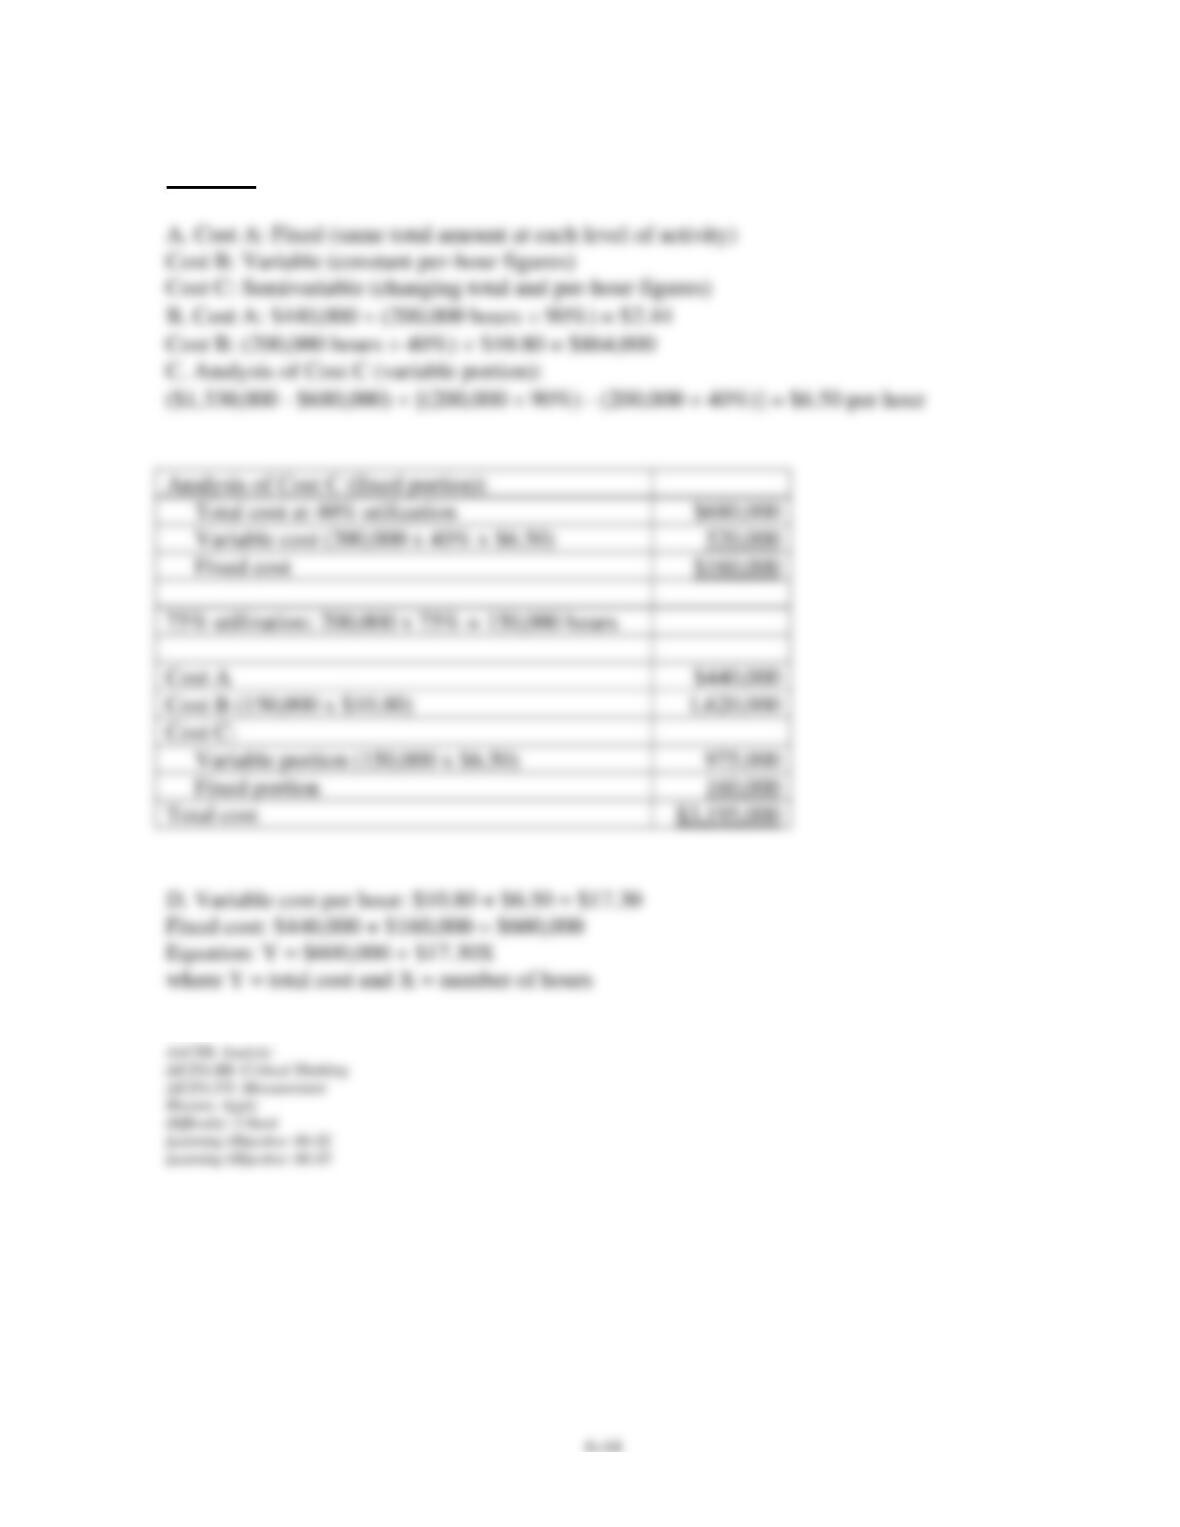
Vargis uses the high-low method to analyze cost behavior.
Required:
A. Classify each of the costs as being either variable, fixed, or semivariable.
B. Calculate amounts for the two unknowns in the preceding table.
C. Calculate the total amount that Vargis would expect at a 75% utilization rate for Cost A,
Cost B, and Cost C.
D. Develop an equation that Vargis can use to predict total cost for any level of hours within
its range of operation.
Chapter 6 – Activity Analysis, Cost Behavior, and Cost Estimation
Solution:
91. Cheyenne Corporation operates a small medical lab in Wyoming that conducts minor
medical procedures (including blood tests and x-rays) for a number of doctors. The lab
consumes various medical supplies and is staffed by two technicians, both of whom are paid a
monthly salary. In addition, there is an on-site office manager who is also paid by the month.
Required:
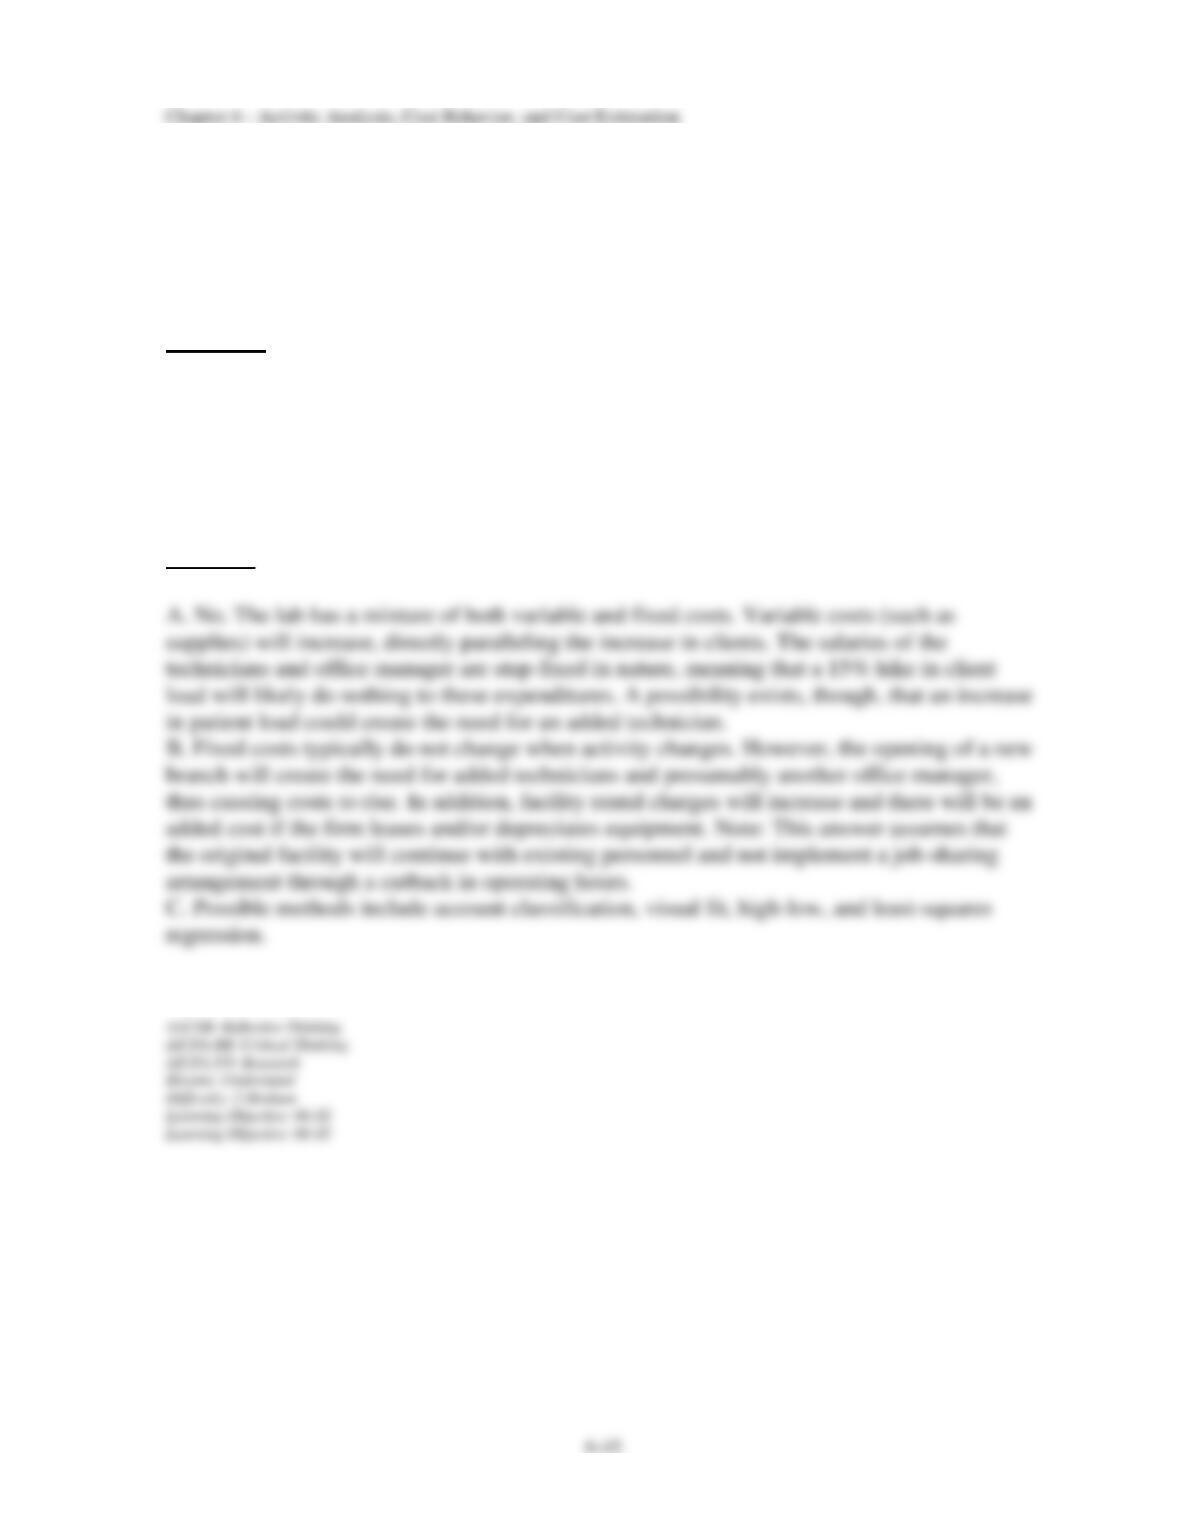
A. If the lab’s patient count increases by 15%, will the lab’s total operating costs increase by
15%? Explain.
B. Cheyenne is considering opening an additional lab in a new suburban medical building.
What will likely happen to the lab’s level of fixed cost incurrence? Why?
C. What analysis methods would be available to the office manager and/or Cheyenne
management if a close look at the lab’s cost behavior is desired?
Solution:
6-46
92. The following selected data were taken from the accounting records of Colorado
Enterprises:
Month
Machine Hours
Manufacturing Overhead
May
46,000
$889,000
June
60,000
1,130,000
July
68,000
1,274,000
August
52,000
980,000
Manufacturing overhead consists of three different costs; (1) machine supplies
(variable), (2) property taxes (fixed), and (3) plant maintenance (semivariable). July’s
overhead costs were $170,000 for machine supplies, $24,000 for property taxes, and
$1,080,000 for plant maintenance.
Required:
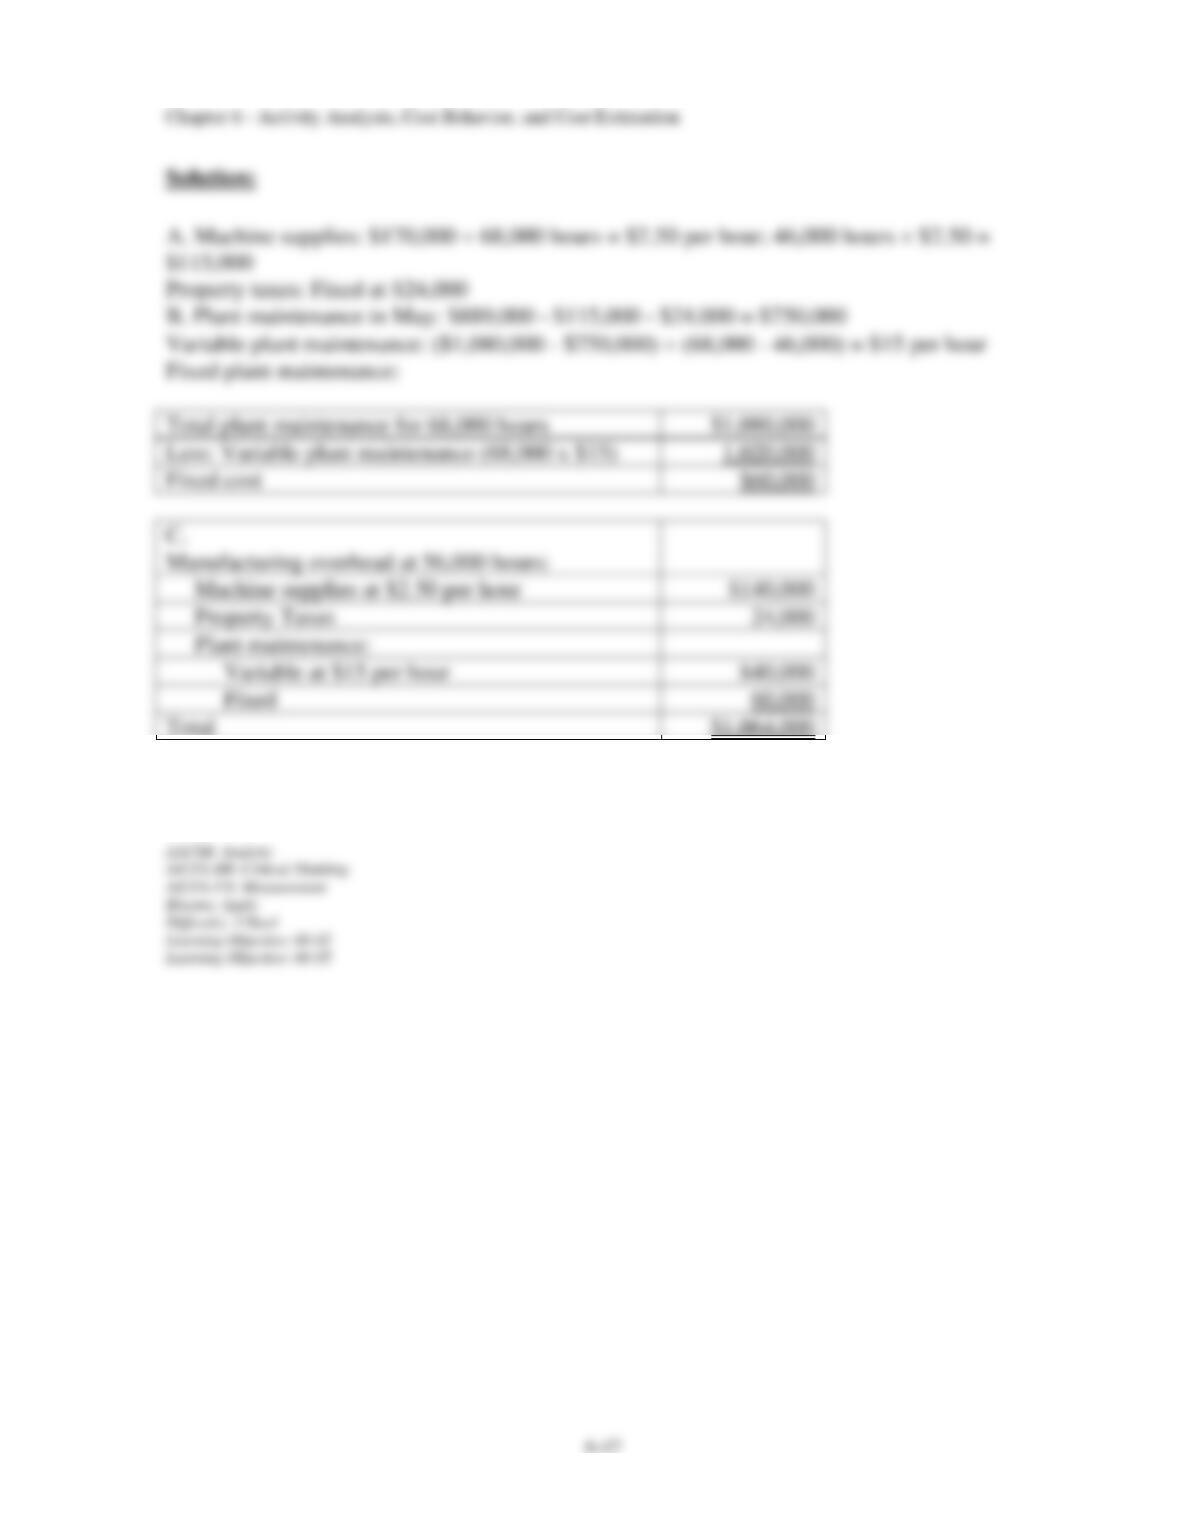
A. Determine the machine supplies and property taxes for May.
B. By using the high-low method, analyze Colorado’s plant maintenance cost and
calculate the monthly fixed portion and the variable cost per machine hour.
C. Assume that present cost behavior patterns continue into future months. Estimate
the total amount of manufacturing overhead the company can expect in September if
56,000 machine hours are worked.
93. Lichtenstein Imports needs to determine the variable utilities rate per machine hour in
order to estimate cost for August. Relevant information is as follows.
Month
Machine Hours
Worked
Utilities Cost
April
4,500
$9,560
May
4,200
9,440
June
6,500
10,725
July
7,000
11,400
Lichtenstein anticipates producing 5,000 units in August, each unit requiring 1.5 hours of
machine time. The company uses the high-low method to analyze costs.
Required:
A. Calculate the variable and fixed components of the utilities cost.
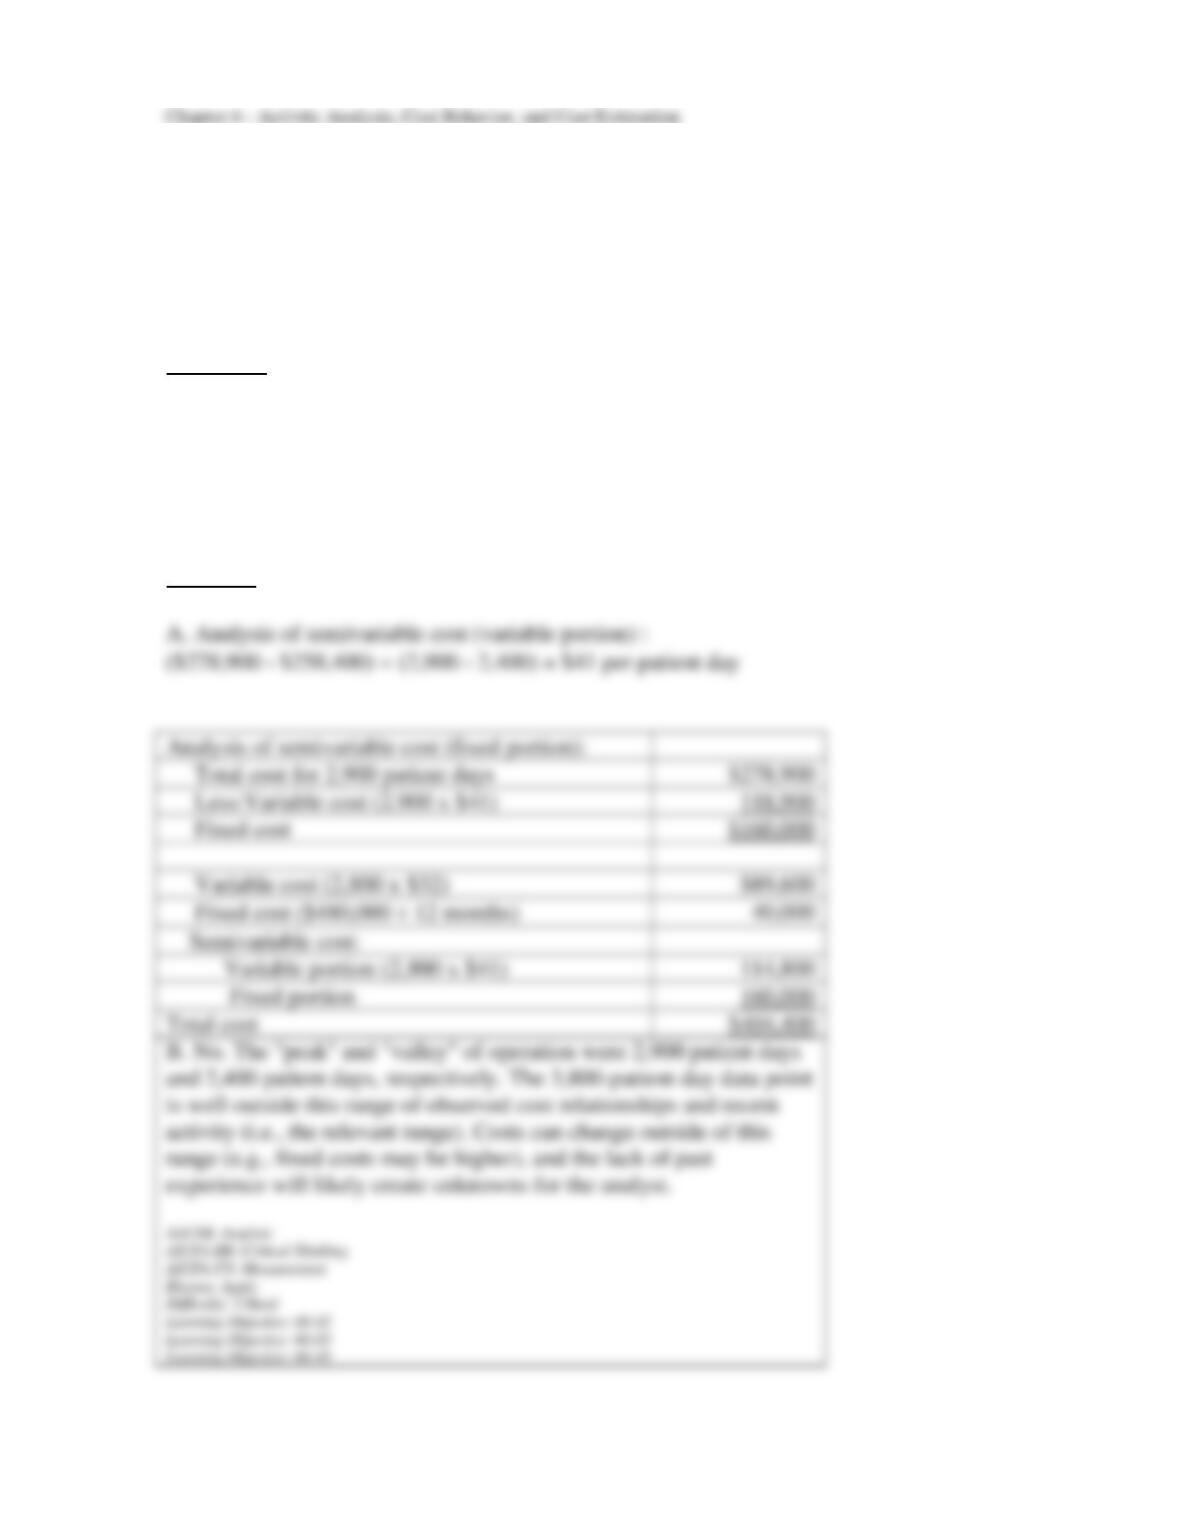
B. Using the data calculated above, estimate the utilities cost for August.
C. Compare the high-low method versus the visual-fit method with respect to (1) number of
data observations used in the analysis and (2) objectivity of the results.
Solution:
Less: Variable cost (7,000 x $0.70)
Fixed cost
Variable cost (5,000 x 1.5 x $0.70)
Fixed cost
Total cost
6-49
94. Trane Medical Clinic offers a number of specialized medical services. A review of data
for the year just ended revealed variable costs of $32 per patient day; annual fixed costs of
$480,000, which are incurred evenly throughout the year; and semivariable costs that
displayed the following behavior at the “peak” and “valley” of activity:
January (2,400 patient days): $258,400
August (2,900 patient days): $278,900
Required:
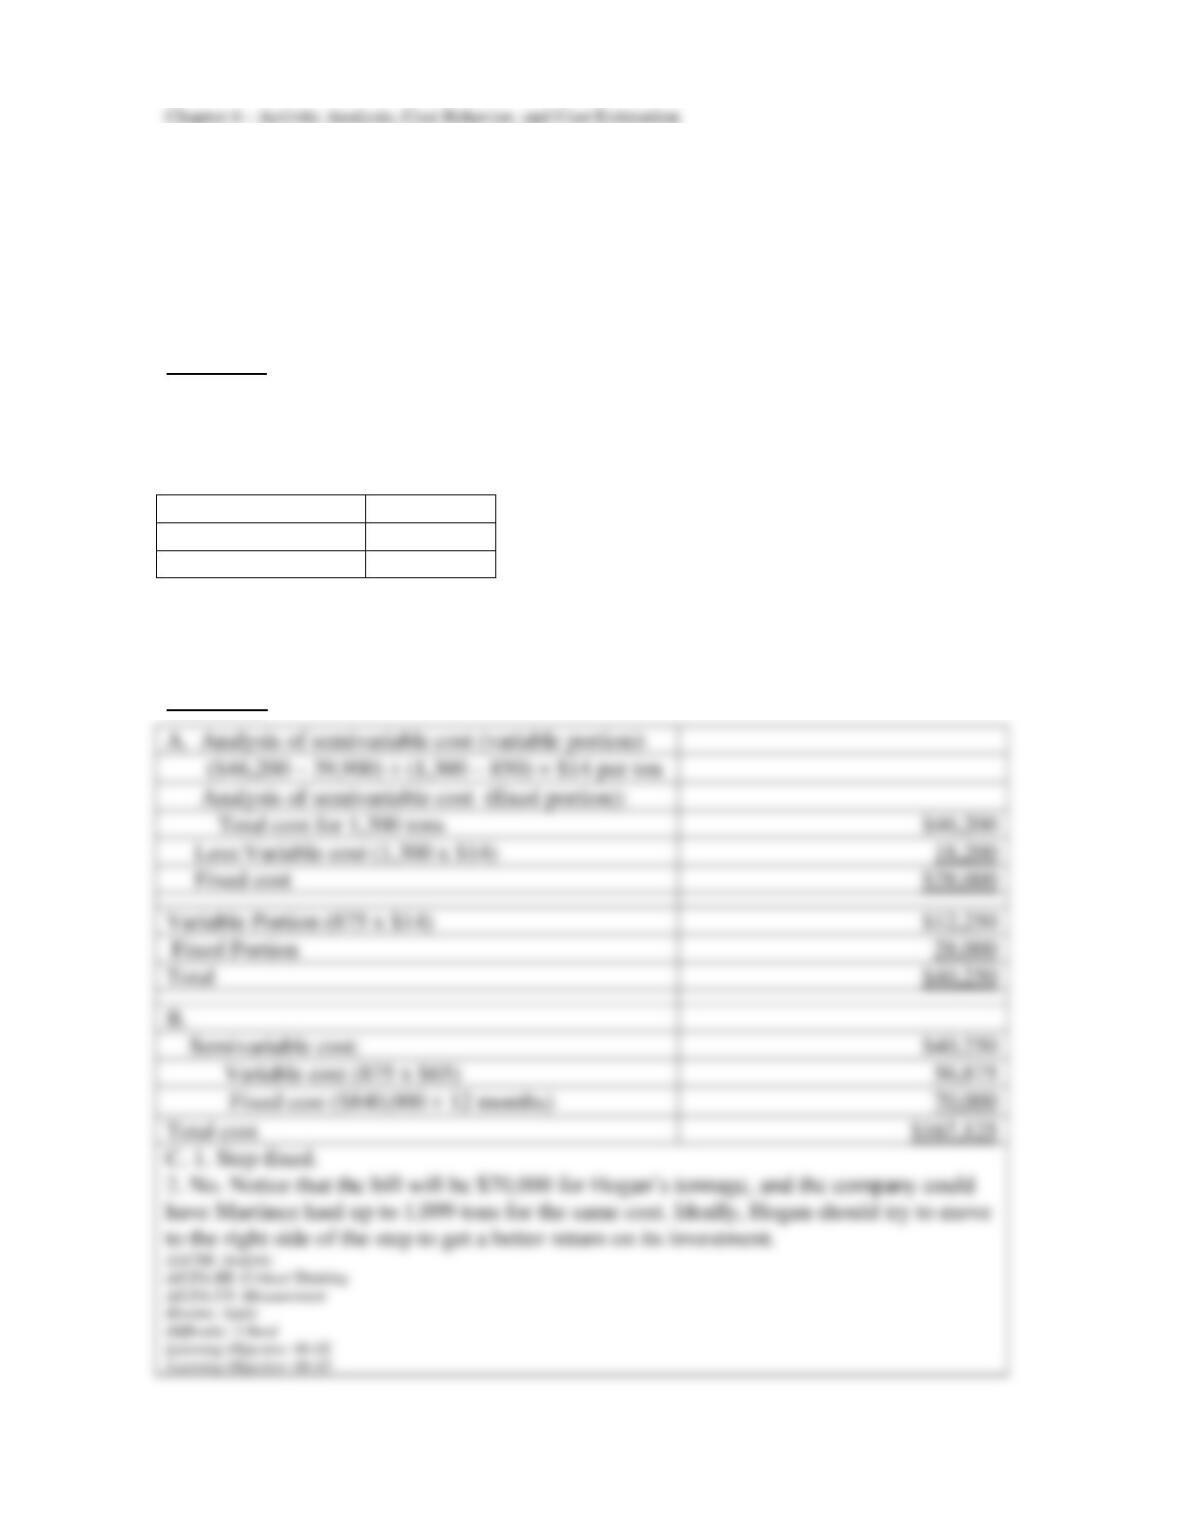
A. Calculate the total cost for an upcoming month (2,800 patient days) if current cost behavior
patterns continue. Trane uses the high-low method to analyze cost behavior.
B. There is a high probability that Trane’s volume will increase in forthcoming months as
patients take advantage of new scientific advances. Can the data and methodology used in part
(a) for predicting the costs of 2,800 patient days be employed to estimate the costs for, say,
3,800 patient days? Why or why not?
Solution:
6-50
95. Hogan Mining extracts ore for eight different companies in South Dakota. The firm
anticipates variable costs of $65 per ton along with annual fixed overhead of $840,000, which
is incurred evenly throughout the year. These costs exclude the following semivariable costs,
which are expected to total the amounts shown for the high and low points of ore extraction
activity: March (850 tons): $39,900
August (1,300 tons): $46,200
Hogan uses the high-low method to analyze cost behavior.
Required:
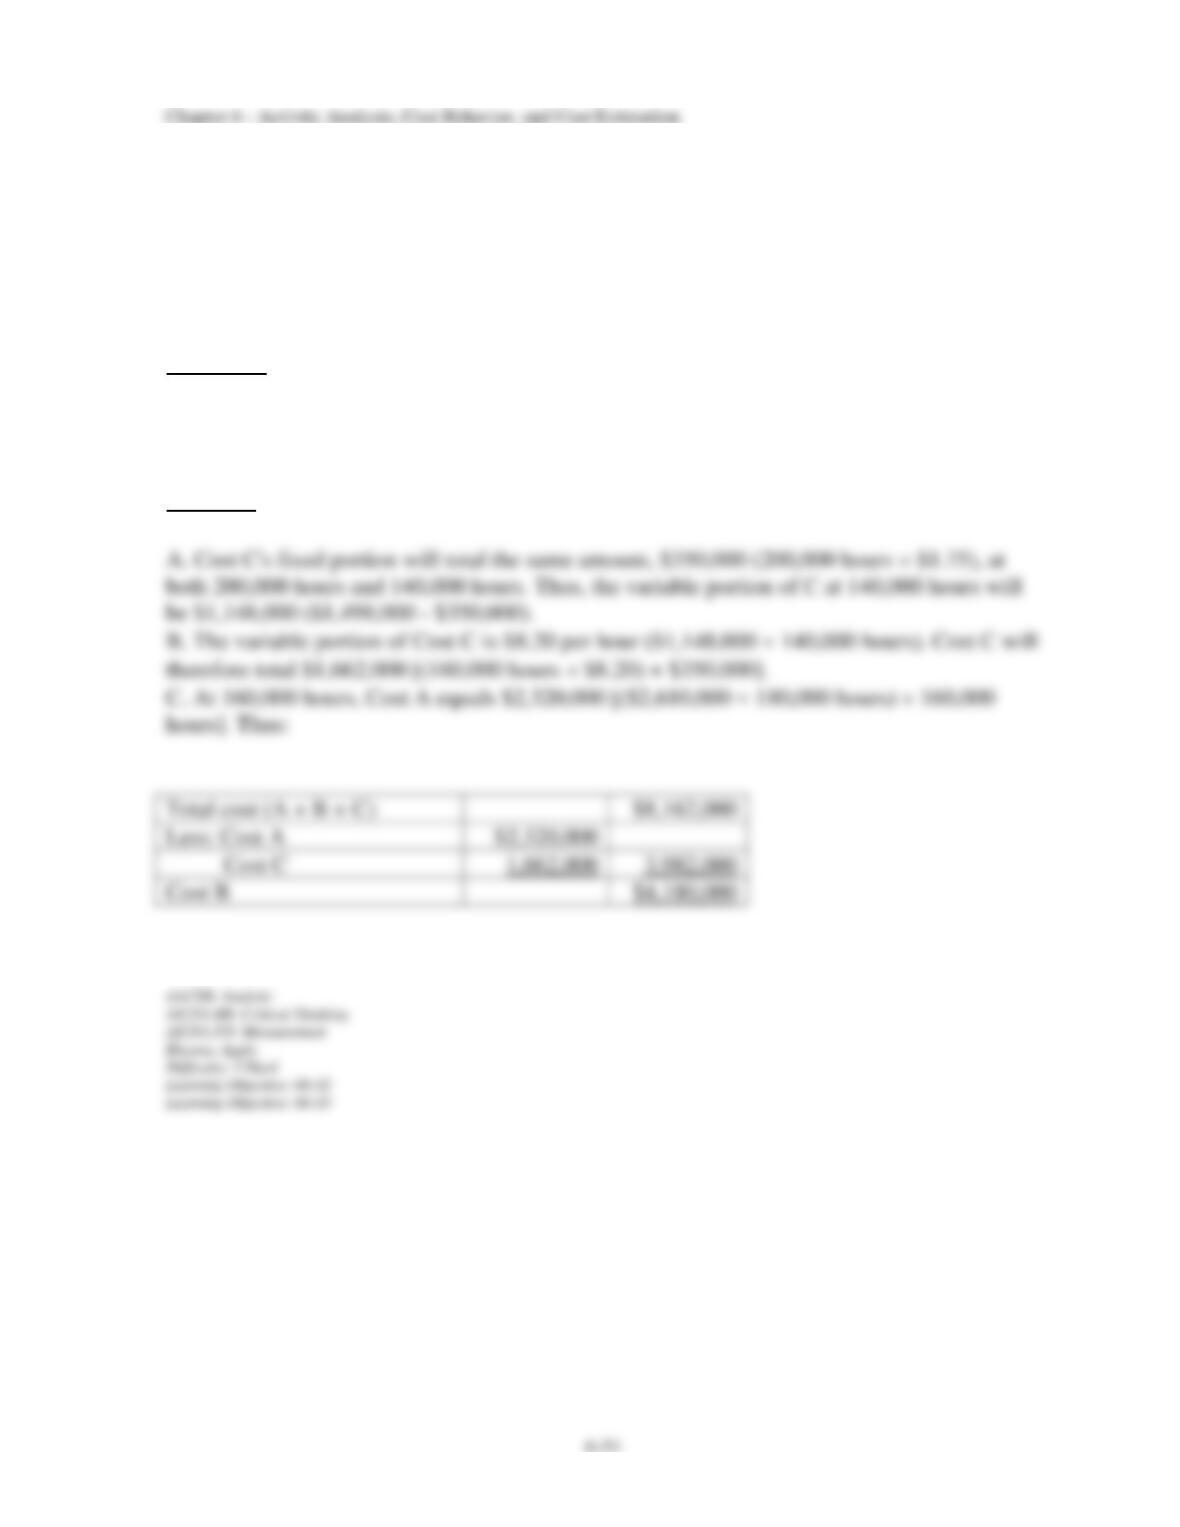
A. Calculate the semivariable cost for an upcoming month when 875 tons will be extracted.
B. Calculate the total cost for that same month.
C. Hogan uses Martinez Trucking to haul extracted ore. Martinez’s monthly charges are as
follows:
800 to 1,099 tons
$ 70,000
1,100 to 1,399 tons
90,000
1,400 + tons
110,000
1. From a cost behavior perspective, what type of cost is this?
2. If Hogan plans to extract 875 tons, is the company being very “cost effective” with respect
to Martinez’s billing rates? Briefly discuss.
Solution:
A. Analysis of semivariable cost (variable portion):
Total cost for 1,300 tons
Less:Variable cost (1,300 x $14)
Fixed cost
Variable Portion (875 x $14)
Fixed Portion
Total
Semivariable cost:
Variable cost (875 x $65)
Total cost
96. T.L. Franklin Corporation has three costs: A, which is variable; B, which is fixed; and C,
which is semivariable. The company uses the high-low method and extracted the following
data from its accounting records:
· At 180,000 hours of activity, Cost A totaled $2,610,000.
· At 140,000 hours, the low point during the period, Cost C totaled $1,498,000; at 200,000
hours, the high point, Cost C’s fixed portion amounted to $1.75 per hour.
· At 160,000 hours of activity, the sum of Costs A, B, and C amounted to $8,162,000.
Required:
A. Compute the variable portion (total) of Cost C at 140,000 hours of activity.
B. Compute Cost C (total) at 160,000 hours of activity.
C. Compute Cost B (total) at 160,000 hours of activity.
Solution:
6-52
97. Shortly after being hired as an analyst with Hidden Cove Rentals in Coastal North
Carolina, Matt Loman was asked to prepare a report that focused on the company’s order
processing costs—a cost driven largely by the number of rental invoices written. Matt knew
that he could use several different tools to analyze cost behavior, including scatter diagrams,
least-squares regression, and the high-low method. In addition, he knew that he could present
the results of his analysis in the form of algebraic equations. Those equations follow.
Scatter diagram: OP = $56,000 + $6.80RI
Least-squares regression: OP = $59,000 + $6.75RI
High-low method: OP = $53,500 + $7.25RI
where OP = total order processing costs and RI = number of rental invoices written
Matt had analyzed data over the past 12 months and built equations based on these data,
purposely including the slowest month of the year and the busiest month so that things would
“tend to even out.” He observed that February was especially slow because of a paralyzing ice
storm, one that forced the company to close for four days.
Required:
A. Will scatter diagrams, least-squares regression, and the high-low method normally result in
the same equation? Why?
B. Assuming the use of least-squares regression, explain what the $59,000 and $6.75 figures
represent.
C. Assuming the use of a scatter diagram, predict the order processing cost of an upcoming
month when Hidden Cove expects to write 2,500 rental invoices.
D. Did Matt err in constructing the equations on data of the past 12 months? Briefly discuss.
If “yes,” determine which of the three tools is likely to be affected the most and explain why.
Solution:
98. Duke Corporation uses least-squares regression to analyze a variety of operating costs. A
staff assistant determined that monthly machine hours (MH) have a strong cause-and-effect
relationship with total maintenance costs, and generated the following statistics:
Intercept: $170,000
b coefficient: $3.80
Total machine hours for the year: 36,500
Required:
A. Construct the company’s regression equation.
B. Based on your answer in part “A,” identify Duke’s dependent variable and independent
variable.
C. What does the b coefficient really represent?
D. Predict the company’s maintenance cost in a month when 3,200 machine hours are
worked.
Solution:
99. Townson Company is making plans for the introduction of a new product, which has a
target selling price of $7 per unit. The following estimates of manufacturing costs have been
derived for 6 million units, to be produced during the first year:
Direct material: $6,000,000
Direct labor: $2,100,000 (at $14 per hour)
Overhead costs have not yet been estimated, but monthly data on total production and
overhead for the past 12 months have been analyzed by using least-squares regression. The
major overhead cost driver is direct labor hours, with the following results:
Computed values:
Fixed overhead cost: $3,200,000
Coefficient of independent variable: $2.25
Required:
A. Prepare the company’s regression equation (Y = a + bX) to estimate overhead.
B. Calculate the predicted overhead cost at an activity level of 6,300,000 units.
C. What is Townson’s dependent variable in this case?
Solution:
100. Compare and contrast the following types of costs: (1) variable and step-variable and (2)
fixed and step-fixed.
Solution:
101. Define the term “relevant range” and explain its importance in understanding cost
behavior.
Solution:
102. Differentiate between committed costs and discretionary costs. Be sure to present two
examples of each and explain which of the two cost types would likely be cut should a
company encounter financial difficulties.
Solution:
103. Both the visual-fit and high-low methods of cost estimation have inherent limitations.
Briefly identify the major deficiency associated with each method.
Solution:
104. Distinguish between least-squares regression and multiple regression as cost estimation
methods.
Solution: