
5-81
75.
Thane Company is interested in establishing the relationship between electricity costs and
machine hours. Data have been collected and a regression analysis prepared using Excel.
The monthly data and the regression output follow:
Month
Machine Hours
Electricity Costs
January
2,500
18,400
February
2,900
21,000
March
1,900
13,500
April
3,100
23,000
May
3,800
28,250
June
3,300
22,000
July
4,100
24,750
August
3,500
22,750
September
2,000
15,500
October
3,700
26,000
November
4,700
31,000
December
4,200
27,750
Summary Output
Regression Statistics
Multiple R
.965
R Square
.932
Adjusted R2
.925
Standard
Error
1,425.18
Observations
12.00
Coefficients
Standard
Error
t
Stat
P-
value
Lower
95%
Upper
95%
Intercept
3,726.88
1,682.82
2.21
0.05
(22.69)
7,476.45
Machine
Hours
5.77
0.49
11.7
0.00
4.67
6.87
If the controller uses regression analysis to estimate costs, the cost equation for
electricity cost is:

5-83
76.
Thane Company is interested in establishing the relationship between electricity costs and
machine hours. Data have been collected and a regression analysis prepared using Excel.
The monthly data and the regression output follow:
Month
Machine Hours
Electricity Costs
January
2,500
18,400
February
2,900
21,000
March
1,900
13,500
April
3,100
23,000
May
3,800
28,250
June
3,300
22,000
July
4,100
24,750
August
3,500
22,750
September
2,000
15,500
October
3,700
26,000
November
4,700
31,000
December
4,200
27,750
Summary Output
Regression Statistics
Multiple R
.965
R Square
.932
Adjusted R2
.925
Standard
Error
1,425.18
Observations
12.00
Coefficients
Standard
Error
t
Stat
P-
value
Lower
95%
Upper
95%
Intercept
3,726.88
1,682.82
2.21
0.05
(22.69)
7,476.45
Machine
Hours
5.77
0.49
11.7
0.00
4.67
6.87
If the controller uses regression analysis to estimate costs, the estimate of the variable
portion of electricity cost is:

5-85
77.
Thane Company is interested in establishing the relationship between electricity costs and
machine hours. Data have been collected and a regression analysis prepared using Excel.
The monthly data and the regression output follow:
Month
Machine Hours
Electricity Costs
January
2,500
18,400
February
2,900
21,000
March
1,900
13,500
April
3,100
23,000
May
3,800
28,250
June
3,300
22,000
July
4,100
24,750
August
3,500
22,750
September
2,000
15,500
October
3,700
26,000
November
4,700
31,000
December
4,200
27,750
Summary Output
Regression Statistics
Multiple R
.965
R Square
.932
Adjusted R2
.925
Standard
Error
1,425.18
Observations
12.00
Coefficients
Standard
Error
t
Stat
P-
value
Lower
95%
Upper
95%
Intercept
3,726.88
1,682.82
2.21
0.05
(22.69)
7,476.45
Machine
Hours
5.77
0.49
11.7
0.00
4.67
6.87
If the controller uses regression analysis to estimate costs, the estimate of the fixed
portion of electricity cost is:

5-87
78.
Thane Company is interested in establishing the relationship between electricity costs and
machine hours. Data have been collected and a regression analysis prepared using Excel.
The monthly data and the regression output follow:
Month
Machine Hours
Electricity Costs
January
2,500
18,400
February
2,900
21,000
March
1,900
13,500
April
3,100
23,000
May
3,800
28,250
June
3,300
22,000
July
4,100
24,750
August
3,500
22,750
September
2,000
15,500
October
3,700
26,000
November
4,700
31,000
December
4,200
27,750
Summary Output
Regression Statistics
Multiple R
.965
R Square
.932
Adjusted R2
.925
Standard
Error
1,425.18
Observations
12.00
Coefficients
Standard
Error
t
Stat
P-
value
Lower
95%
Upper
95%
Intercept
3,726.88
1,682.82
2.21
0.05
(22.69)
7,476.45
Machine
Hours
5.77
0.49
11.7
0.00
4.67
6.87
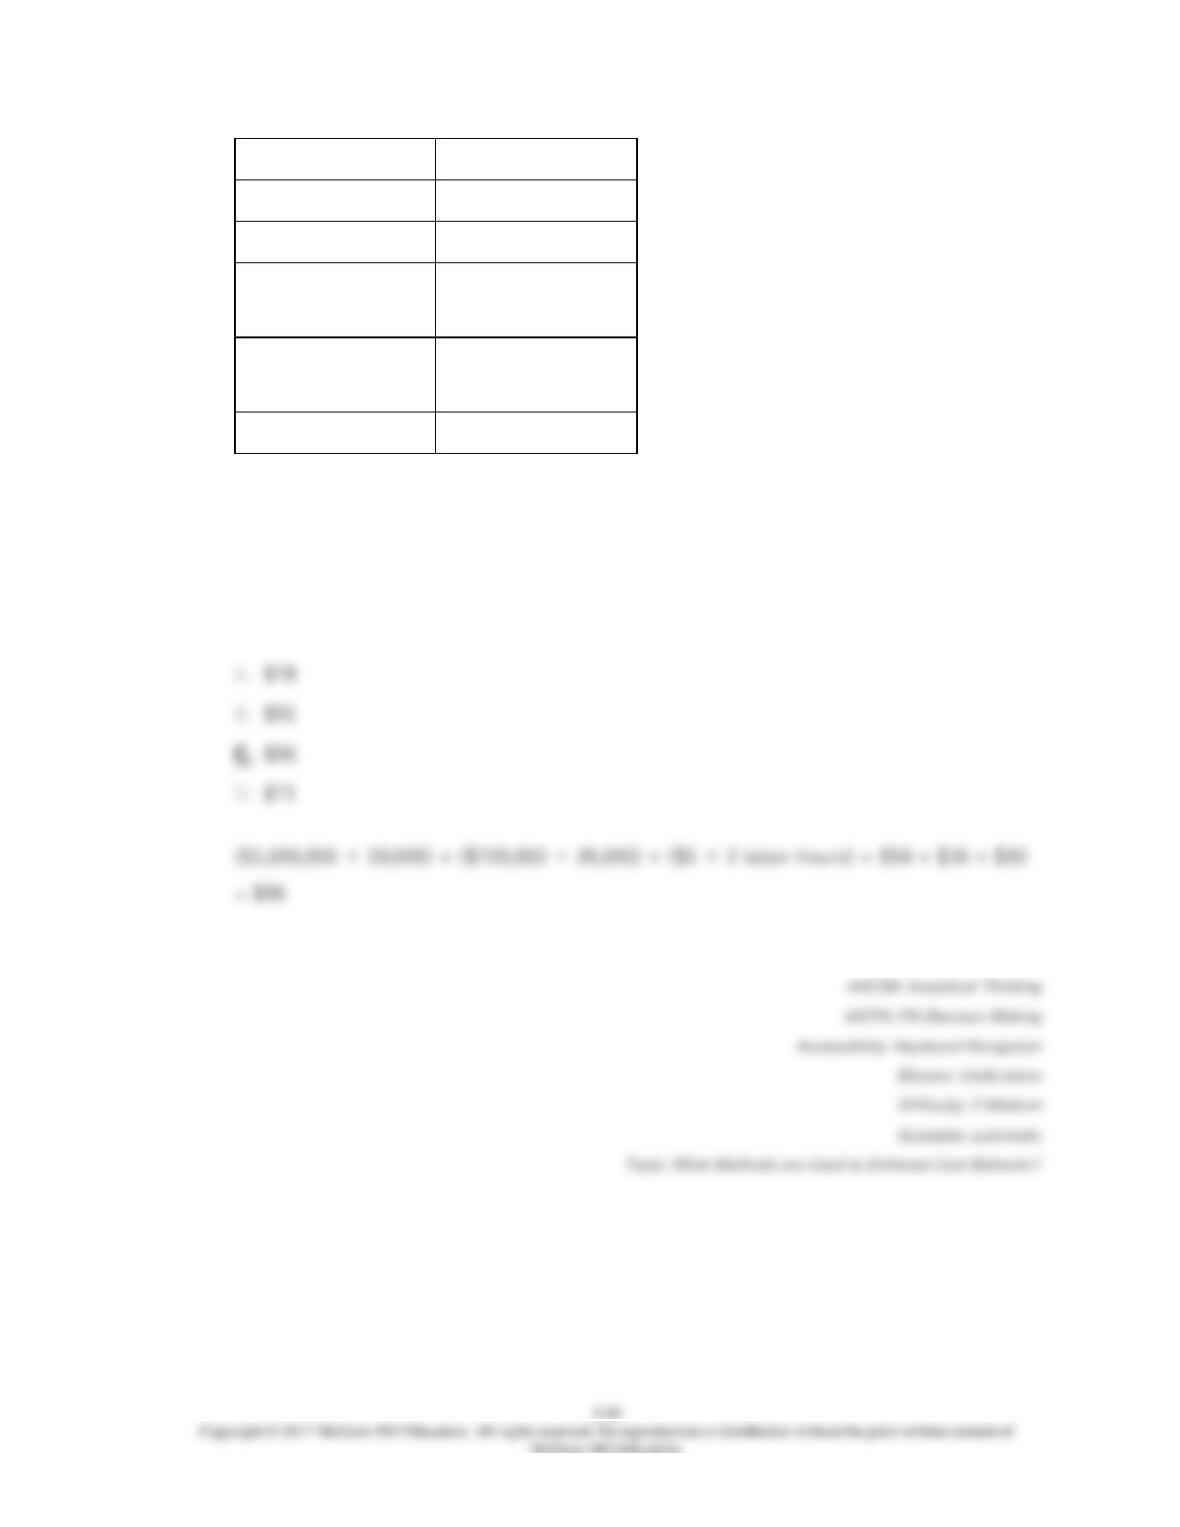
Based on the results of the regression analysis, the estimate of electricity costs in a
month with 2,200 machine hours would be: (rounded to the nearest whole dollar)

5-89
79.
Thane Company is interested in establishing the relationship between electricity costs and
machine hours. Data have been collected and a regression analysis prepared using Excel.
The monthly data and the regression output follow:
Month
Machine Hours
Electricity Costs
January
2,500
18,400
February
2,900
21,000
March
1,900
13,500
April
3,100
23,000
May
3,800
28,250
June
3,300
22,000
July
4,100
24,750
August
3,500
22,750
September
2,000
15,500
October
3,700
26,000
November
4,700
31,000
December
4,200
27,750
Summary Output
Regression Statistics
Multiple R
.965
R Square
.932
Adjusted R2
.925
Standard
Error
1,425.18
Observations
12.00
Coefficients
Standard
Error
t
Stat
P-
value
Lower
95%
Upper
95%
Intercept
3,726.88
1,682.82
2.21
0.05
(22.69)
7,476.45
Machine
Hours
5.77
0.49
11.7
0.00
4.67
6.87

5-91
80.
Thane Company is interested in establishing the relationship between electricity costs and
machine hours. Data have been collected and a regression analysis prepared using Excel.
The monthly data and the regression output follow:
Month
Machine Hours
Electricity Costs
January
2,500
18,400
February
2,900
21,000
March
1,900
13,500
April
3,100
23,000
May
3,800
28,250
June
3,300
22,000
July
4,100
24,750
August
3,500
22,750
September
2,000
15,500
October
3,700
26,000
November
4,700
31,000
December
4,200
27,750
Summary Output
Regression Statistics
Multiple R
.965
R Square
.932
Adjusted R2
.925
Standard
Error
1,425.18
Observations
12.00
Coefficients
Standard
Error
t
Stat
P-
value
Lower
95%
Upper
95%
Intercept
3,726.88
1,682.82
2.21
0.05
(22.69)
7,476.45
Machine
Hours
5.77
0.49
11.7
0.00
4.67
6.87
The percent of the total variance that can be explained by the regression is:
5-93
81.
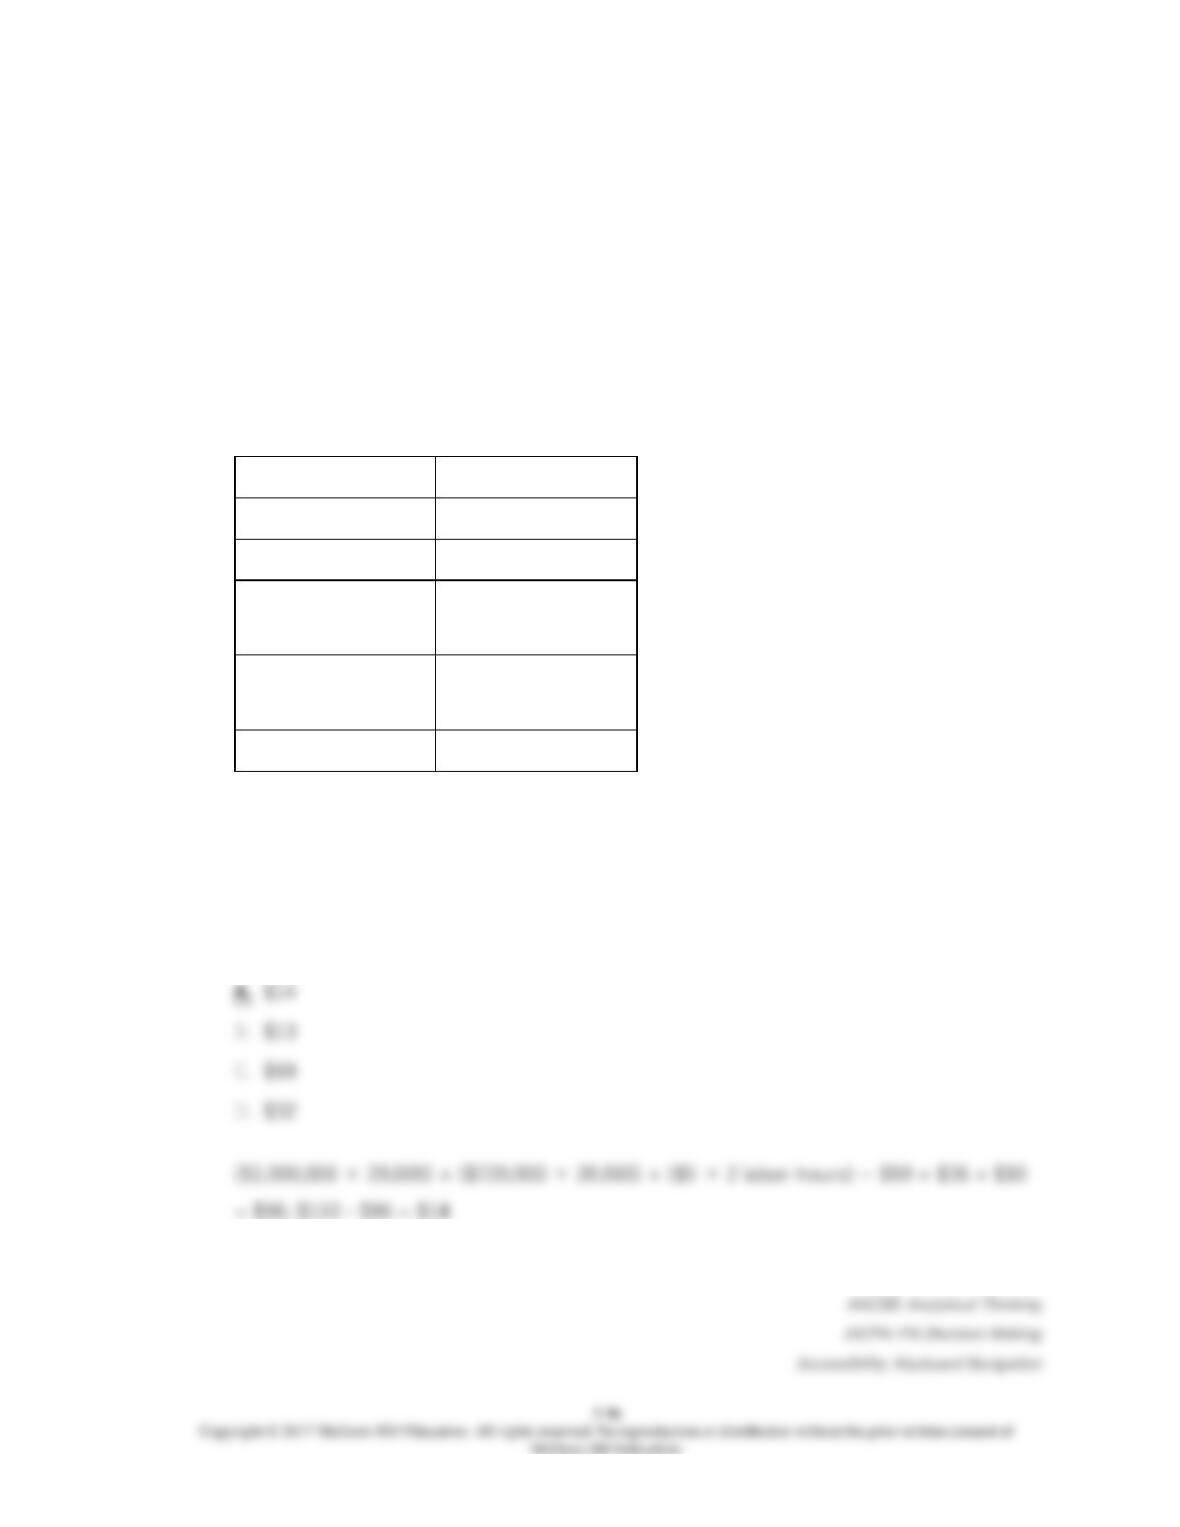
Balcom Enterprises is planning to introduce a new product that will sell for $110 a unit.
Manufacturing cost estimates for 20,000 units for the first year of production are:
• Direct materials $1,000,000
• Direct labor $720,000 (based on $18 per hour × 40,000 hours)
Although overhead has not be estimated for the new product, monthly data for Balcom’s
total production for the last two years has been analyzed using simple linear regression.
The analysis results are as follows:
Dependent variable
Factory overhead costs
Independent variable
Direct labor hours
Intercept
$120,000
Coefficient on
independent variable
$5.00
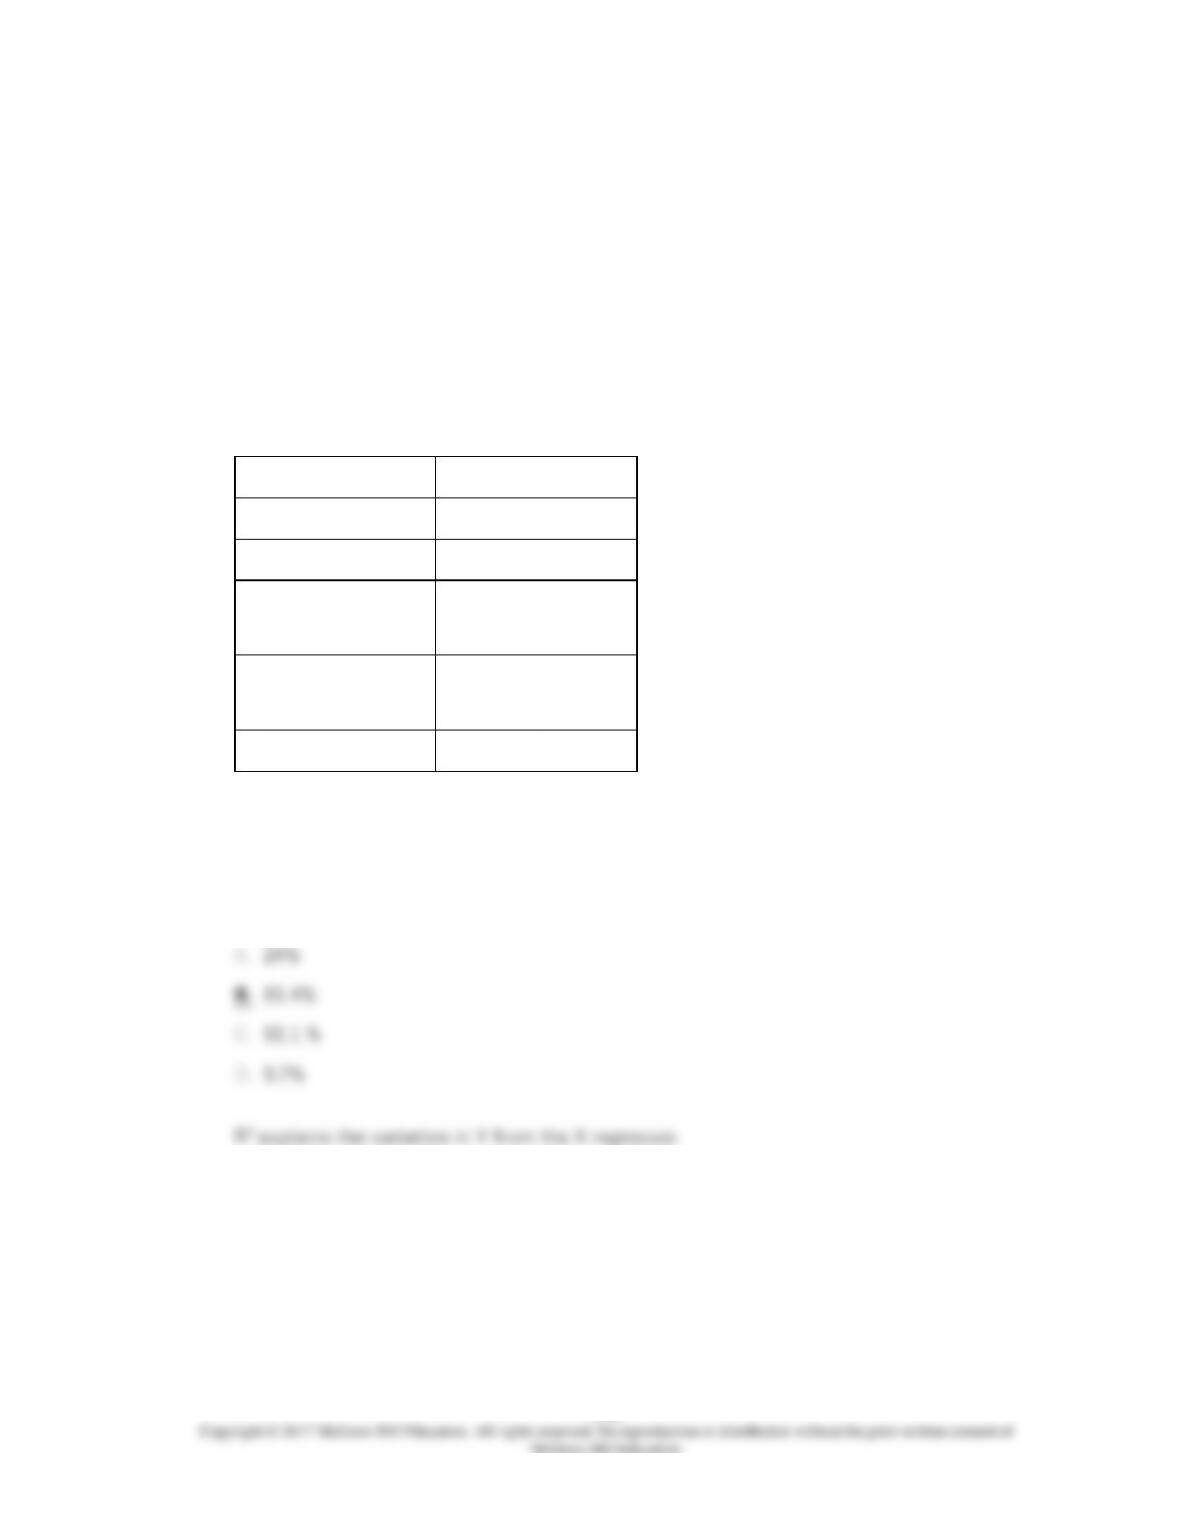
Coefficient of
correlation
0.911
R2
0.814
Based on this information, what percentage of the variation in overhead costs is explained
by the independent variable?
82.
Balcom Enterprises is planning to introduce a new product that will sell for $110 a unit.
Manufacturing cost estimates for 20,000 units for the first year of production are:
• Direct materials $1,000,000
5-94
• Direct labor $720,000 (based on $18 per hour × 40,000 hours)
Although overhead has not be estimated for the new product, monthly data for Balcom’s
total production for the last two years has been analyzed using simple linear regression.
The analysis results are as follows:
Dependent variable
Factory overhead costs
Independent variable
Direct labor hours
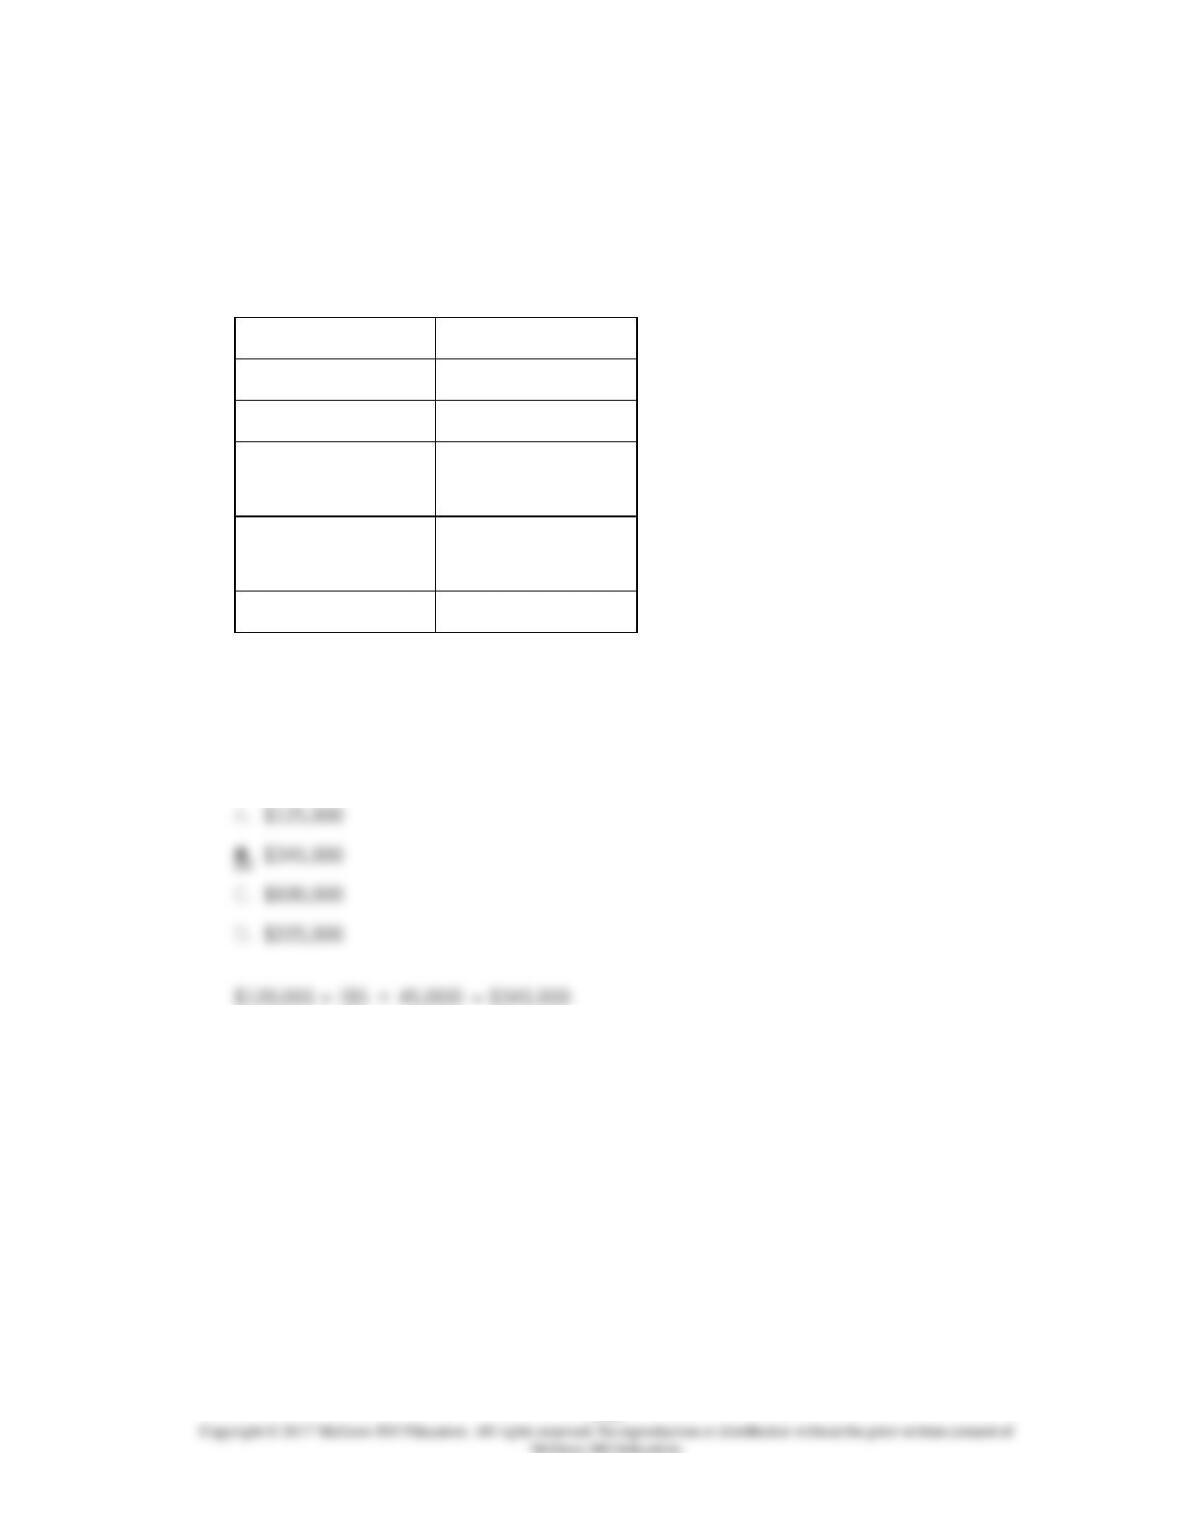
Intercept
$120,000
Coefficient on
independent variable
$5.00
Coefficient of
correlation
0.911
R2
0.814
Based on this information, what is the total overhead cost for an estimated activity level
of 45,000 direct labor-hours?
83.
Balcom Enterprises is planning to introduce a new product that will sell for $110 a unit.
Manufacturing cost estimates for 20,000 units for the first year of production are:
• Direct materials $1,000,000
• Direct labor $720,000 (based on $18 per hour × 40,000 hours)
Although overhead has not be estimated for the new product, monthly data for Balcom’s
total production for the last two years has been analyzed using simple linear regression.
The analysis results are as follows:
Dependent variable
Factory overhead costs
Independent variable
Direct labor hours
Intercept
$120,000
Coefficient on
independent variable
$5.00
Coefficient of
correlation
0.911
R2
0.814
84.
Balcom Enterprises is planning to introduce a new product that will sell for $110 a unit.
Manufacturing cost estimates for 20,000 units for the first year of production are:
• Direct materials $1,000,000
• Direct labor $720,000 (based on $18 per hour × 40,000 hours)
Although overhead has not be estimated for the new product, monthly data for Balcom’s
total production for the last two years has been analyzed using simple linear regression.
The analysis results are as follows:
Dependent variable
Factory overhead costs
Independent variable
Direct labor hours
Intercept
$120,000
Coefficient on
independent variable
$5.00
Coefficient of
correlation
0.911
R2
0.814
Based on this information, what is the expected contribution margin per unit to be earned
during the first year on 20,000 units of the new product? (Assume that all marketing and
administrative costs are fixed.)
85.
Given actual amounts of a semi-variable cost for various levels of output, the method that
will always give the most reliable measure of the fixed and variable components is the:
86.
87.
Which of the following is a common assumption of cost estimation?
88.
Which of the following is not a data problem an analyst must watch for when estimating
cost behavior?
89.
Which of the following is not a data problem an analyst must watch for when estimating
cost behavior?