35.
A disadvantage of the high-low method of cost analysis is that it:
5-22
36.
37.
5-23
38.
39.
The coefficient of correlation is:
40.
Brewsky’s is a chain of micro-breweries. Managers are interested in the costs of the
stores and believe that the costs can be explained in large part by the number of
customers patronizing the stores. Monthly data regarding customer visits and costs for
the preceding year for one of the stores have been entered into the regression analysis
and the analysis is as follows:
Average monthly customer-visits
1,462
Average monthly total costs
$4,629
Regression Results
Intercept
$1,496
b
coefficient
$2.08
R
2
0.86814
In a regression equation expressed as
y
=
a
+
bx
, how is the letter
b
best described?
(CMA adapted)
41.
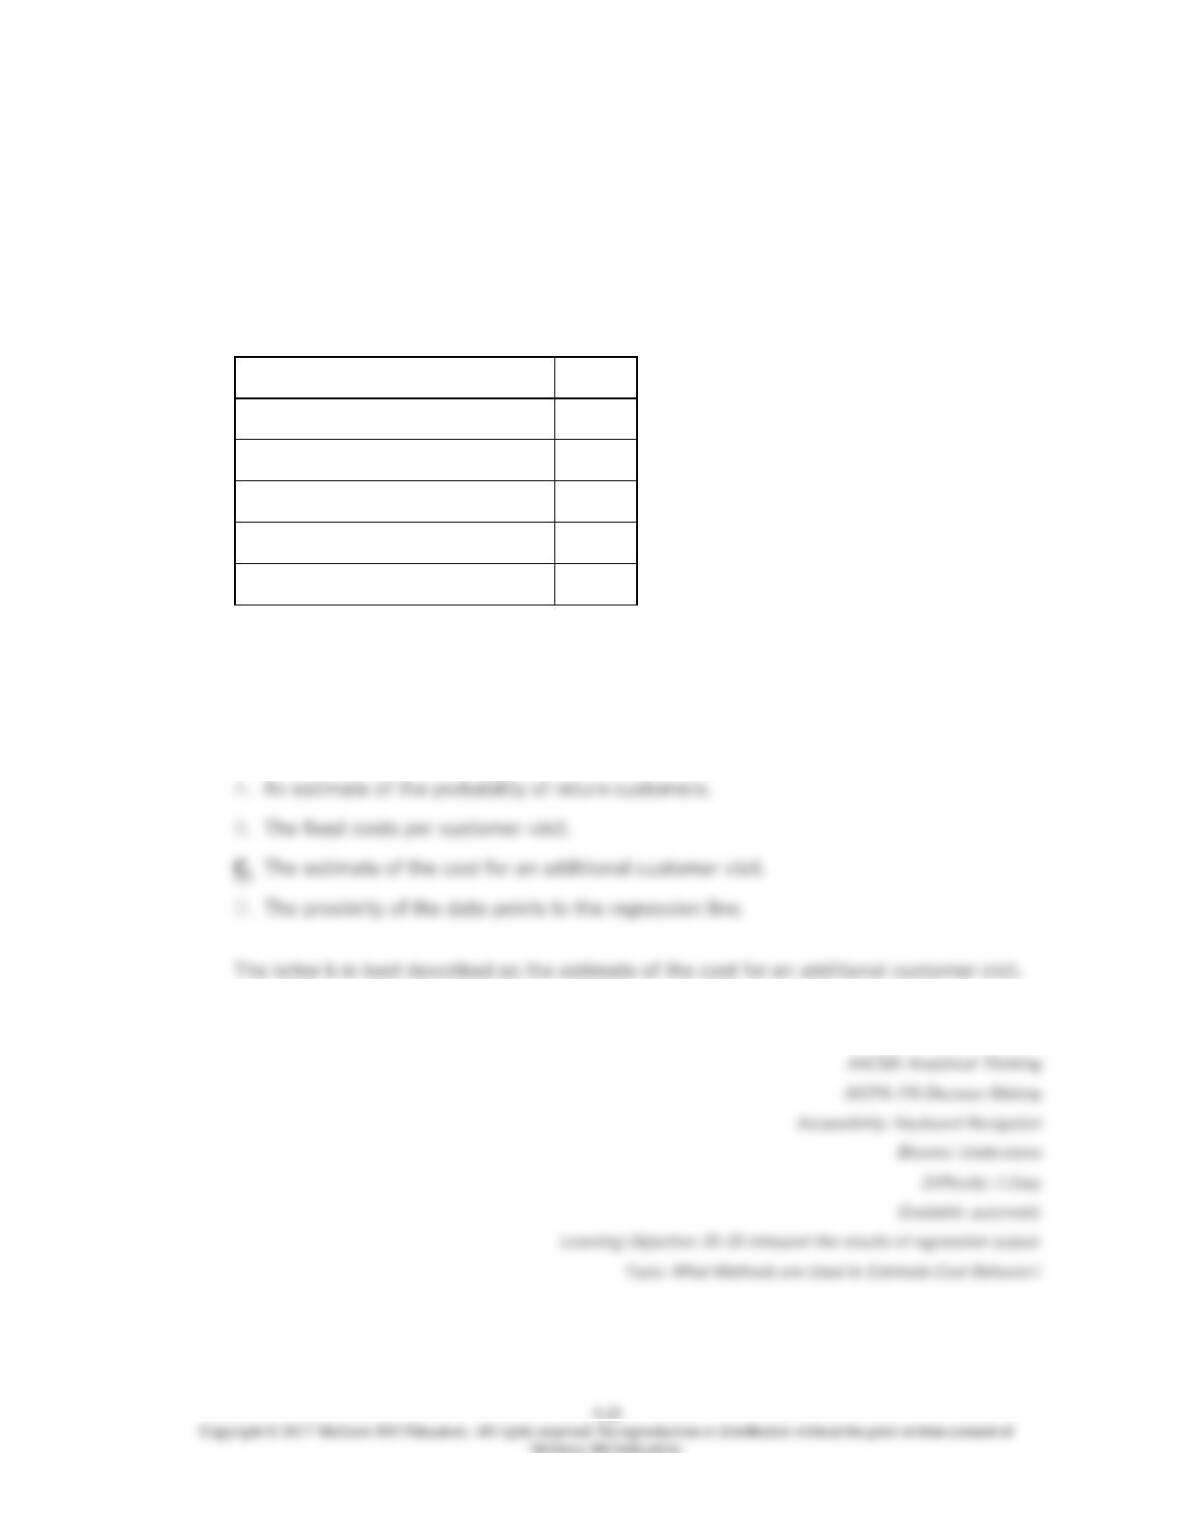
Brewsky’s is a chain of micro-breweries. Managers are interested in the costs of the
stores and believe that the costs can be explained in large part by the number of
customers patronizing the stores. Monthly data regarding customer visits and costs for
the preceding year for one of the stores have been entered into the regression analysis
and the analysis is as follows:
Average monthly customer-visits
1,462
Average monthly total costs
$4,629
Regression Results
Intercept
$1,496
b
coefficient
$2.08
R
2
0.86814
How is the letter
y
in the regression equation best described? (CMA adapted)
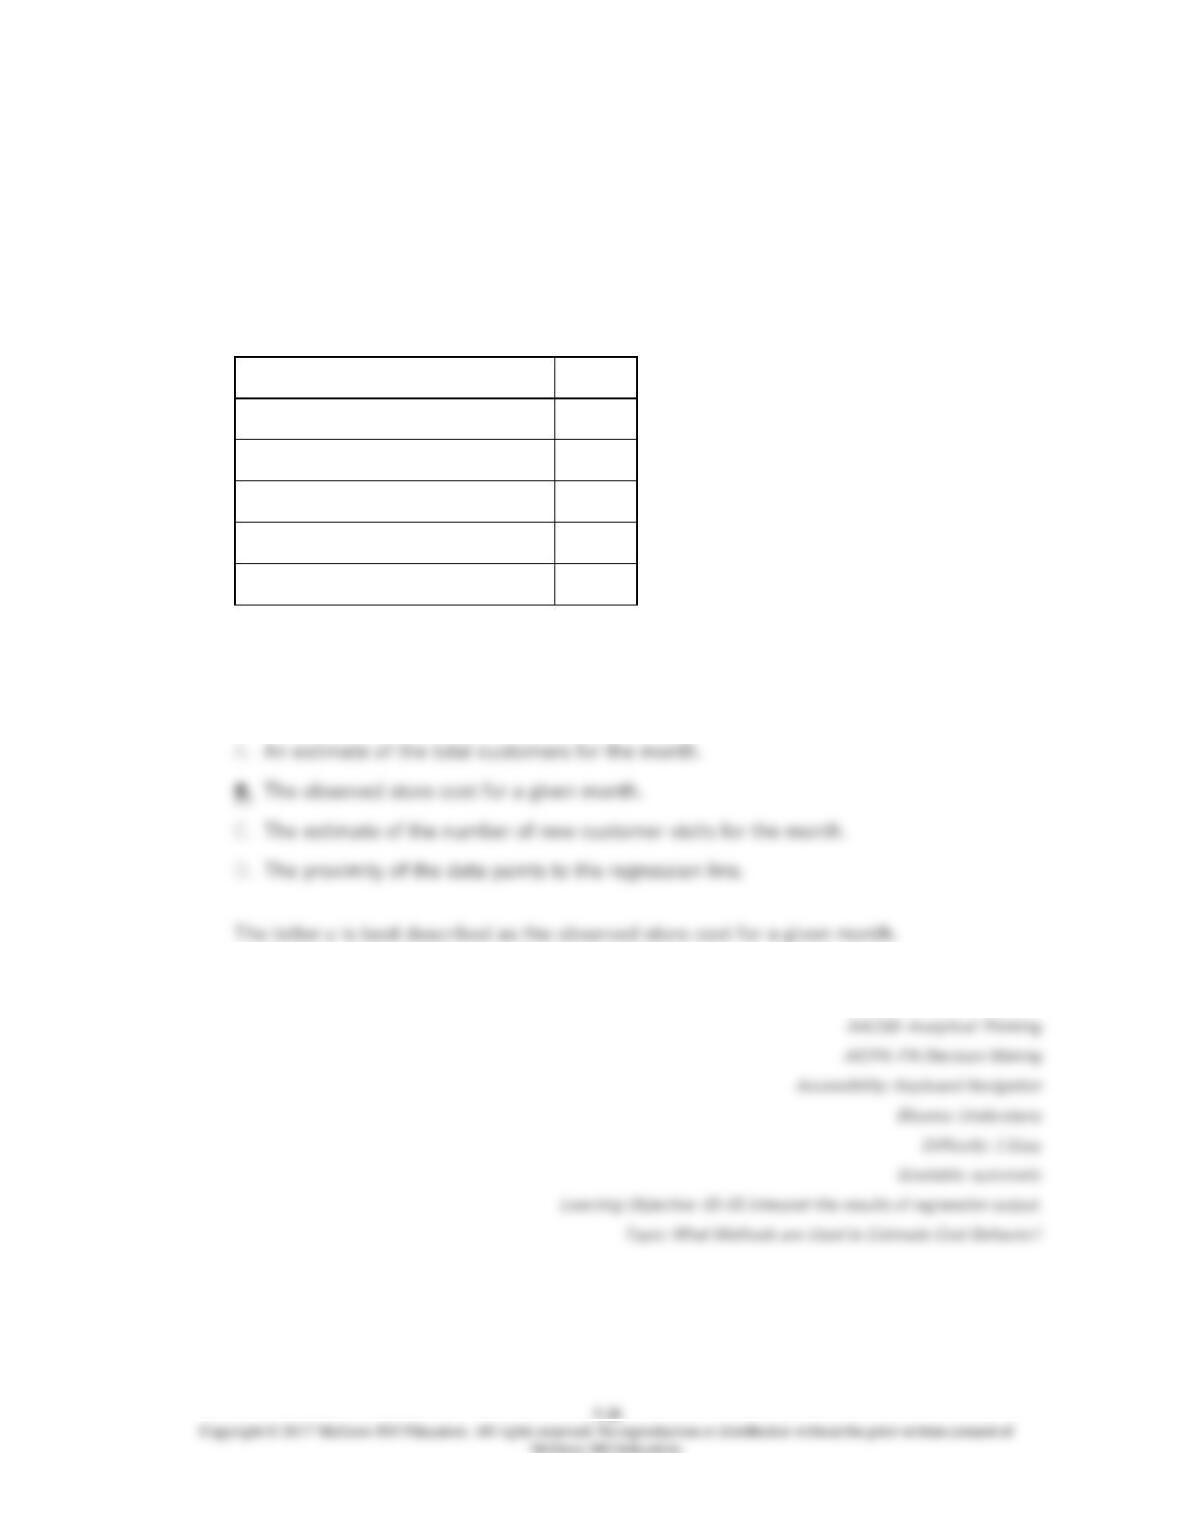
42.
Brewsky’s is a chain of micro-breweries. Managers are interested in the costs of the
stores and believe that the costs can be explained in large part by the number of
customers patronizing the stores. Monthly data regarding customer visits and costs for
the preceding year for one of the stores have been entered into the regression analysis
and the analysis is as follows:
Average monthly customer-visits
1,462
Average monthly total costs
$4,629
Regression Results
Intercept
$1,496
b
coefficient
$2.08
R
2
0.86814
How is the letter
x
in the regression equation best described? (CMA adapted)
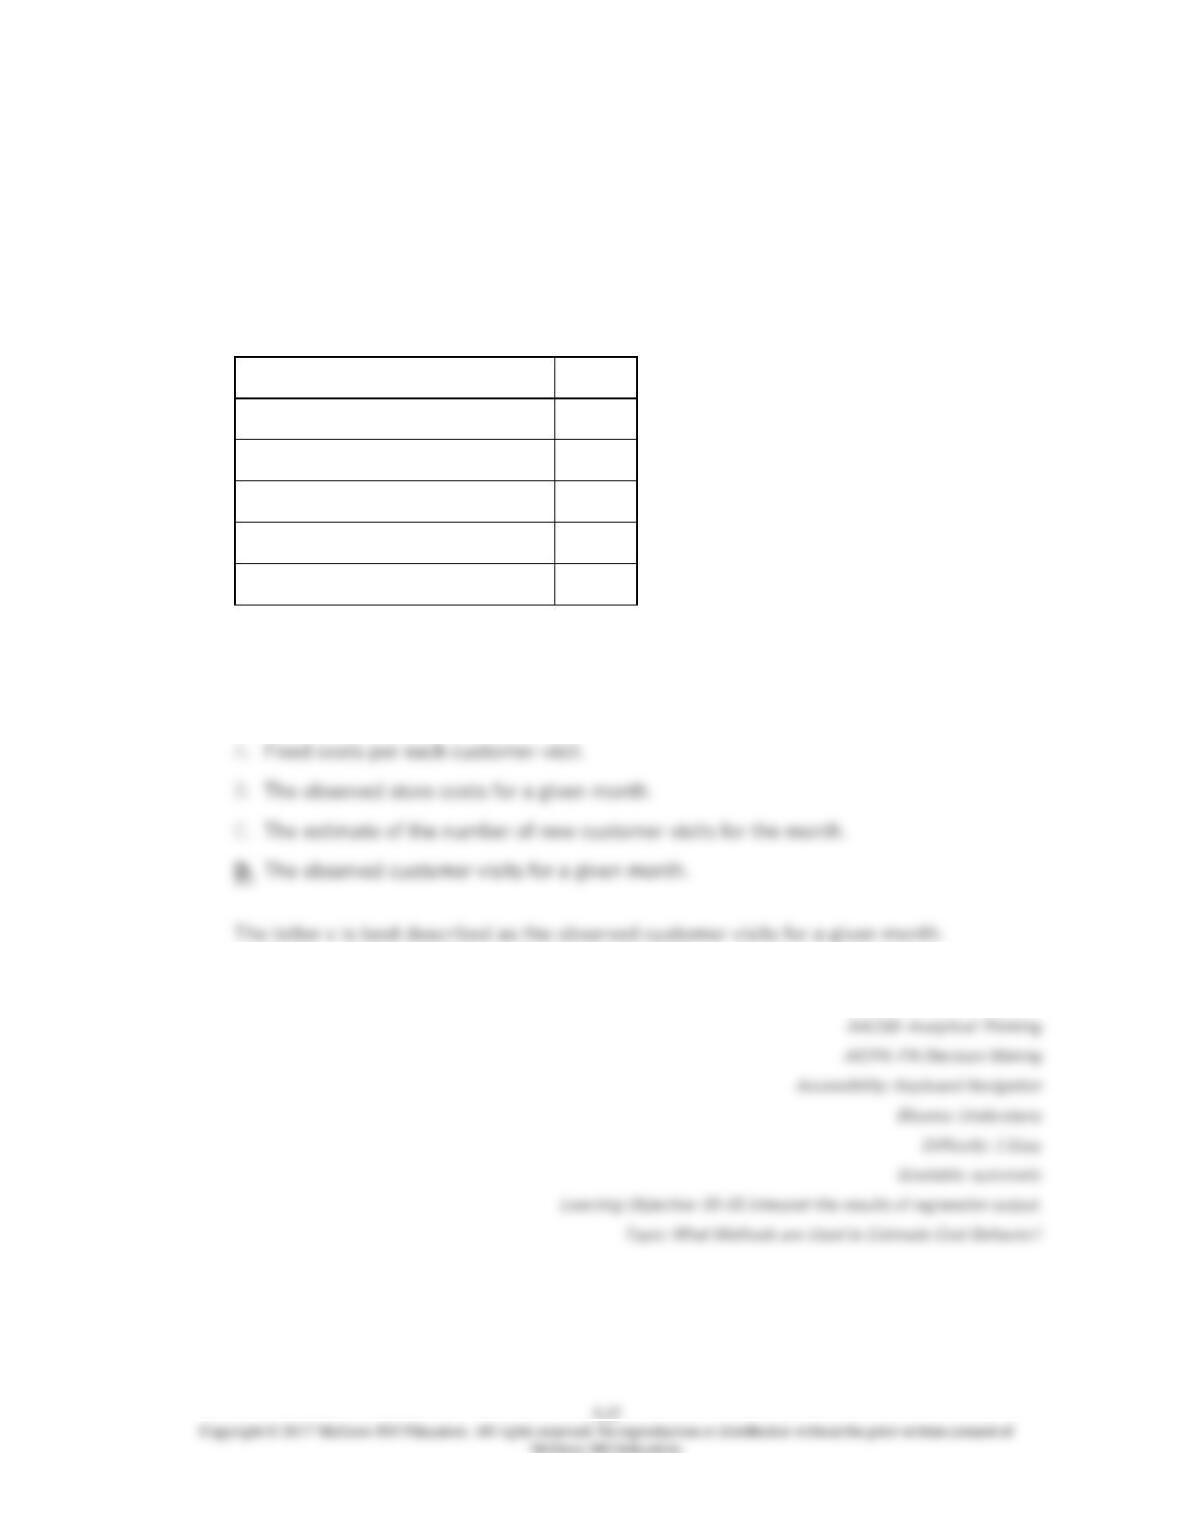
43.
Brewsky’s is a chain of micro-breweries. Managers are interested in the costs of the
stores and believe that the costs can be explained in large part by the number of
customers patronizing the stores. Monthly data regarding customer visits and costs for
the preceding year for one of the stores have been entered into the regression analysis
and the analysis is as follows:
Average monthly customer-visits
1,462
Average monthly total costs
$4,629
Regression Results
Intercept
$1,496
b
coefficient
$2.08
R
2
0.86814
Based on the data derived from the regression analysis, what are the estimated costs for
1,600 customer-visits in a month? (CMA adapted)
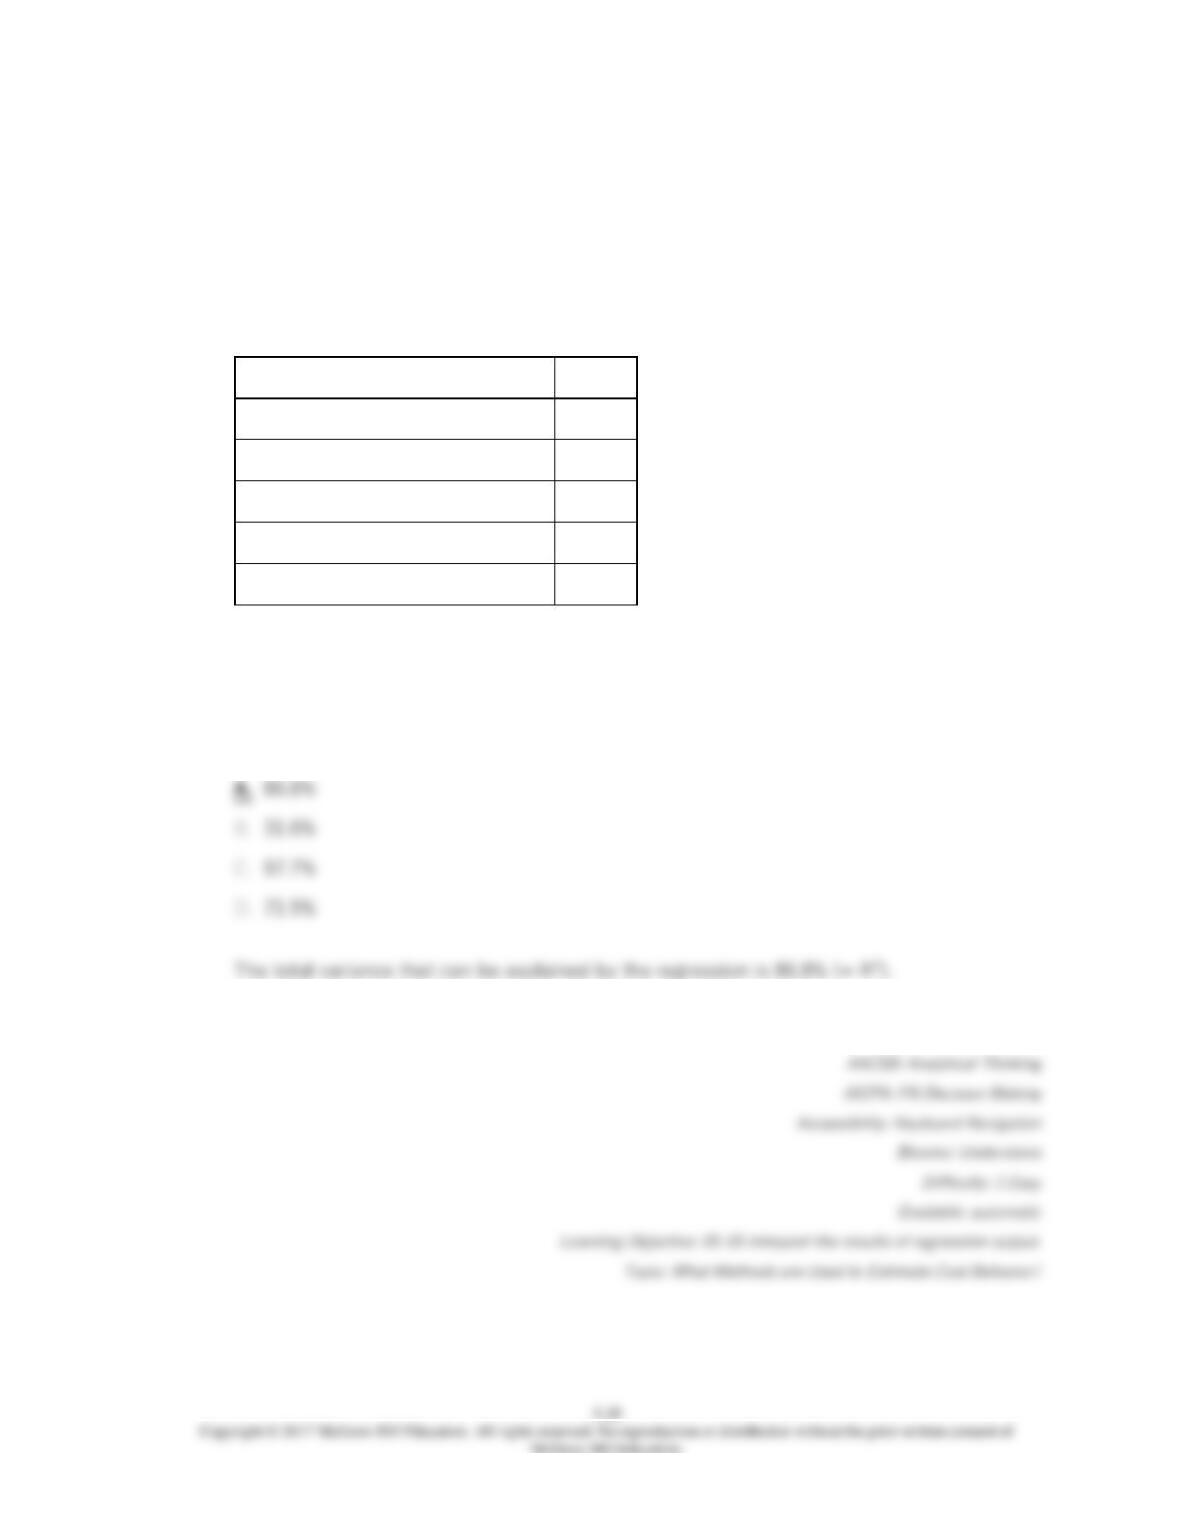
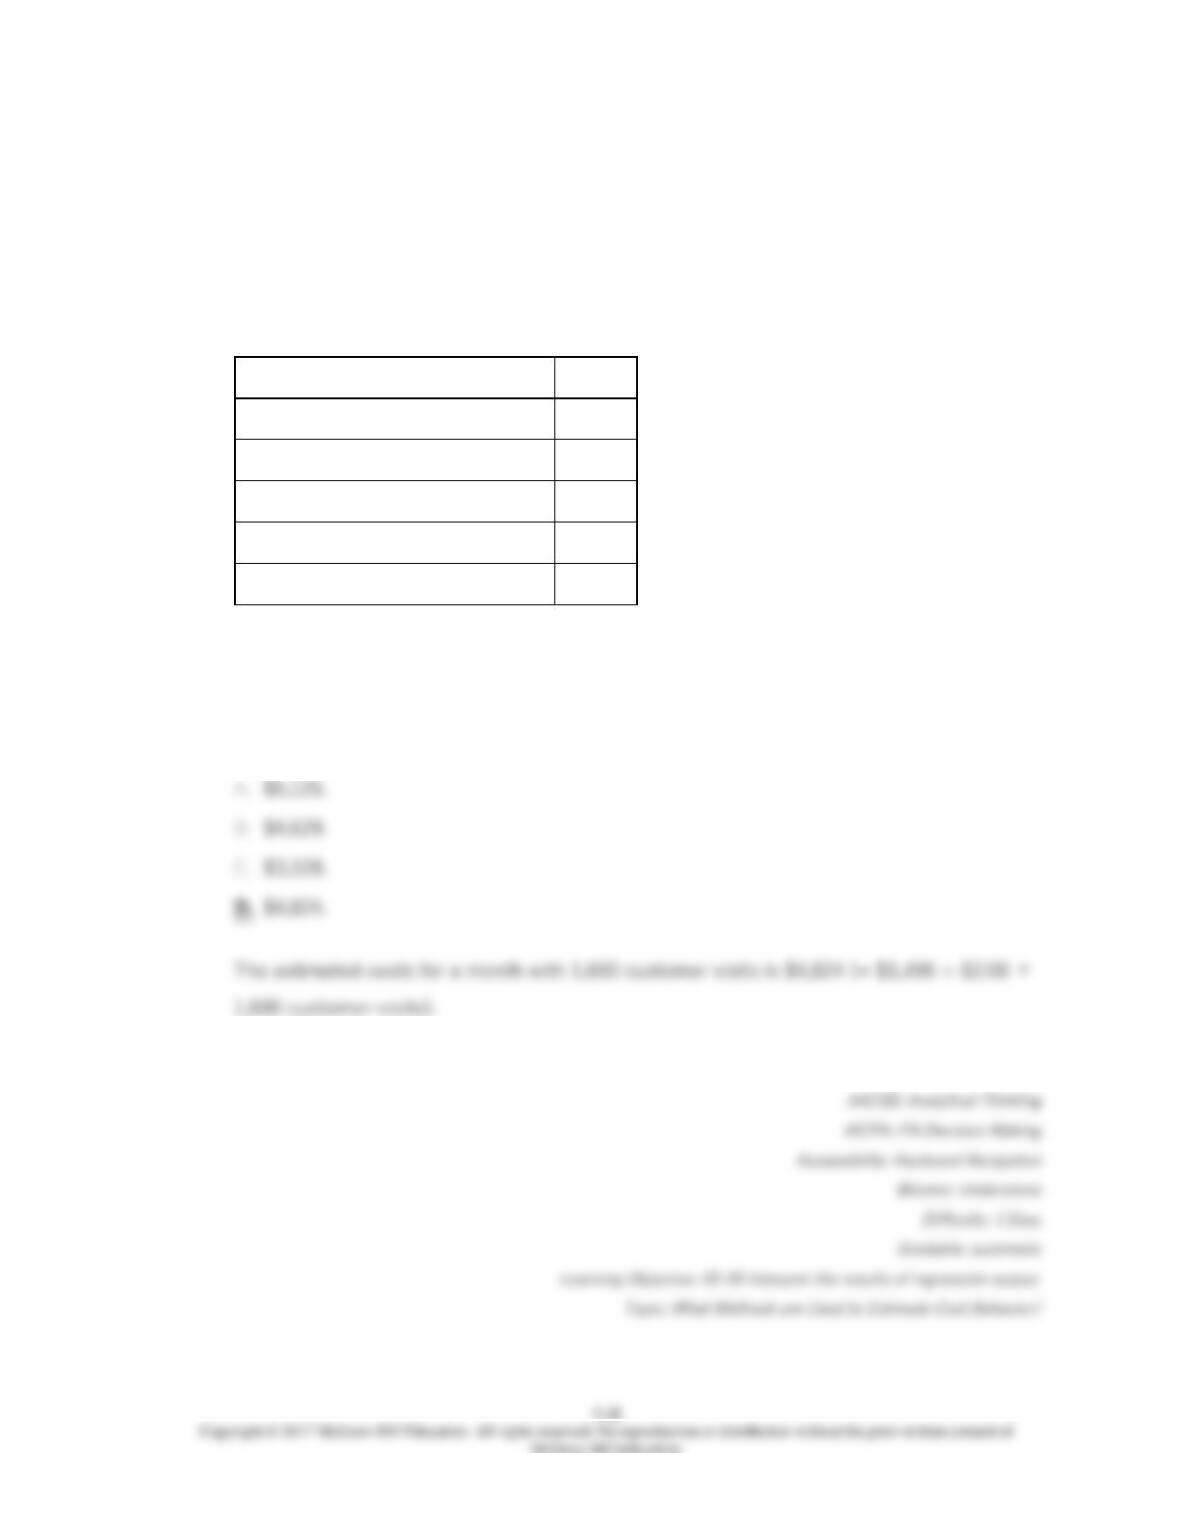
44.
Brewsky’s is a chain of micro-breweries. Managers are interested in the costs of the
stores and believe that the costs can be explained in large part by the number of
customers patronizing the stores. Monthly data regarding customer visits and costs for
the preceding year for one of the stores have been entered into the regression analysis
and the analysis is as follows:
Average monthly customer-visits
1,462
Average monthly total costs
$4,629
Regression Results
Intercept
$1,496
b
coefficient
$2.08
R
2
0.86814
What is the percent of the total variance that can be explained by the regression
equation? (CMA adapted)
45.
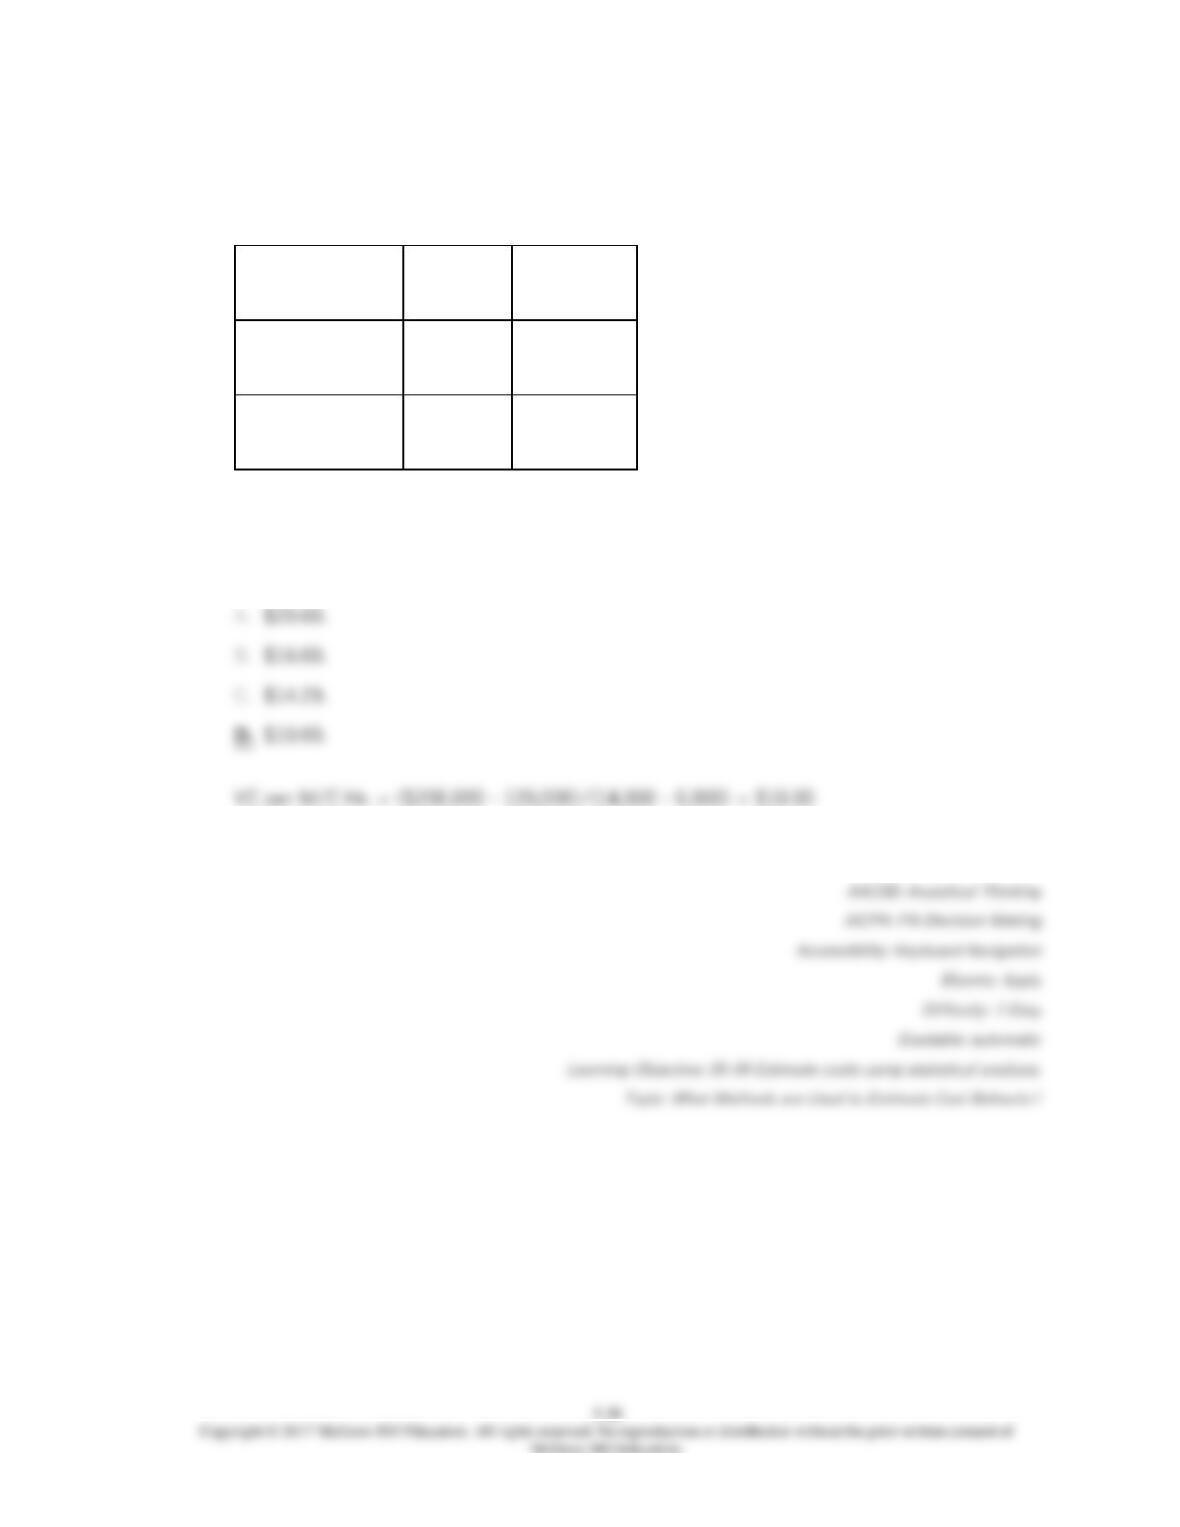
The Macon Company uses the high-low method to determine its cost equation. The
following information was gathered for the past year:
Machine
Hours
Direct Labor
Costs
Busiest month
(June)
14,000
$200,000
Slowest month
(December)
6,000
$120,000
What are the direct labor costs per machine hour?
46.
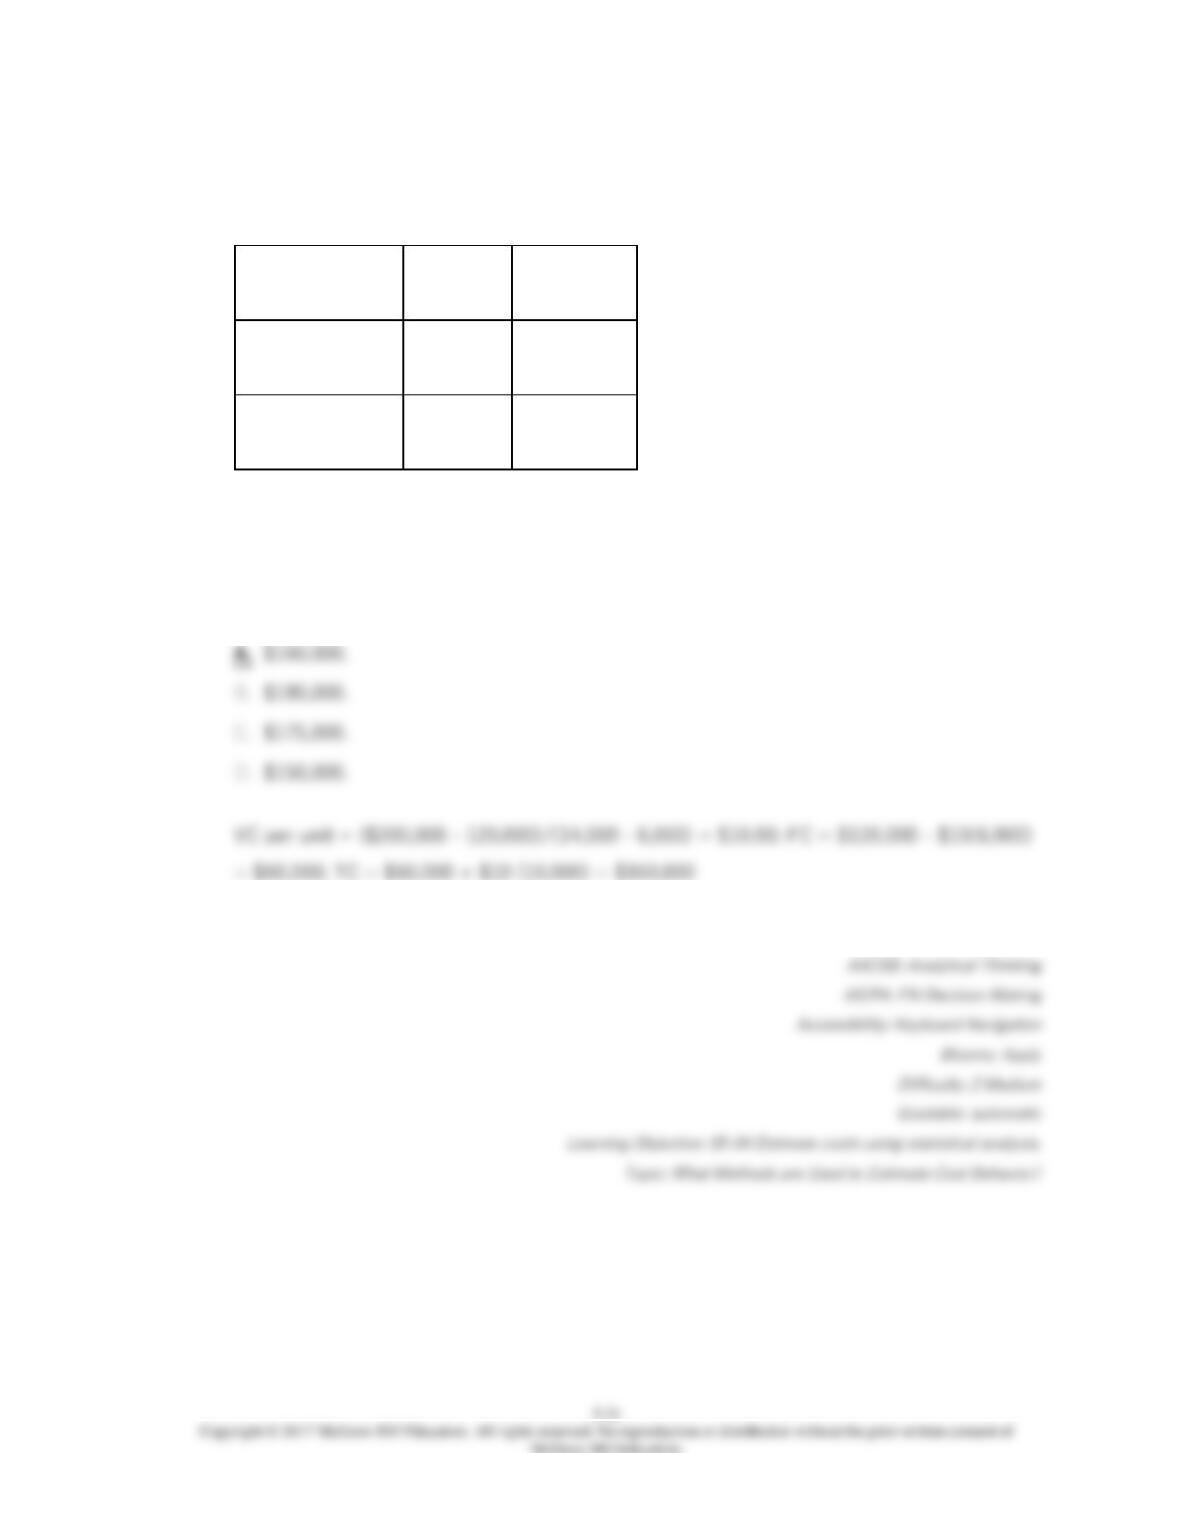
The Macon Company uses the high-low method to determine its cost equation. The
following information was gathered for the past year:
Machine
Hours
Direct Labor
Costs
Busiest month
(June)
14,000
$200,000
Slowest month
(December)
6,000
$120,000
If Macon expects to use 10,000 machine hours next month, what are the estimated direct
labor costs?
47.
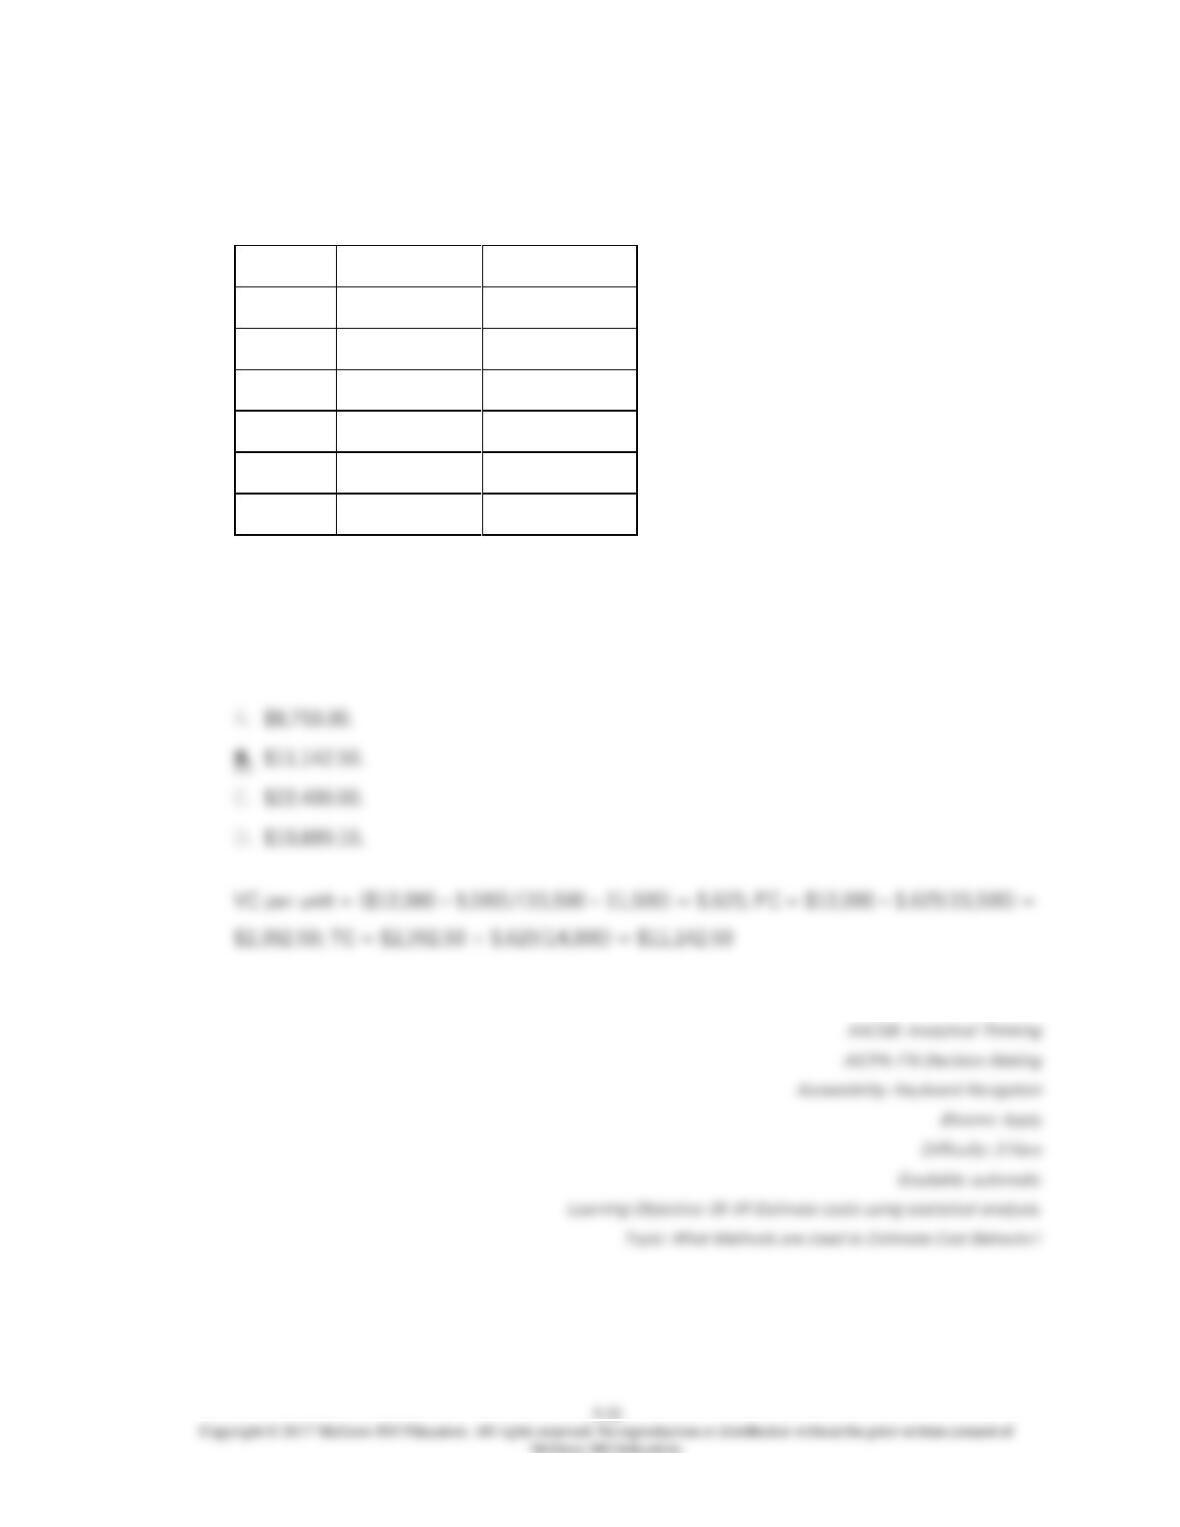
Fromme’s Frocks has the following machine hours and production costs for the last six
months of last year:
Month
Machine Hours
Production Cost
July
15,000
$12,075
August
13,500
10,800
September
11,500
9,580
October
15,500
12,080
November
14,800
11,692
December
12,100
9,922
48.
The controller of Fortnight Co. has requested a quick estimate of the manufacturing
supplies needed for the Cleveland Plant for the month of July, when production is
expected to be 470,000 units to meet the ending inventory requirements and sales of
475,000 units. Fortnight Co.’s budget analyst has the following actual data for the last
three months.
Month
Production in
Units
Manufacturing
Supplies
March
450,000
$723,060
April
540,000
853,560
May
480,000
766,560
49.
The Crater Manufacturing Company recorded overhead costs of $14,182 at an activity
level of 4,200 machine hours and $8,748 at 2,300 machine hours. The records also
indicated that overhead of $9,730 was incurred at 2,600 machine hours. What is the
variable cost per machine hour using the high-low method to estimate the cost equation?
50.
The Missou Manufacturing Company recorded overhead costs of $14,182 at an activity
level of 4,200 machine hours and $8,748 at 2,300 machine hours. The records also
indicated that overhead of $9,730 was incurred at 2,600 machine hours. What is the total
estimated cost for 2,600 machine hours using the high-low method to estimate the cost
equation?
51.
The cost accountants at the Barkley Company regressed total overhead costs and direct
labor hours for the past 30-months and reported the following results:
Slope
$41.27
Intercept
$596.36
Correlation Coefficient
.934

5-37
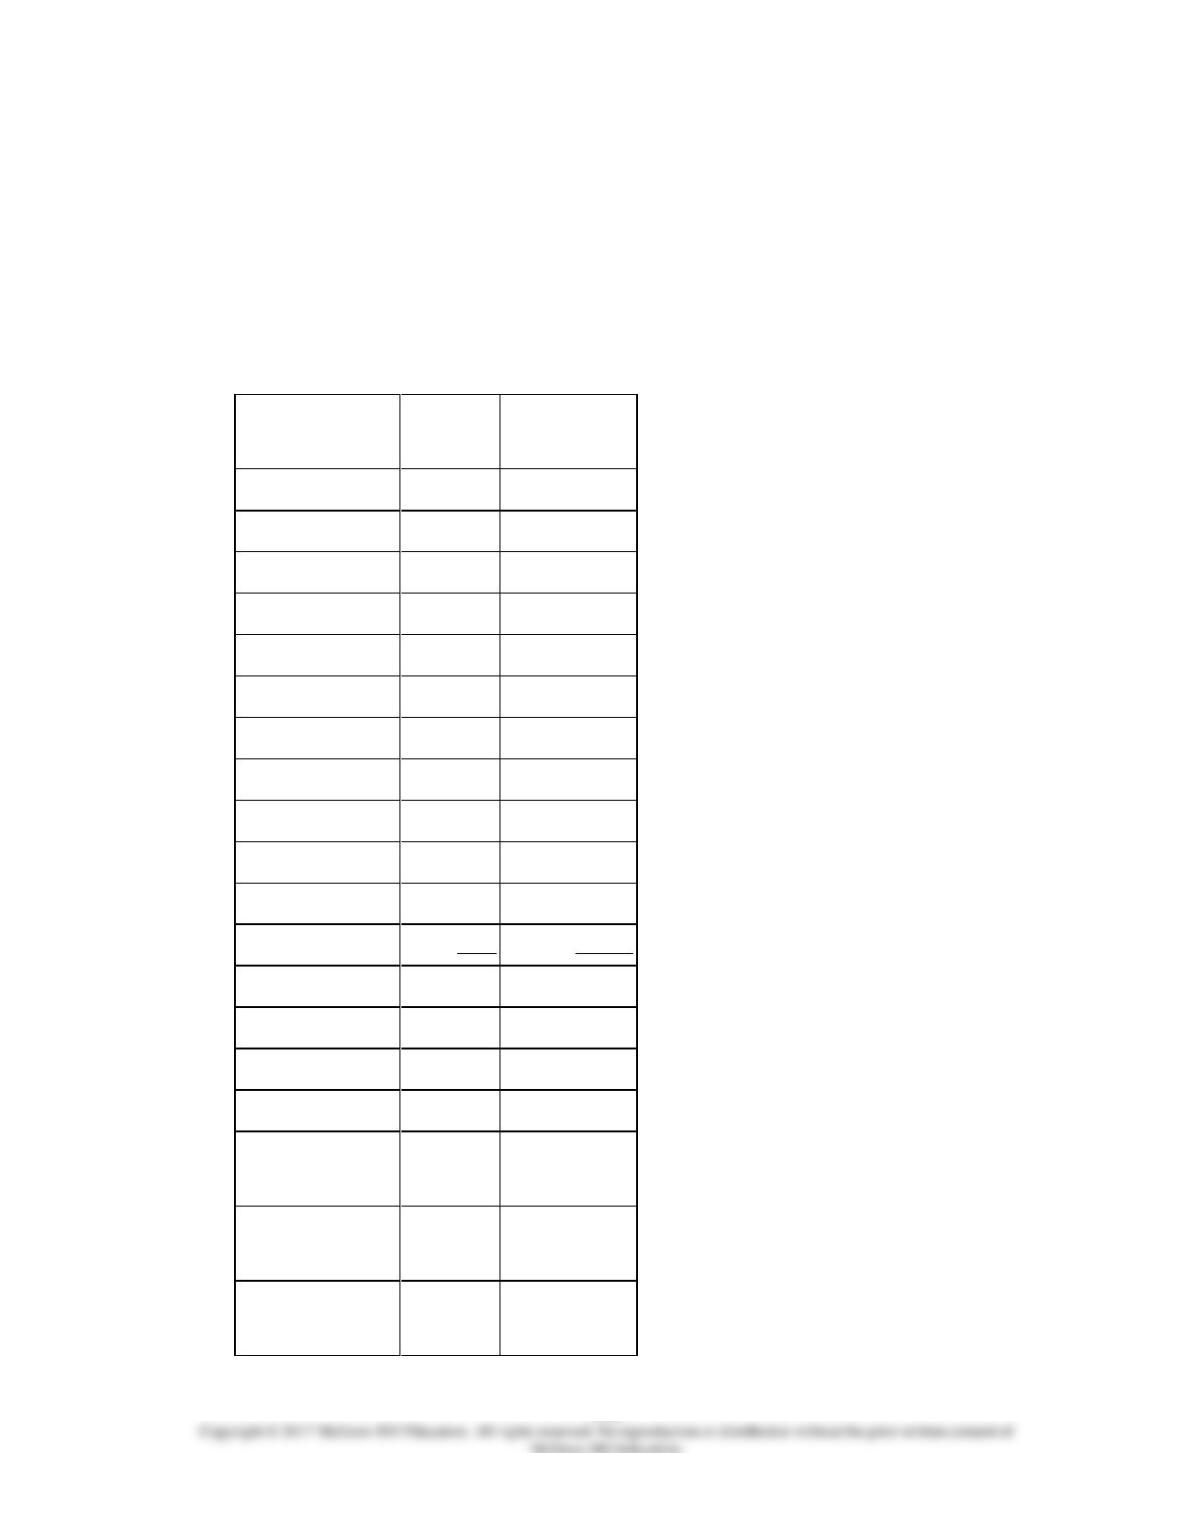
52.
The McGraw Company is accumulating data to be used in preparing its annual profit plan
for the coming year. The cost behavior pattern of the maintenance costs must be
determined. The accounting staff has suggested that linear regression be employed to
derive an equation in the form of y = a + bx for maintenance costs. Data regarding the
maintenance hours and costs for last year and the results of the regression analysis are as
follows: (CMA adapted)
Hours of
Activity
Maintenance
Costs
January
480
$4,200
February
320
3,000
March
400
3,600
April
300
2,820
May
500
4,350
June
310
2,960
July
320
3,030
August
520
4,470
September
490
4,260
October
470
4,050
November
350
3,300
December
340
3,160
Sum
4,800
$43,200
Average
400
3,600
A coefficient
684.65
B coefficient
7.2884
Standard error of
the a coefficient
49.515
Standard error of
the b coefficient
.12126
Standard error of
the estimate
34.469
R2
.99724
T-value a
13.827
T-value b
60.105
5-39
53.
The McGraw Company is accumulating data to be used in preparing its annual profit plan
for the coming year. The cost behavior pattern of the maintenance costs must be
determined. The accounting staff has suggested that linear regression be employed to
derive an equation in the form of y = a + bx for maintenance costs. Data regarding the
maintenance hours and costs for last year and the results of the regression analysis are as
follows: (CMA adapted)
Hours of
Activity
Maintenance
Costs
January
480
$4,200
February
320
3,000
March
400
3,600
April
300
2,820
May
500
4,350
June
310
2,960
July
320
3,030
August
520
4,470
September
490
4,260
October
470
4,050
November
350
3,300
December
340
3,160
Sum
4,800
$43,200
Average
400
3,600
A coefficient
684.65
B coefficient
7.2884
Standard error of
the a coefficient
49.515
Standard error of
the b coefficient
.12126
Standard error of
the estimate
34.469
R2
.99724
T-value a
13.827
T-value b
60.105