90.
In the learning curve equation Y = aXb, the Y term represents:
91.
In the learning curve equation Y = aXb, the X term represents:
92.
In the learning curve equation Y = aXb, the “a” term represents:
93.
In the learning curve equation Y = aXb, the “b” term represents:
94.
95.
Bachmann Products, Inc., has found that new products follow a learning curve. The first
two units have been completed with the following results:
Units Produced
Marginal Labor Time
1
80.00
2
68.00
How much time will be needed to complete the 4th unit?
5-105
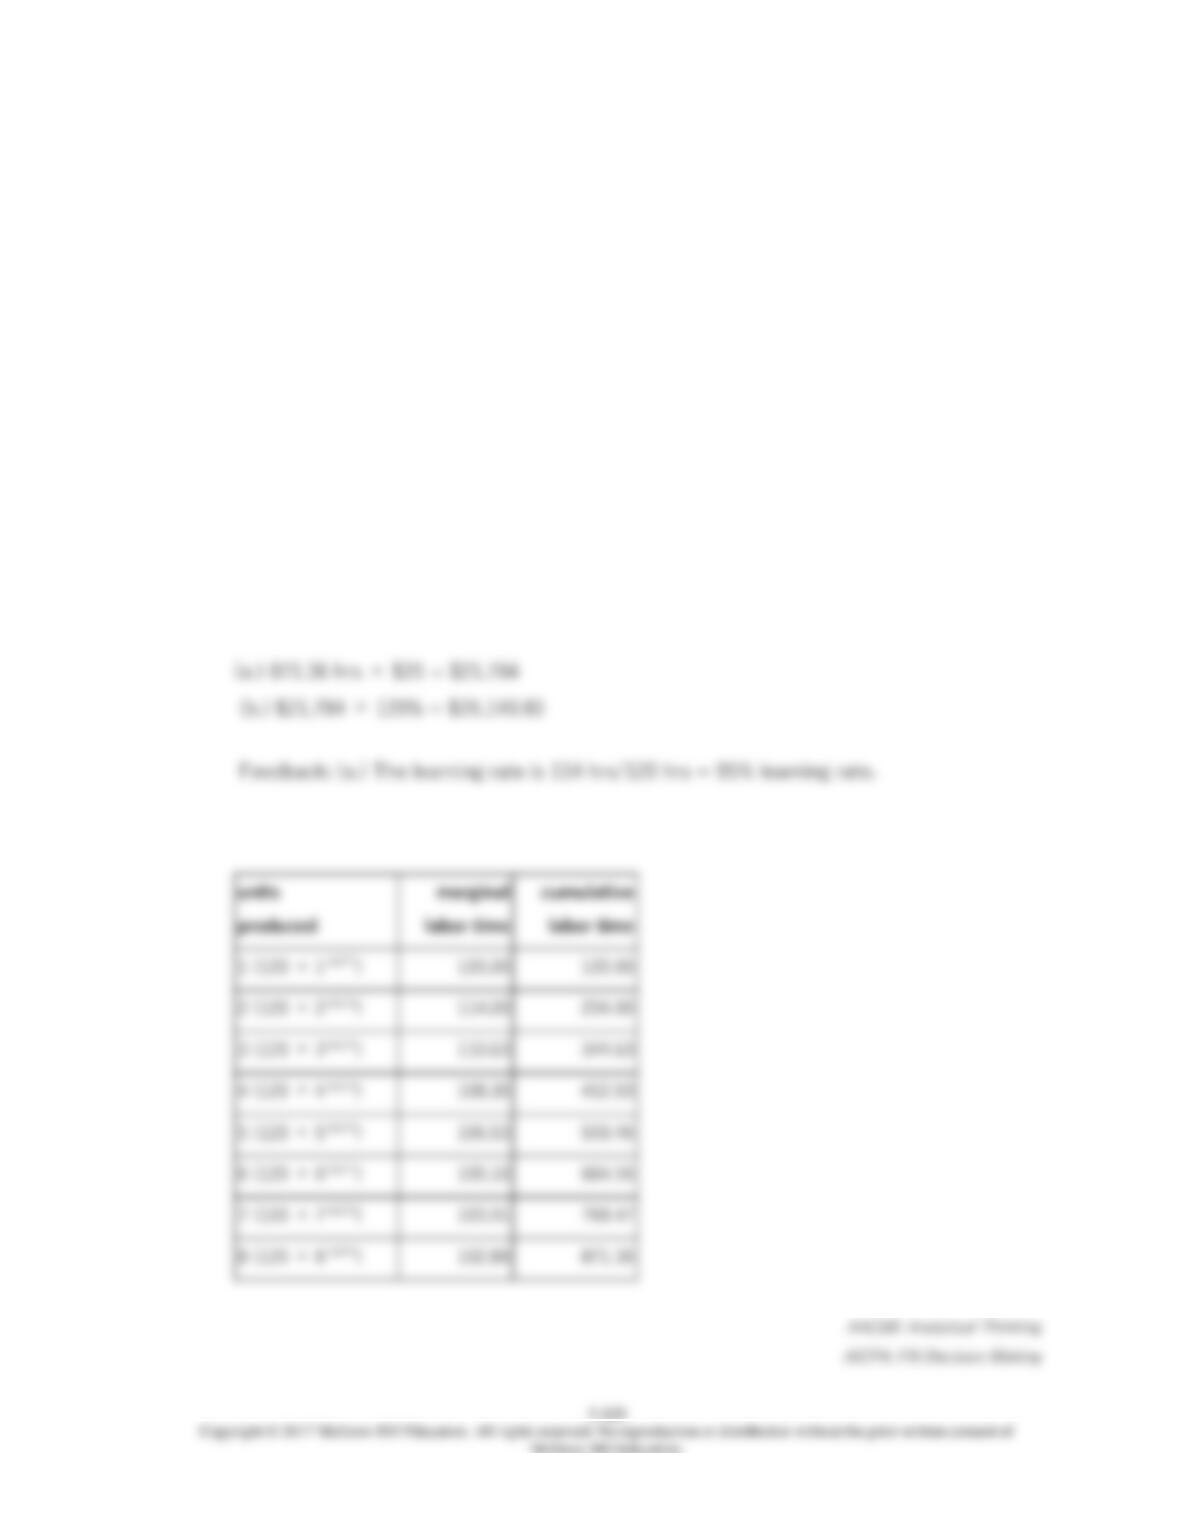
96.
Bachmann Products, Inc., has found that new products follow a learning curve. The first
two units have been completed with the following results:
Units Produced
Marginal Labor Time
1
80.00
2
68.00
How much time will be needed to complete the 8th unit?
Essay Questions
5-106
97.
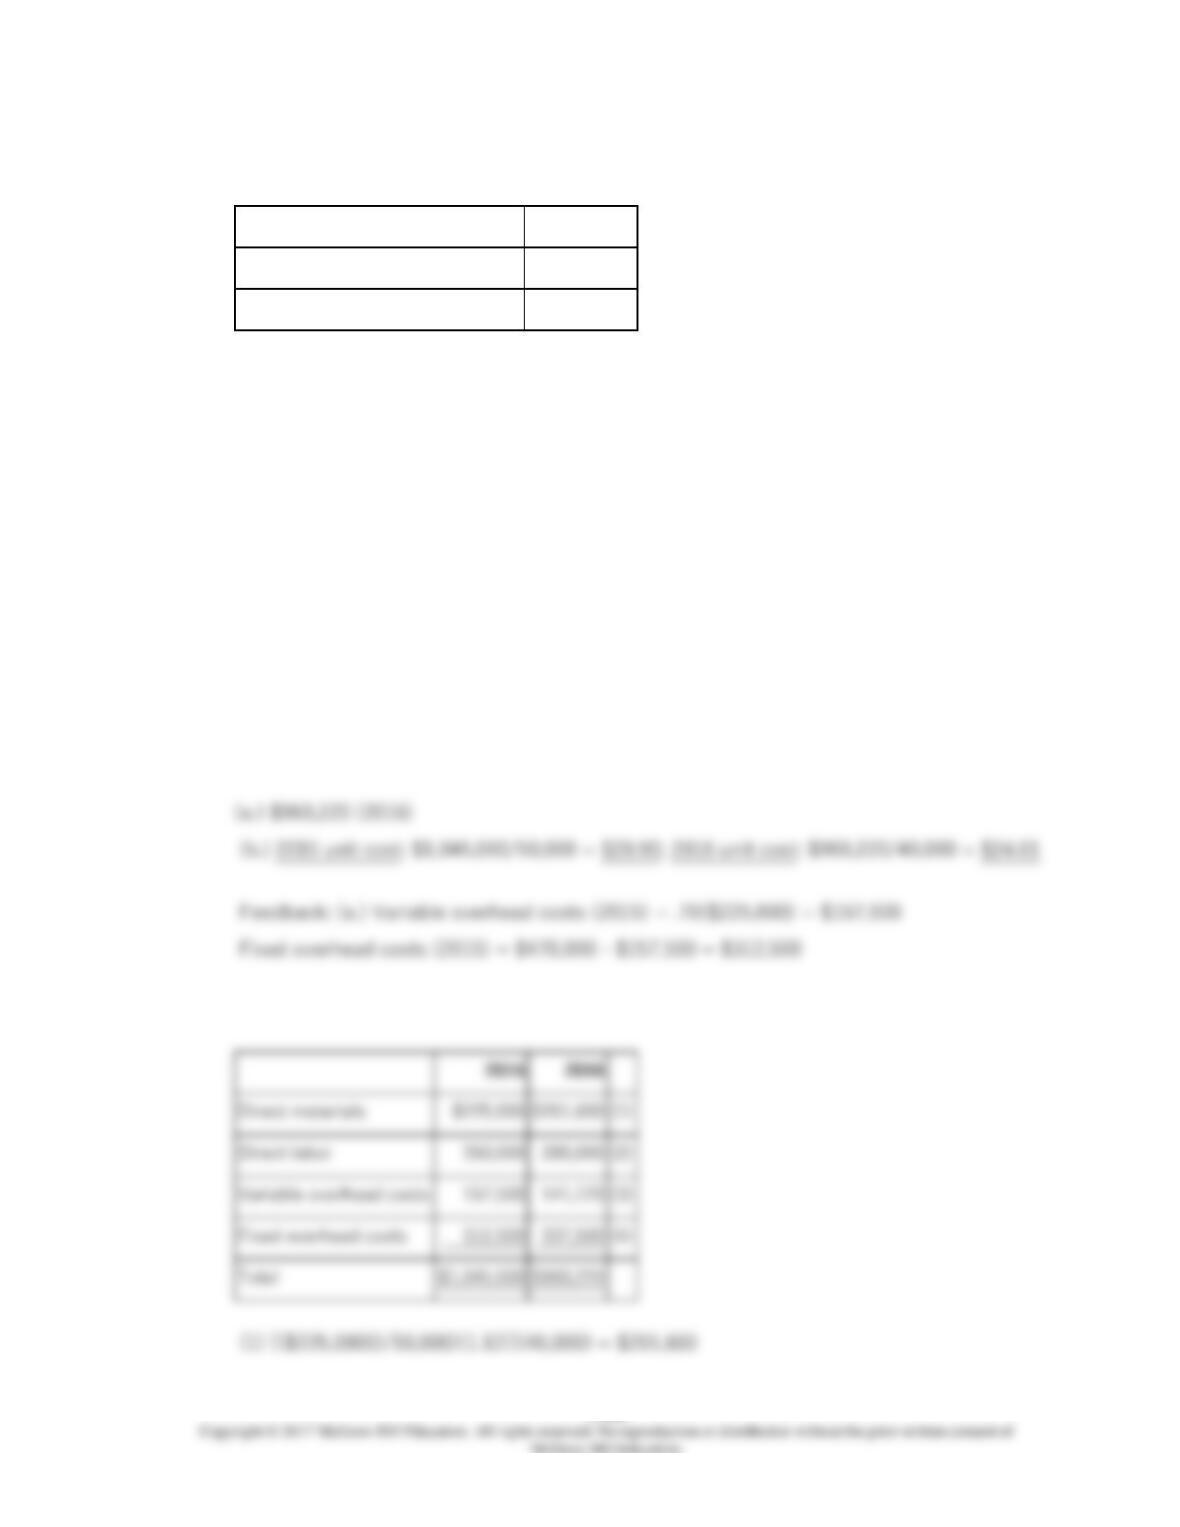
The following manufacturing costs were incurred by the Miracle Mile Company in 2015:
Direct materials
$225,000
Direct labor
350,000
Manufacturing overhead
470,000
Direct labor
Variable overhead costs
Fixed overhead costs

5-108
98.
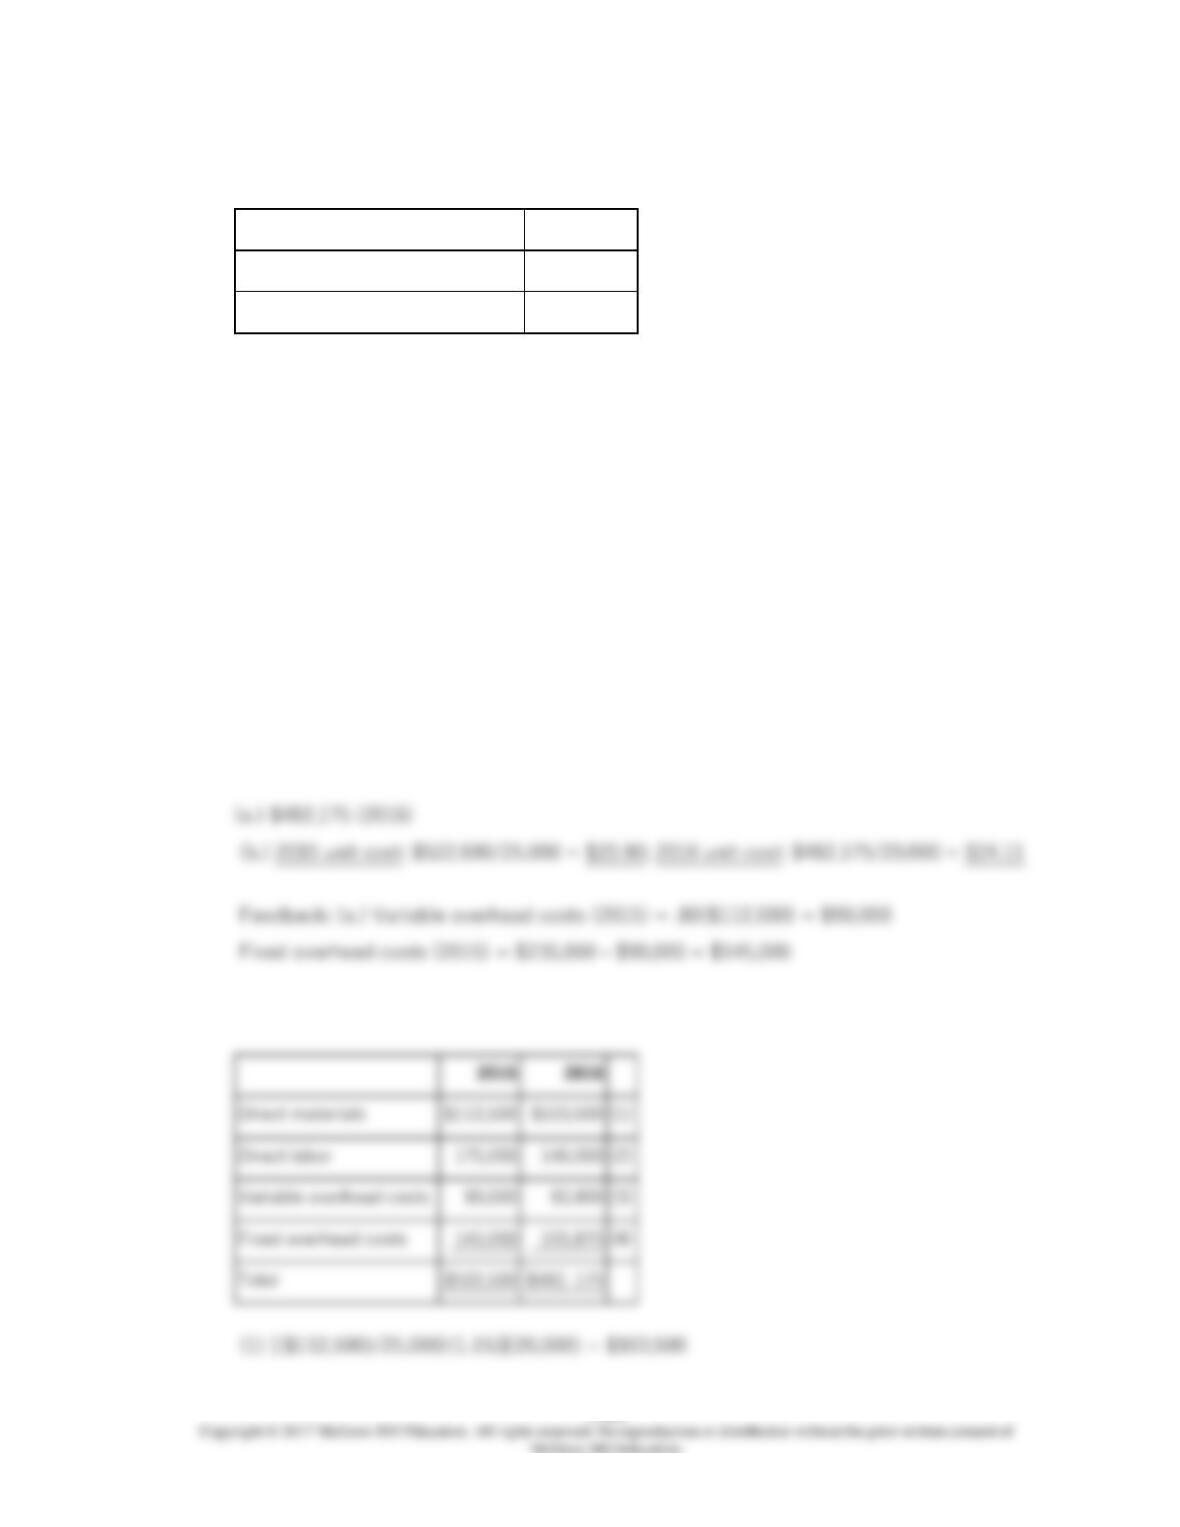
The following manufacturing costs were incurred by the Trinitram Company in 2015:
Direct materials
$112,500
Direct labor
175,000
Manufacturing overhead
235,000
Direct labor
Variable overhead costs
Fixed overhead costs
5-110
99.
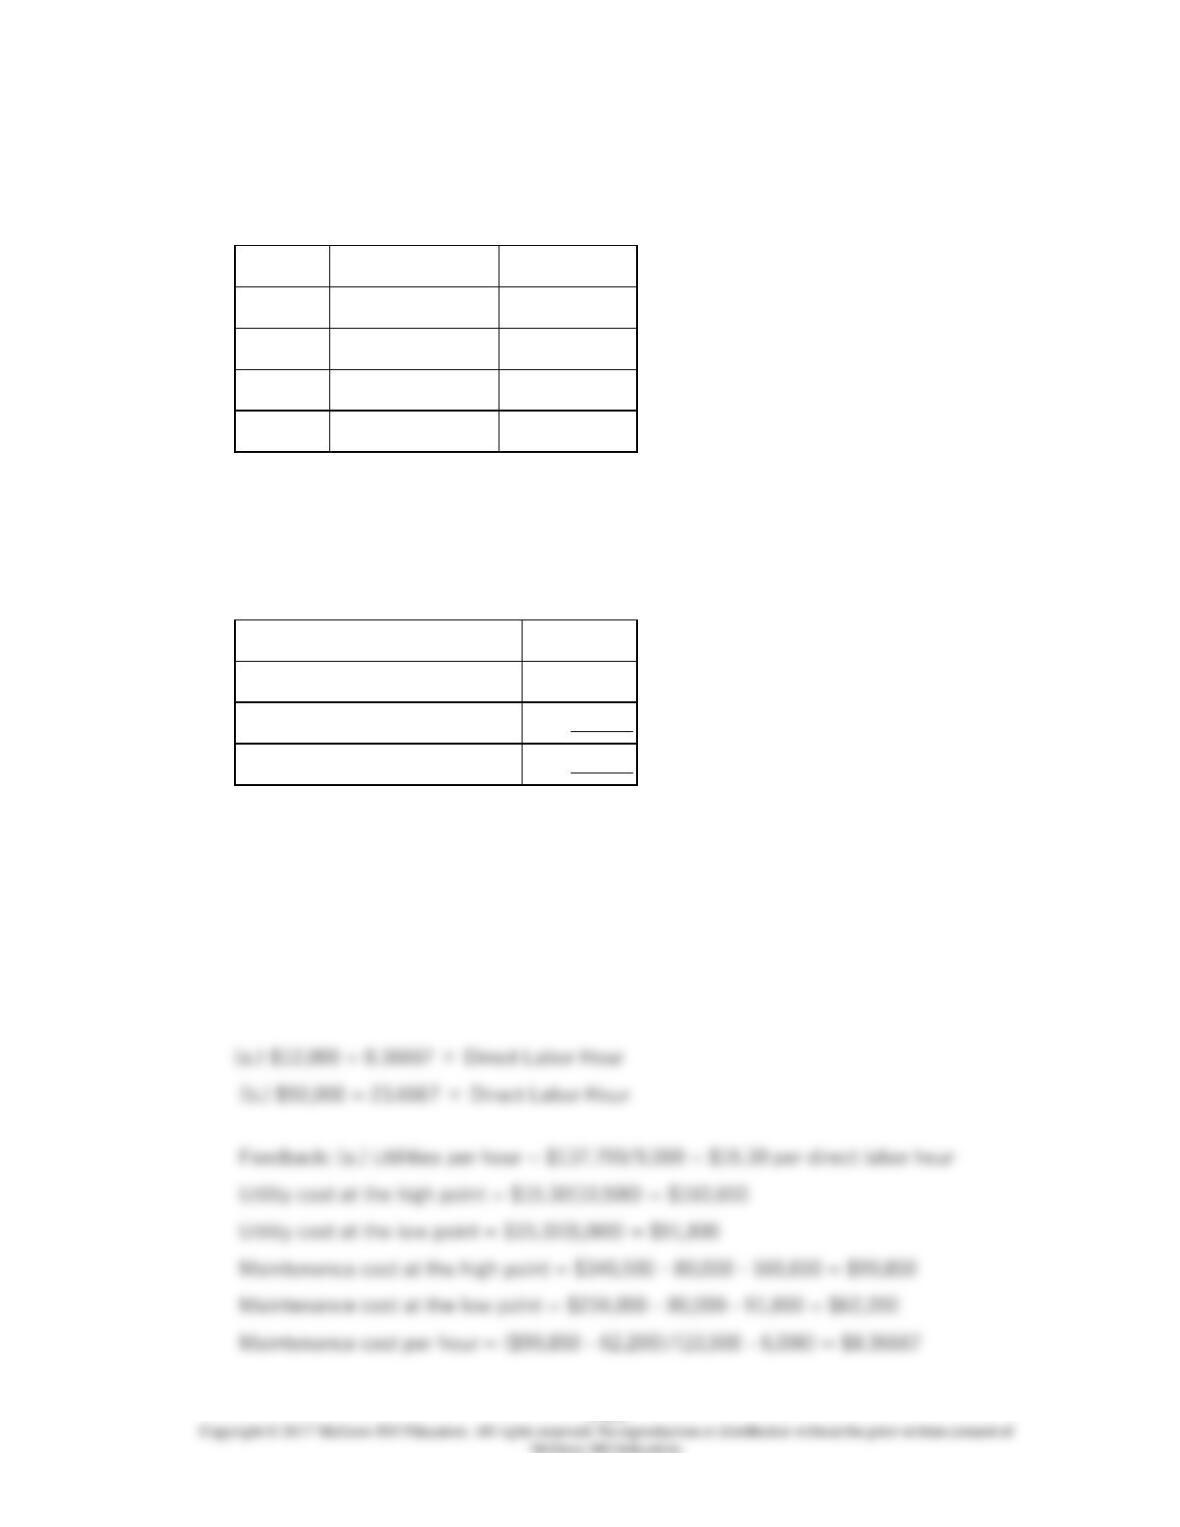
The Thomas Company’s total overhead costs at various levels of activity are presented
below:
Month
Direct Labor Hours
Total Overhead
July
7,500
$272,000
August
6,000
234,000
September
9,000
319,000
October
10,500
340,500
Assume that the overhead costs above consist of utilities, supervisory salaries, and
maintenance. The breakdown of these costs at the 9,000 direct labor hour level of activity
is as follows:
Utilities (V)
$137,700
Supervisory Salaries (F)
80,000
Maintenance (M)
101,300
319,000
5-112
100.
The Feline Company has been having some difficulties estimating its manufacturing
overhead costs. In the past, manufacturing overhead costs have been related to
production levels. However, some production managers have indicated that the size of
their production lots might also be having an impact on the amount of their monthly
manufacturing overhead costs. In order to investigate this possibility, the company
collected information on its monthly manufacturing overhead costs, production in units,
and average production lot size for 2016.
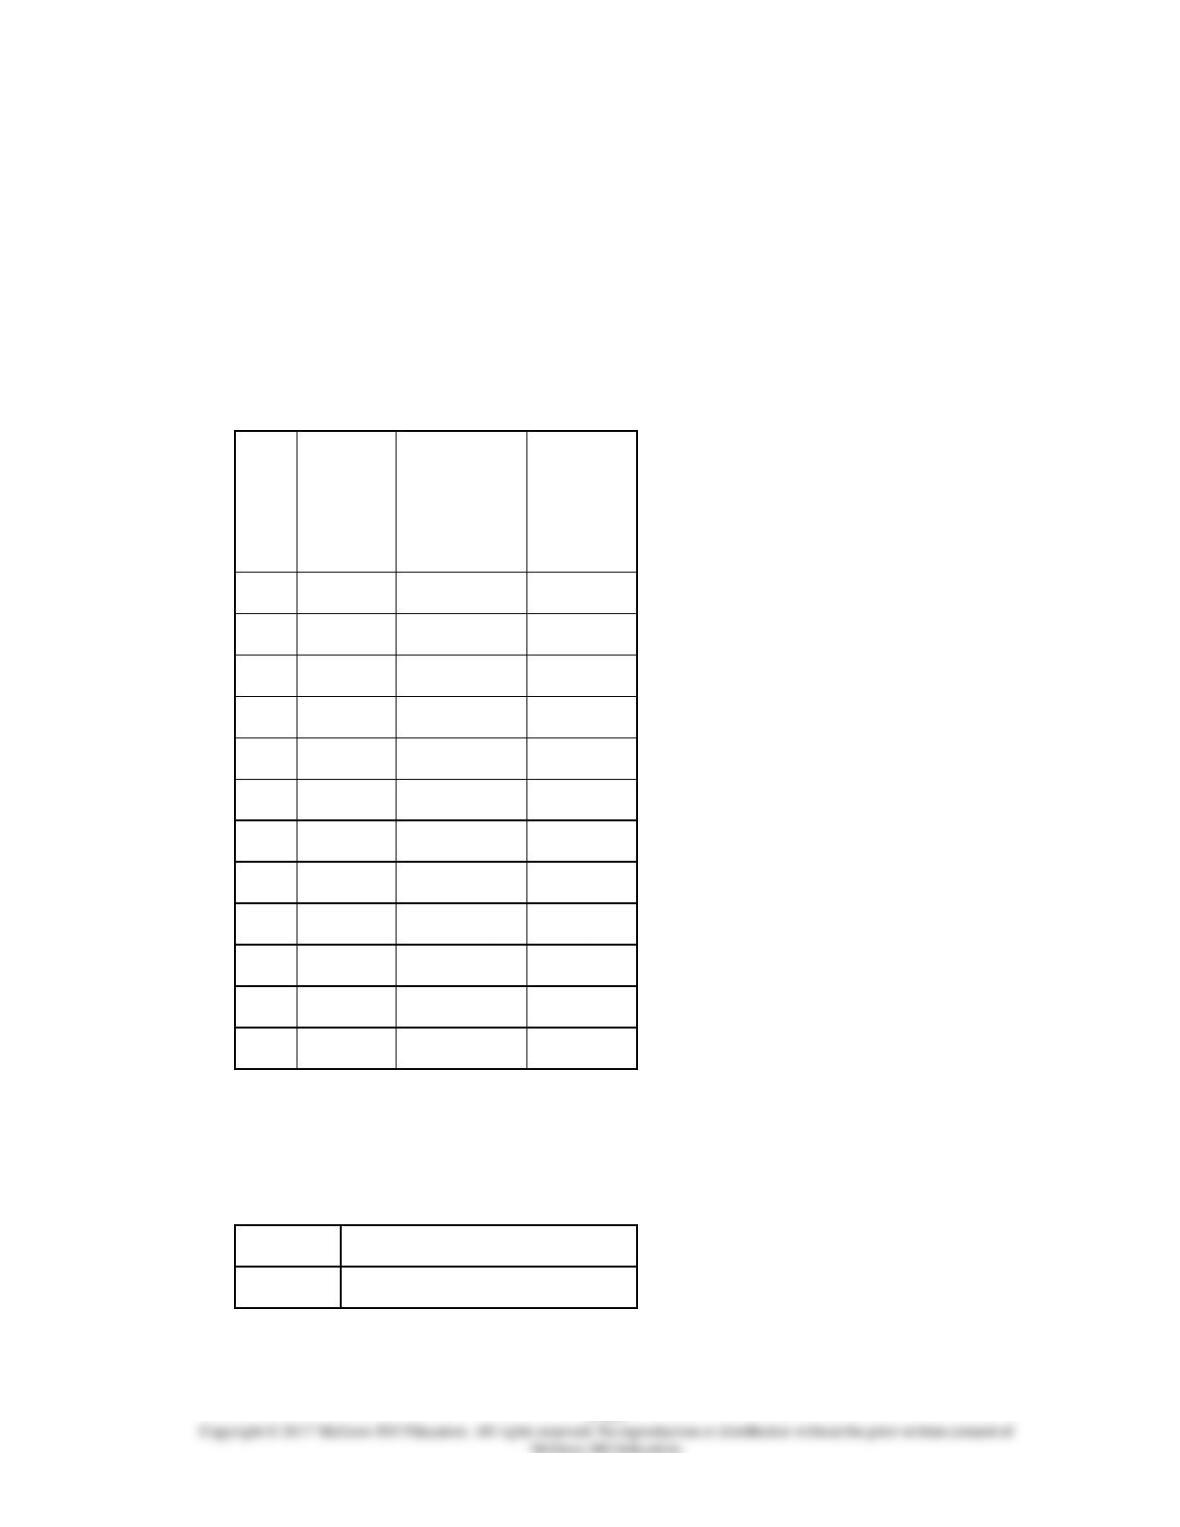
Month
Production
(Units)
Manufacturing
Overhead
Cost
Average
Monthly
Production
Lot Size
1
75,000
$925,800
20
2
90,000
843,875
19
3
65,000
910,125
24
4
80,000
946,000
19
5
55,000
879,000
24
6
50,000
825,000
18
7
85,000
960,000
22
8
105,000
1,053,500
25
9
102,000
1,020,000
23
10
68,000
905,000
20
11
75,000
938,000
22
12
95,000
995,000
24
Required:
(a.) Use the high-low method to estimate next month’s manufacturing overhead costs,
assuming the company is planning to produce 92,000 units.
(b.) Use the high-low method to estimate next month’s manufacturing overhead costs,
assuming the company is planning to run a 21-lot size.
101.
Argo Company ran a regression analysis using direct labor hours as the independent
variable and manufacturing overhead costs as the dependent variable. The results are
summarized below:
Intercept
$14,600
Slope
$12.55
Correlation coefficient
.931
R-squared
.867
5-115
102.
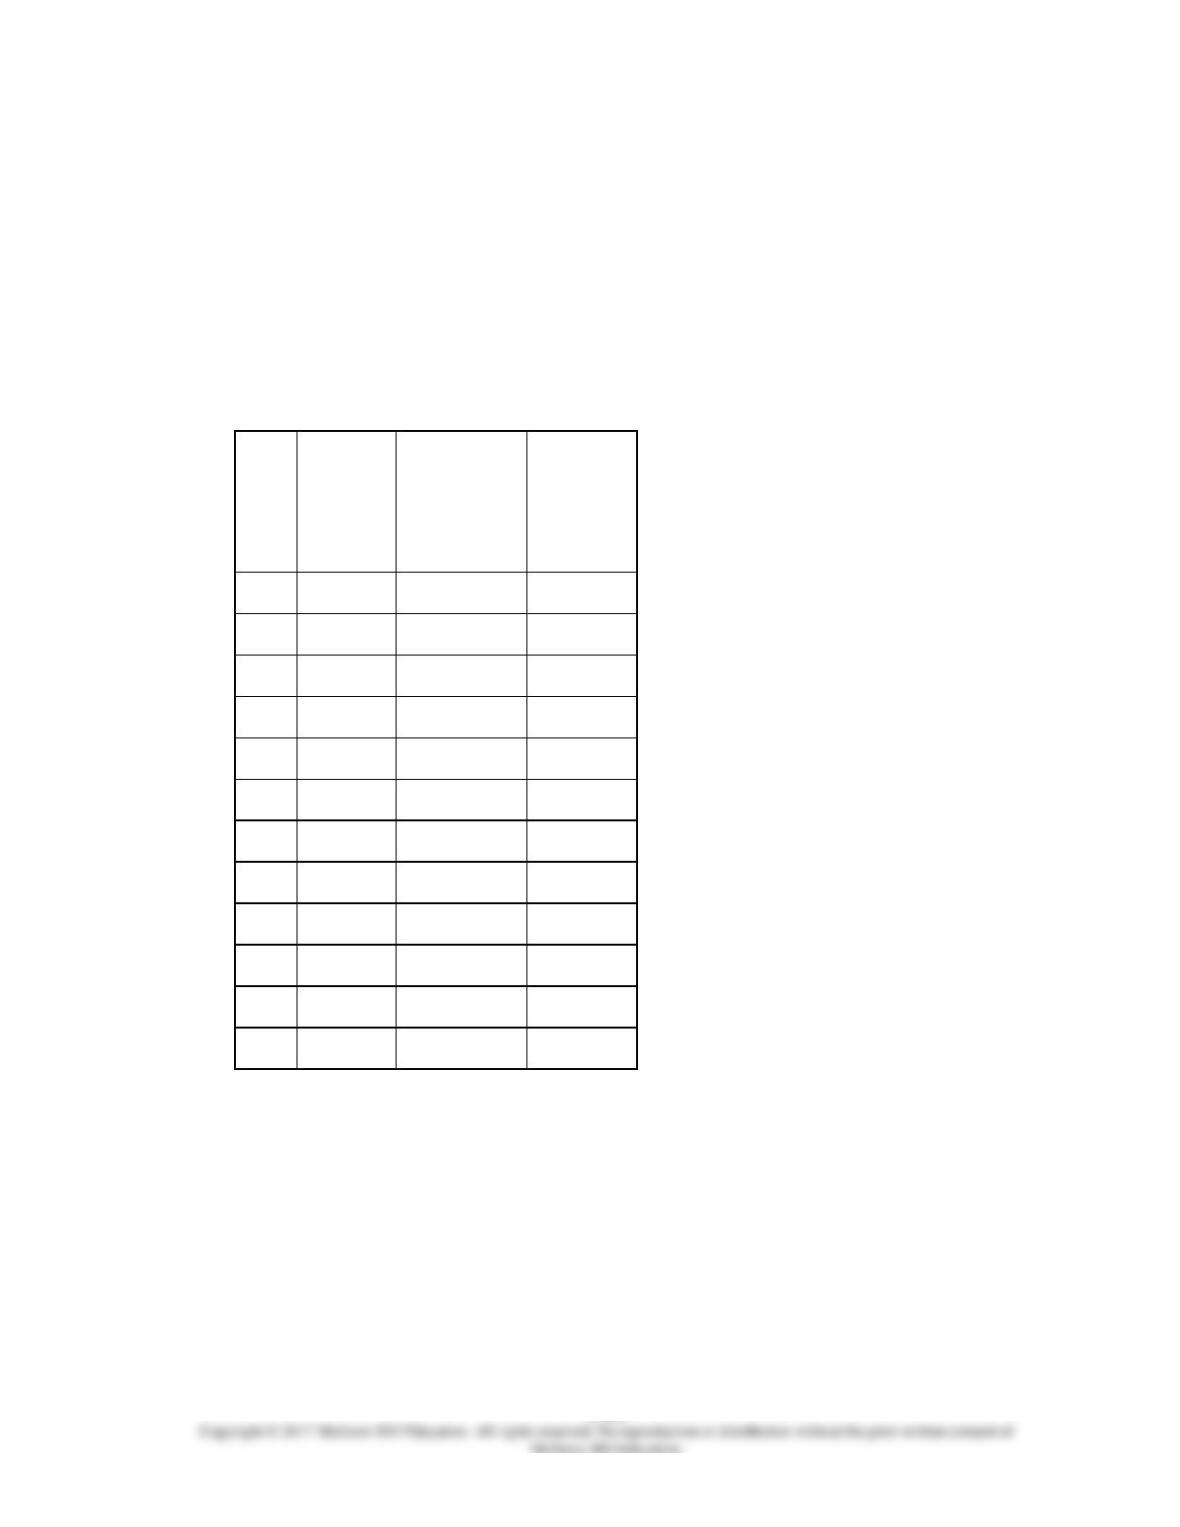
The Feline Company has been having some difficulties estimating its manufacturing
overhead costs. In the past, manufacturing overhead costs have been related to
production levels. However, some production managers have indicated that the size of
their production lots might also be having an impact on the amount of their monthly
manufacturing overhead costs. In order to investigate this possibility, the company
collected information on its monthly manufacturing overhead costs, production in units,
and average production lot size for 2016.
Month
Production
(Units)
Manufacturing
Overhead
Cost
Average
Monthly
Production
Lot Size
1
75,000
$925,800
20
2
90,000
843,875
19
3
65,000
910,125
24
4
80,000
946,000
19
5
55,000
879,000
24
6
50,000
825,000
18
7
85,000
960,000
22
8
105,000
1,053,500
25
9
102,000
1,020,000
23
10
68,000
905,000
20
11
75,000
938,000
22
12
95,000
995,000
24
Regression analysis results of the information presented above are as follows:
Ordinary
regression:
Equation:
$691,741 + $3.0692 × units
r-square:
.628
Multiple
regression:
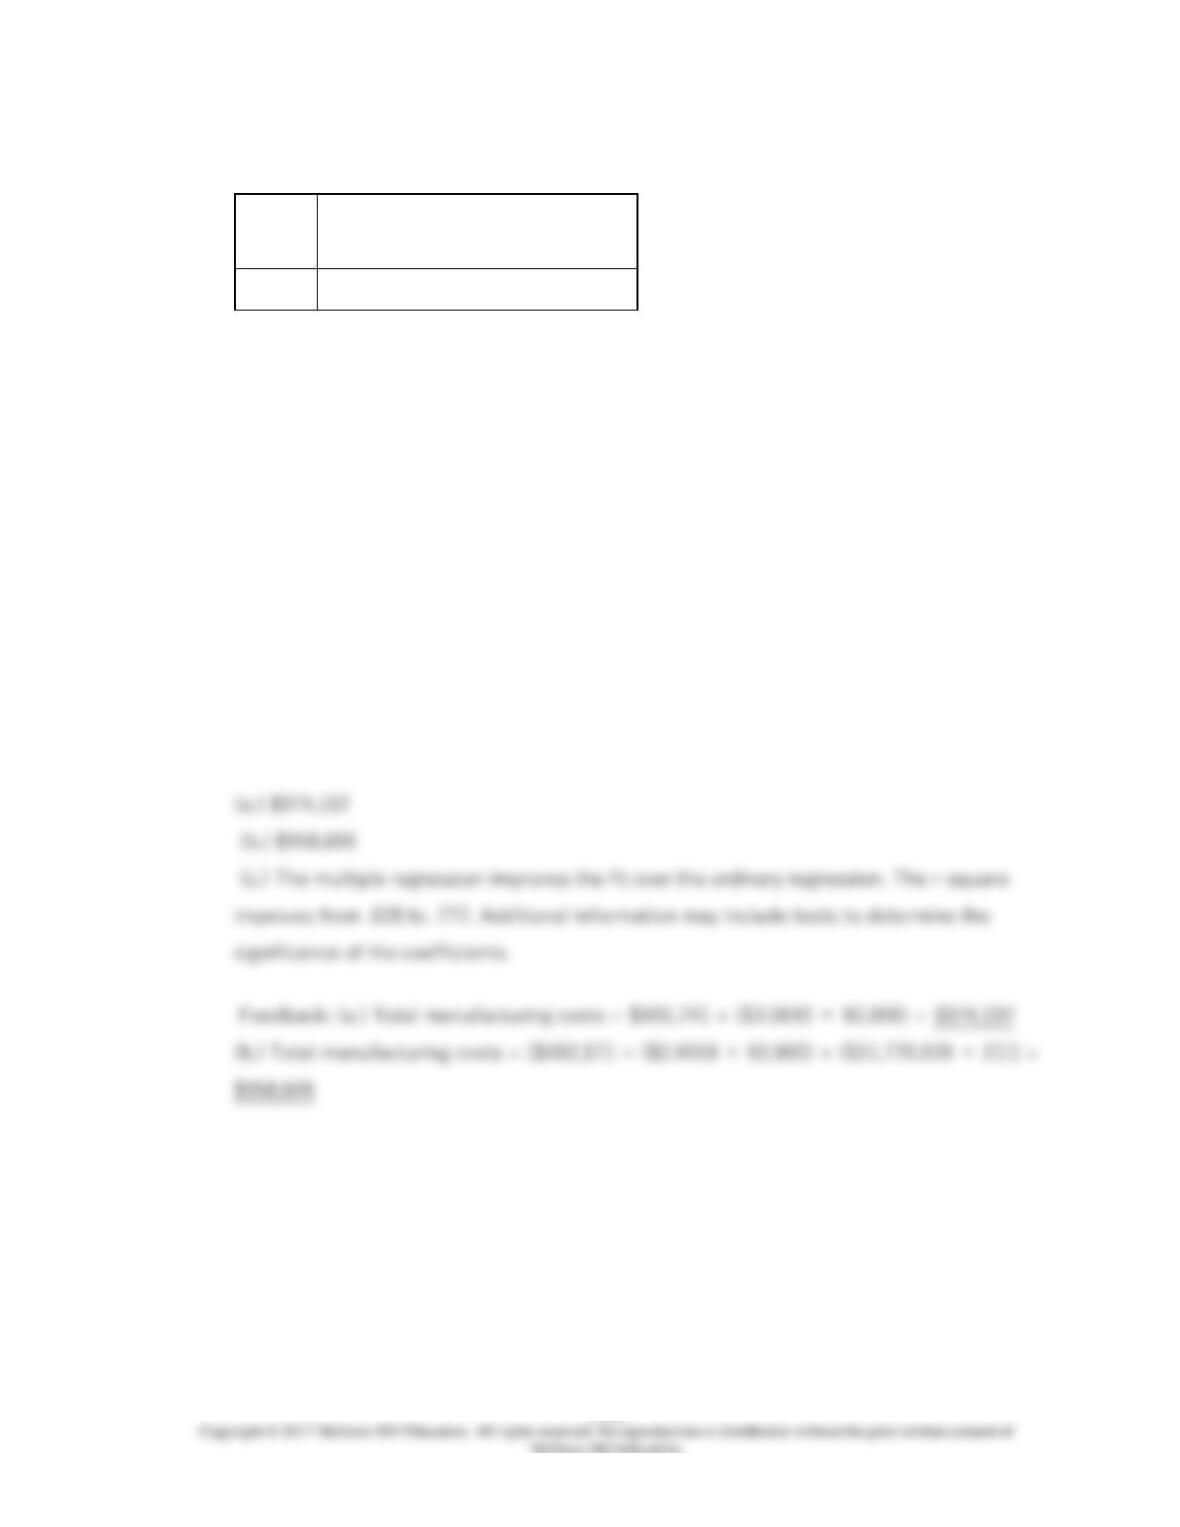
5-116
Equation:
$482,172 + $2.4918 × units +
$11,770.939 × lot size
r-square:
.777
103.
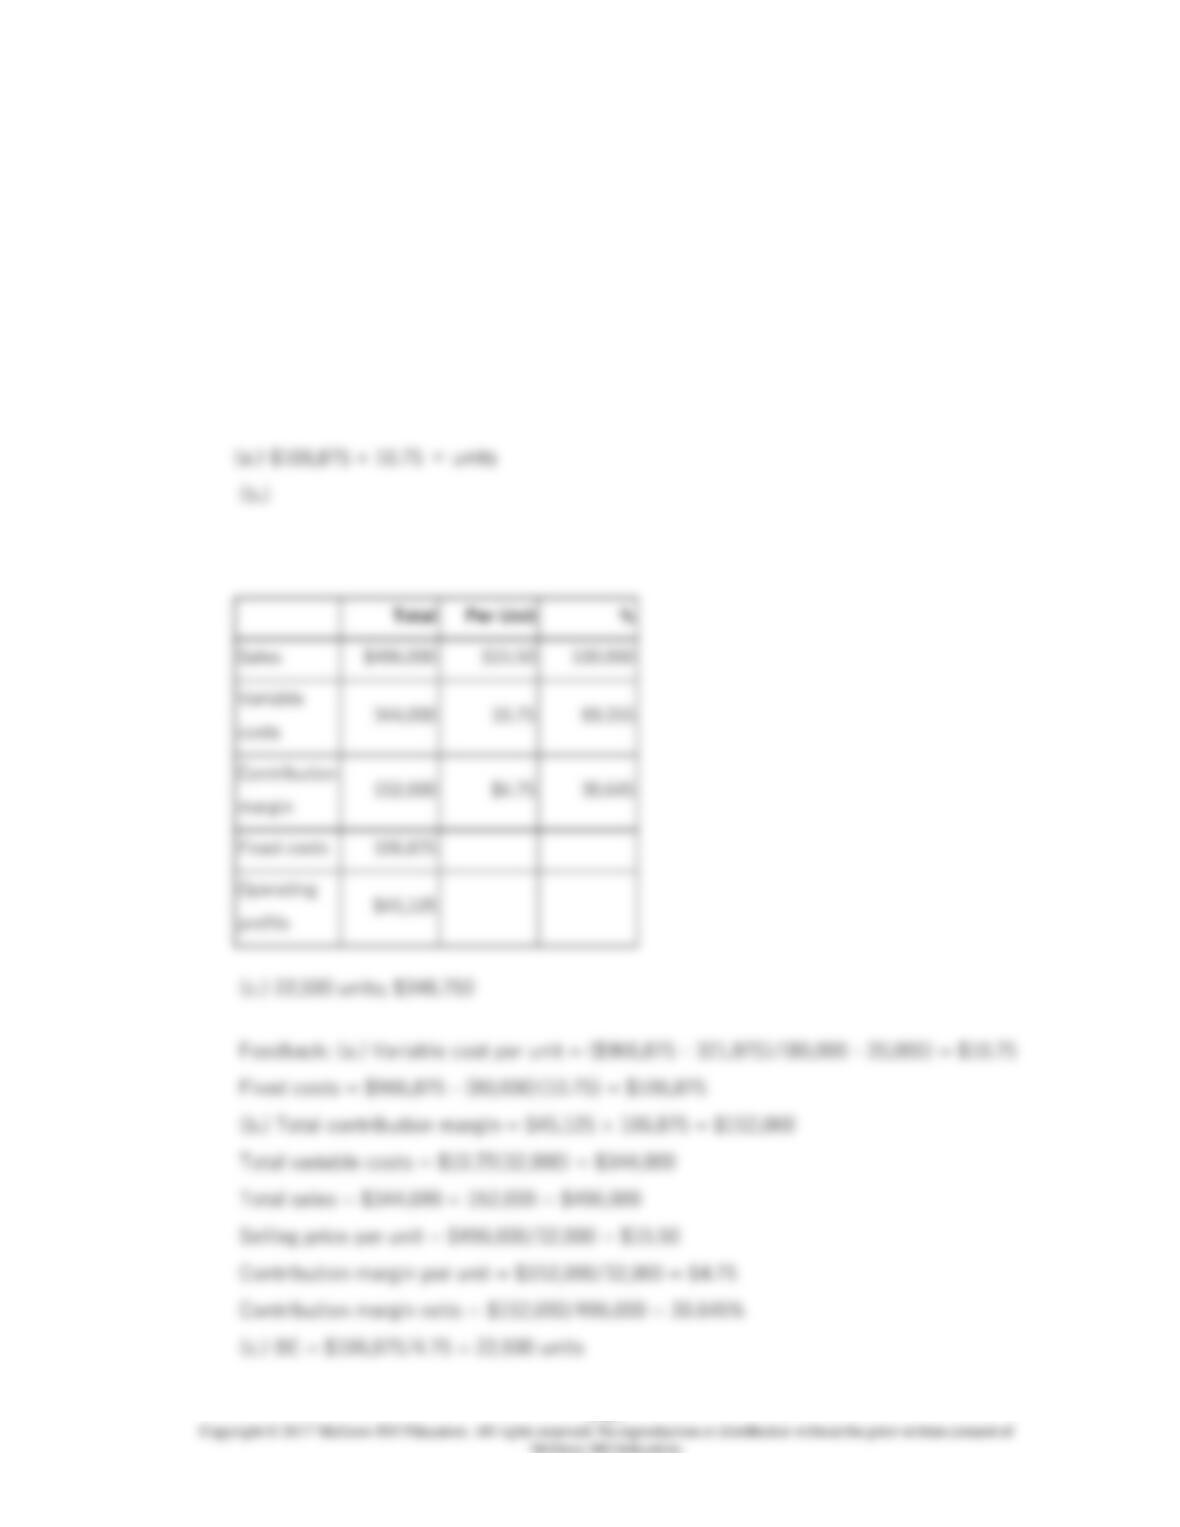
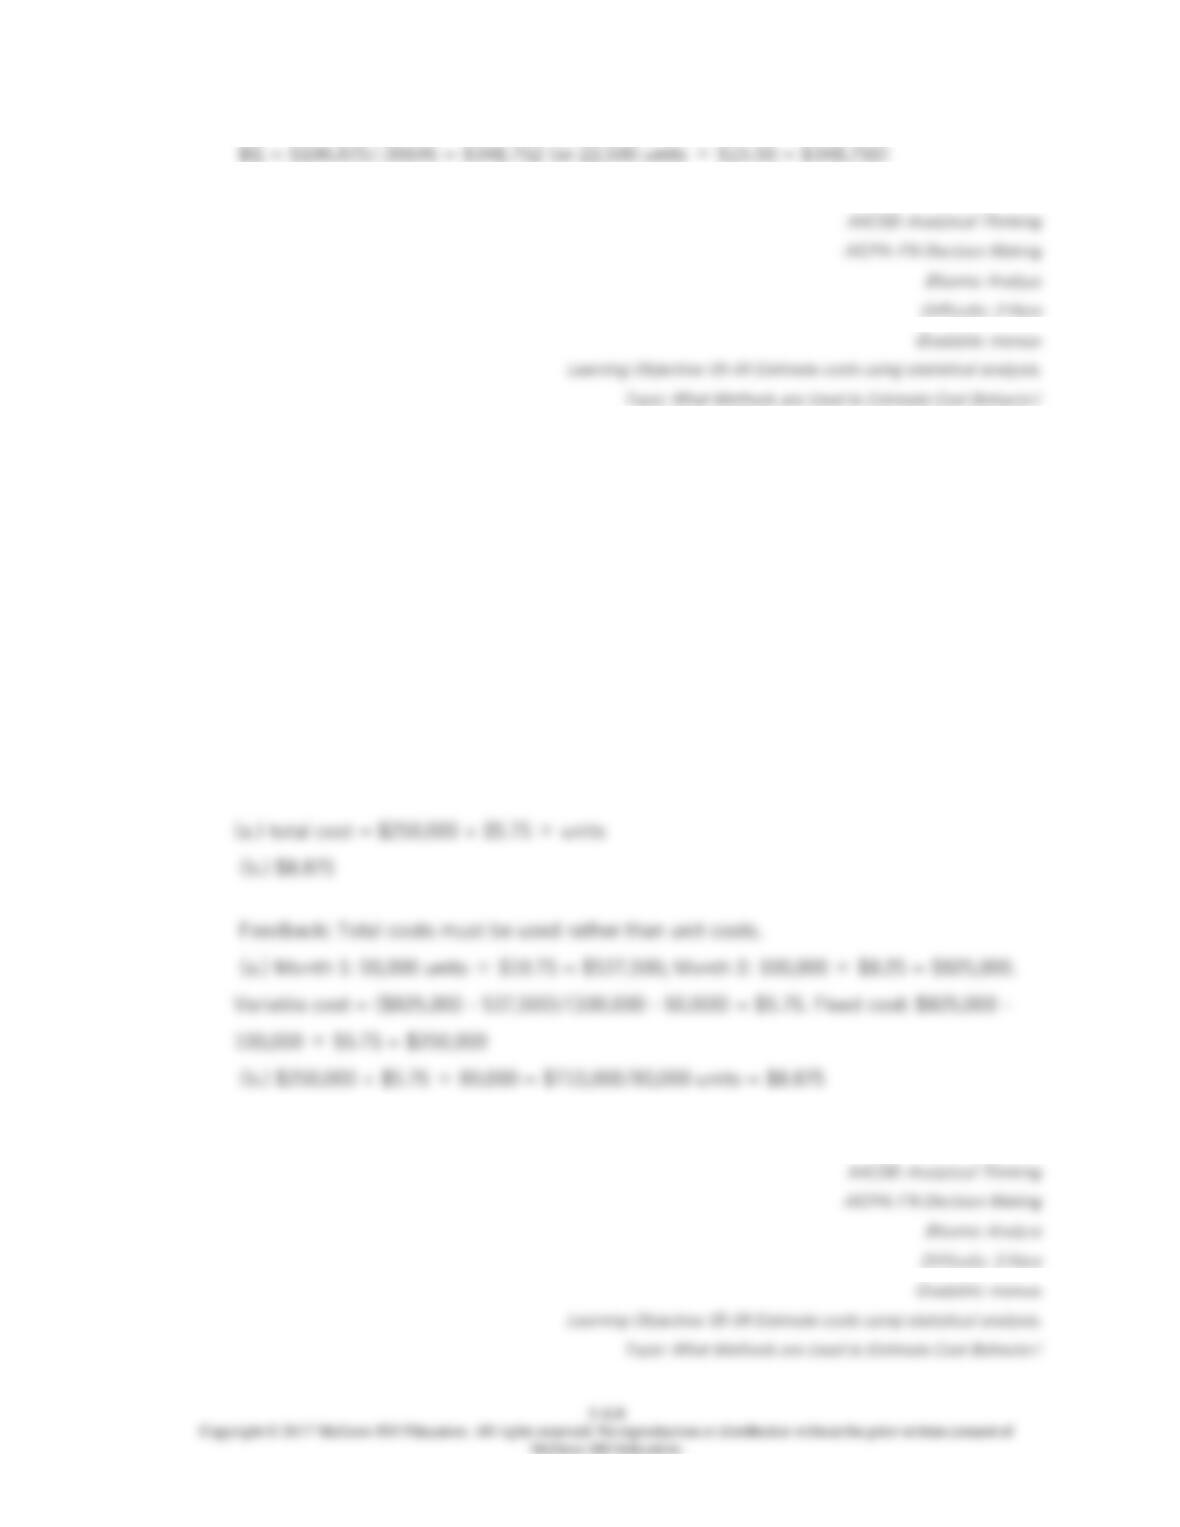
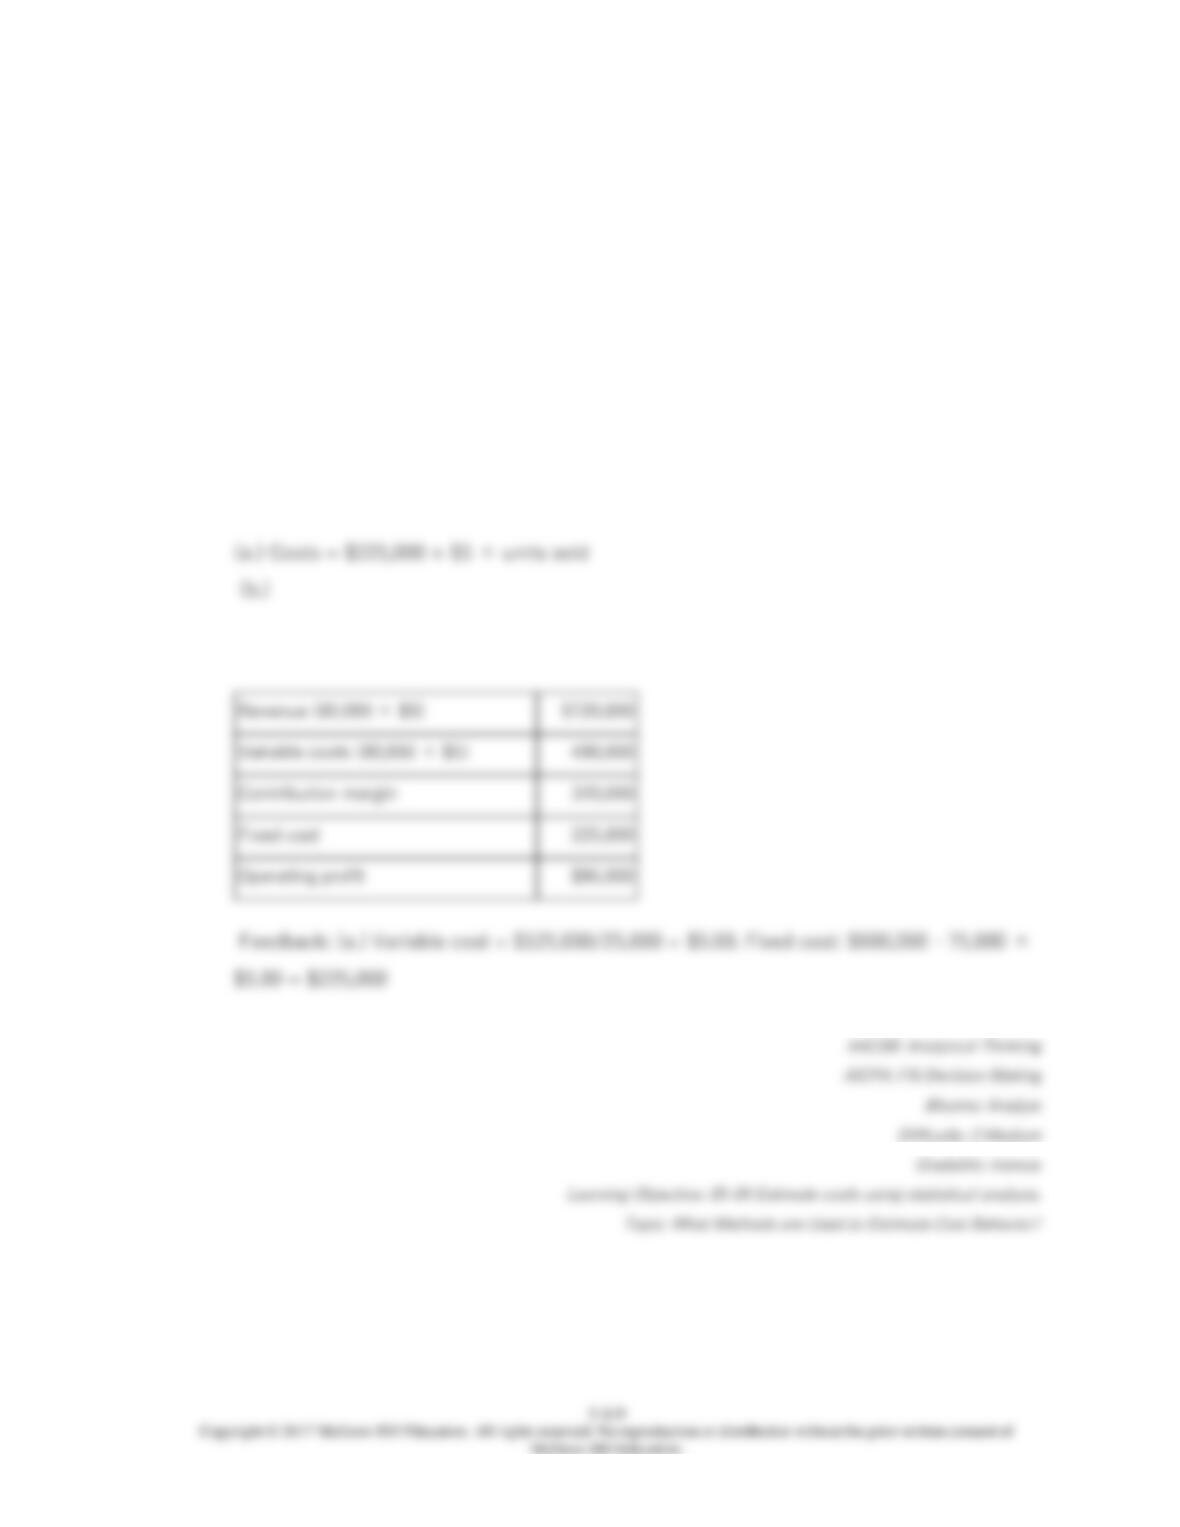
The Ornate Company produces a single product and has total costs ranging from $321,875
(at 20,000 units) to $966,875 (at 80,000 units). Sales volume in 2016 was 32,000, and
operating income was $45,125. Ornate’s product is highly specialized; therefore, no units
are kept in inventory.
5-117
104.
105.
106.