
5-41
54.
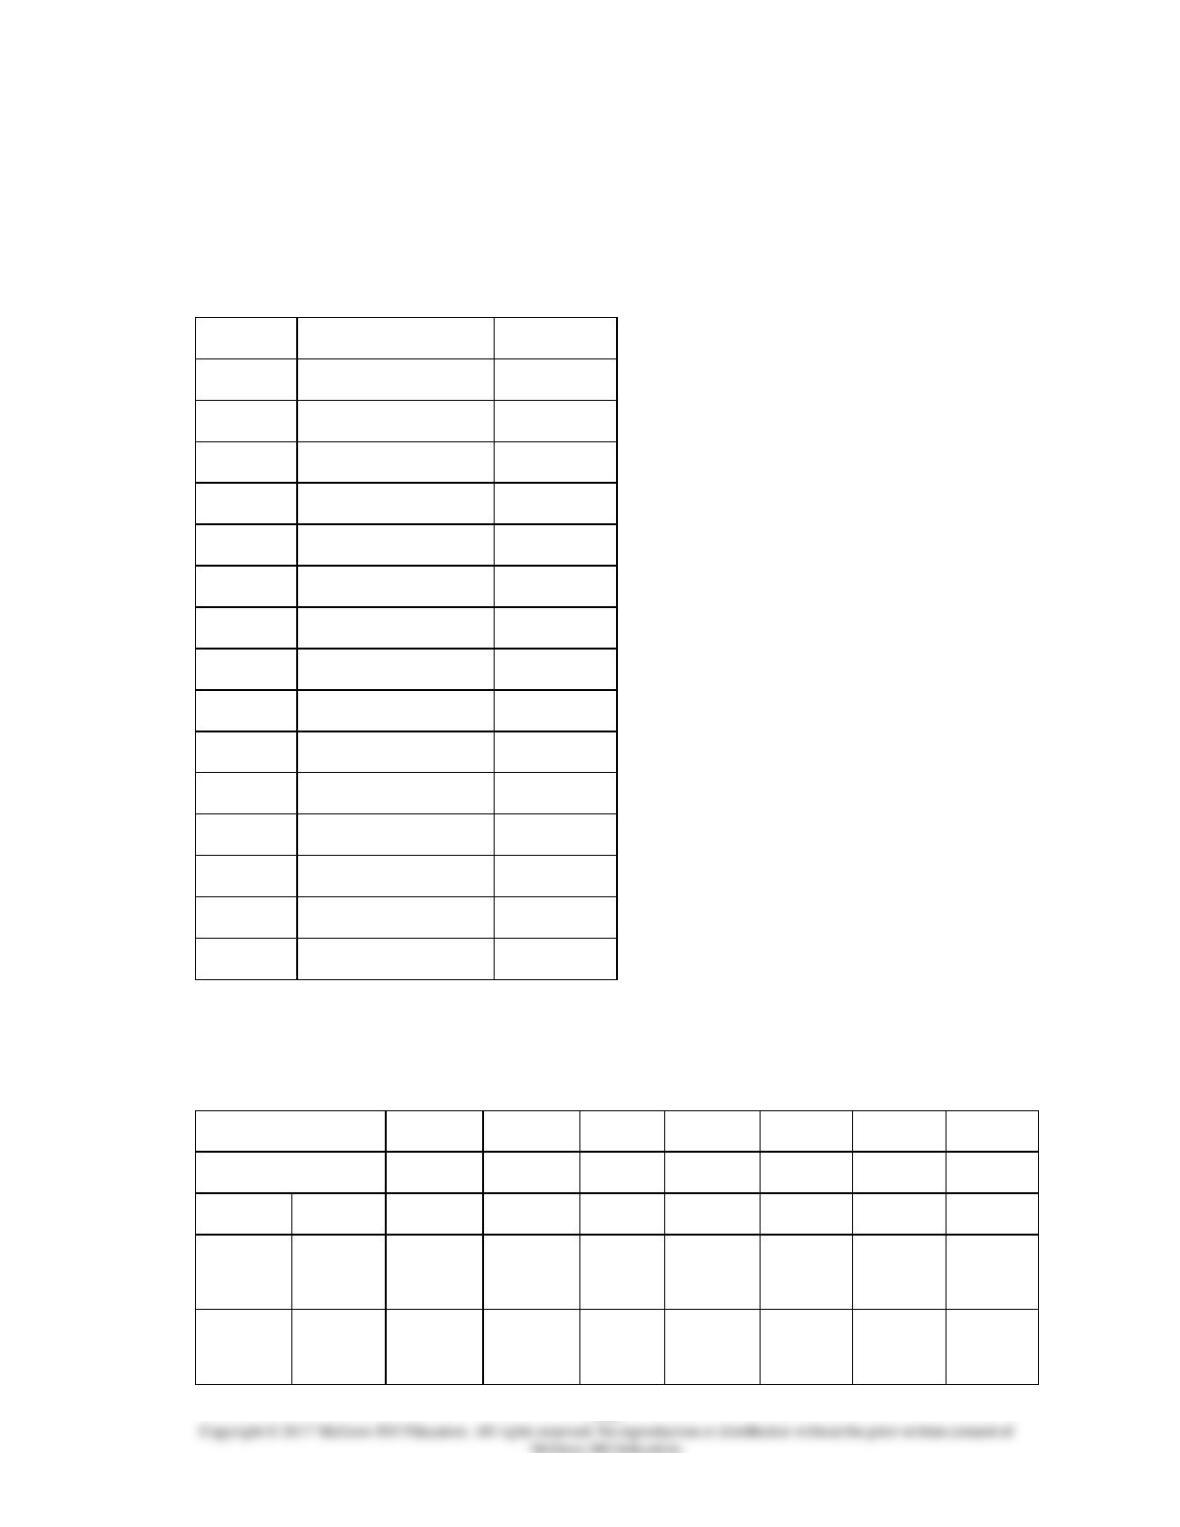
The McGraw Company is accumulating data to be used in preparing its annual profit plan
for the coming year. The cost behavior pattern of the maintenance costs must be
determined. The accounting staff has suggested that linear regression be employed to
derive an equation in the form of y = a + bx for maintenance costs. Data regarding the
maintenance hours and costs for last year and the results of the regression analysis are as
follows: (CMA adapted)
Hours of
Activity
Maintenance
Costs
January
480
$4,200
February
320
3,000
March
400
3,600
April
300
2,820
May
500
4,350
June
310
2,960
July
320
3,030
August
520
4,470
September
490
4,260
October
470
4,050
November
350
3,300
December
340
3,160
Sum
4,800
$43,200
Average
400
3,600
A coefficient
684.65
B coefficient
7.2884
Standard error of
the a coefficient
49.515
Standard error of
the b coefficient
.12126
Standard error of
the estimate
34.469
R2
.99724
T-value a
13.827
T-value b
60.105
5-43
55.
The McGraw Company is accumulating data to be used in preparing its annual profit plan
for the coming year. The cost behavior pattern of the maintenance costs must be
determined. The accounting staff has suggested that linear regression be employed to
derive an equation in the form of y = a + bx for maintenance costs. Data regarding the
maintenance hours and costs for last year and the results of the regression analysis are as
follows: (CMA adapted)
Hours of
Activity
Maintenance
Costs
January
480
$4,200
February
320
3,000
March
400
3,600
April
300
2,820
May
500
4,350
June
310
2,960
July
320
3,030
August
520
4,470
September
490
4,260
October
470
4,050
November
350
3,300
December
340
3,160
Sum
4,800
$43,200
Average
400
3,600
A coefficient
684.65
B coefficient
7.2884
Standard error of
the a coefficient
49.515
Standard error of
the b coefficient
.12126
Standard error of
the estimate
34.469
R2
.99724
T-value a
13.827
T-value b
60.105

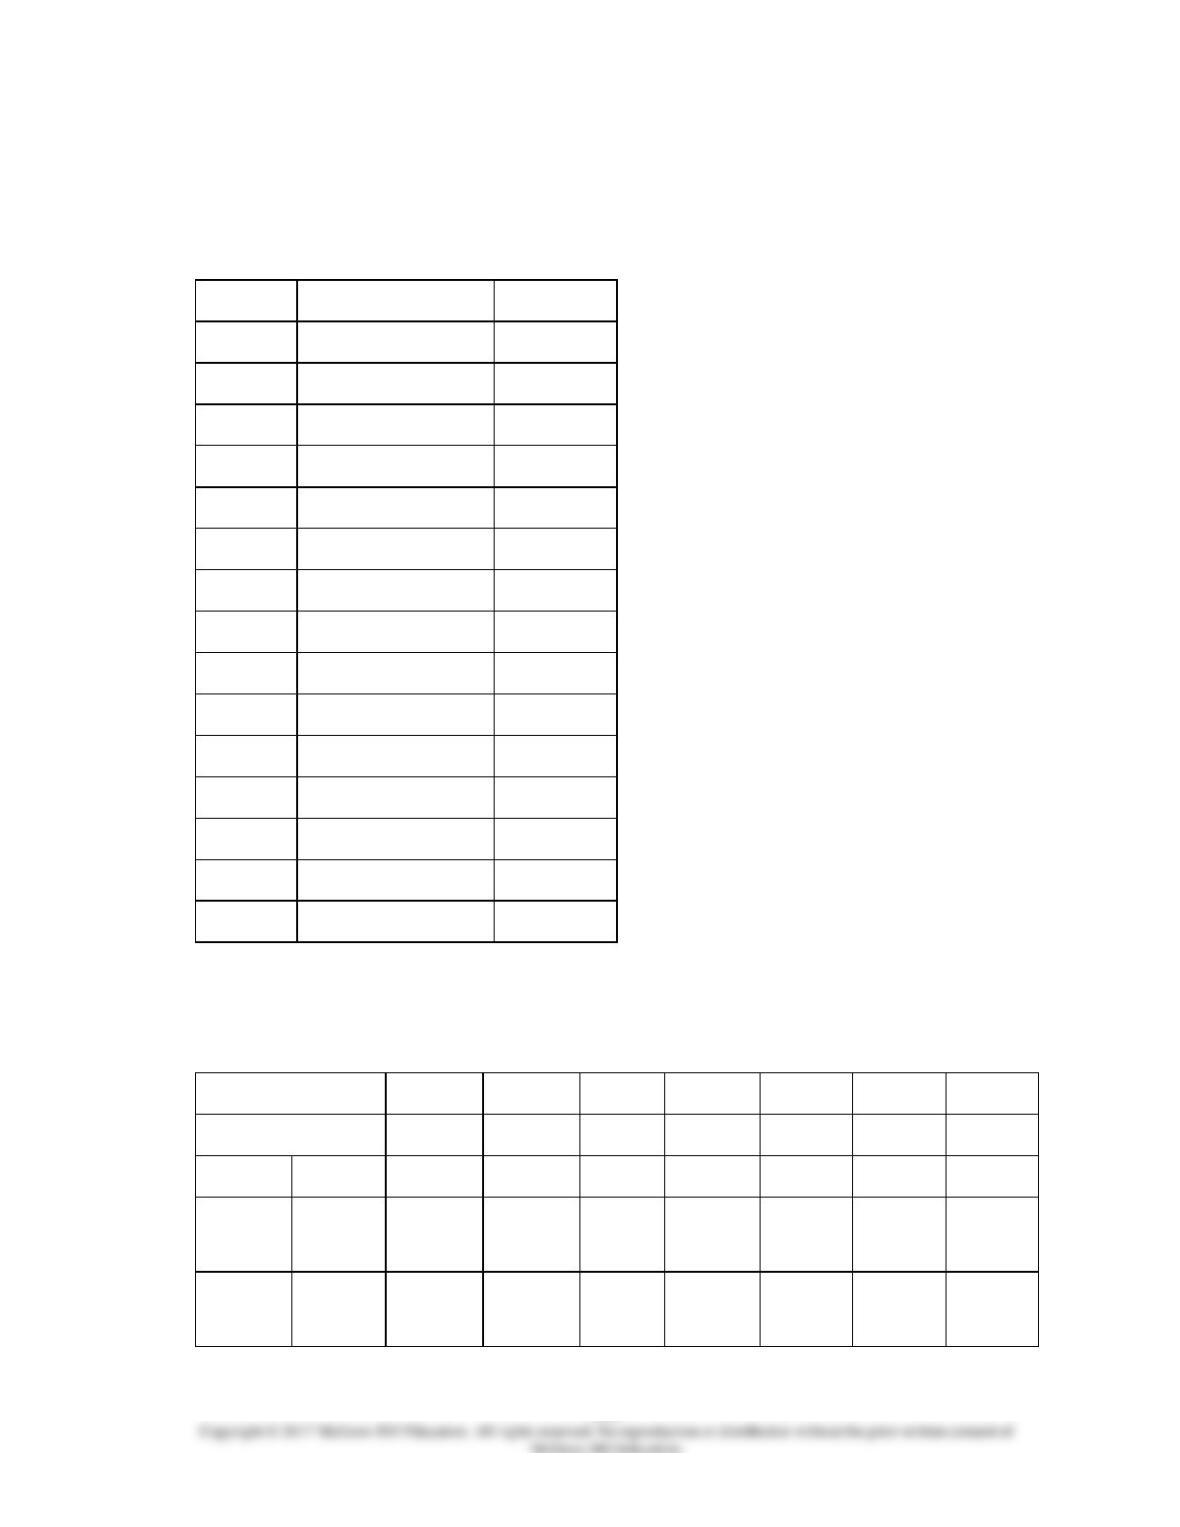
5-45
56.
The McGraw Company is accumulating data to be used in preparing its annual profit plan
for the coming year. The cost behavior pattern of the maintenance costs must be
determined. The accounting staff has suggested that linear regression be employed to
derive an equation in the form of y = a + bx for maintenance costs. Data regarding the
maintenance hours and costs for last year and the results of the regression analysis are as
follows: (CMA adapted)
Hours of
Activity
Maintenance
Costs
January
480
$4,200
February
320
3,000
March
400
3,600
April
300
2,820
May
500
4,350
June
310
2,960
July
320
3,030
August
520
4,470
September
490
4,260
October
470
4,050
November
350
3,300
December
340
3,160
Sum
4,800
$43,200
Average
400
3,600
A coefficient
684.65
B coefficient
7.2884
Standard error of
the a coefficient
49.515
Standard error of
the b coefficient
.12126
Standard error of
the estimate
34.469
R2
.99724
T-value a
13.827
T-value b
60.105

5-47
57.
The McGraw Company is accumulating data to be used in preparing its annual profit plan
for the coming year. The cost behavior pattern of the maintenance costs must be
determined. The accounting staff has suggested that linear regression be employed to
derive an equation in the form of y = a + bx for maintenance costs. Data regarding the
maintenance hours and costs for last year and the results of the regression analysis are as
follows: (CMA adapted)
Hours of
Activity
Maintenance
Costs
January
480
$4,200
February
320
3,000
March
400
3,600
April
300
2,820
May
500
4,350
June
310
2,960
July
320
3,030
August
520
4,470
September
490
4,260
October
470
4,050
November
350
3,300
December
340
3,160
Sum
4,800
$43,200
Average
400
3,600
A coefficient
684.65
B coefficient
7.2884
Standard error of
the a coefficient
49.515
Standard error of
the b coefficient
.12126
Standard error of
the estimate
34.469
R2
.99724
T-value a
13.827
T-value b
60.105
5-49
58
.
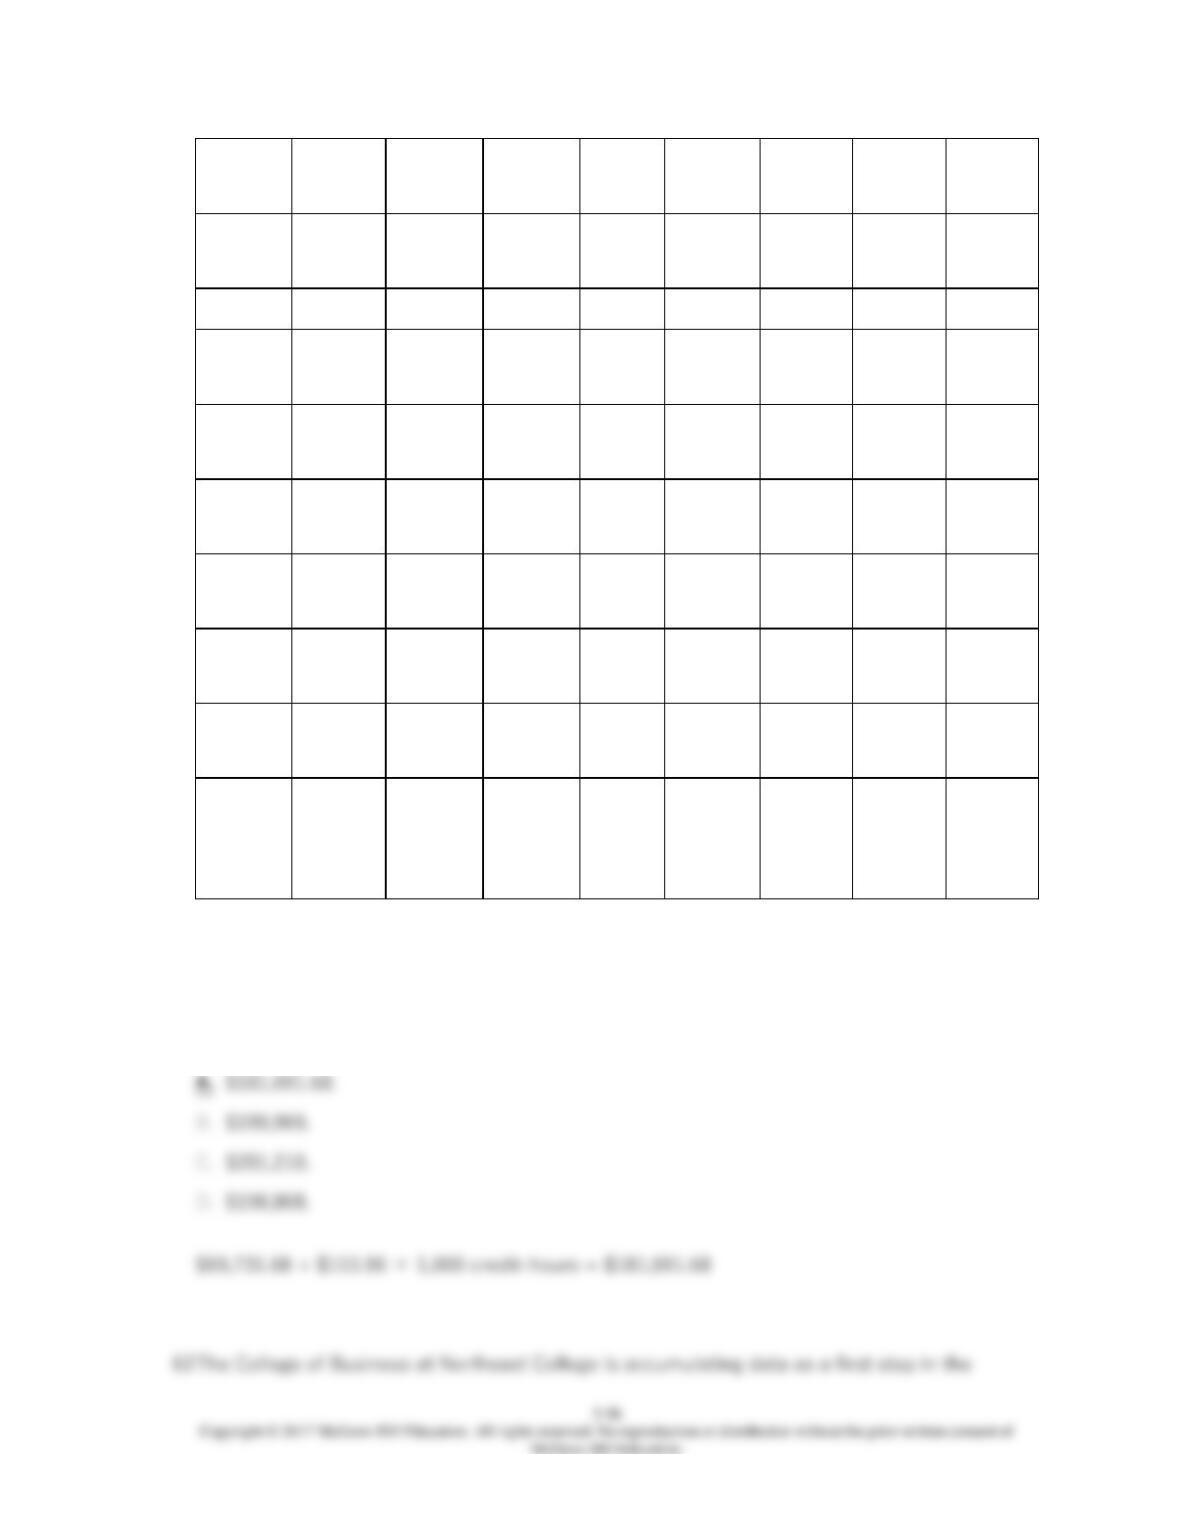
The College of Business at Northeast College is accumulating data as a first step in the
preparation of next year’s budget development. One cost that is being looked at closely is
administrative costs as a function of student credit hours. Data on administrative costs and
credit hours for the past thirteen months are shown below:
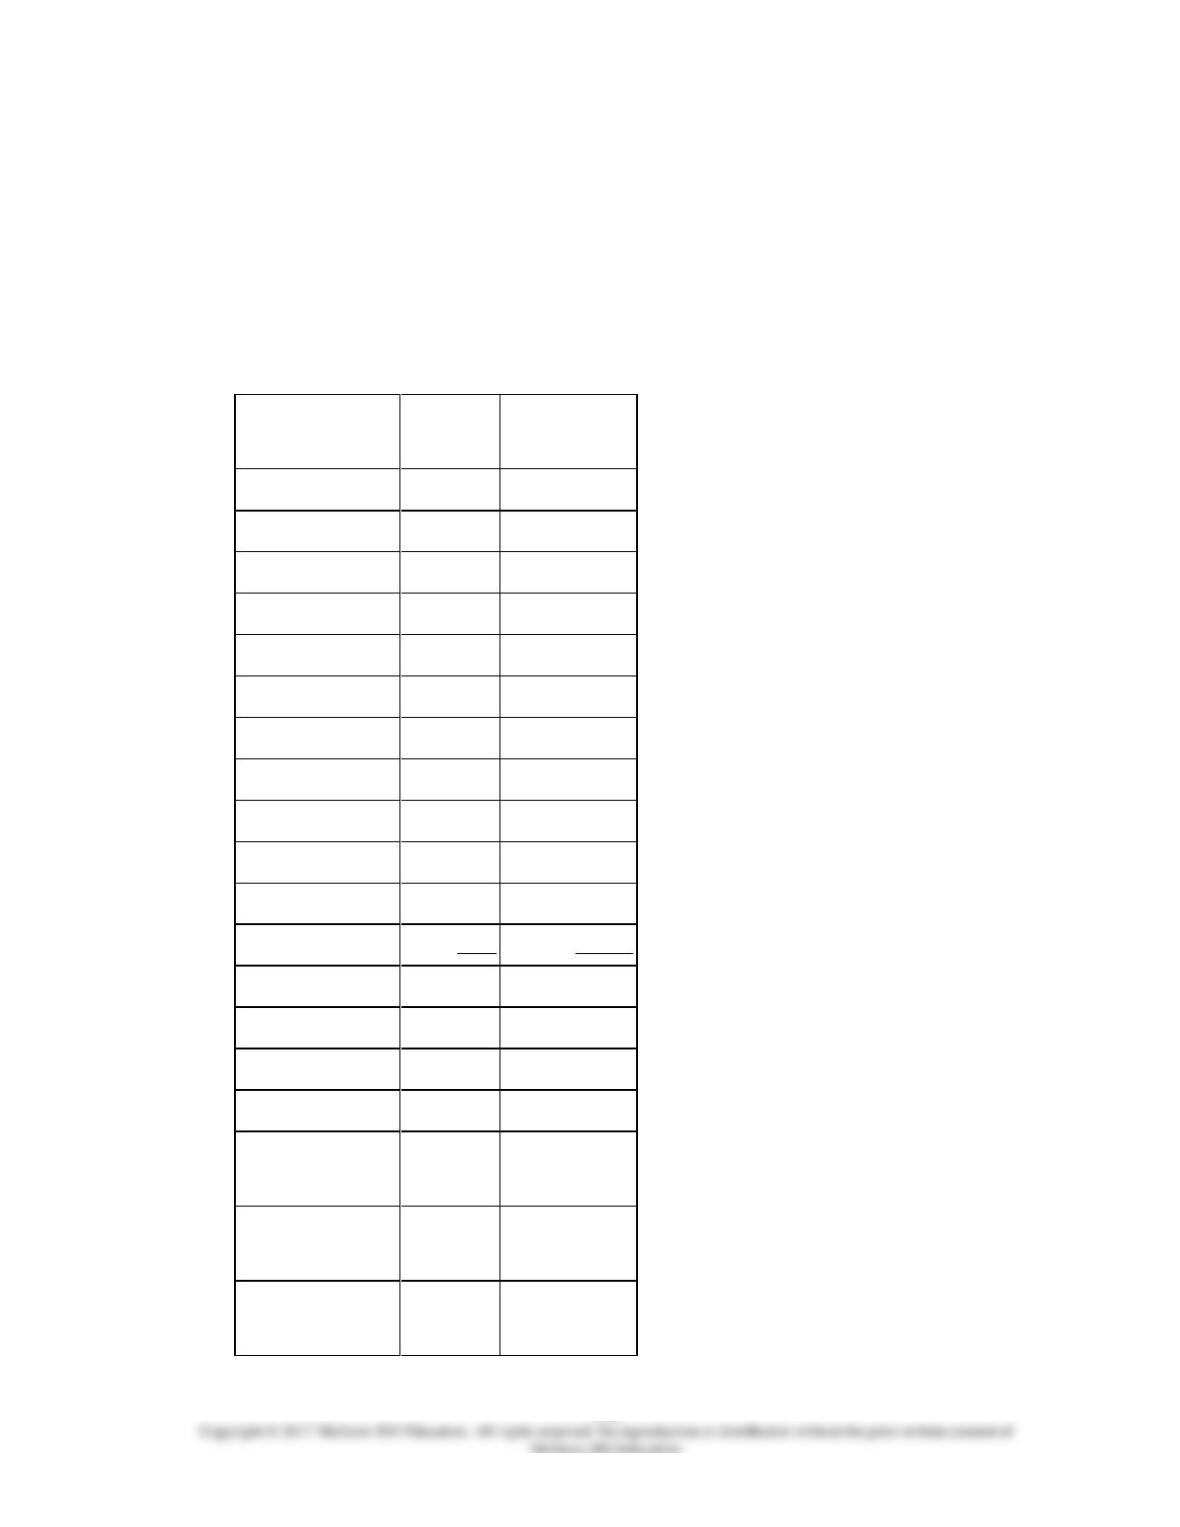
Month
Administrative Costs
Credit Hours
July
$129,301
250
August
82,613
115
September
225,580
1,392
October
216,394
1,000
November
258,263
1,309
December
184,449
1,112
January
219,137
1,339
February
245,000
1,373
March
209,462
1,064
April
191,925
1,123
May
249,978
1,360
June
170,418
420
July
128,167
315
Total
$2,510,687
12,172
Average
$193,130
936
The controller’s office has analyzed the data and has given you the results from the regression
analysis:
SUMMARY OUTPUT
Repression Statistics
Multiple R
0.9317157
R Square
0.8680941
47
Adjusted R
0.8561027

Square
05
Standard
Error
20134.923
95
Observatio
ns
13
ANOVA
df
SS
MS
F
Significanc
e F
Regressio
n
1
293491435
14
293491435
14
72.39281
17
3.61909E-06
Residual
11
445956678
7
405415162
.4
Total
12
338087103
01
Coefficie
nts
Standard
Error
t Stat
P-value
Lower 95%
Upper
95%
Lower
95.0%
Upper
95.0%
Intercept
96647.023
98
12641.665
39
7.6451180
3
1.00291E
–05
68822.9060
8
124471.14
19
68822.906
08
124471.14
19
X Variable
1
103.06076
97
12.112831
03
8.5083965
41
3.61909E
–06
76.4006083
3
129.72093
1
76.400608
33
129.72093
1
If the controller uses the high-low method to estimate costs, the variable cost per credit hour
is:
5-51
59
.
The College of Business at Northeast College is accumulating data as a first step in the
preparation of next year’s budget development. One cost that is being looked at closely is
administrative costs as a function of student credit hours. Data on administrative costs and
credit hours for the past thirteen months are shown below:
Month
Administrative Costs
Credit Hours
July
$129,301
250
August
82,613
115
September
225,580
1,392
October
216,394
1,000
November
258,263
1,309
December
184,449
1,112
January
219,137
1,339
February
245,000
1,373
March
209,462
1,064
April
191,925
1,123
May
249,978
1,360
June
170,418
420
July
128,167
315
Total
$2,510,687
12,172
Average
$193,130
936
The controller’s office has analyzed the data and has given you the results from the regression
analysis:
SUMMARY OUTPUT
Repression Statistics
Multiple R
0.9317157
R Square
0.8680941
47
Adjusted R
Square
0.8561027
05
Standard
Error
20134.923
95
Observatio
ns
13
ANOVA
df
SS
MS
F
Significanc
e F
Regressio
n
1
293491435
14
293491435
14
72.39281
17
3.61909E-06
Residual
11
445956678
7
405415162
.4
Total
12
338087103
01
Coefficie
nts
Standard
Error
t Stat
P-value
Lower 95%
Upper
95%
Lower
95.0%
Upper
95.0%
Intercept
96647.023
98
12641.665
39
7.6451180
3
1.00291E
–05
68822.9060
8
124471.14
19
68822.906
08
124471.14
19
X Variable
1
103.06076
97
12.112831
03
8.5083965
41
3.61909E
–06
76.4006083
3
129.72093
1
76.400608
33
129.72093
1
If the controller uses the high-low method to estimate costs, the fixed cost portion of the cost
equation for administrative salaries is:

5-53
60
.
The College of Business at Northeast College is accumulating data as a first step in the
preparation of next year’s budget development. One cost that is being looked at closely is
administrative costs as a function of student credit hours. Data on administrative costs and
credit hours for the past thirteen months are shown below:
Month
Administrative Costs
Credit Hours
July
$129,301
250
August
82,613
115
September
225,580
1,392
October
216,394
1,000
November
258,263
1,309
December
184,449
1,112
January
219,137
1,339
February
245,000
1,373
March
209,462
1,064
April
191,925
1,123
May
249,978
1,360
June
170,418
420
July
128,167
315
Total
$2,510,687
12,172
Average
$193,130
936
The controller’s office has analyzed the data and has given you the results from the regression
analysis:
SUMMARY OUTPUT
Repression Statistics
Multiple R
0.9317157
R Square
0.8680941
47
Adjusted R
Square
0.8561027
05

Standard
Error
20134.923
95
Observatio
ns
13
ANOVA
df
SS
MS
F
Significan
ce F
Regression
1
293491435
14
293491435
14
72.39281
17
3.61909E-
06
Residual
11
445956678
7
405415162
.4
Total
12
338087103
01
Coefficien
ts
Standard
Error
t Stat
P-value
Lower
95%
Upper
95%
Lower
95.0%
Upper
95.0%
Intercept
96647.023
98
12641.665
39
7.6451180
3
1.00291E
–05
68822.906
08
124471.14
19
68822.906
08
124471.14
19
X Variable
1
103.06076
97
12.112831
03
8.5083965
41
3.61909E
–06
76.400608
33
129.72093
1
76.400608
33
129.72093
1
If the controller uses the high-low method to estimate costs, the cost equation for
administrative salaries is:
5-55
61
.
The College of Business at Northeast College is accumulating data as a first step in the
preparation of next year’s budget development. One cost that is being looked at closely is
administrative costs as a function of student credit hours. Data on administrative costs and
credit hours for the past thirteen months are shown below:
Month
Administrative Costs
Credit Hours
July
$129,301
250
August
82,613
115
September
225,580
1,392
October
216,394
1,000
November
258,263
1,309
December
184,449
1,112
January
219,137
1,339
February
245,000
1,373
March
209,462
1,064
April
191,925
1,123
May
249,978
1,360
June
170,418
420
July
128,167
315
Total
$2,510,687
12,172
Average
$193,130
936
The controller’s office has analyzed the data and has given you the results from the regression
analysis:
SUMMARY OUTPUT
Repression Statistics
Multiple R
0.9317157
R Square
0.8680941
47
Adjusted R
Square
0.8561027
05
Standard
Error
20134.923
95
Observatio
ns
13
ANOVA
df
SS
MS
F
Significan
ce F
Regression
1
293491435
14
293491435
14
72.39281
17
3.61909E-
06
Residual
11
445956678
7
405415162
.4
Total
12
338087103
01
Coefficien
ts
Standard
Error
t Stat
P-value
Lower
95%
Upper
95%
Lower
95.0%
Upper
95.0%
Intercept
96647.023
98
12641.665
39
7.6451180
3
1.00291E
–05
68822.906
08
124471.14
19
68822.906
08
124471.14
19
X Variable
1
103.06076
97
12.112831
03
8.5083965
41
3.61909E
–06
76.400608
33
129.72093
1
76.400608
33
129.72093
1
Based on the results of the high-low analysis, the estimate of administrative costs in a month
with 1,000 credit hours would be: (rounded to the nearest whole dollar)
5-57
.
preparation of next year’s budget development. One cost that is being looked at closely is
administrative costs as a function of student credit hours. Data on administrative costs and
credit hours for the past thirteen months are shown below:
Month
Administrative Costs
Credit Hours
July
$129,301
250
August
82,613
115
September
225,580
1,392
October
216,394
1,000
November
258,263
1,309
December
184,449
1,112
January
219,137
1,339
February
245,000
1,373
March
209,462
1,064
April
191,925
1,123
May
249,978
1,360
June
170,418
420
July
128,167
315
Total
$2,510,687
12,172
Average
$193,130
936
The controller’s office has analyzed the data and has given you the results from the regression
analysis:
SUMMARY OUTPUT
Repression Statistics
Multiple R
0.9317157
R Square
0.8680941
47
Adjusted R
Square
0.8561027
05

5-58
Standard
Error
20134.923
95
Observatio
ns
13
ANOVA
df
SS
MS
F
Significan
ce F
Regression
1
293491435
14
293491435
14
72.39281
17
3.61909E-
06
Residual
11
445956678
7
405415162
.4
Total
12
338087103
01
Coefficien
ts
Standard
Error
t Stat
P-value
Lower
95%
Upper
95%
Lower
95.0%
Upper
95.0%
Intercept
96647.023
98
12641.665
39
7.6451180
3
1.00291E
–05
68822.906
08
124471.14
19
68822.906
08
124471.14
19
X Variable
1
103.06076
97
12.112831
03
8.5083965
41
3.61909E
–06
76.400608
33
129.72093
1
76.400608
33
129.72093
1
63
The College of Business at Northeast College is accumulating data as a first step in the

5-59
.
preparation of next year’s budget development. One cost that is being looked at closely is
administrative costs as a function of student credit hours. Data on administrative costs and
credit hours for the past thirteen months are shown below:
Month
Administrative Costs
Credit Hours
July
$129,301
250
August
82,613
115
September
225,580
1,392
October
216,394
1,000
November
258,263
1,309
December
184,449
1,112
January
219,137
1,339
February
245,000
1,373
March
209,462
1,064
April
191,925
1,123
May
249,978
1,360
June
170,418
420
July
128,167
315
Total
$2,510,687
12,172
Average
$193,130
936
The controller’s office has analyzed the data and has given you the results from the regression
analysis:
SUMMARY OUTPUT
Repression Statistics
Multiple R
0.9317157
R Square
0.8680941
47
Adjusted R
Square
0.8561027
05

5-60
Standard
Error
20134.923
95
Observatio
ns
13
ANOVA
df
SS
MS
F
Significan
ce F
Regression
1
293491435
14
293491435
14
72.39281
17
3.61909E-
06
Residual
11
445956678
7
405415162
.4
Total
12
338087103
01
Coefficien
ts
Standard
Error
t Stat
P-value
Lower
95%
Upper
95%
Lower
95.0%
Upper
95.0%
Intercept
96647.023
98
12641.665
39
7.6451180
3
1.00291E
–05
68822.906
08
124471.14
19
68822.906
08
124471.14
19
X Variable
1
103.06076
97
12.112831
03
8.5083965
41
3.61909E
–06
76.400608
33
129.72093
1
76.400608
33
129.72093
1
64
The College of Business at Northeast College is accumulating data as a first step in the