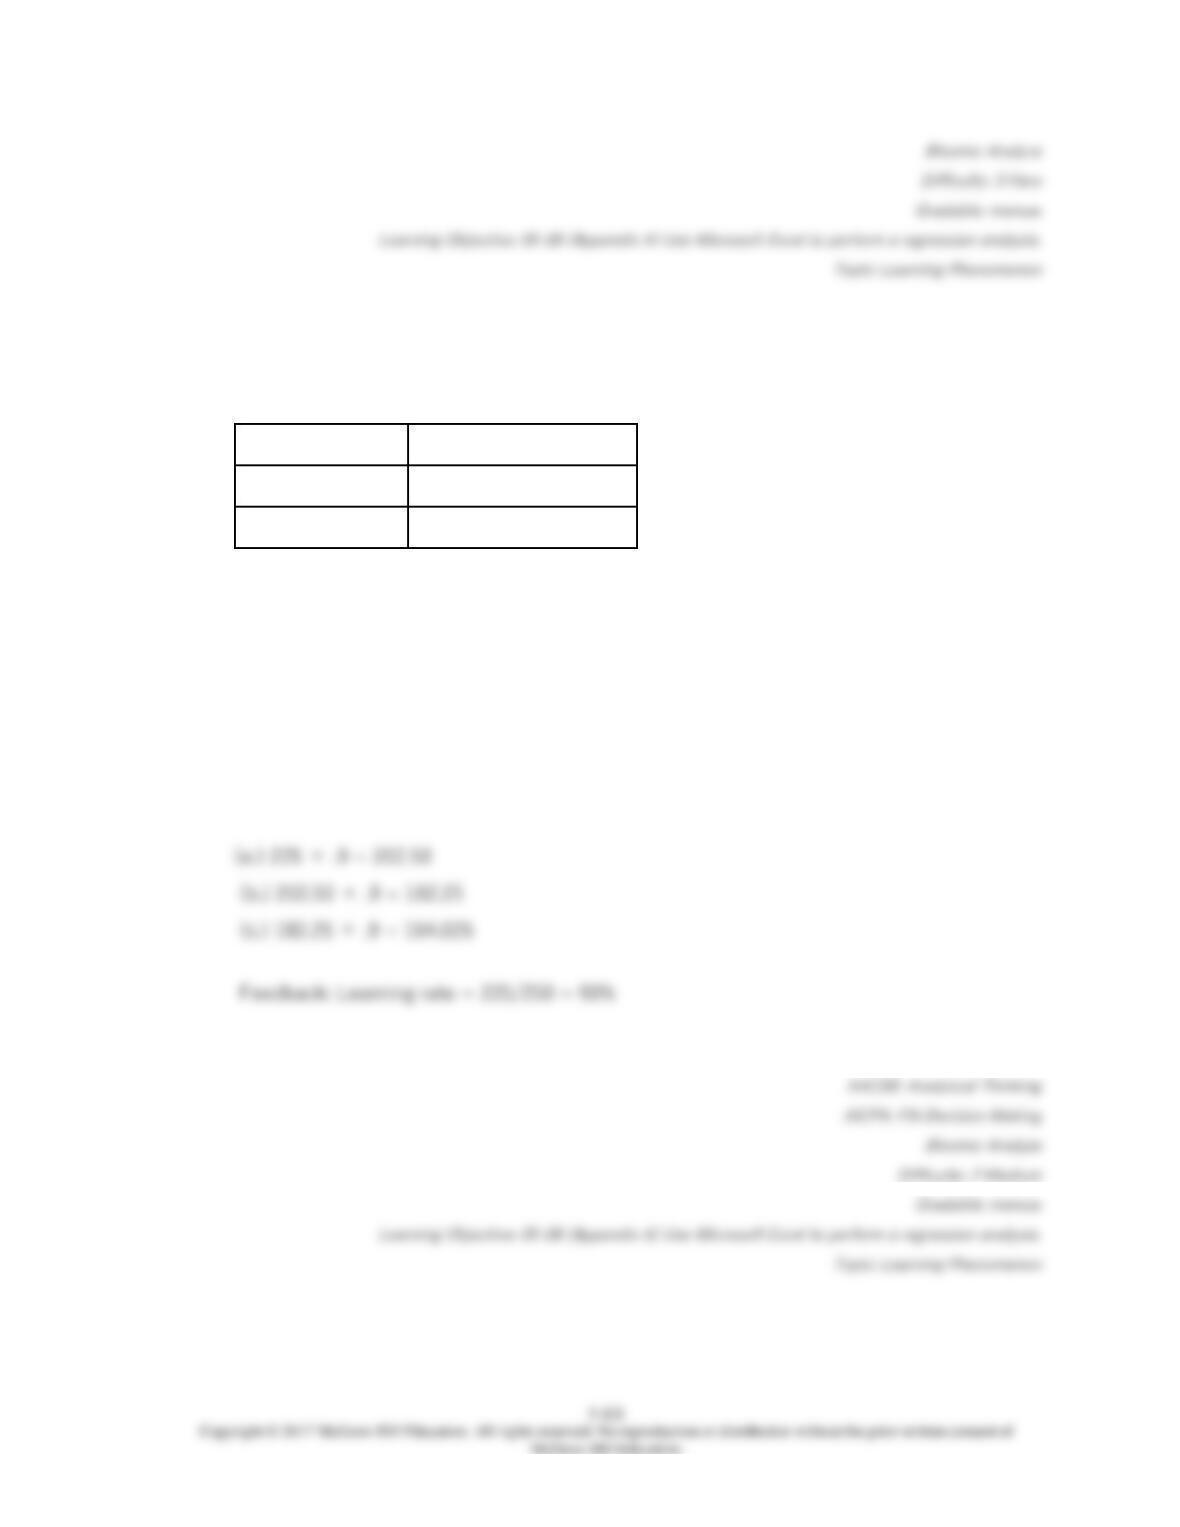
107.
Market Products, Inc., has found that new products follow a learning curve. The first two
units have been completed with the following results:
Units Produced
Marginal Labor Time
1
250.00
2
225.00
5-122
108.
Clough Company is interested in establishing the relationship between utility costs and
machine hours. Data have been collected and a regression analysis prepared using Excel.
The monthly data and the regression output follow:
Month
Machine
Hours
Electricity
Costs
January
3,250
22,080
February
3,770
25,200
March
2,470
16,200
April
4,030
27,600
May
4,940
33,900
June
4,290
26,400
July
5,330
29,700
August
4,550
27,300
September
2,600
18,600
October
4,810
31,200
November
6,110
37,200
December
5,460
33,300
SUMMARY OUTPUT
Regression
Statistics
Multiple R
96.5%
R Square
93.2%
Adjusted R-
Square
92.5 %
Standard
Error
1,710.21
Observations
12.00
Coefficients
Standard
Error
t
Stat
P-
value
Lower
95%
Upper
95%
Intercept
4,472.26
2,019.39
2.21
0.051
-27.23
8971.74
Machine
Hours
5.329
0.455
11.7
3.69E-
07
4.314
6.343
5-124
109.
Clough Company is interested in establishing the relationship between utility costs and
machine hours. Data have been collected and a regression analysis prepared using Excel.
The monthly data and the regression output follow:
Month
Machine
Hours
Electricity
Costs
January
3,250
22,080
February
3,770
25,200
March
2,470
16,200
April
4,030
27,600
May
4,940
33,900
June
4,290
26,400
July
5,330
29,700
August
4,550
27,300
September
2,600
18,600
October
4,810
31,200
November
6,110
37,200
December
5,460
33,300
5-125
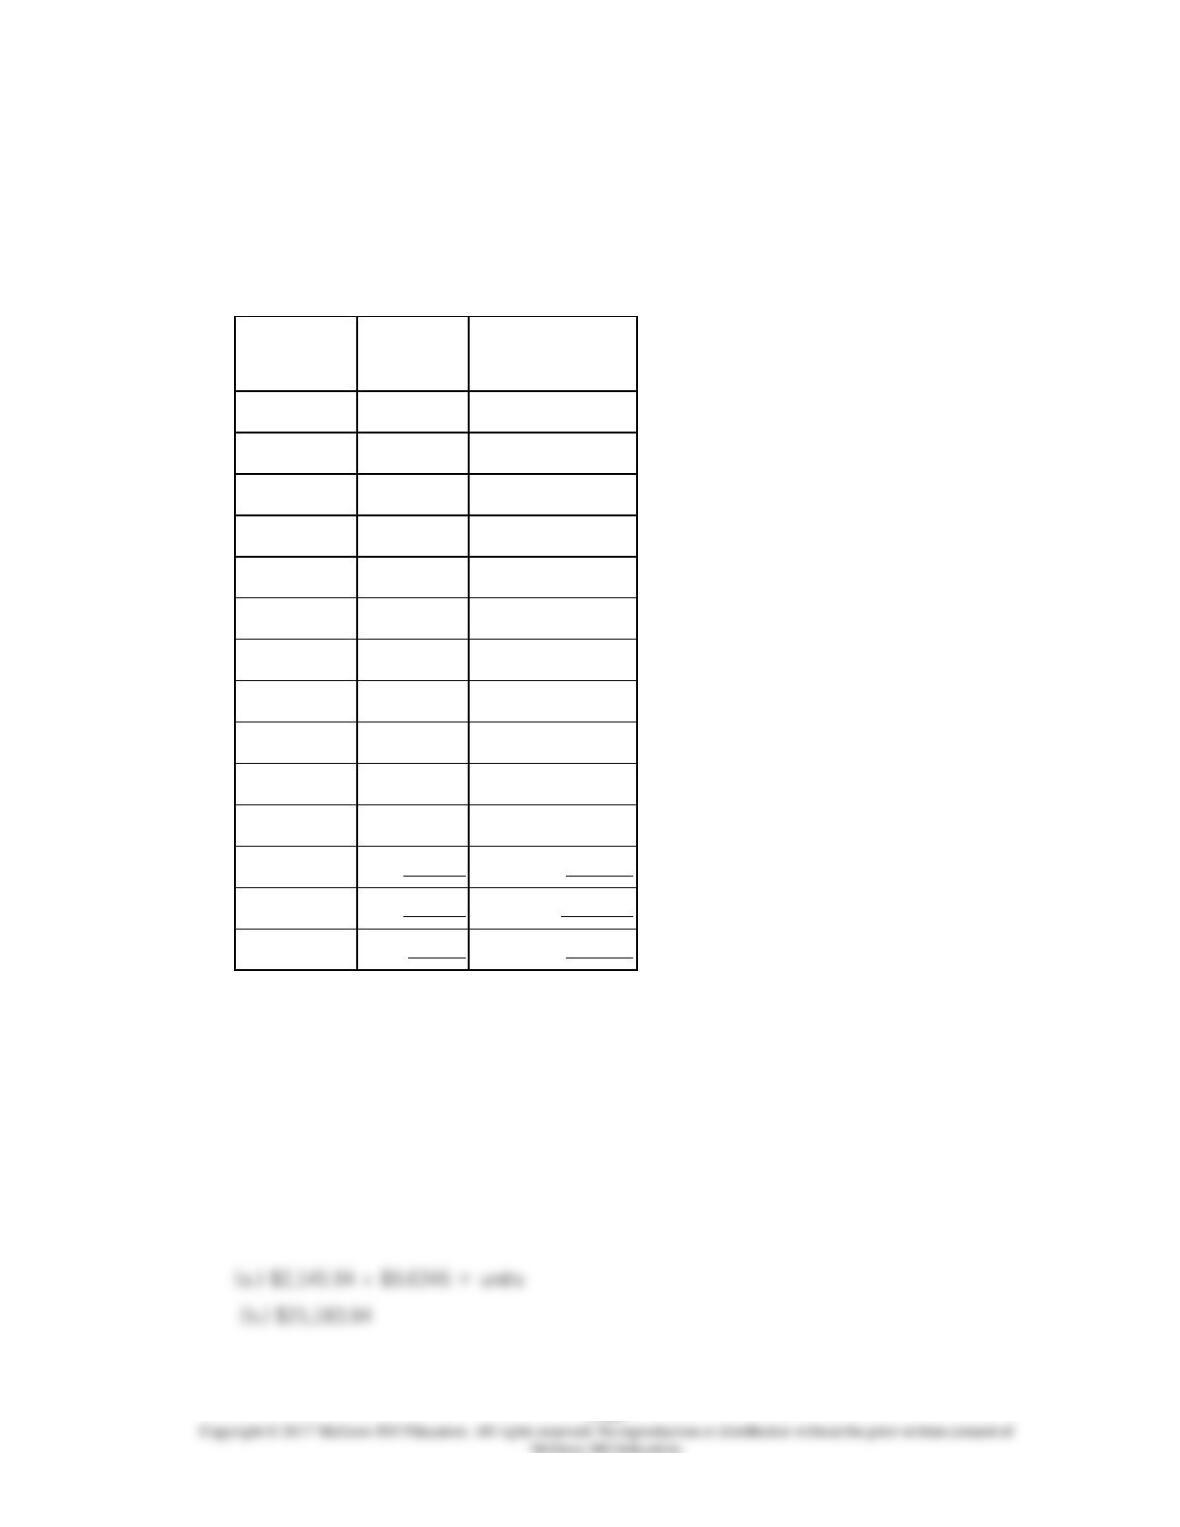
110.
Yates Corp. wants to develop a cost equation for its administrative costs. The controller
believes the appropriate cost driver is units produced. Last year’s data are presented
below:
Month
Units
produced
Administrative
Costs
January
32,500
$24,288
February
37,700
27,720
March
24,700
17,820
April
40,300
30,360
May
49,400
37,290
June
42,900
29,040
July
53,300
32,670
August
45,500
30,030
September
26,000
20,460
October
48,100
34,320
November
61,100
40,920
December
54,600
36,630
Total
516,100
$361,548
Average
43,008
$30,129

5-127
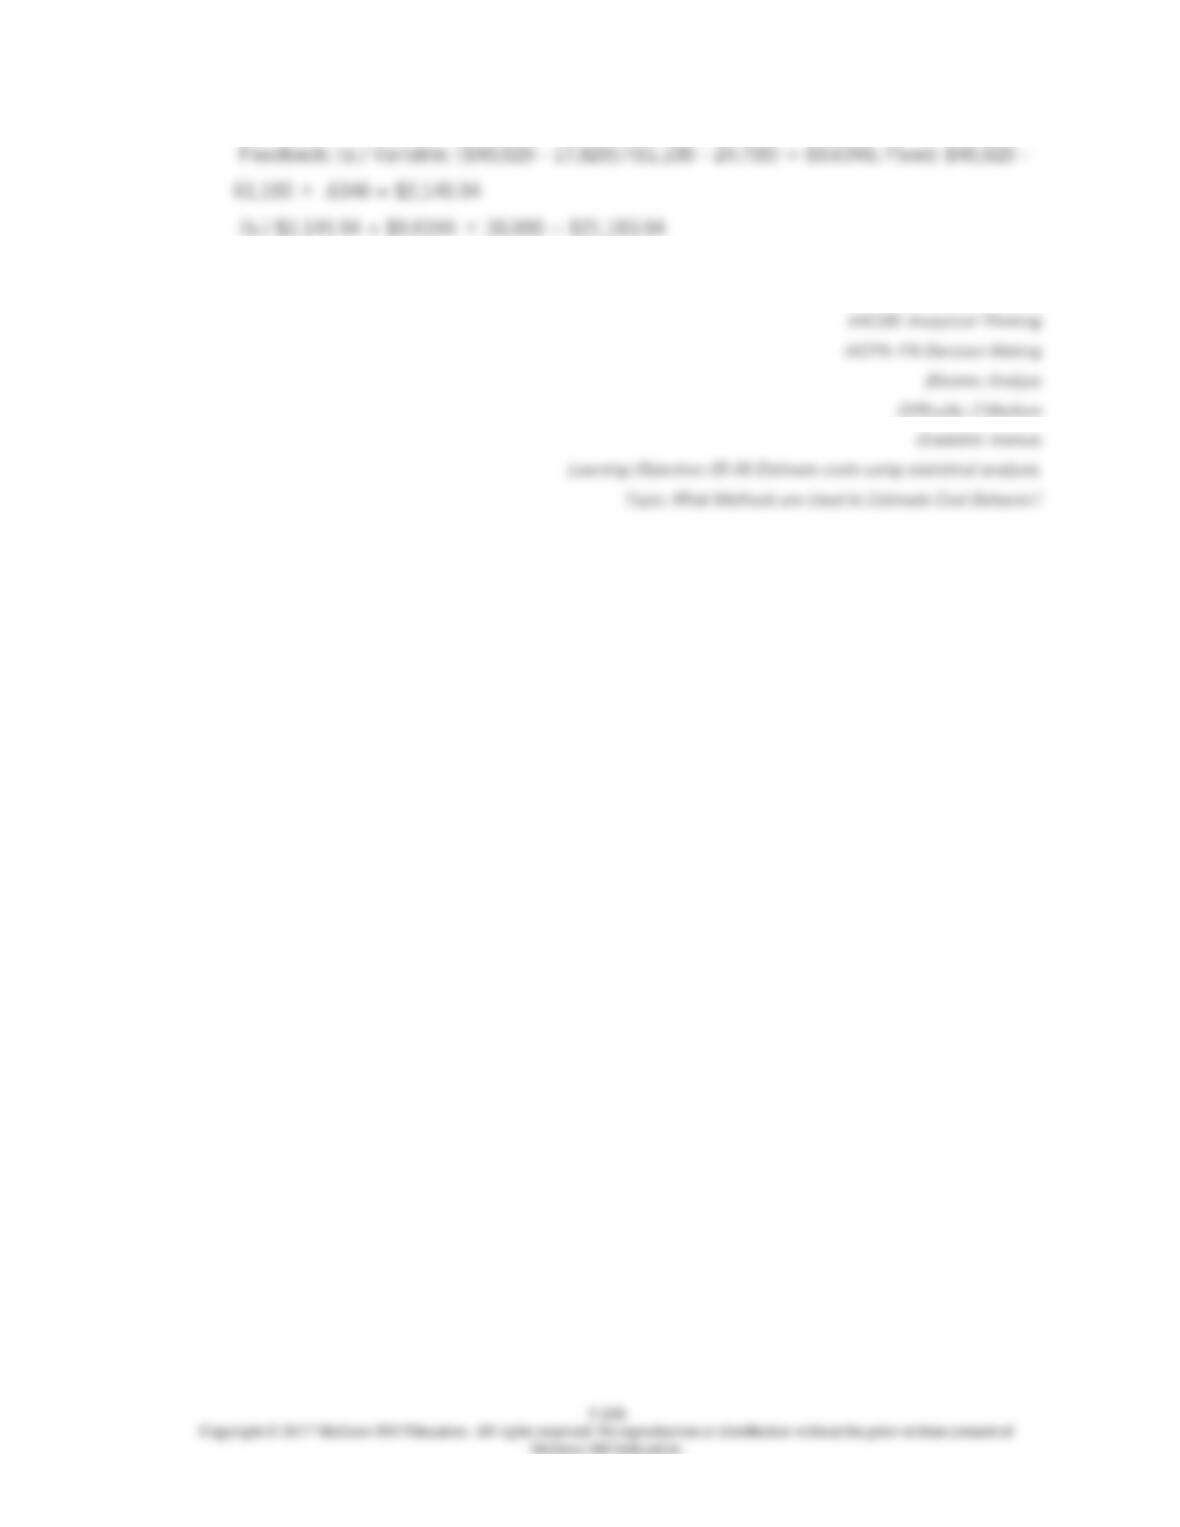
111.
Yates Corp. wants to develop a cost equation for its administrative costs. The controller
believes the appropriate cost driver is units produced. Last year’s data are presented
below:
Month
Units
produced
Administrative
Costs
January
32,500
$24,288
February
37,700
27,720
March
24,700
17,820
April
40,300
30,360
May
49,400
37,290
June
42,900
29,040
July
53,300
32,670
August
45,500
30,030
September
26,000
20,460
October
48,100
34,320
November
61,100
40,920
December
54,600
36,630
SUMMARY OUTPUT
Regression Statistics
Multiple R
0.965383
R Square
0.931965
Adjusted R-
Square
0.925162
Standard
Error
1,881.232
Observations
12
Coefficients
Standard
Error
t
Stat
P-value
Lower
95%
Upper
95%
Intercept
4,919.48
2,221.329
2.21
0.051156
-29.9485
9,868.909
Units
Produced
0.586154
0.050082
11.70
3.69E-07
0.474566
0.697743
5-129
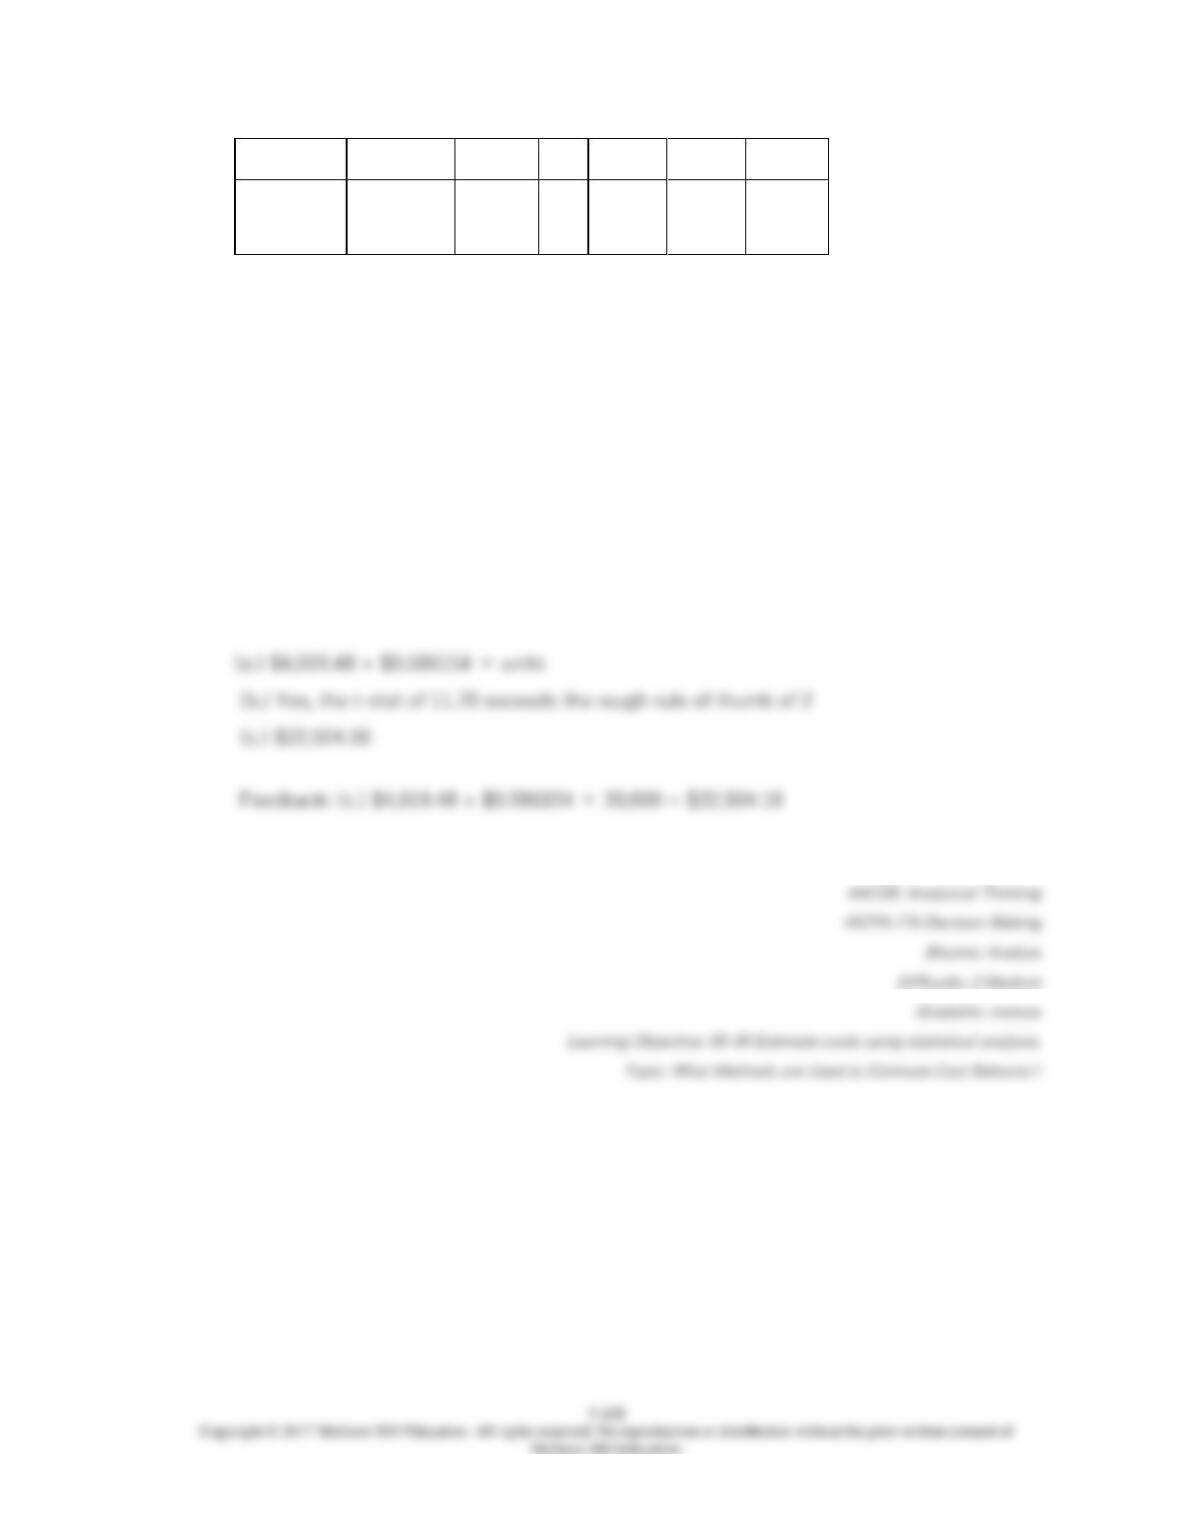
112.
The Wonder Drug Company’s total overhead costs at various levels of activity are
presented below:
Month
Direct Labor
Hours
Total
Overhead
September
15,000
$472,000
October
12,000
409,400
November
18,000
542,000
December
21,000
604,700
Assume that the overhead costs above consist of indirect labor, scheduling salaries, and
maintenance. The breakdown of these costs for the month of November is as follows:
Indirect labor (V)
$219,600
Maintenance (M)
197,400
Scheduling Salaries (F)
125,000
$542,000

5-131
113.
The Norcross Company has traditionally estimated manufacturing overhead costs using
production volume. Some of the production managers believe that the number of setups
may also have an impact on monthly manufacturing overhead costs. In order to investigate
this possibility, the company collected information on its monthly manufacturing overhead
costs, production in units, and number of setups for 2016.
Month
Production
(Units)
Manufacturing
Overhead
Cost
Number of
Setups
1
50,000
$800,100
17
2
65,000
752,500
16
3
40,000
795,100
21
4
55,000
822,750
16
5
30,000
771,225
21
6
25,000
706,200
15
7
60,000
843,000
19
8
80,000
935,200
22
9
77,000
901,750
20
10
43,000
786,400
17
11
50,000
819,600
19
12
70,000
880,900
21
Regression analysis results of the information presented above are as follows:
Ordinary regression:
Equation: $650,398 + $3.1061 × units
r-square: .707
Multiple regression:
Equation: $464,481 + $2.5356 × units + $11,631.6048 × number of set ups
r-square: .867
Required:
(a.) Use the results from the ordinary regression and estimate next month’s
114.
115.