70. In the learning curve equation Y = aXb, the “a” term represents:
71. In the learning curve equation Y = aXb, the “b” term represents:
72. Which of the following statements regarding the learning phenomenon is true?
73. Which of the following is a common assumption of cost estimation?
74. Which of the following is not a data problem an analyst must watch for when estimating
cost behavior?
75. Which of the following is not a data problem an analyst must watch for when estimating
cost behavior?
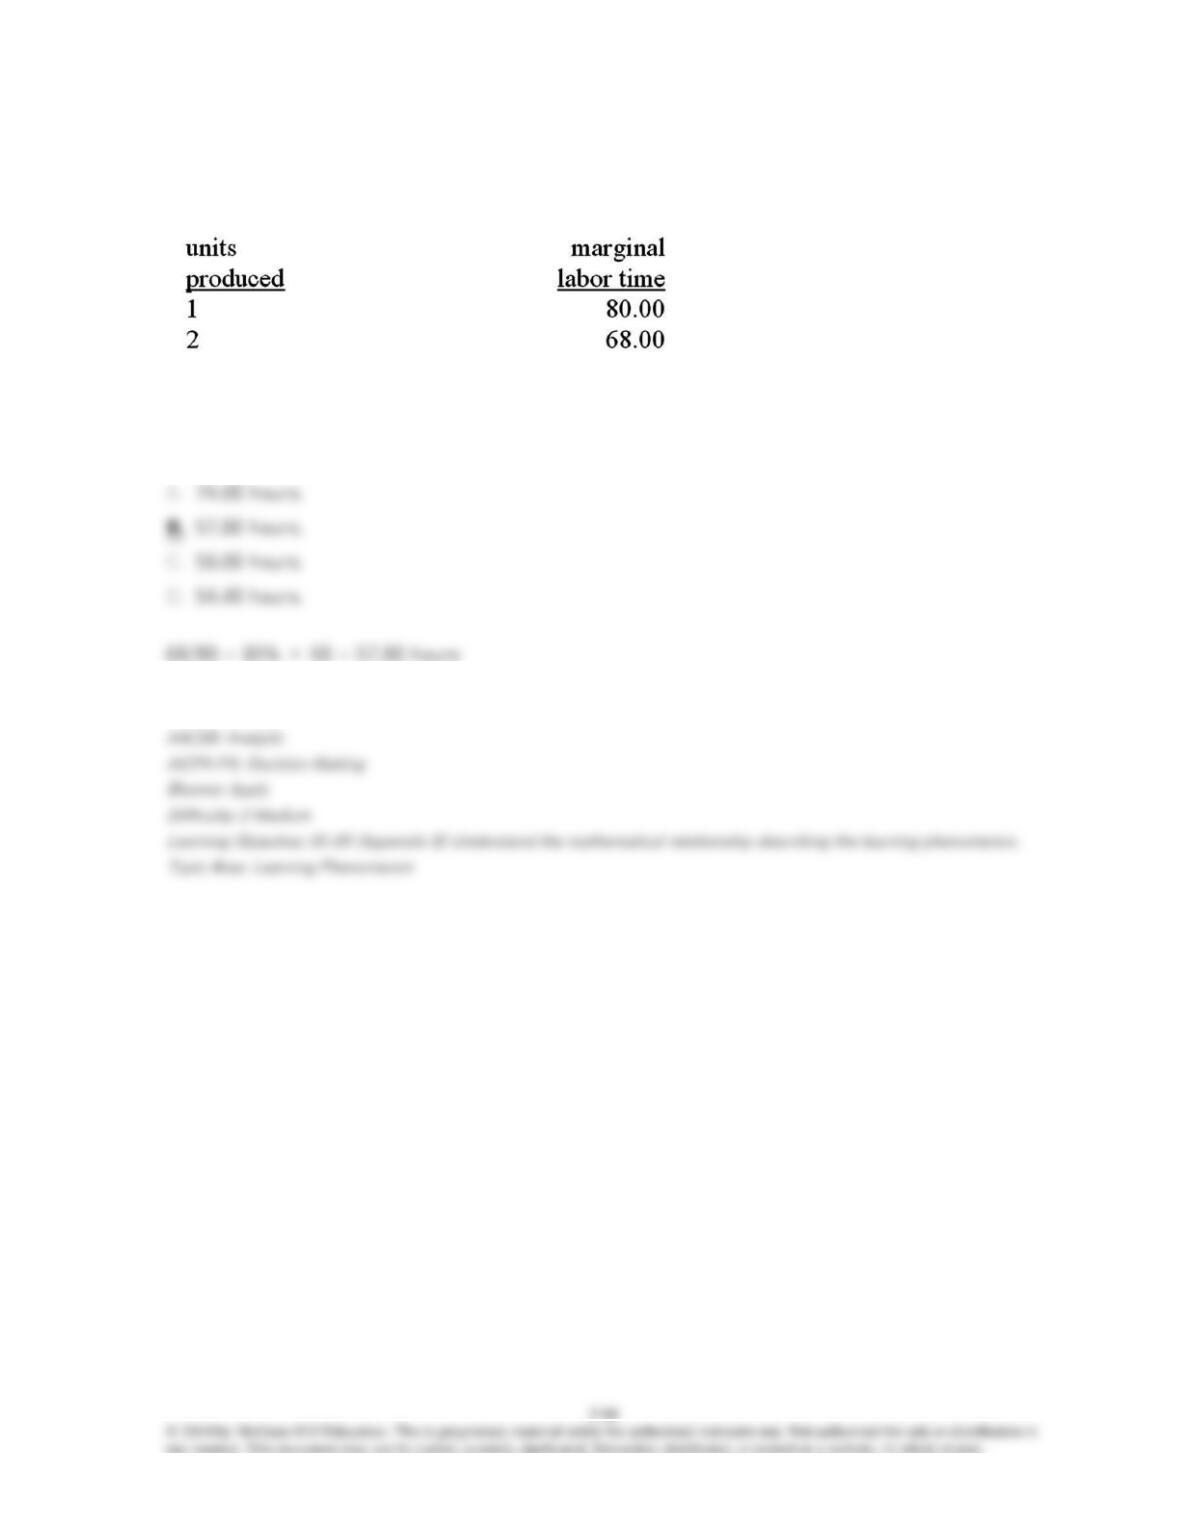
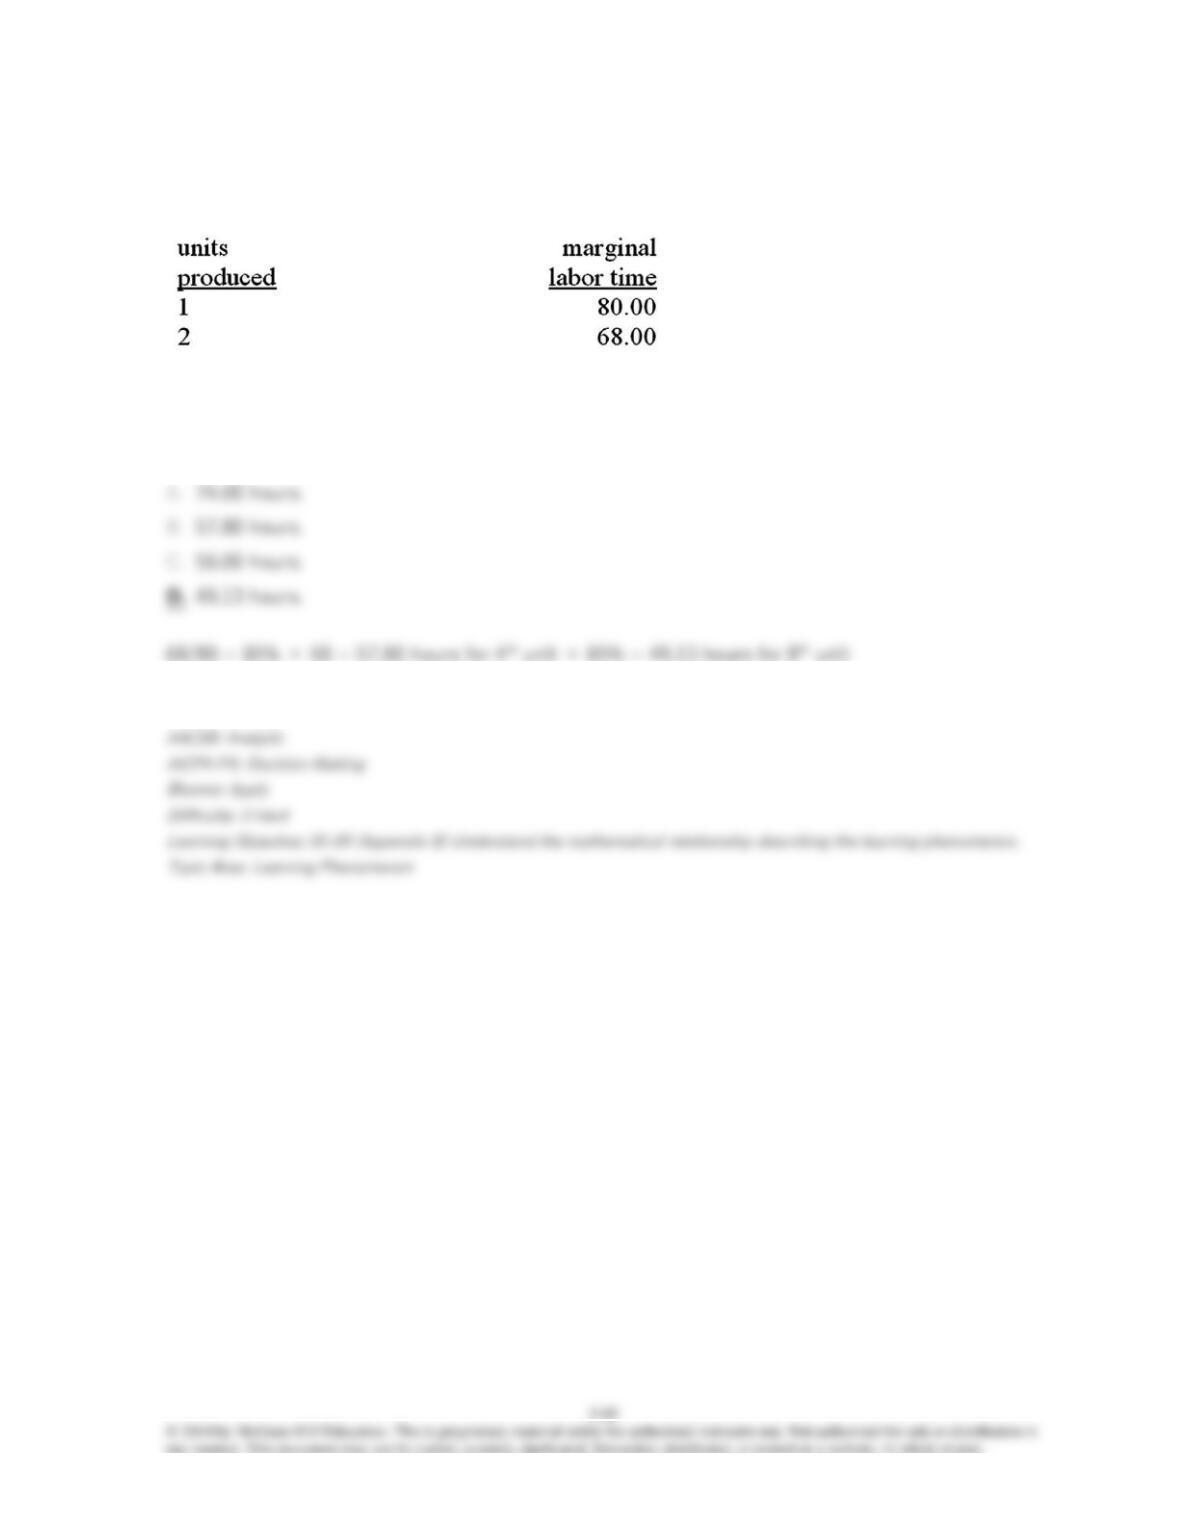
76. Hawkins Products, Inc., has found that new products follow a learning curve. The first two
units have been completed with the following results:
How much time will be needed to complete the 4th unit?
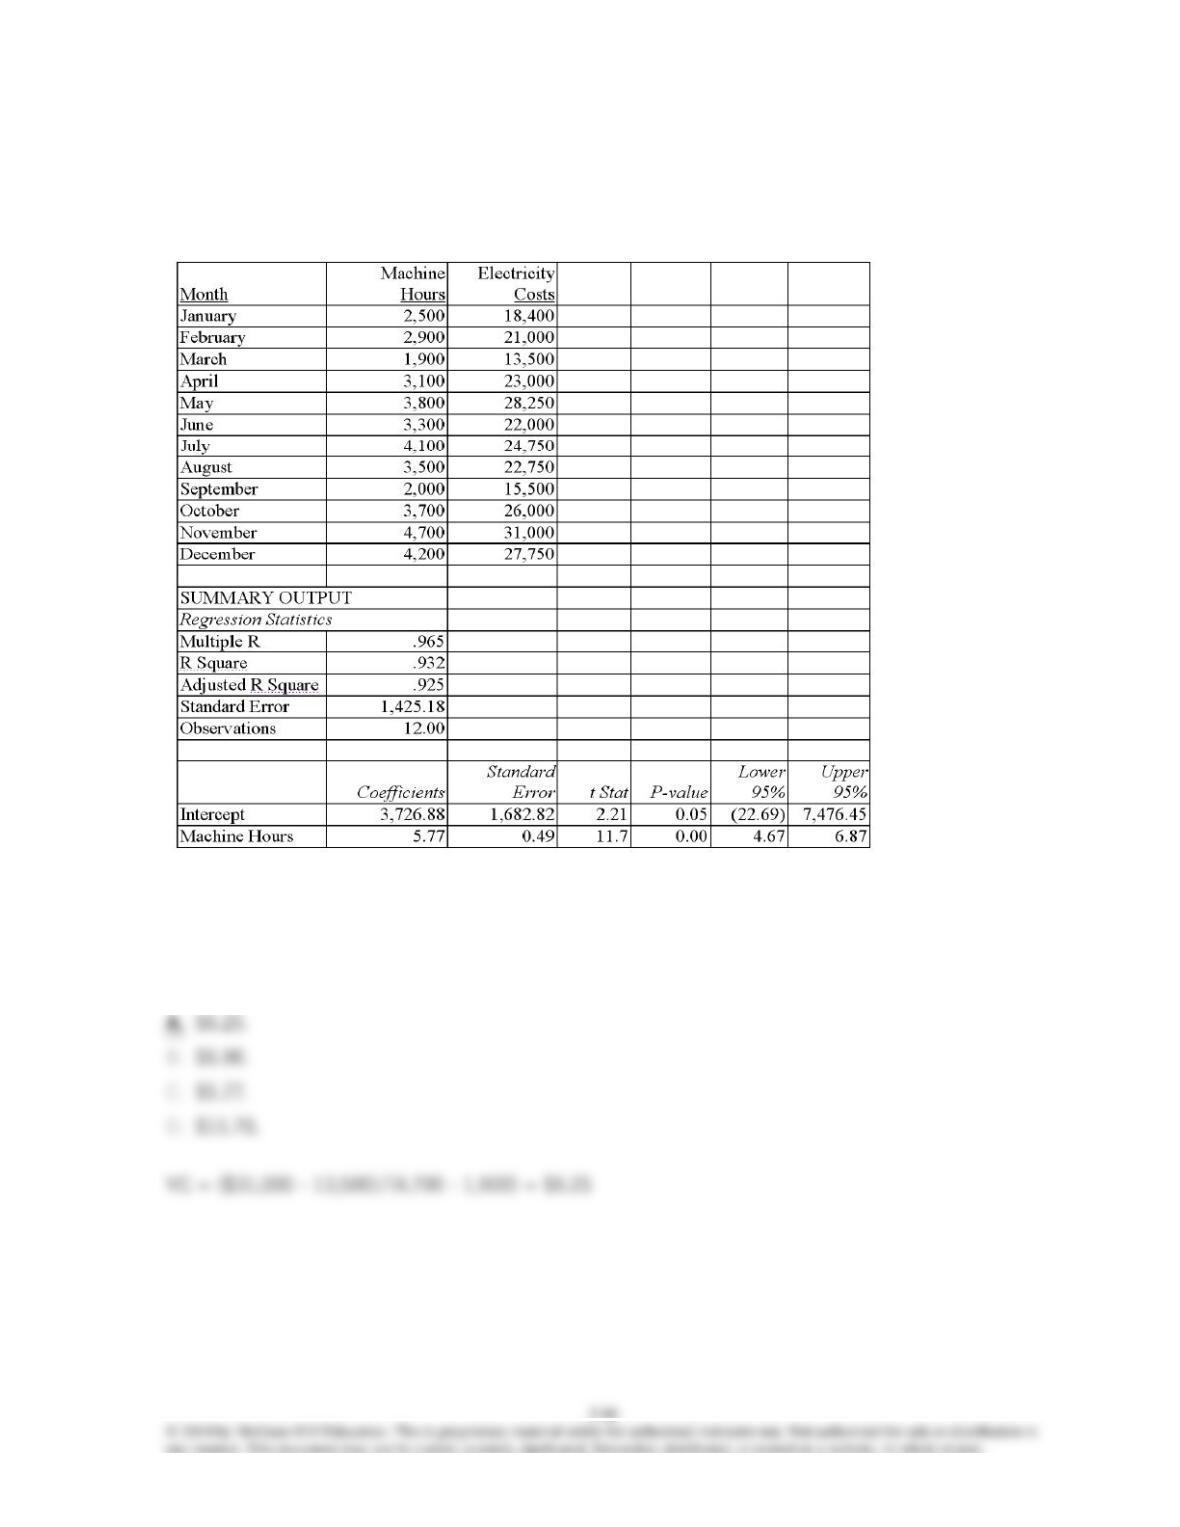
77. Hawkins Products, Inc., has found that new products follow a learning curve. The first two
units have been completed with the following results:
How much time will be needed to complete the 8th unit?
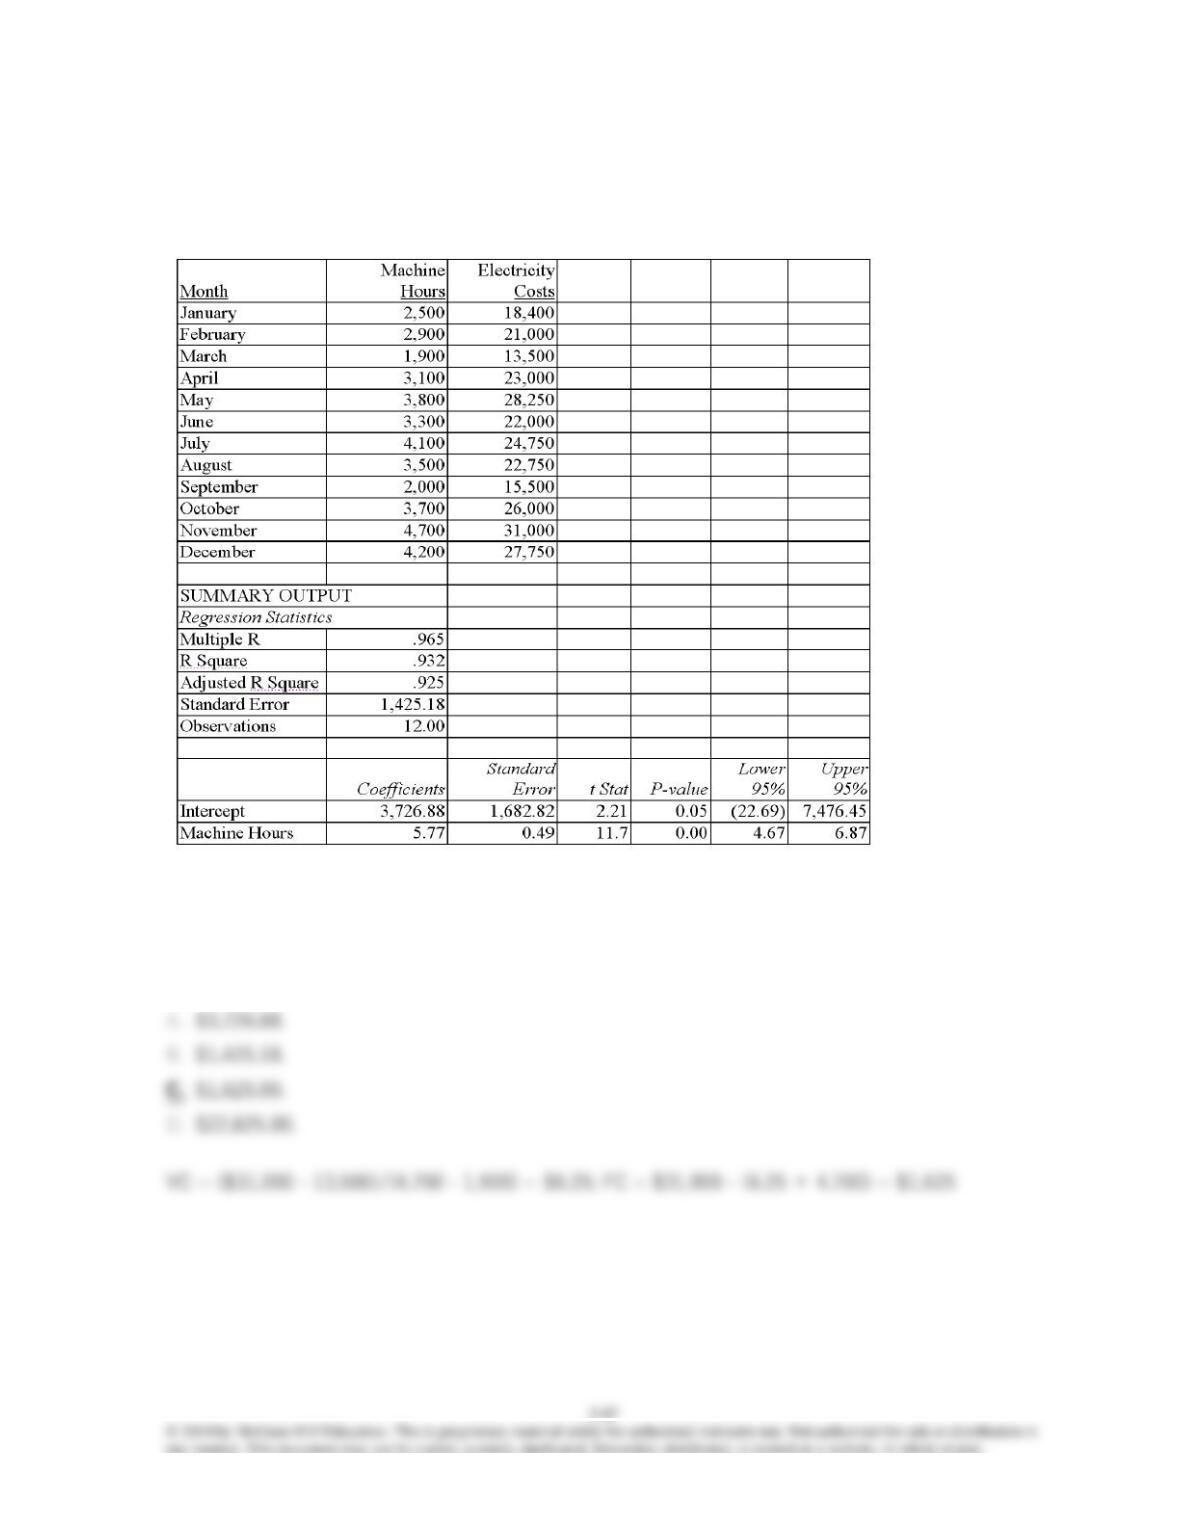
78. Thul Company is interested in establishing the relationship between electricity costs and
machine hours. Data have been collected and a regression analysis prepared using Excel. The
monthly data and the regression output follow:
If the controller uses the high-low method to estimate costs, the variable cost per machine hour
is:
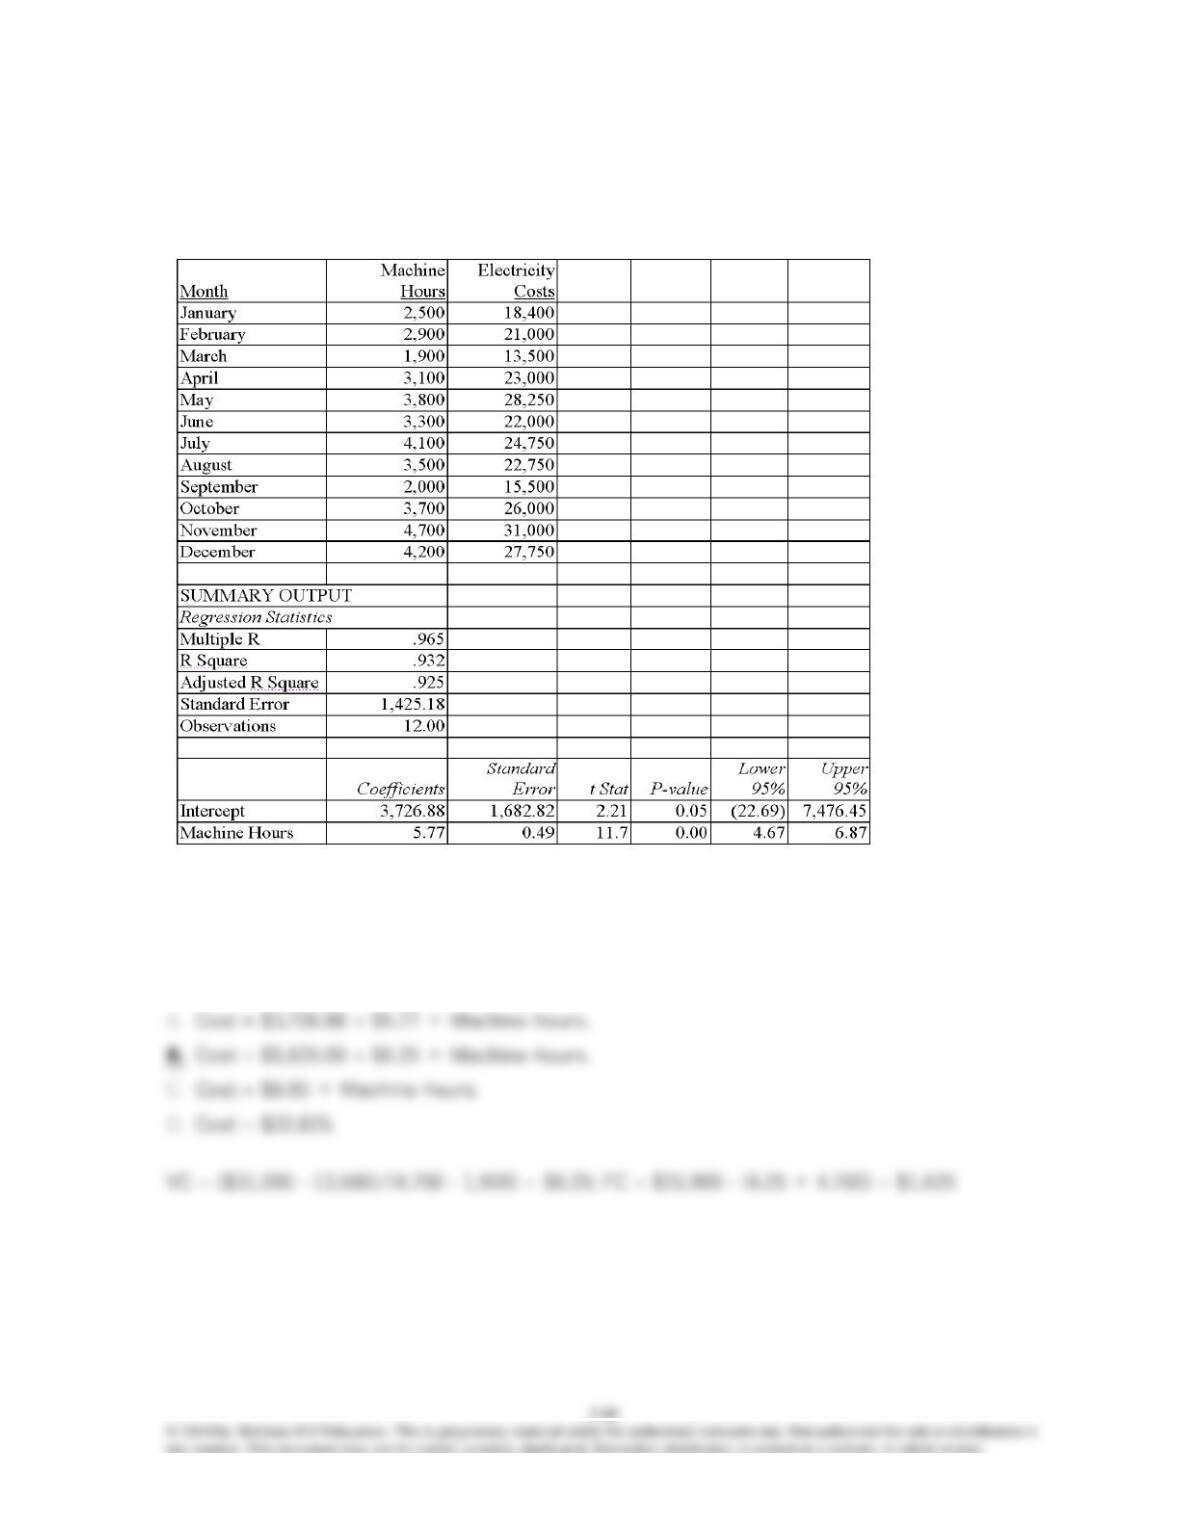
79. Thul Company is interested in establishing the relationship between electricity costs and
machine hours. Data have been collected and a regression analysis prepared using Excel. The
monthly data and the regression output follow:
If the controller uses the high-low method to estimate costs, the fixed cost portion of the cost
equation for electricity cost is:
80. Thul Company is interested in establishing the relationship between electricity costs and
machine hours. Data have been collected and a regression analysis prepared using Excel. The
monthly data and the regression output follow:
If the controller uses the high-low method to estimate costs, the cost equation for electricity cost
is:
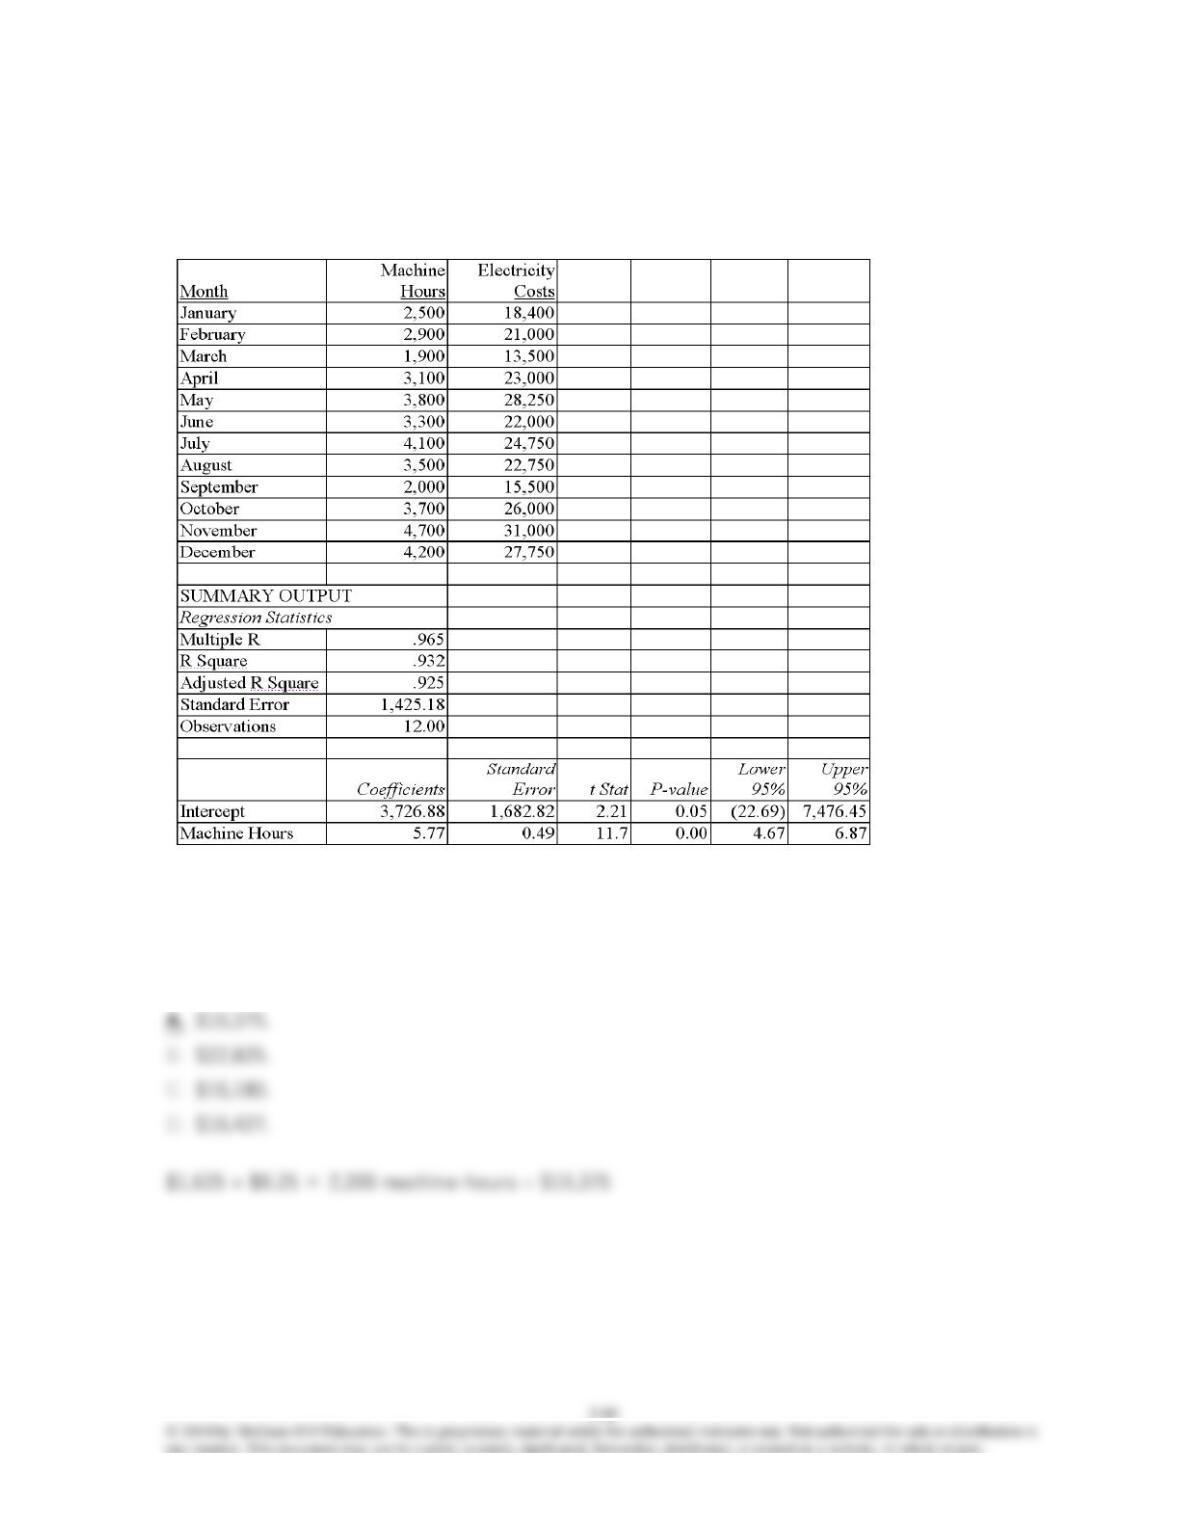
81. Thul Company is interested in establishing the relationship between electricity costs and
machine hours. Data have been collected and a regression analysis prepared using Excel. The
monthly data and the regression output follow:
Based on the results of the high-low analysis, the estimate of electricity costs in a month with
2,200 machine hours would be:
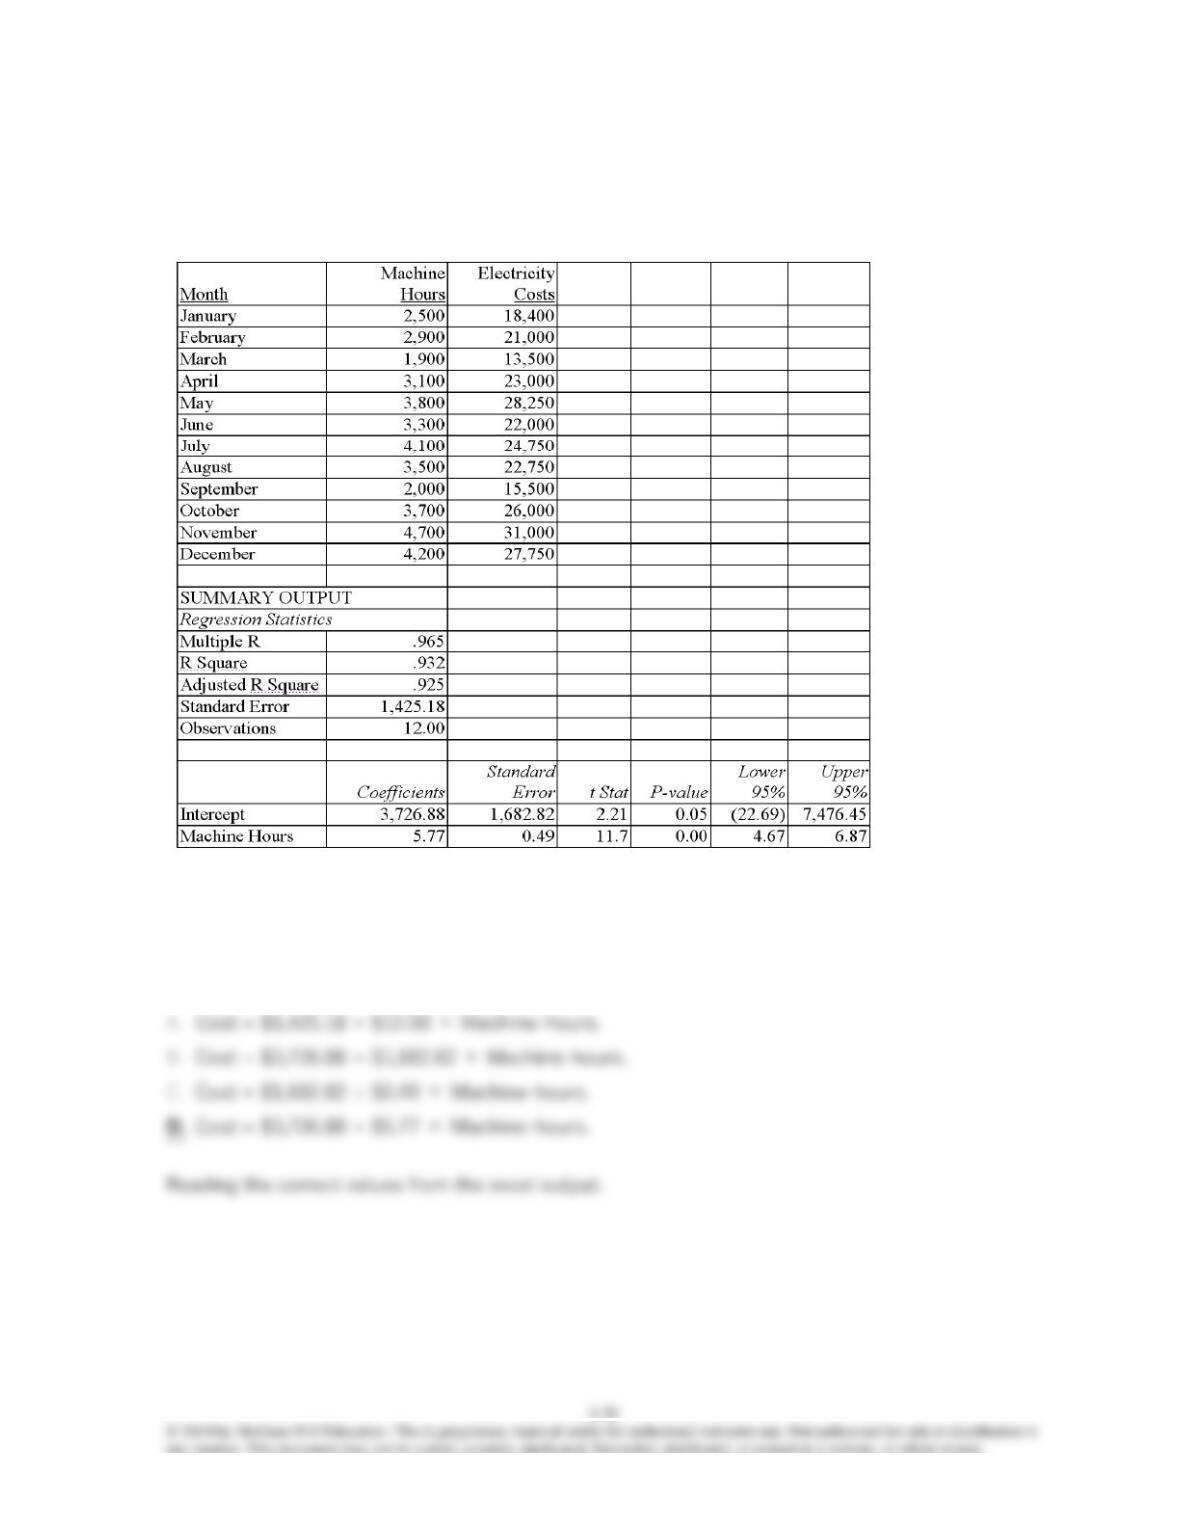
82. Thul Company is interested in establishing the relationship between electricity costs and
machine hours. Data have been collected and a regression analysis prepared using Excel. The
monthly data and the regression output follow:
If the controller uses regression analysis to estimate costs, the cost equation for electricity cost
is:
5-71
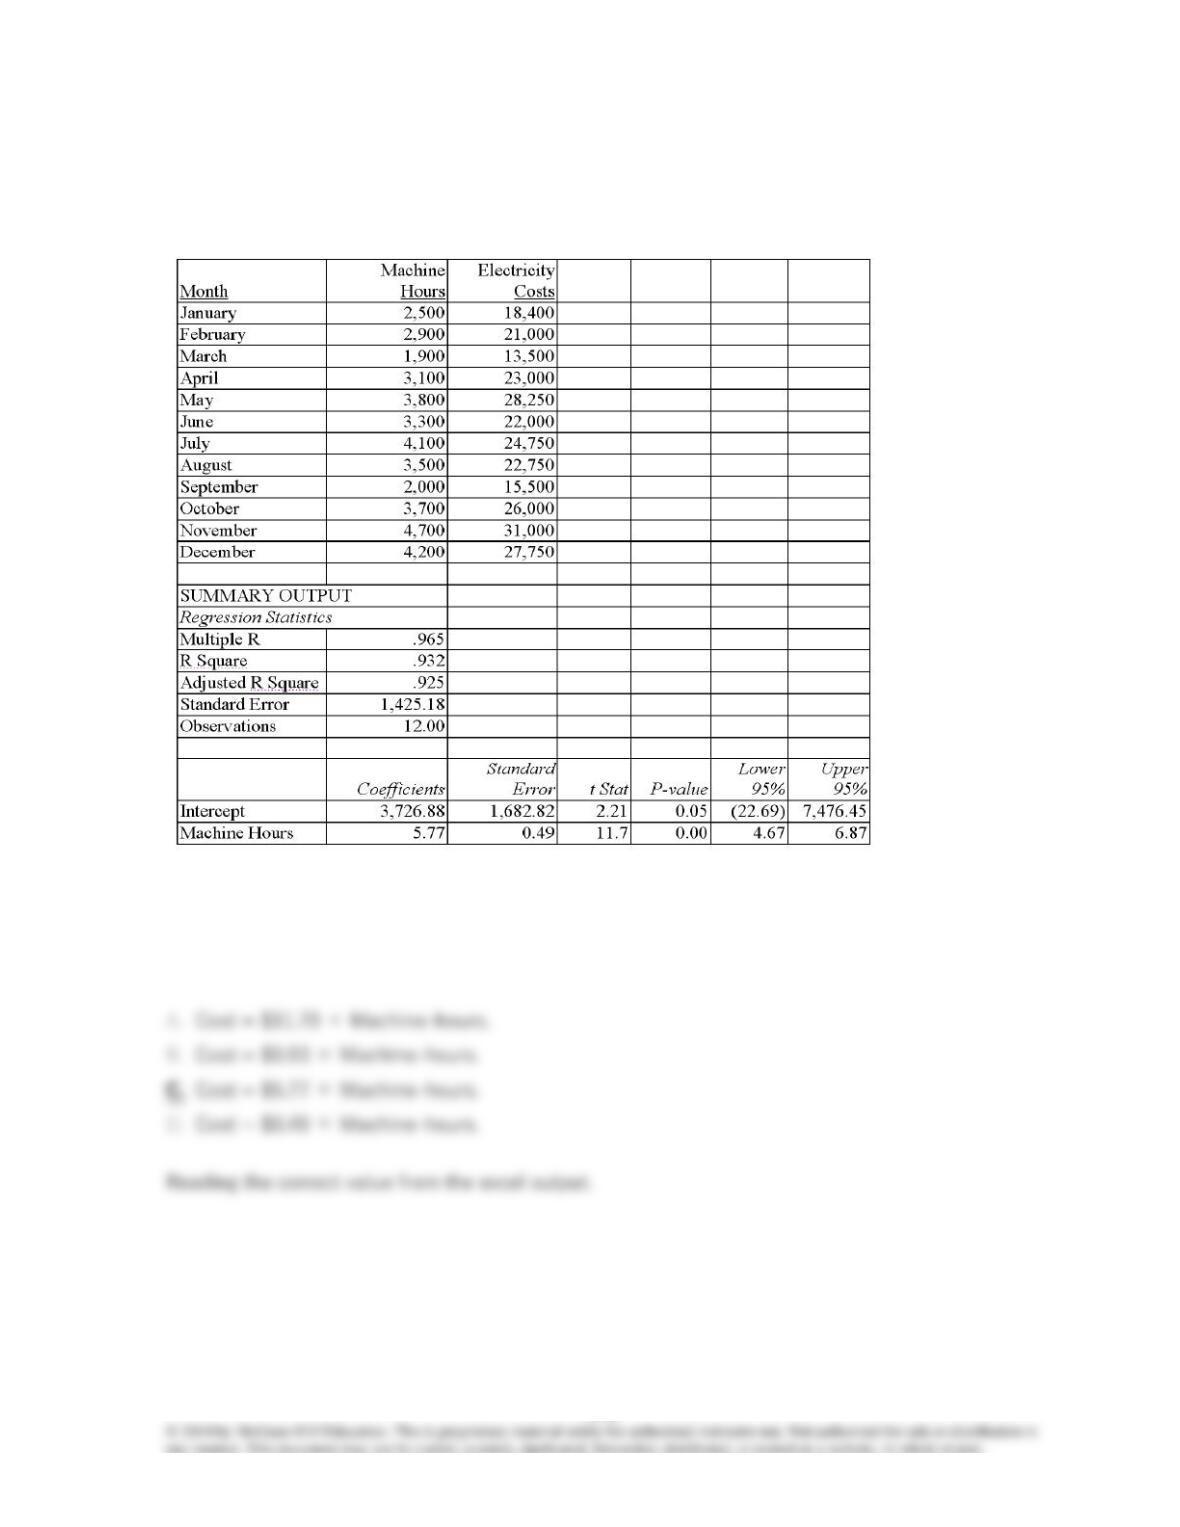
83. Thul Company is interested in establishing the relationship between electricity costs and
machine hours. Data have been collected and a regression analysis prepared using Excel. The
monthly data and the regression output follow:
If the controller uses regression analysis to estimate costs, the estimate of the variable portion of
electricity cost is:
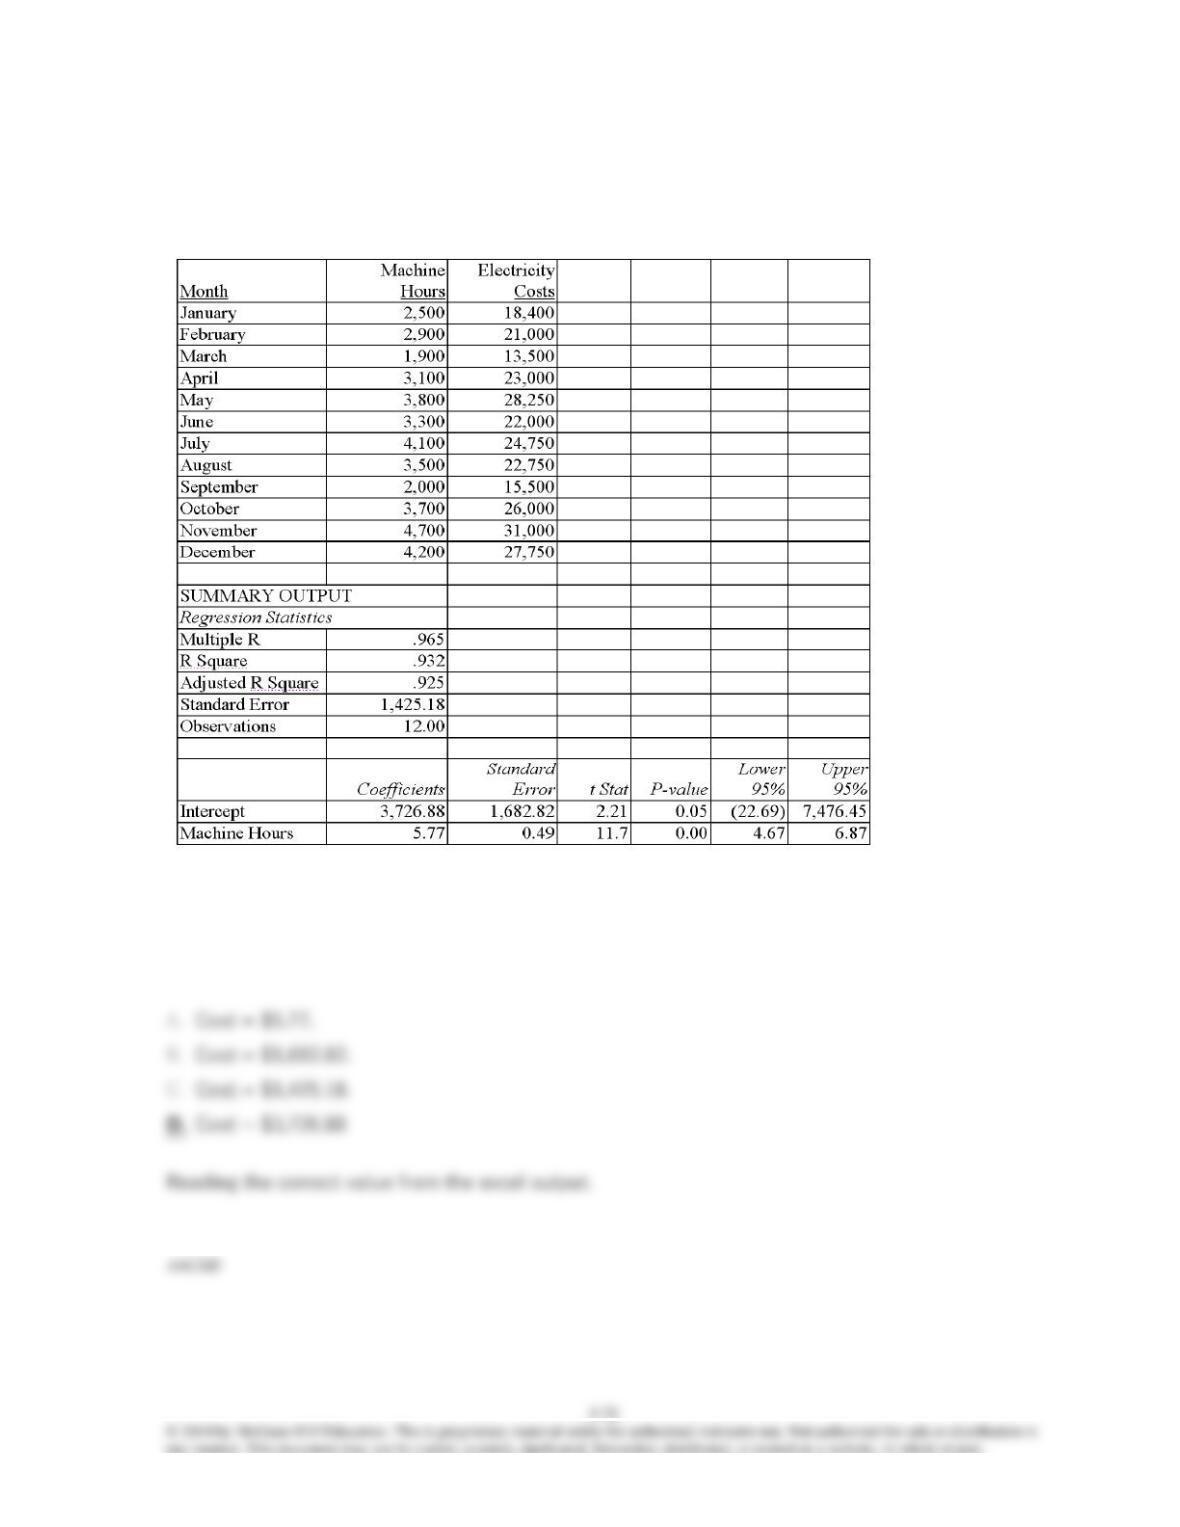
84. Thul Company is interested in establishing the relationship between electricity costs and
machine hours. Data have been collected and a regression analysis prepared using Excel. The
monthly data and the regression output follow:
If the controller uses regression analysis to estimate costs, the estimate of the fixed portion of
electricity cost is:
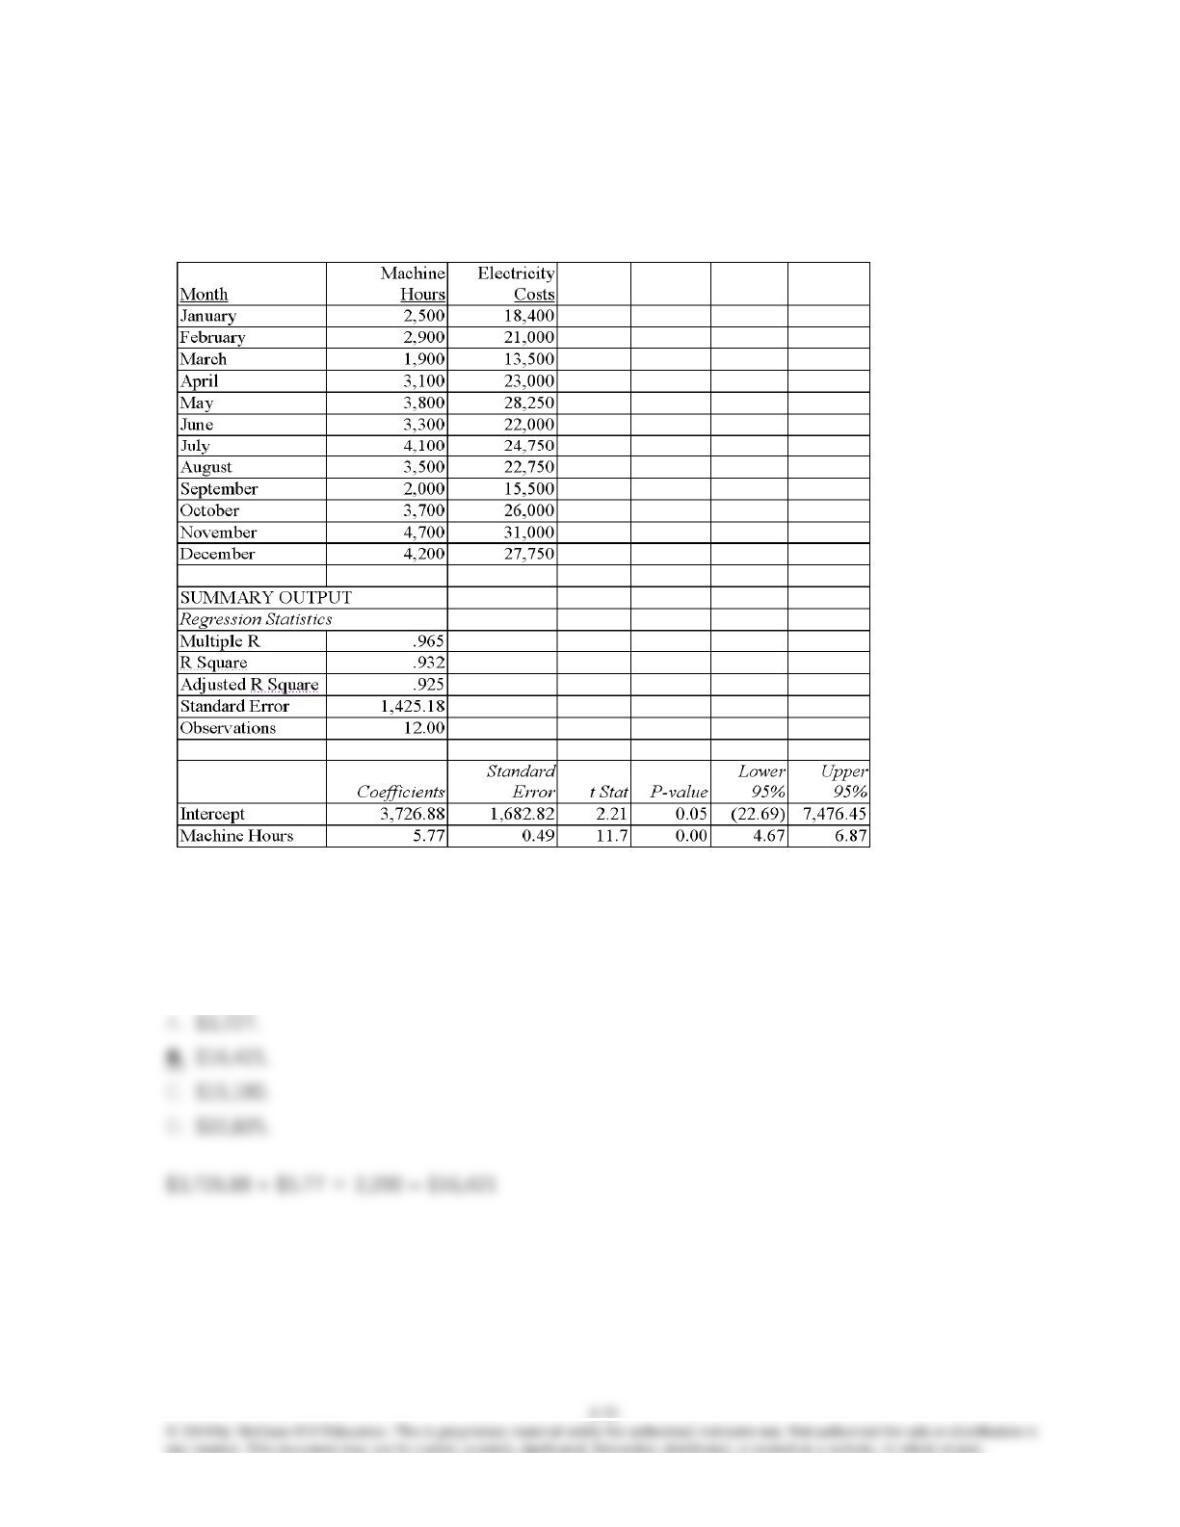
85. Thul Company is interested in establishing the relationship between electricity costs and
machine hours. Data have been collected and a regression analysis prepared using Excel. The
monthly data and the regression output follow:
Based on the results of the regression analysis, the estimate of electricity costs in a month with
2,200 machine hours would be: (rounded to the nearest whole dollar)
5-74
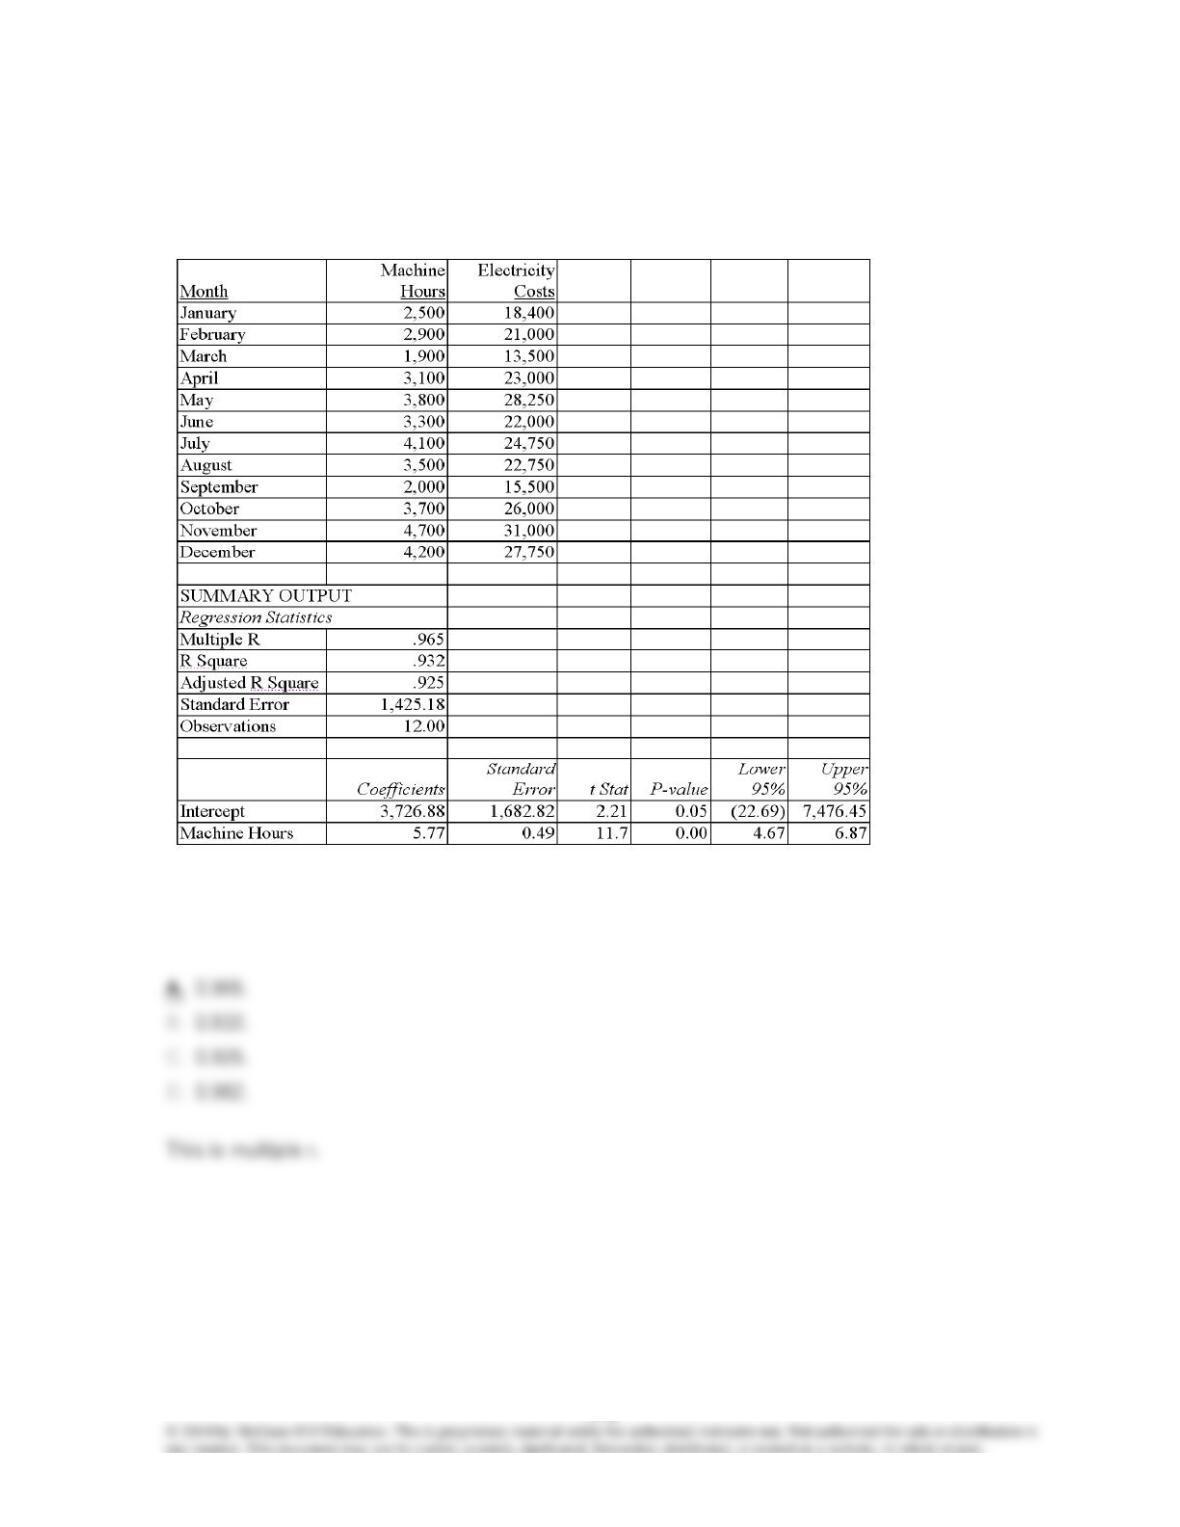
86. Thul Company is interested in establishing the relationship between electricity costs and
machine hours. Data have been collected and a regression analysis prepared using Excel. The
monthly data and the regression output follow:
The correlation coefficient for the regression equation for electricity costs is:
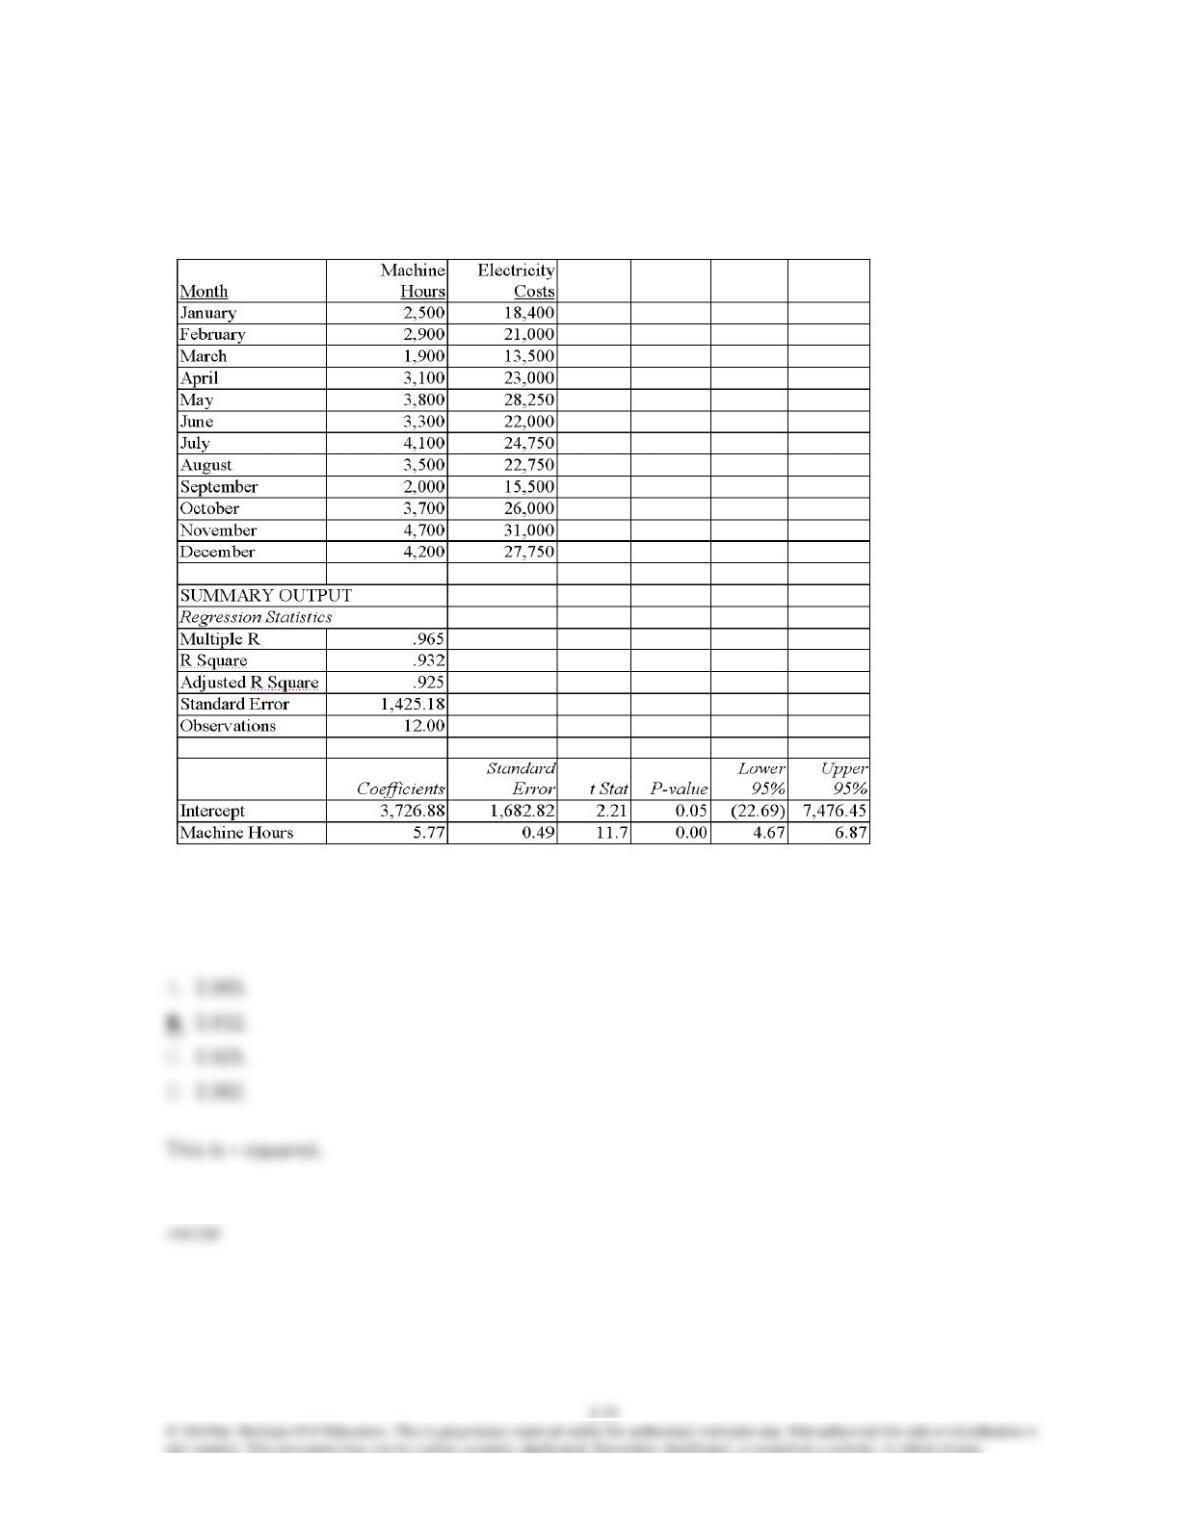
87. Thul Company is interested in establishing the relationship between electricity costs and
machine hours. Data have been collected and a regression analysis prepared using Excel. The
monthly data and the regression output follow:
The percent of the total variance that can be explained by the regression is:
5-76
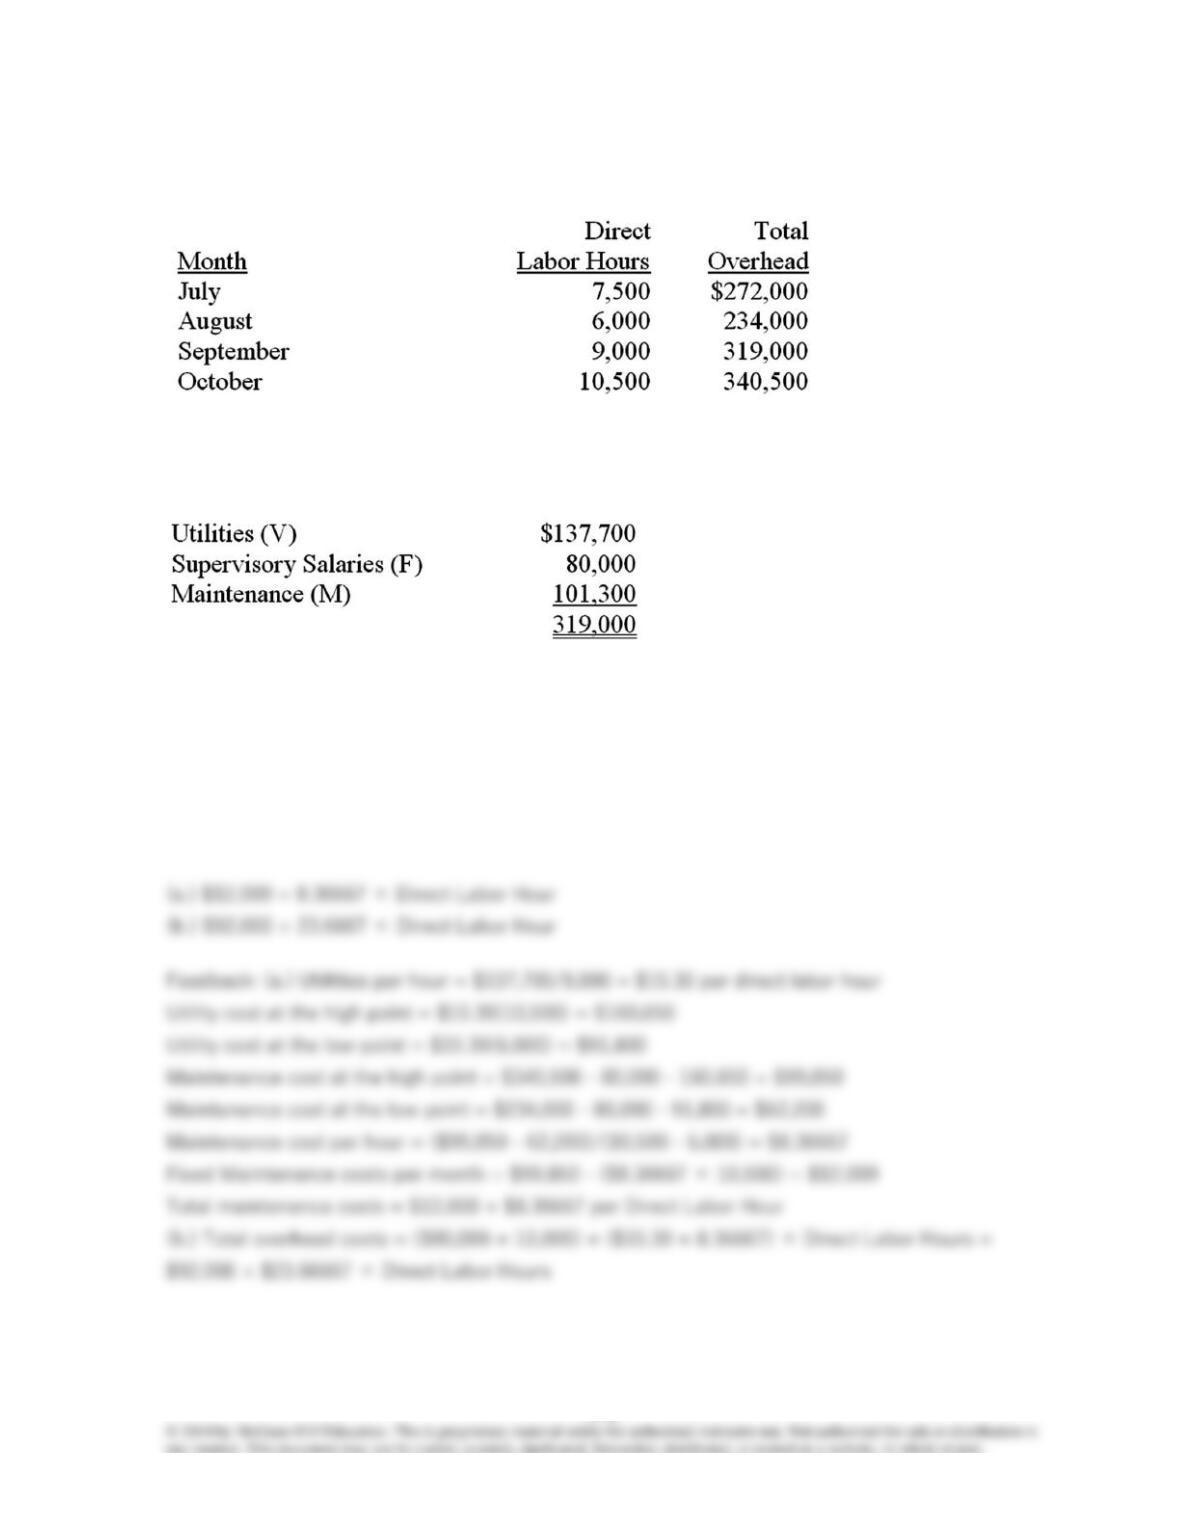
88. The Teal Company’s total overhead costs at various levels of activity are presented below:
Assume that the overhead costs above consist of utilities, supervisory salaries, and maintenance.
The breakdown of these costs at the 9,000 direct labor hour level of activity is as follows:
Required:
(a.) Using the high-low method, determine the cost formula for maintenance.
(b.) Express the company’s total overhead costs in linear equation form.
5-77
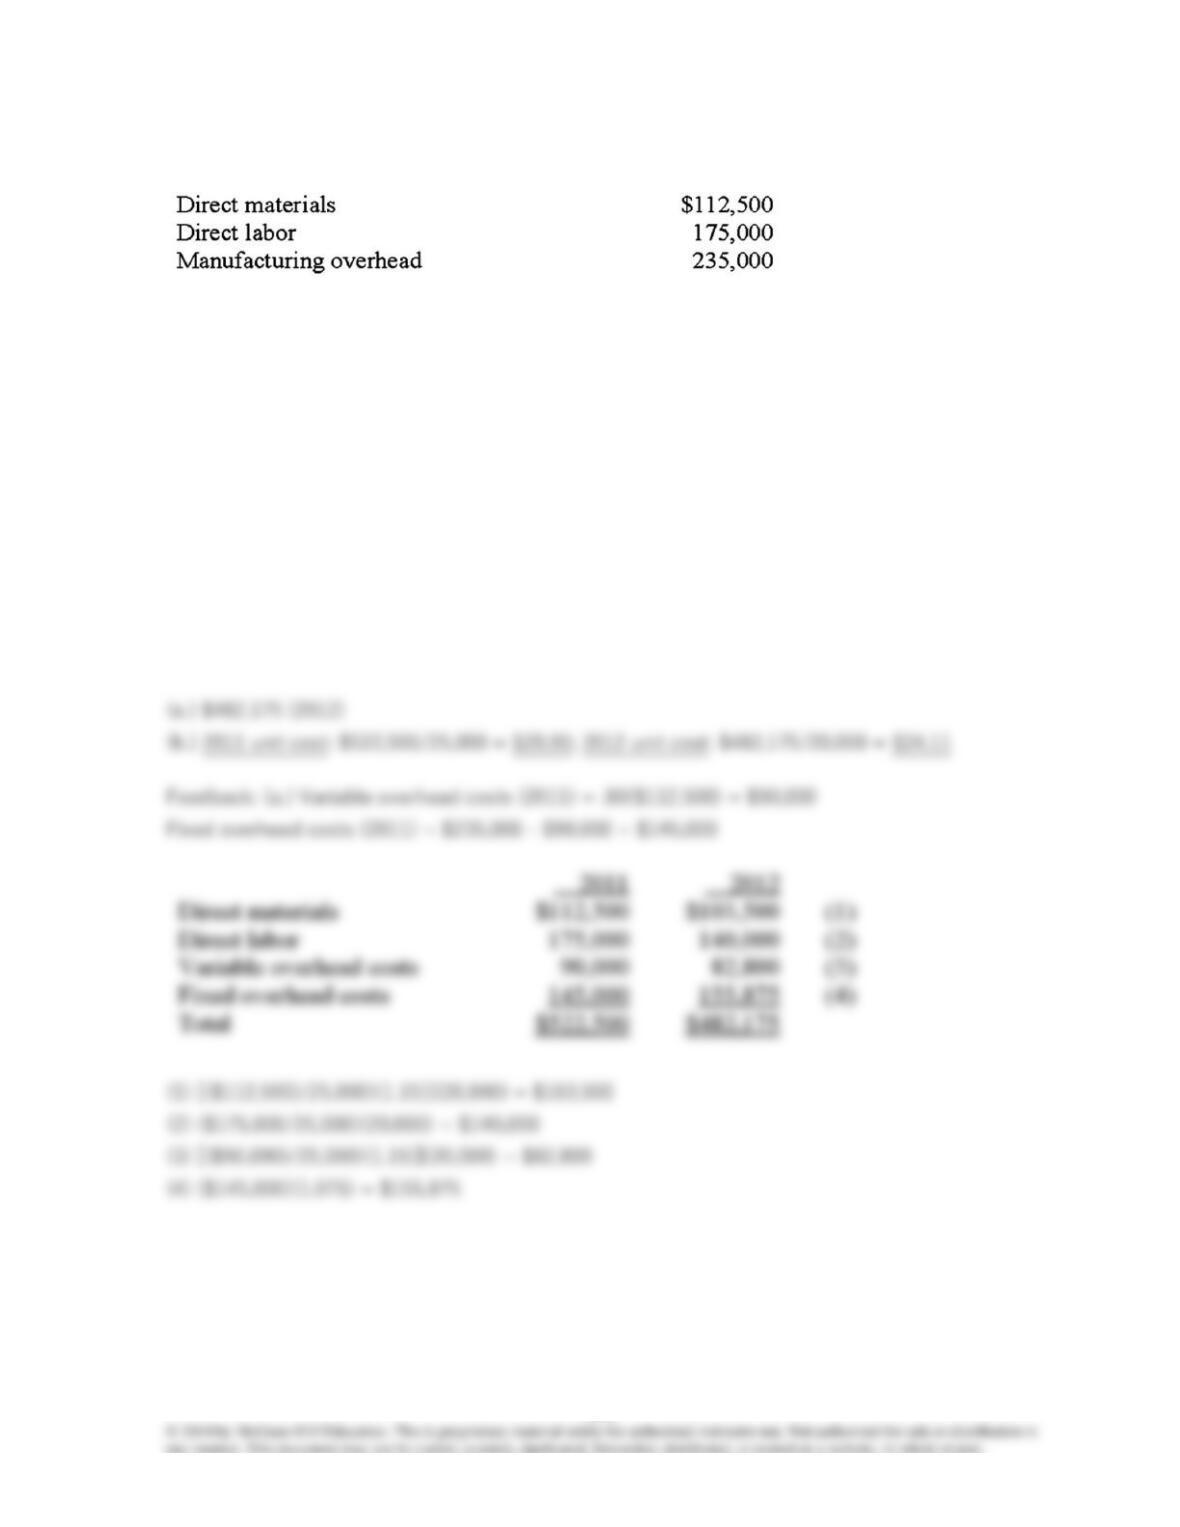
89. The following manufacturing costs were incurred by the RST Company in 2011:
These costs were incurred to produce 25,000 units of product. Variable manufacturing overhead
was 80% of the direct materials cost.
In 2012, the direct material and variable overhead costs per unit will increase by 15%, but the
direct labor costs per unit are not expected to change. Fixed manufacturing costs are expected to
increase by 7.5%.
Required:
(a.) Prepare a cost estimate for an activity level of 20,000 units of product in 2012.
(b.) Determine the total product costs per unit for 2011 and 2012.
5-78
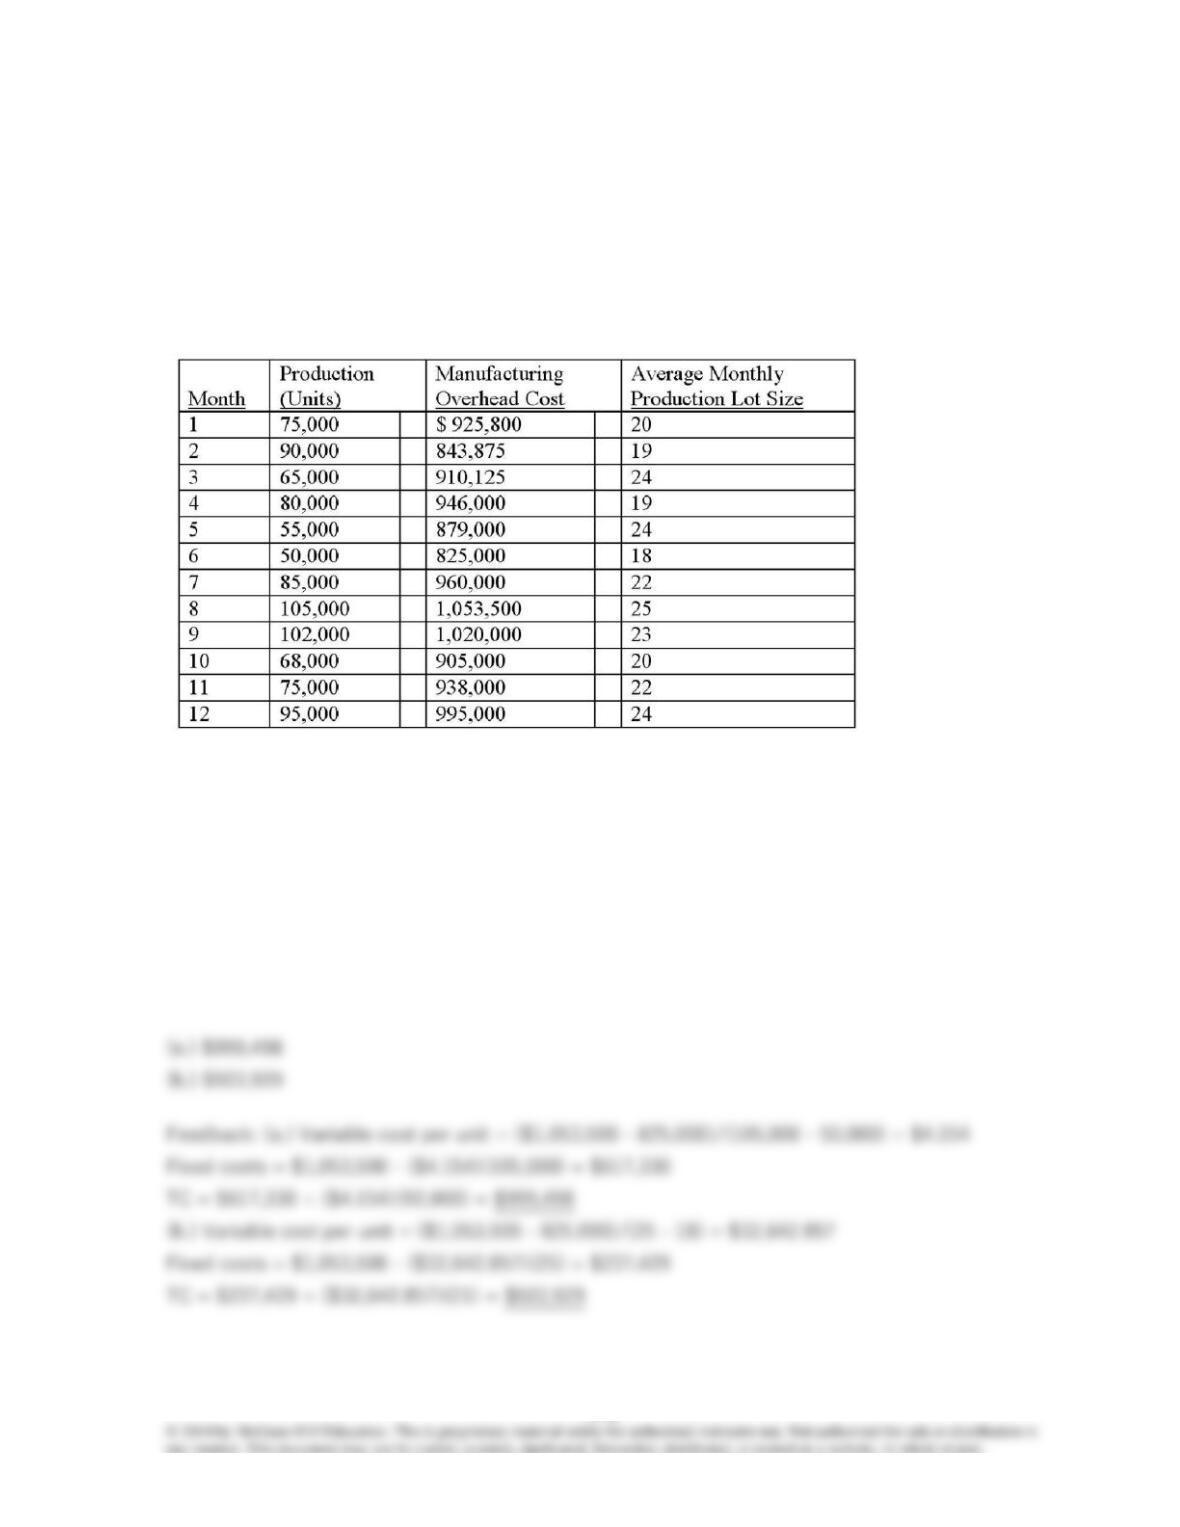
90. The Grind Company has been having some difficulties estimating its manufacturing
overhead costs. In the past, manufacturing overhead costs have been related to production levels.
However, some production managers have indicated that the size of their production lots might
also be having an impact on the amount of their monthly manufacturing overhead costs. In order
to investigate this possibility, the company collected information on its monthly manufacturing
overhead costs, production in units, and average production lot size for 2012.
Required:
(a.) Use the high-low method to estimate next month’s manufacturing overhead costs, assuming
the company is planning to produce 92,000 units.
(b.) Use the high-low method to estimate next month’s manufacturing overhead costs, assuming
the company is planning to run a 21-lot size.
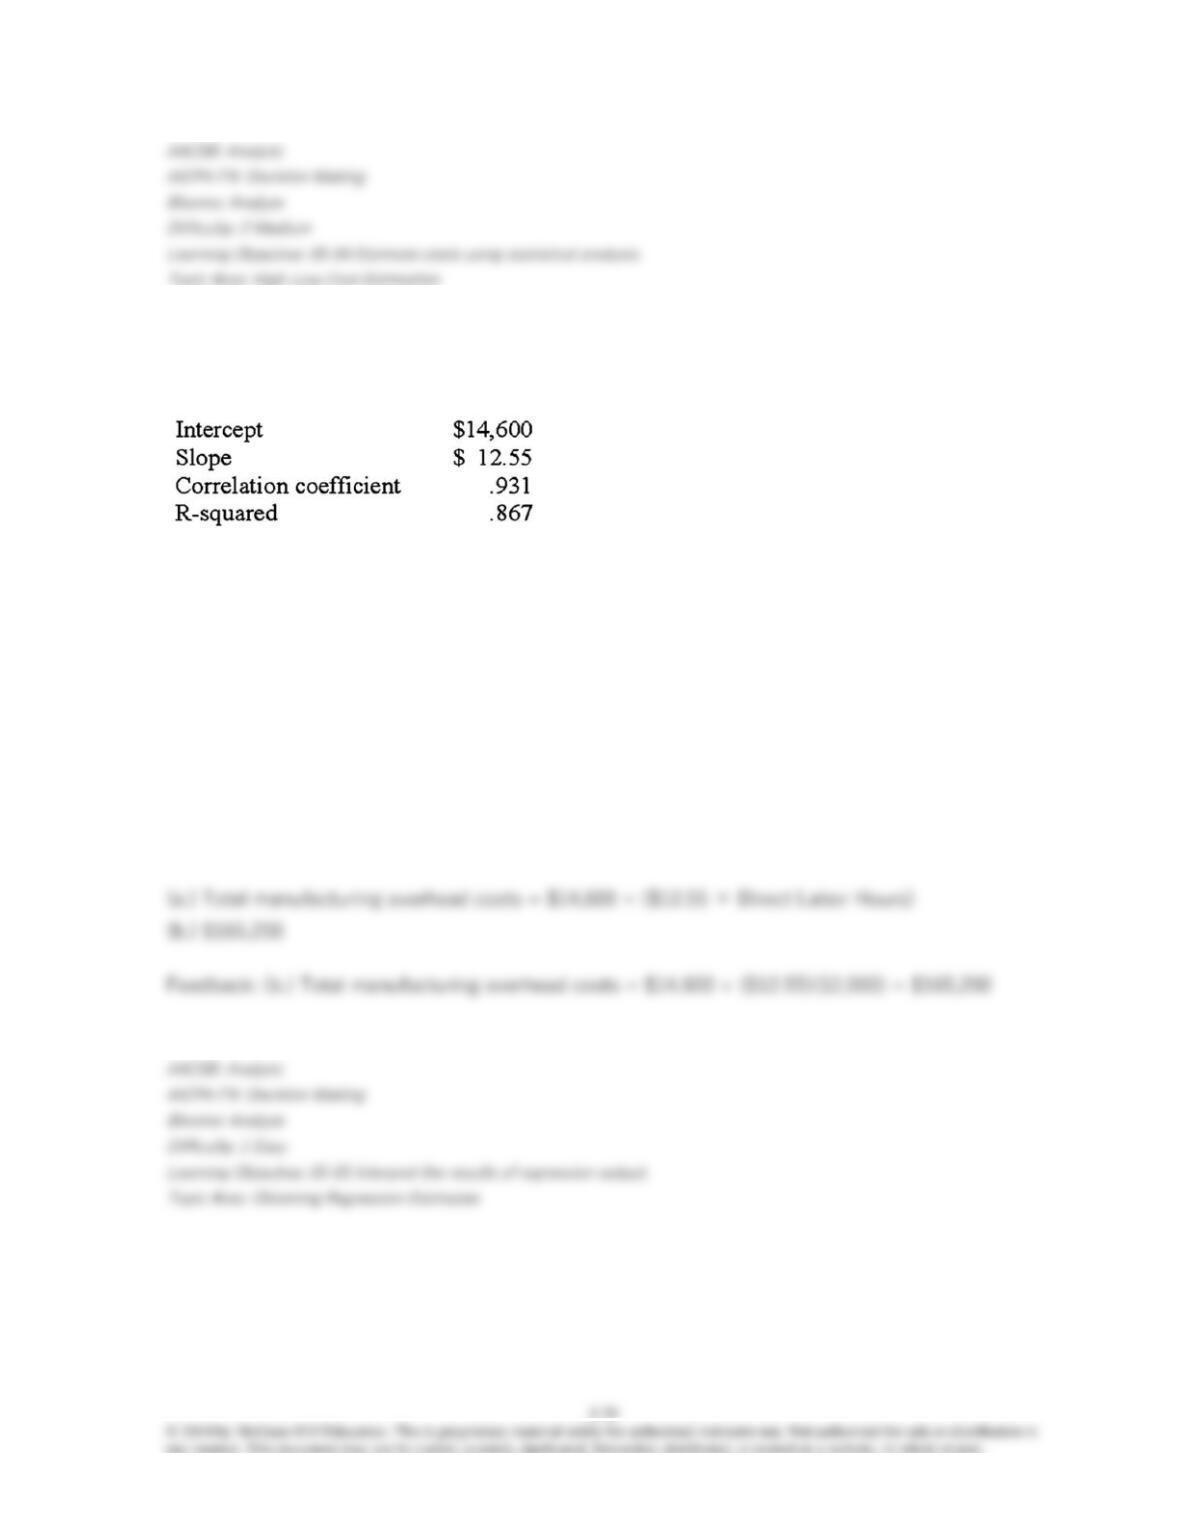
91. A company ran a regression analysis using direct labor hours as the independent variable
and manufacturing overhead costs as the dependent variable. The results are summarized below:
The company is planning on operating at a level that would require 12,000 direct labor hours per
month in the upcoming year.
Required:
(a.) Use the information from the regression analysis to write the cost estimation equation for the
manufacturing overhead costs.
(b.) Compute the estimated manufacturing overhead costs per month for the upcoming year.
5-80
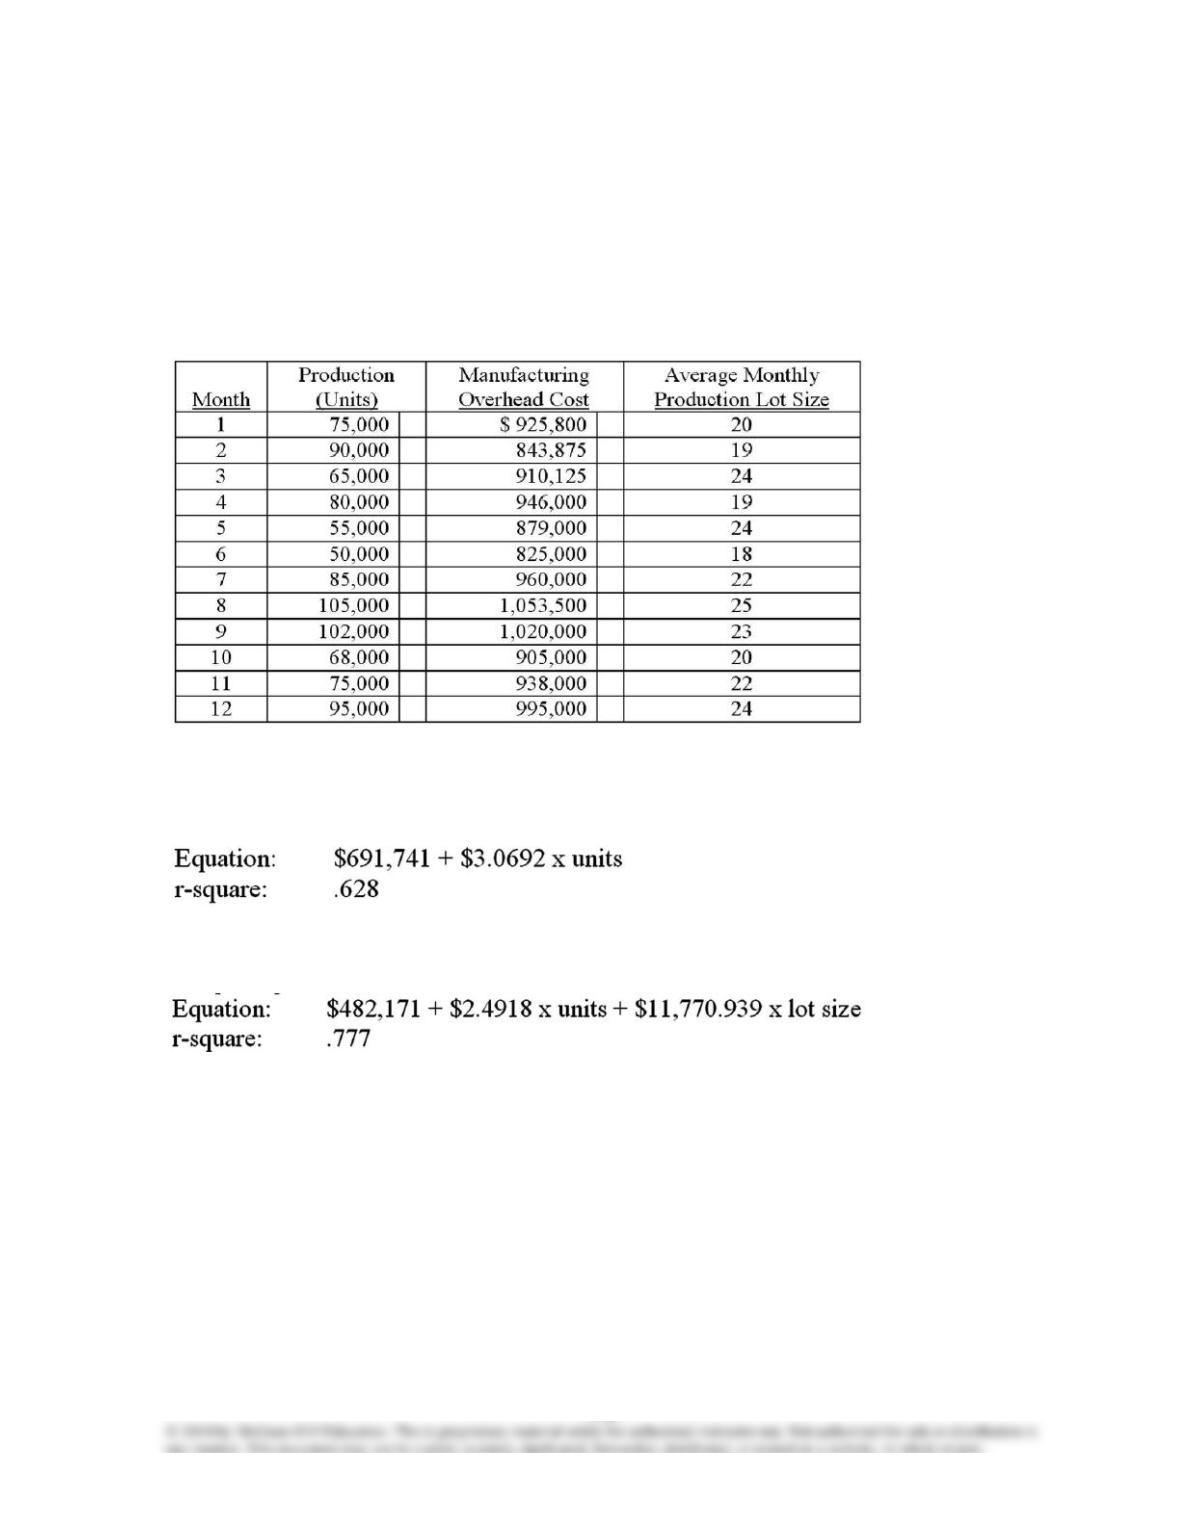
92. The Grind Company has been having some difficulties estimating its manufacturing
overhead costs. In the past, manufacturing overhead costs have been related to production levels.
However, some production managers have indicated that the size of their production lots might
also be having an impact on the amount of their monthly manufacturing overhead costs. In order
to investigate this possibility, the company collected information on its monthly manufacturing
overhead costs, production in units, and average production lot size for 2012.
Regression analysis results of the information presented above are as follows:
Ordinary regression:
Multiple regression:
Required:
(a.) Use the results from the ordinary regression and estimate next month’s manufacturing
overhead costs, assuming the company is planning to produce 92,000 units. (final answer should
be rounded to the nearest whole dollar)
(b.) Use the results from the multiple regression and estimate the next month’s manufacturing
costs, assuming the company is planning to produce 92,000 units with an average lot size of 21.
(final answer should be rounded to the nearest whole dollar)
(c.) Comment on which regression seems to be more appropriate under these circumstances.