Managerial Accounting, 16e (Garrison)
Chapter 5 Cost-Volume-Profit Relationships
1) Incremental analysis is an analytical approach that focuses only on those revenues and costs
that will not change as a result of a decision.
2) When expressed on a per unit basis, fixed costs can mislead decision makers into thinking of
them as variable costs.
3) To estimate what the profit will be at various levels of activity, multiply the number of units to
be sold above or below the break-even point by the unit contribution margin.
4) In a CVP graph (sometimes called a break-even chart), unit volume is represented on the
horizontal (X) axis and dollars on the vertical (Y) axis.
5) On a CVP graph for a profitable company, the total expense line will be steeper than the total
revenue line.
6) In a CVP graph, the anticipated profit or loss at any given level of sales is measured by the
vertical distance between the total revenue line (sales) and the total fixed expense line.
7) A shift in the sales mix from low-margin items to high-margin items will decrease total profits
even though total sales increase.
8) A shift in the sales mix from high-margin items to low-margin items can cause total profits to
decrease even though total sales may increase.
9) In two companies making the same product and with the same total sales and total expenses,
the contribution margin ratio will be lower in the company with a higher proportion of fixed
expenses in its cost structure.
10) If the variable expense per unit decreases, and all other factors remain the same, the
contribution margin ratio will increase.
11) The smaller the contribution margin ratio, the smaller the amount of sales required to cover a
given amount of fixed expenses.
12) For a given level of sales, a low contribution margin ratio will produce more net operating
income than a high contribution margin ratio.
13) If fixed expenses increase by $10,000 per year, then the sales needed to break even will
generally increase by more than $10,000.
14) A decrease in the number of units sold will decrease the break-even point.
15) The break-even point in units can be obtained by dividing total fixed expenses by the unit
contribution margin.
16) The break-even point can be determined by simply adding together all of the expenses from
the income statement.
17) An increase in the number of units sold will decrease a company’s break-even point.
18) For a capital intensive, automated company the break-even point will tend to be higher and
the margin of safety will be lower than for a less capital intensive company with the same sales.
19) The total volume in sales dollars that would be required to attain a given target profit is
determined by dividing the target profit by the contribution margin ratio.
20) Two companies with the same margin of safety in dollars will also have the same total
contribution margin.
21) Fawn Company’s margin of safety is $90,000. If the company’s sales drop by $80,000, it will
still have positive net operating income.
22) The margin of safety is the amount by which sales can decrease before losses are incurred by
the company.
23) The margin of safety percentage is equal to the margin of safety in dollars divided by total
contribution margin.
24) The degree of operating leverage in a company is smallest at the break-even point and
increases as sales rise.
25) The degree of operating leverage is computed by dividing sales by the contribution margin.
26) A company with high operating leverage will experience a larger reduction in net operating
income in a period of declining sales than a company with low operating leverage.
27) A shift in the sales mix from products with high contribution margin ratios toward products
with low contribution margin ratios will raise the break-even point for the company as a whole.
28) If the contribution margin is not sufficient to cover fixed expenses:
A) total profit equals total expenses.
B) contribution margin is negative.
C) a loss occurs.
D) variable expenses equal contribution margin.
29) Which of the following statements is correct with regard to a CVP graph?
A) A CVP graph shows the maximum possible profit.
B) A CVP graph shows the break-even point as the intersection of the total sales revenue line
and the total expense line.
C) A CVP graph assumes that total expense varies in direct proportion to unit sales.
D) A CVP graph shows the operating leverage as the gap between total sales revenue and total
expense at the actual level of sales.
30) Which of the following is correct? The break-even point occurs on the CVP graph where:
A) total profit equals total expenses.
B) total profit equals total fixed expenses.
C) total contribution margin equals total fixed expenses.
D) total variable expenses equal total contribution margin.
31) Which of the following is true regarding the contribution margin ratio of a company that
produces only a single product?
A) As fixed expenses decrease, the contribution margin ratio increases.
B) The contribution margin ratio multiplied by the selling price per unit equals the contribution
margin per unit.
C) The contribution margin ratio will decline as unit sales decline.
D) The contribution margin ratio equals the selling price per unit less the variable expense ratio.
32) Mossfeet Shoe Corporation is a single product firm. The company is predicting that a price
increase next year will not cause unit sales to decrease. What effect would this price increase
have on the following items for next year?
Contribution
Margin Ratio
Break-even
Point
A)
Increase
Decrease
B)
Decrease
Decrease
C)
Increase
No effect
D)
Decrease
No effect
A) Choice A
B) Choice B
C) Choice C
D) Choice D
33) If a company increases its selling price by $2 per unit due to an increase in its variable labor
cost of $2 per unit, the break-even point in units will:
A) decrease.
B) increase.
C) not change.
D) change but direction cannot be determined.
34) Break-even analysis assumes that:
A) Total revenue is constant.
B) Unit variable expense is constant.
C) Unit fixed expense is constant.
D) Selling prices must fall in order to generate more revenue.
35) Which of the following would not affect the break-even point?
A) number of units sold
B) variable expense per unit
C) total fixed expense
D) selling price per unit
36) A $2.00 increase in a product’s variable expense per unit accompanied by a $2.00 increase in
its selling price per unit will:
A) decrease the degree of operating leverage.
B) decrease the contribution margin.
C) have no effect on the break-even volume.
D) have no effect on the contribution margin ratio.
37) To obtain the dollar sales volume necessary to attain a given target profit, which of the
following formulas should be used?
A) (Fixed expenses + Target net profit)/Total contribution margin
B) (Fixed expenses + Target net profit)/Contribution margin ratio
C) Fixed expenses/Contribution margin per unit
D) Target net profit/Contribution margin ratio
38) If sales volume increases and all other factors remain constant, then the:
A) contribution margin ratio will increase.
B) break-even point will decrease.
C) margin of safety will increase.
D) net operating income will decrease.
39) If the degree of operating leverage is 4, then a one percent change in quantity sold should
result in a four percent change in:
A) unit contribution margin.
B) revenue.
C) variable expense.
D) net operating income.
40) Which of the following is an assumption underlying standard CVP analysis?
A) In multiproduct companies, the sales mix is constant.
B) In manufacturing companies, inventories always change.
C) The price of a product or service is expected to change as volume changes.
D) Fixed expenses will change as volume increases.
41) Rovinsky Corporation, a company that produces and sells a single product, has provided its
contribution format income statement for November.
Sales (5,700 units)
$
319,200
Variable expenses
188,100
Contribution margin
131,100
Fixed expenses
106,500
Net operating income
$
24,600
If the company sells 5,300 units, its net operating income should be closest to:
A) $24,600
B) $2,200
C) $22,874
D) $15,400
42) Sorin Inc., a company that produces and sells a single product, has provided its contribution
format income statement for January.
Sales (4,200 units)
$
155,400
Variable expenses
100,800
Contribution margin
54,600
Fixed expenses
42,400
Net operating income
$
12,200
If the company sells 4,600 units, its total contribution margin should be closest to:
A) $54,600
B) $59,800
C) $69,400
D) $13,362
43) Schister Systems uses the following data in its Cost-Volume-Profit analyses:
Total
Sales
$
400,000
Variable expenses
280,000
Contribution margin
120,000
Fixed expenses
100,000
Net operating income
$
20,000
What is total contribution margin if sales volume increases by 20%?
A) $80,000
B) $158,400
C) $200,000
D) $144,000
44) Kelchner Corporation has provided the following contribution format income statement.
Assume that the following information is within the relevant range.
Sales (3,000 units)
$
180,000
Variable expenses
108,000
Contribution margin
72,000
Fixed expenses
62,400
Net operating income
$
9,600
The contribution margin ratio is closest to:
A) 67%
B) 40%
C) 33%
D) 60%
45) Nocum Corporation has provided the following contribution format income statement.
Assume that the following information is within the relevant range.
Sales (3,000 units)
$
120,000
Variable expenses
90,000
Contribution margin
30,000
Fixed expenses
21,000
Net operating income
$
9,000
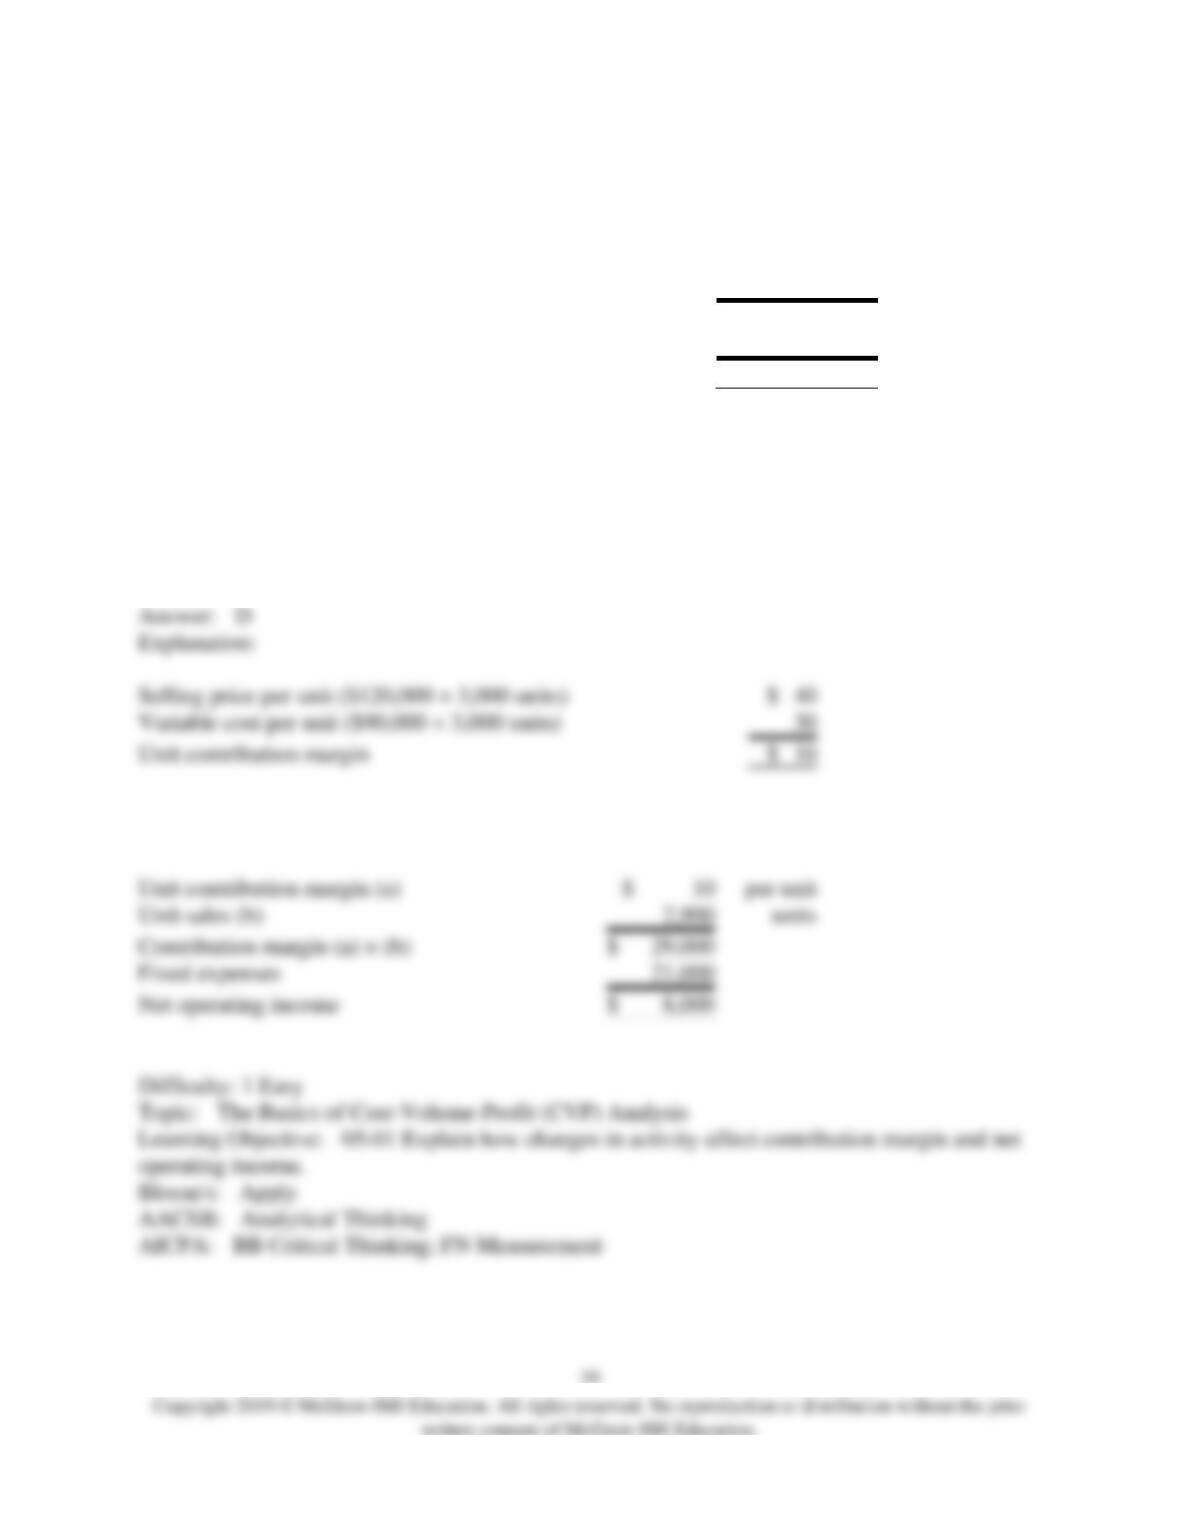
If sales decline to 2,900 units, the net operating income would be closest to:
A) $29,000
B) $1,000
C) $8,700
D) $8,000
Selling price per unit ($120,000 ÷ 3,000 units)
40
Variable cost per unit ($90,000 ÷ 3,000 units)
30
Unit contribution margin
10
Unit contribution margin (a)
$
Unit sales (b)
Contribution margin (a) × (b)
$
Fixed expenses
Net operating income
$
46) Stauffer Corporation has provided the following contribution format income statement.
Assume that the following information is within the relevant range.
Sales (8,000 units)
$
320,000
Variable expenses
192,000
Contribution margin
128,000
Fixed expenses
118,400
Net operating income
$
9,600
The variable expense ratio is closest to:
A) 60%
B) 40%
C) 67%
D) 33%