
125. The following narrative describes the order entry process at Adams, Inc.:
Narrative Description
Adams, Inc. customers mail their orders to the Adams customer service center where clerks open the orders and
review them for accuracy. The clerks then key orders into the computer. As the clerk is entering data the
computer populates the order input screen with data from the applicable customer and inventory master data.
The computer displays the completed order and the clerk reviews the order (assume there are no discrepancies)
and then accepts the order (selects the “save” icon on the input screen). The computer then creates a sales order
master record, updates the inventory master data to allocate inventory to the sales order, prints a picking ticket
in the warehouse, and displays the sales order number to the customer service center clerk. The clerk then reads
this number to the customer.
Required:
a.
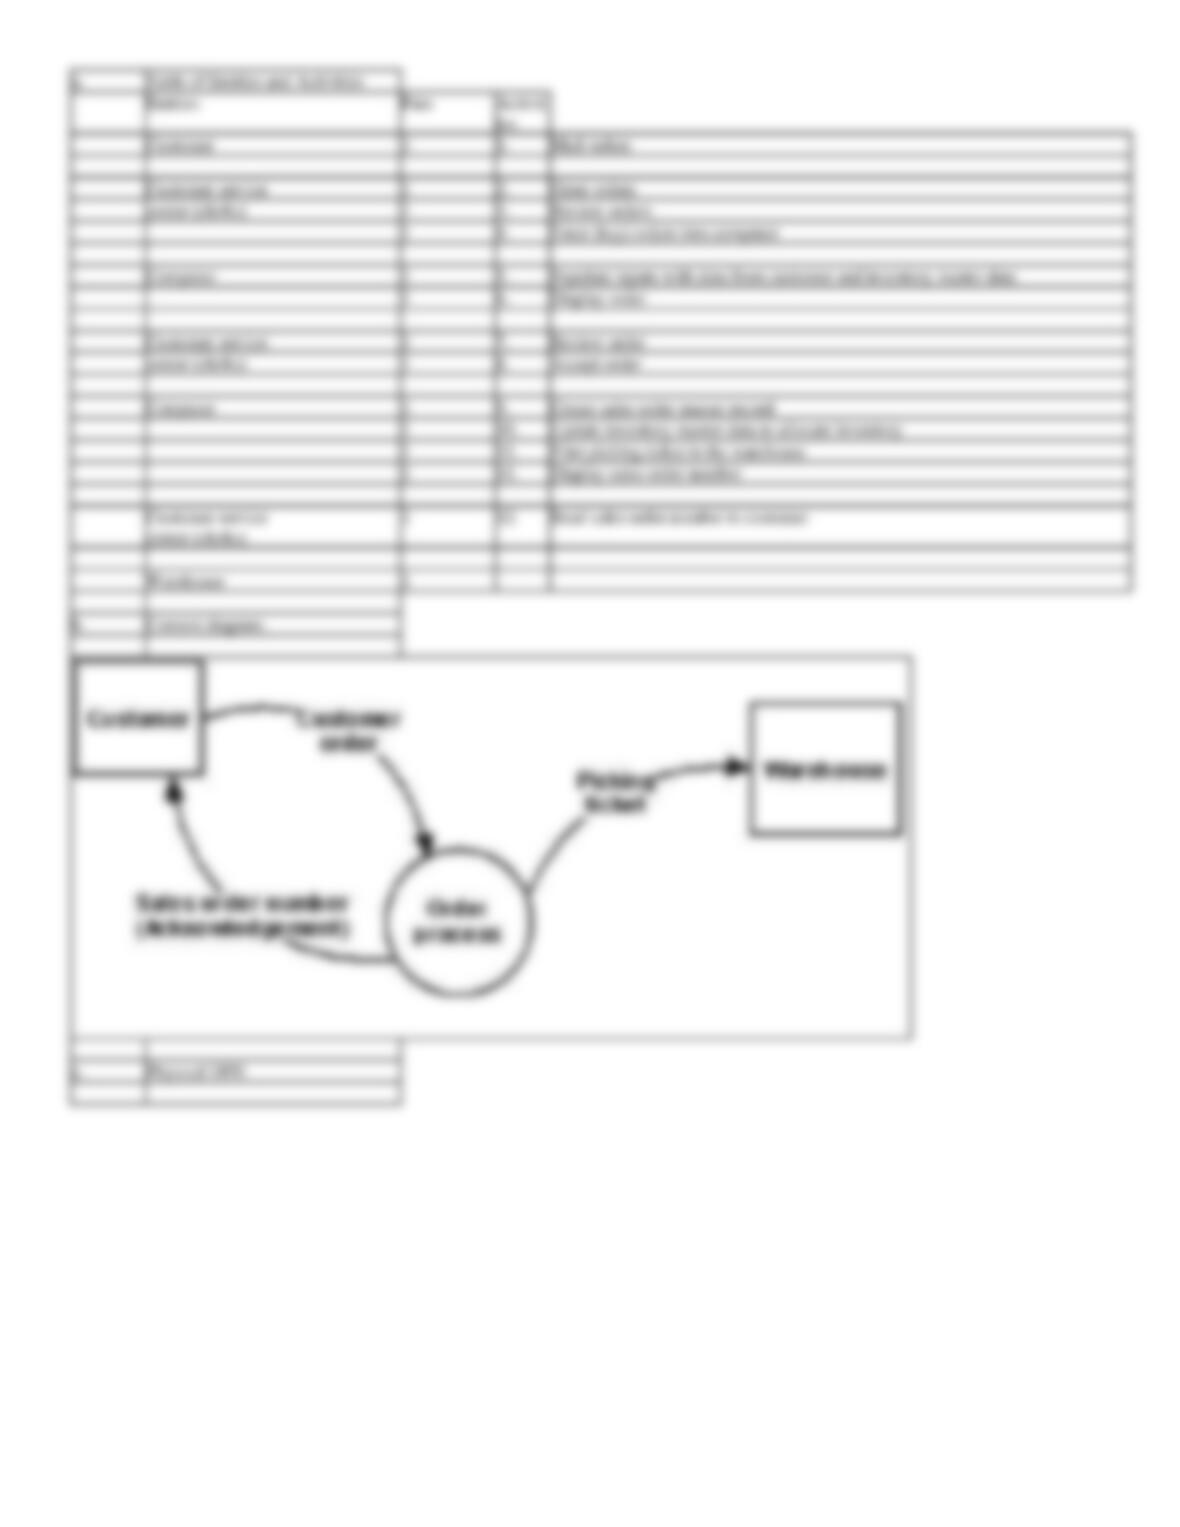
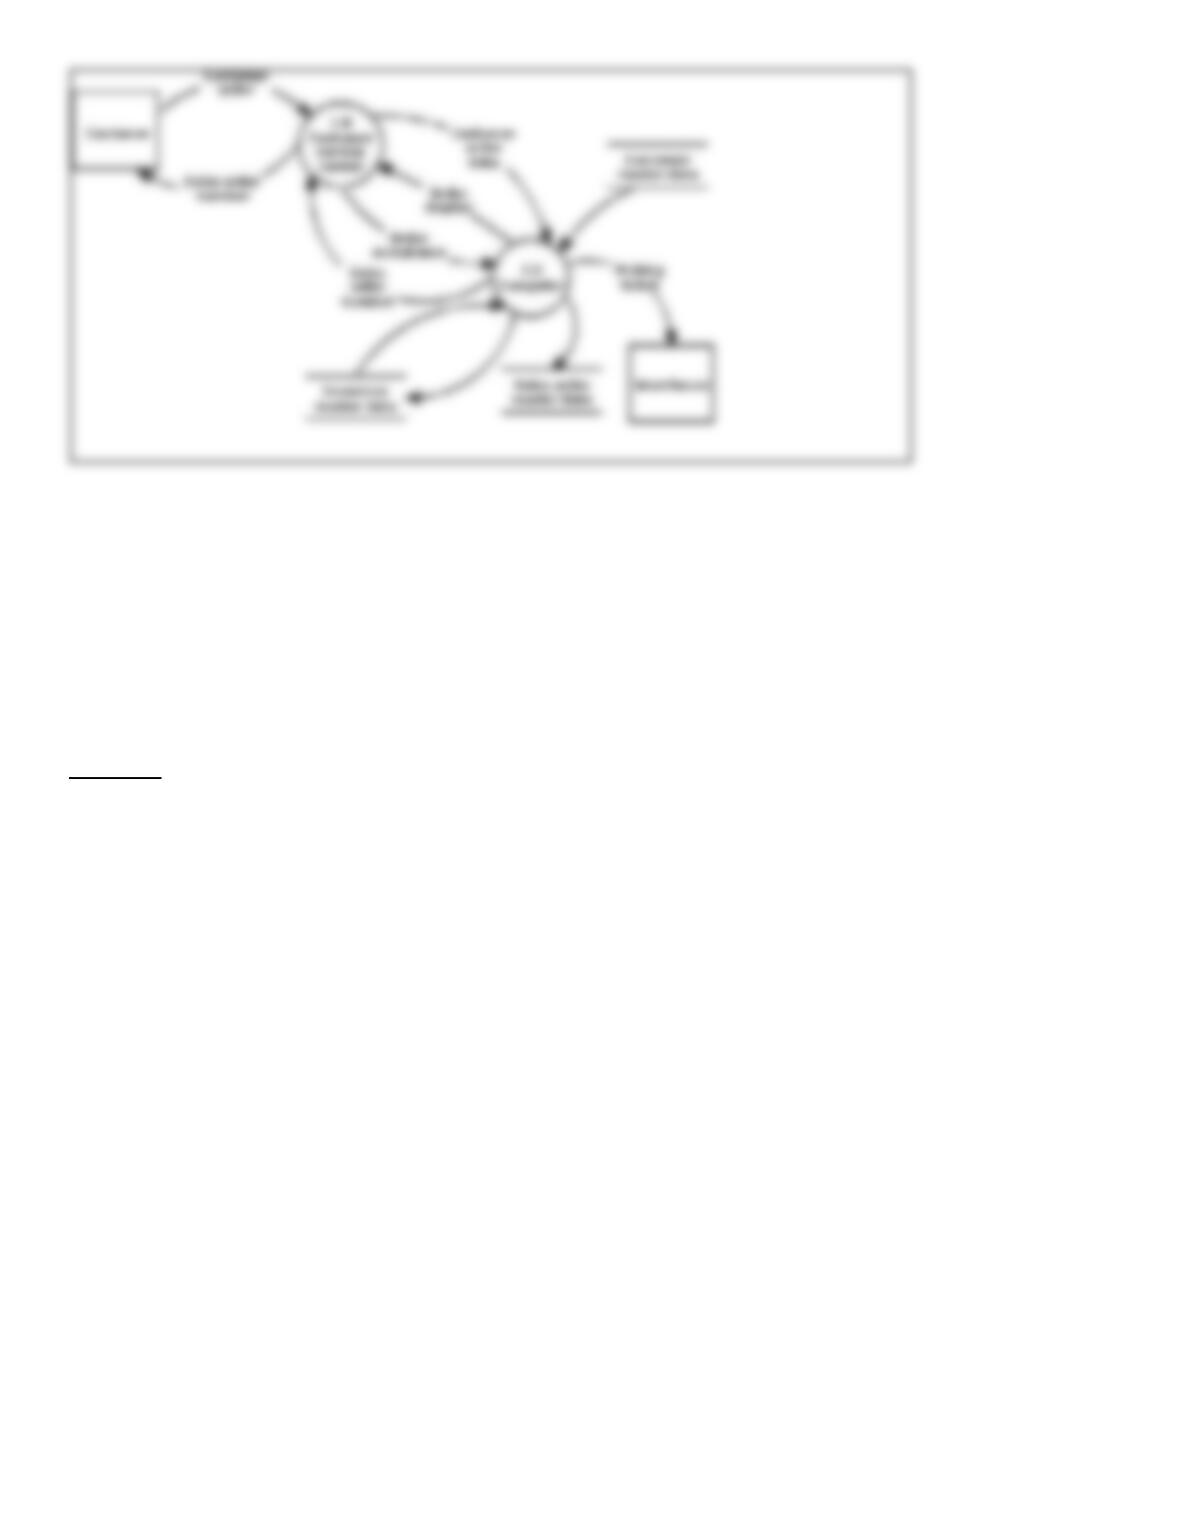
Prepare a table of entities and activities.
b.
Prepare a context diagram.
c.
Prepare a physical data flow diagram.

126. Adams, Inc. customers mail their orders to the Adams customer service center where clerks open the
orders and review them for accuracy. The clerks then key orders into the computer. As the clerk is entering data
the computer populates the order input screen with data from the applicable customer and inventory master
data. The computer displays the completed order and the clerk reviews the order (assume there are no
discrepancies) and then accepts the order (selects the “save” icon on the input screen). The computer then
creates a sales order master record, updates the inventory master data to allocate inventory to the sales order,
prints a picking ticket in the warehouse, and displays the sales order number to the customer service center
clerk. The clerk then reads this number to the customer.
Required:
a.
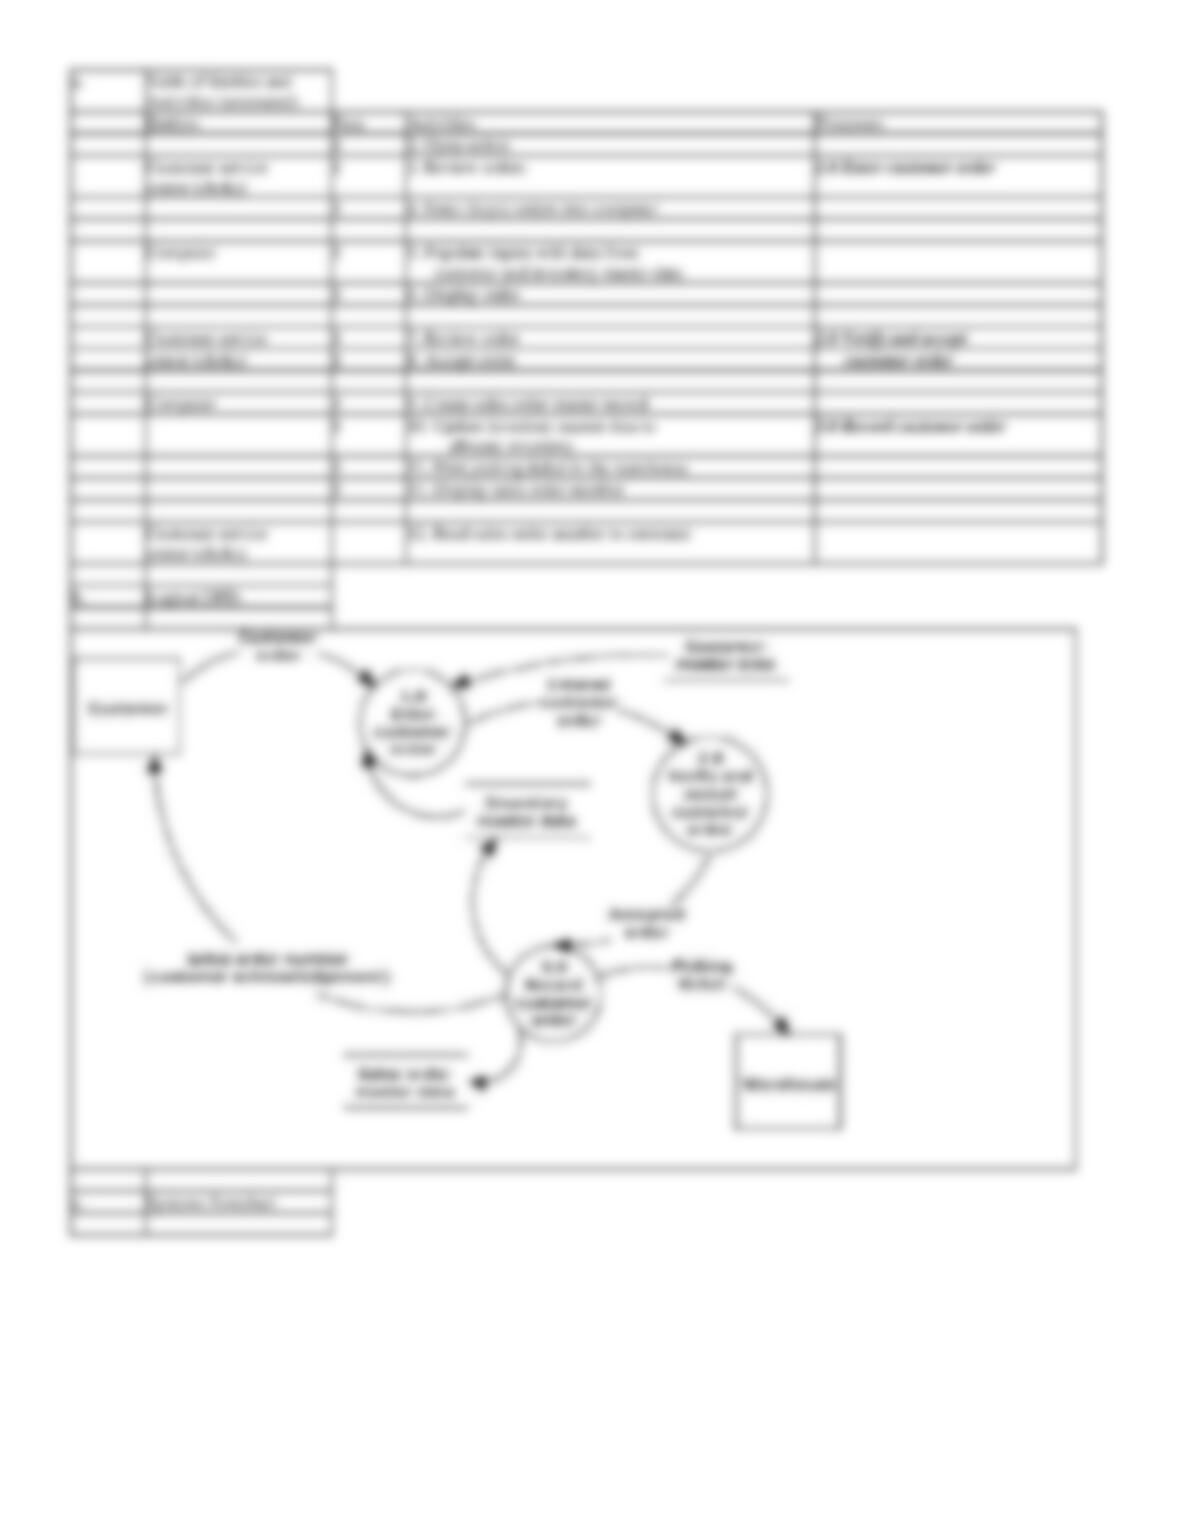
Prepare an annotated table of entities and activities. Indicate on this table the groupings¾bubble numbers and bubble titles¾to be used
in preparing the level 0 logical data flow diagram.
b.
Prepare a logical data flow diagram (level 0 only). The context diagram of this billing system shows two external entities: customers
and the shipping department.
c.
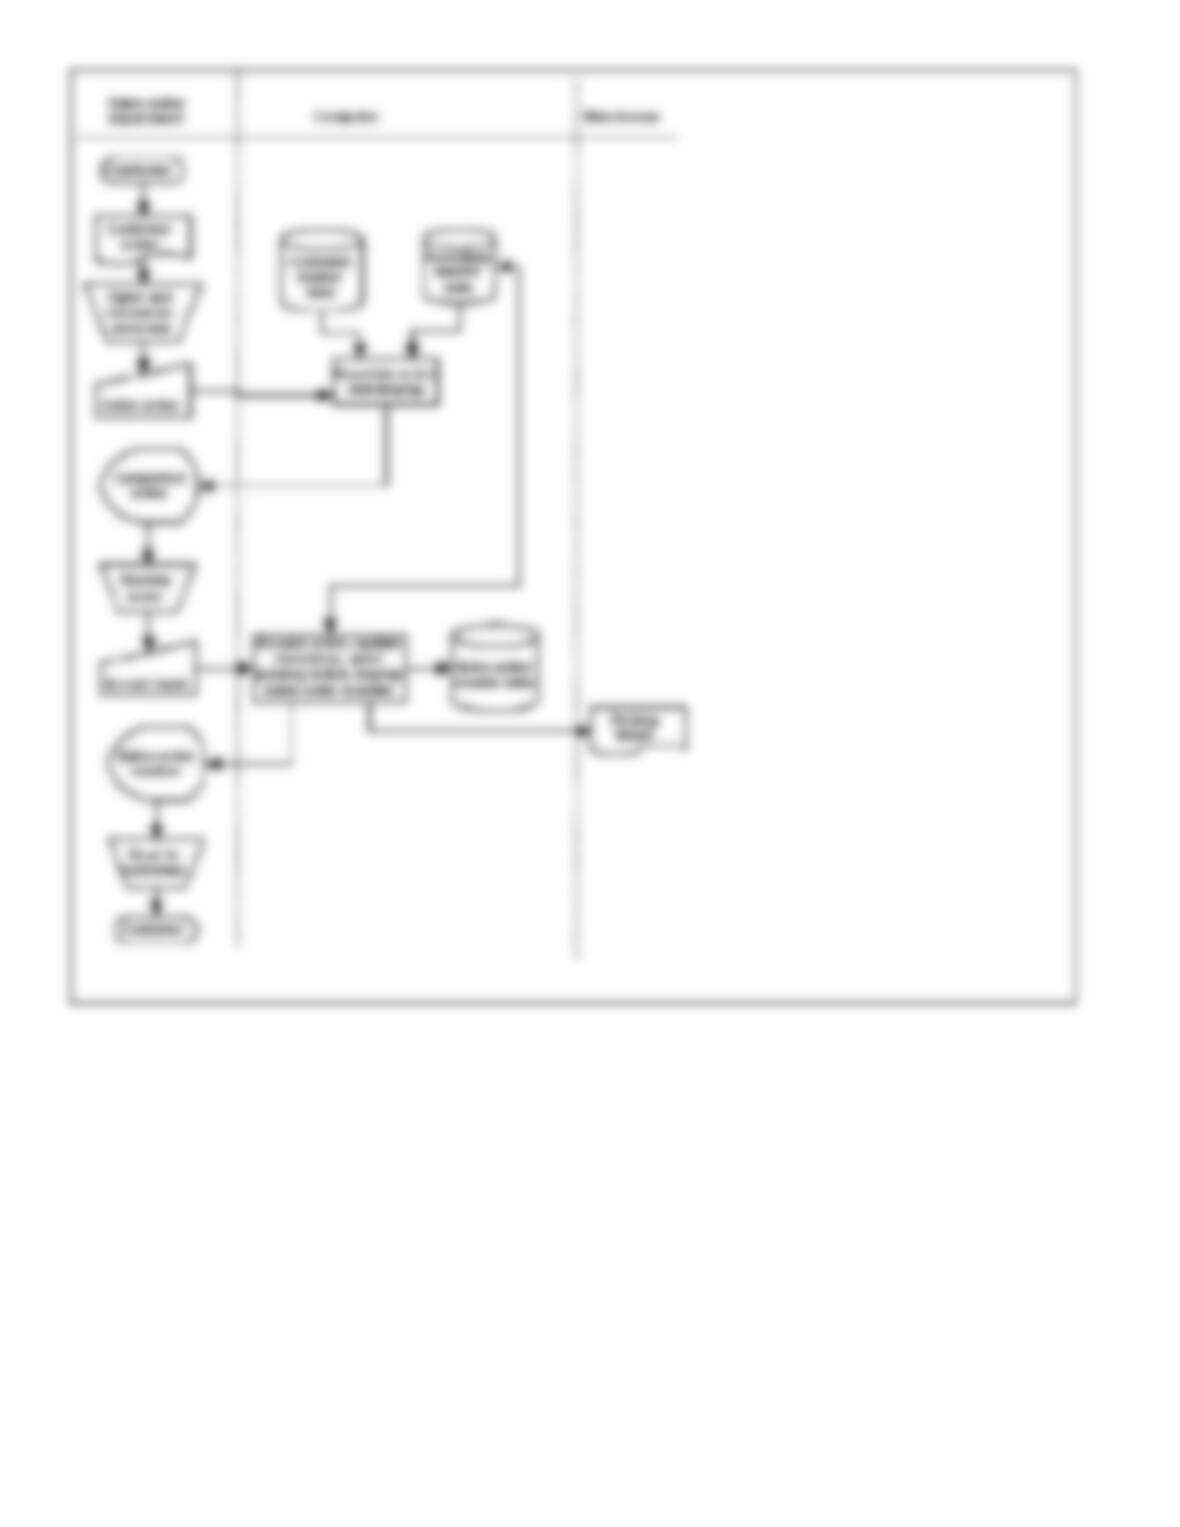
Prepare a systems flowchart.

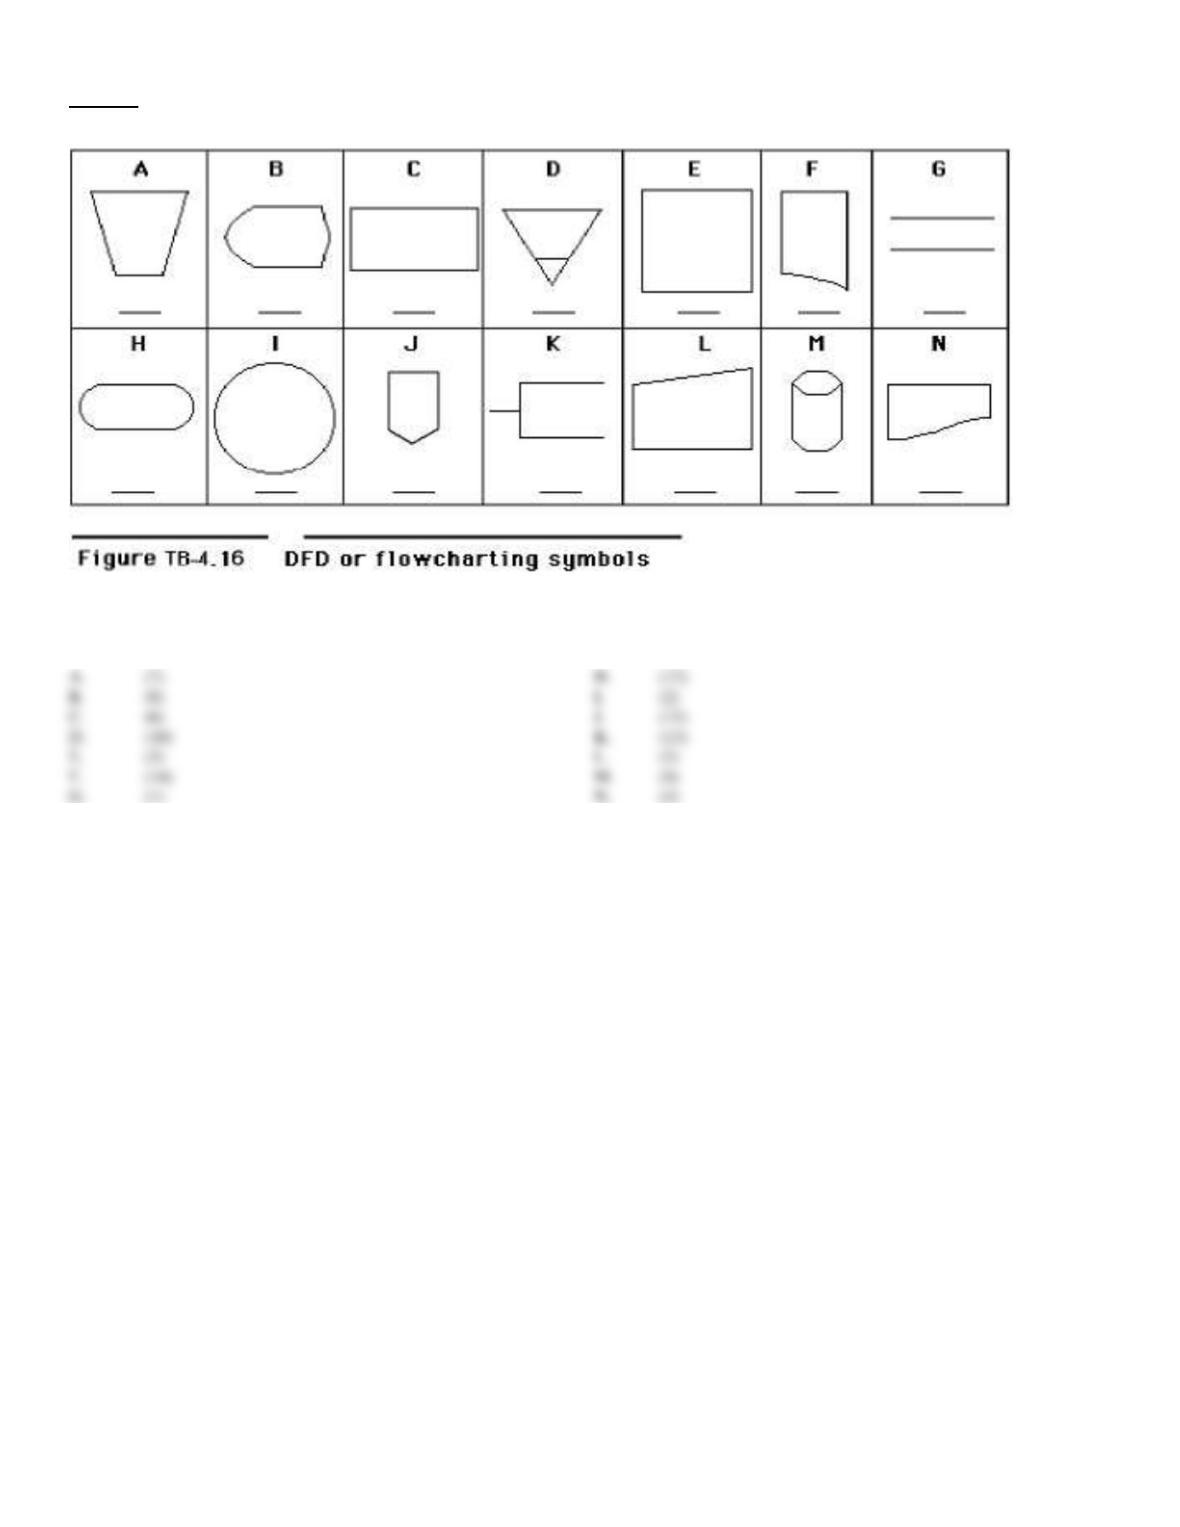
127. The figure below contains 14 symbols used in constructing data flow diagrams or system flowcharts. Each
symbol has been assigned a capital letter (A through N) for identification in this problem. The following is a list
of 14 data flow diagram or flowcharting symbols:
(1)
Data store (in a data flow diagram)
(8)
Display
(2)
Entity or process (in a data flow diagram)
(9)
Disk
(3)
External entity (in a data flow diagram)
(10)
Paper file
(4)
Document
(11)
Off-page connector
(5)
Manual keying
(12)
Start/stop
(6)
Computer process
(13)
Annotation
(7)
Manual process
(14)
Batch total
Required:
Match each symbol to its corresponding description by writing the description number below the each symbol.
128. For each of the following, indicate whether it is a characteristic of a
A.
physical data flow diagram
B.
logical data flow diagram
C.
systems flowchart
1.
A graphical representation of a system showing the system’s processes, data stores, and the flows of data into and out of the processes
and data stores.
2.
Used by auditors and managers to understand a system and to analyze a system’s controls.
3.
Depicts a system’s infrastructure.
4.
Depicts the sequence of activities performed as the business events flow through the process.
5.
Includes the operations process and management context for a system.
6.
Labels on flows of data describe the nature of the data but not how the data are transmitted.
7.
Presents a logical and physical rendering of the who, what, how, and where of information and operations processes.
8.
Processes are labeled with nouns.
9.
Processes are labeled with verbs.
10.
Provides a complete picture of a system by combining the physical and logical aspects of the system.
11.
Represents what activities the system is performing, but not how, where or by whom.
12.
Specifies where, how, and by whom a system’s processes are accomplished.
A.
(7)
H.
(12)
B.
(8)
(2)
(6)
(11)
D.
(10)
K.
(13)
(3)
(5)
(14)
(9)
(1)
(4)

129. Compare and contrast the description and use of physical data flow diagrams and logical data flow
diagrams.