108. A(n) ______________________________ is a data flow that leaves a bubble but does not go to any other
bubble or data store.
109. When we document a(n) ______________________________ system, the central computer will have one
data store/disk symbol.
110. A(n) ______________________________ depicts a system and all of its activities as a single bubble.
111. A(n) ______________________________ is a graphical representation of a system showing the system’s
internal and external entities and flows of data into and out of those entities.
112. A(n) ______________________________ is a graphical representation of a system showing the system
processes, data stores, and flows of data into and out of the processes and data stores.
113. A(n) ______________________________ is a graphical representation of a business process, including
information processes and the related operations processes.
114. Containing manual and computer activities, the ______________________________ presents a logical
and physical rendering of the who, what, how, and where of information and business processes.
115. A(n) ______________________________ is often referred to as a process flowchart or business process
flowchart.
116. A(n) ______________________________ can include actions related to data (send, transform, file or
store, retrieve from storage, or receive) or to an operations process.
117. A(n) ______________________________ process activities might include picking goods in the warehouse
inspecting goods at the receiving dock, or counting cash.
118. A(n) ______________________________ is a graphical representation of a system that depicts a system’s
components; the data flows among the components; and the sources, destination, and storage of data.
119. Data entering from outside a system is depicted on a data flow diagram (DFD) as coming from a(n)
______________________________ entity.
120. Data leaving for outside a system is depicted on a data flow diagram (DFD) as going to a(n)
______________________________ entity.
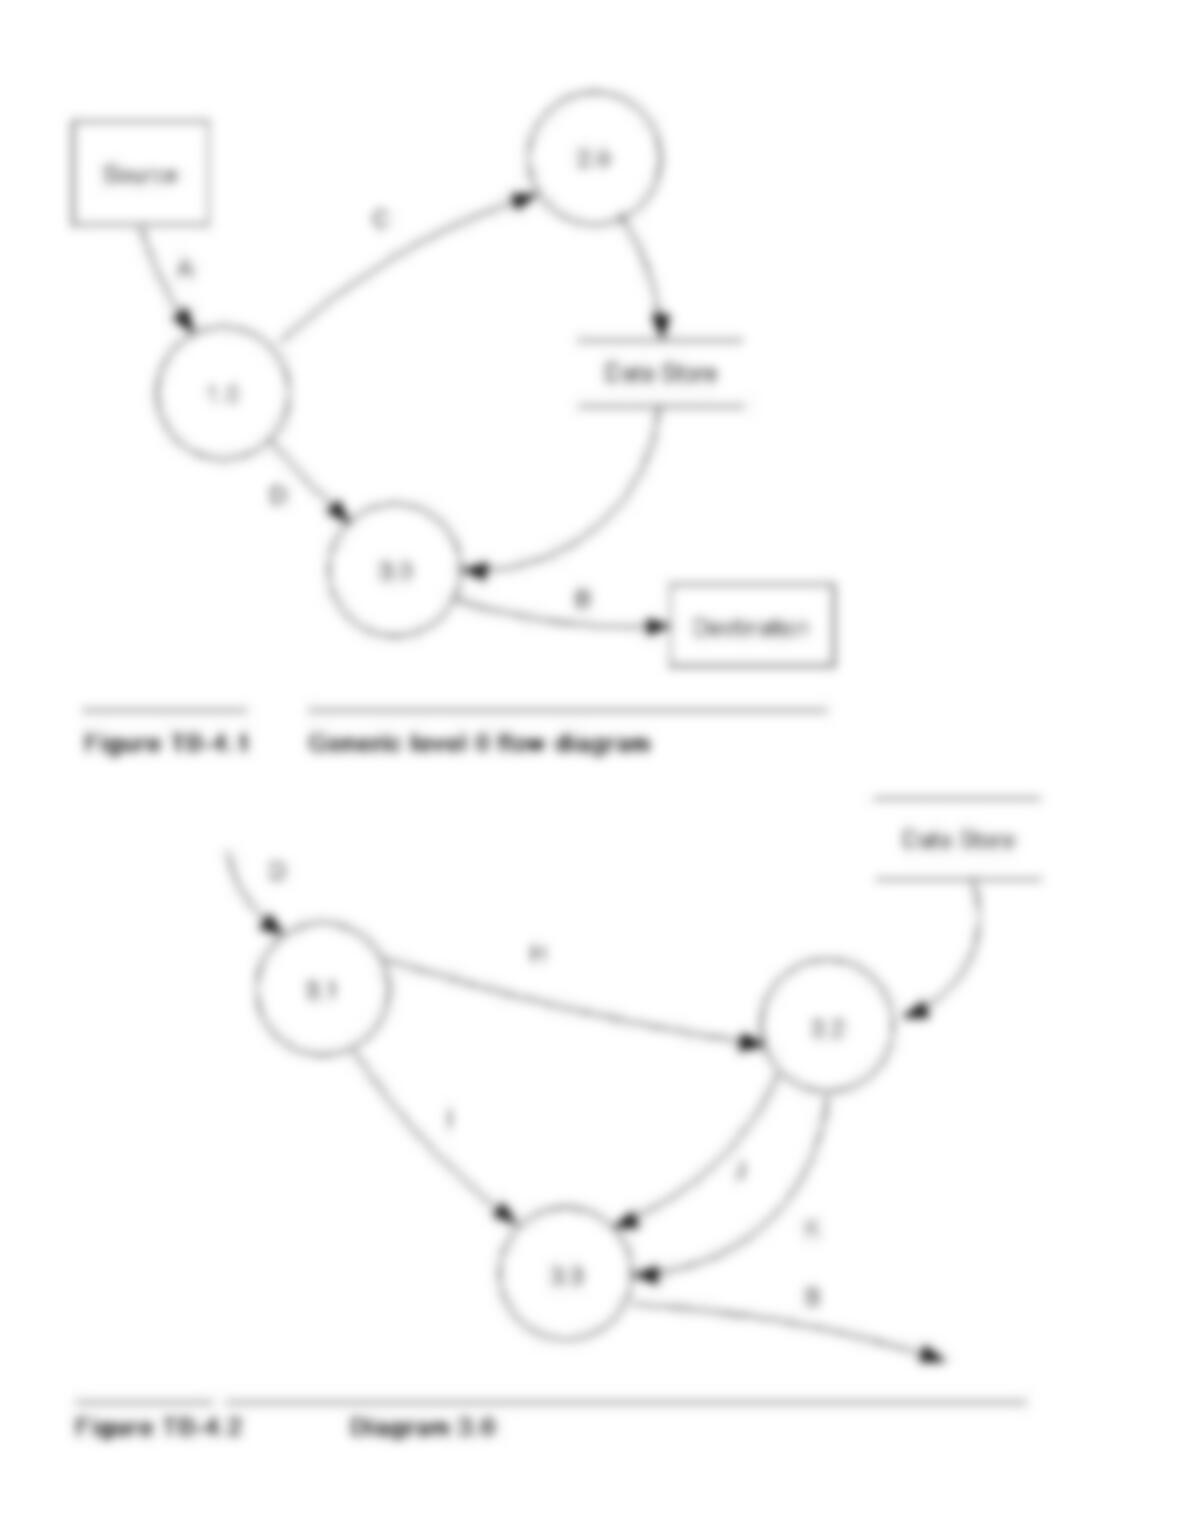
121. Figure TB-4.1 is a “generic” level 0 data flow diagram (DFD), taken from Figure 4.5 in the text.
Required:
Using good data flow diagram construction techniques draw a diagram to explode bubble 3.0 to its next lower
level. Diagram 3.0 should contain three processes, appropriately numbered, and should contain the following
data flows in addition to those in the level 0 diagram (see NOTE):
a.
Flow H runs from the first process to the second.
b.
Flow I runs from the first process to the third.
c.
Flows J and K run from the second process to the third.
1.
Flow D runs to the first process in diagram 3.0.
Flow B runs from the third process in diagram 3.0.
The data flow running from the data store runs to the second process in diagram 3.0.

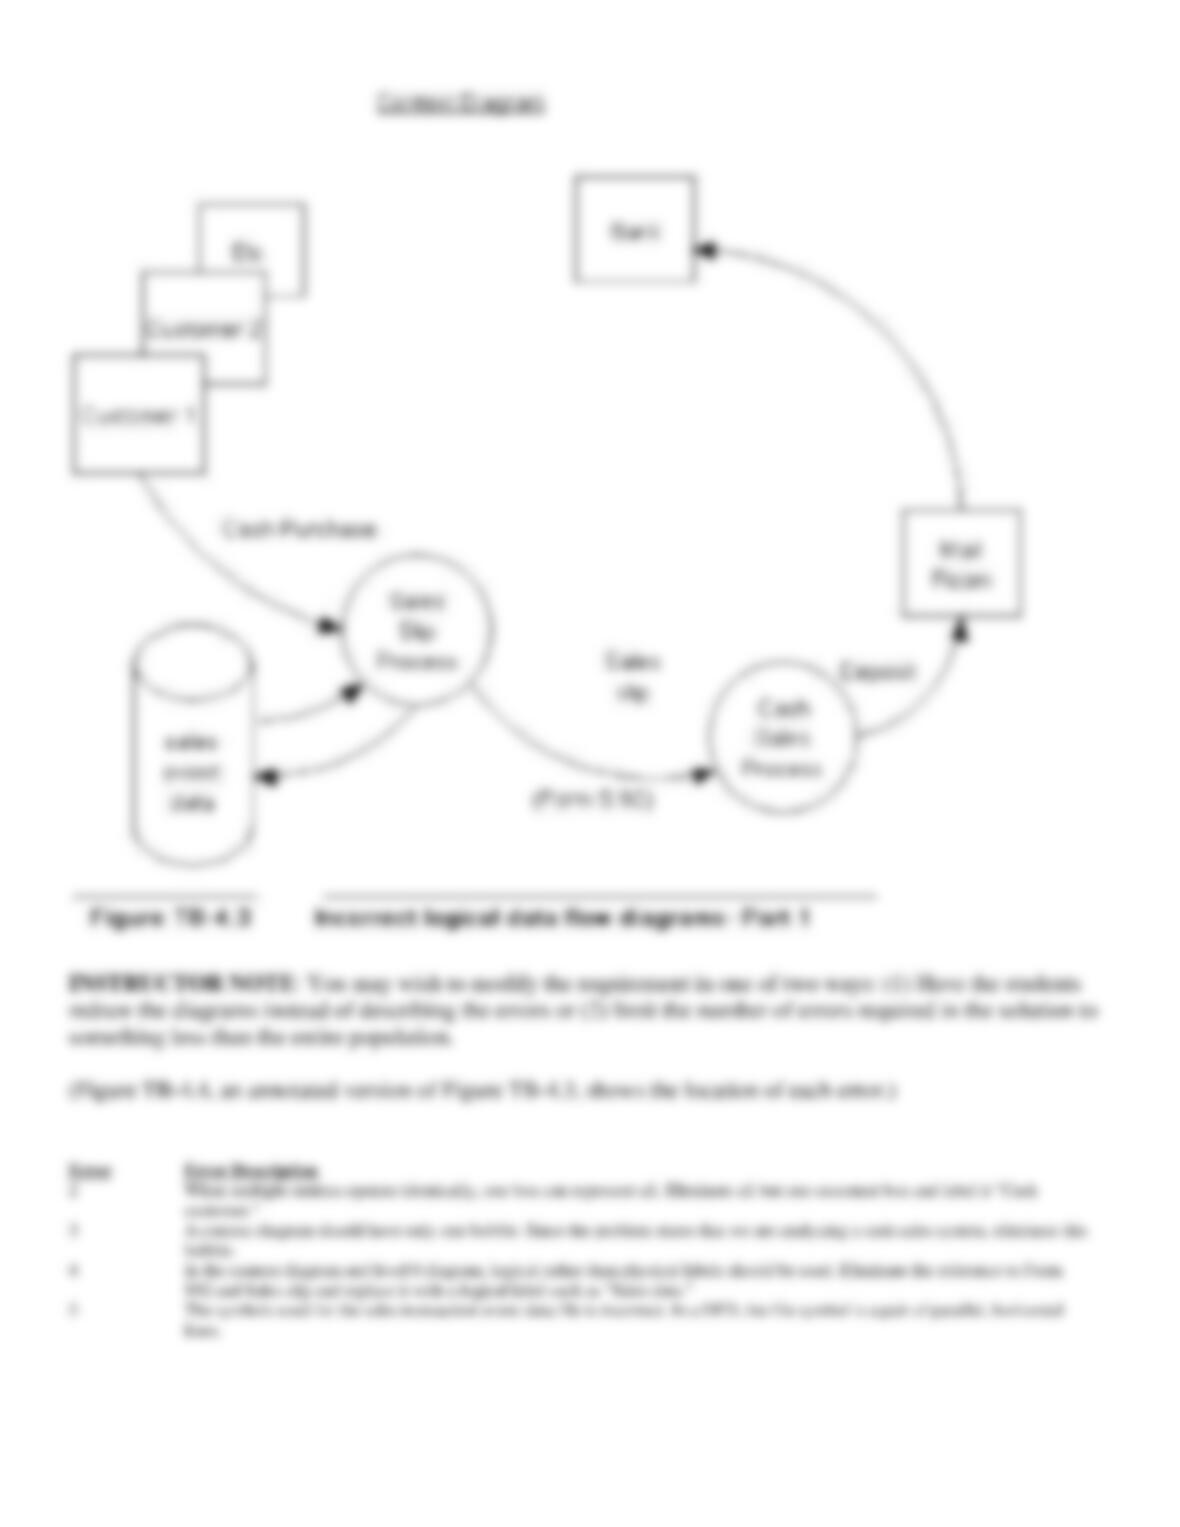
122. Figure TB-4.3 shows a context diagram of a cash sales system. The diagram intentionally violates several
of the guidelines and other techniques presented in the text for drawing data flow diagrams.
Required:
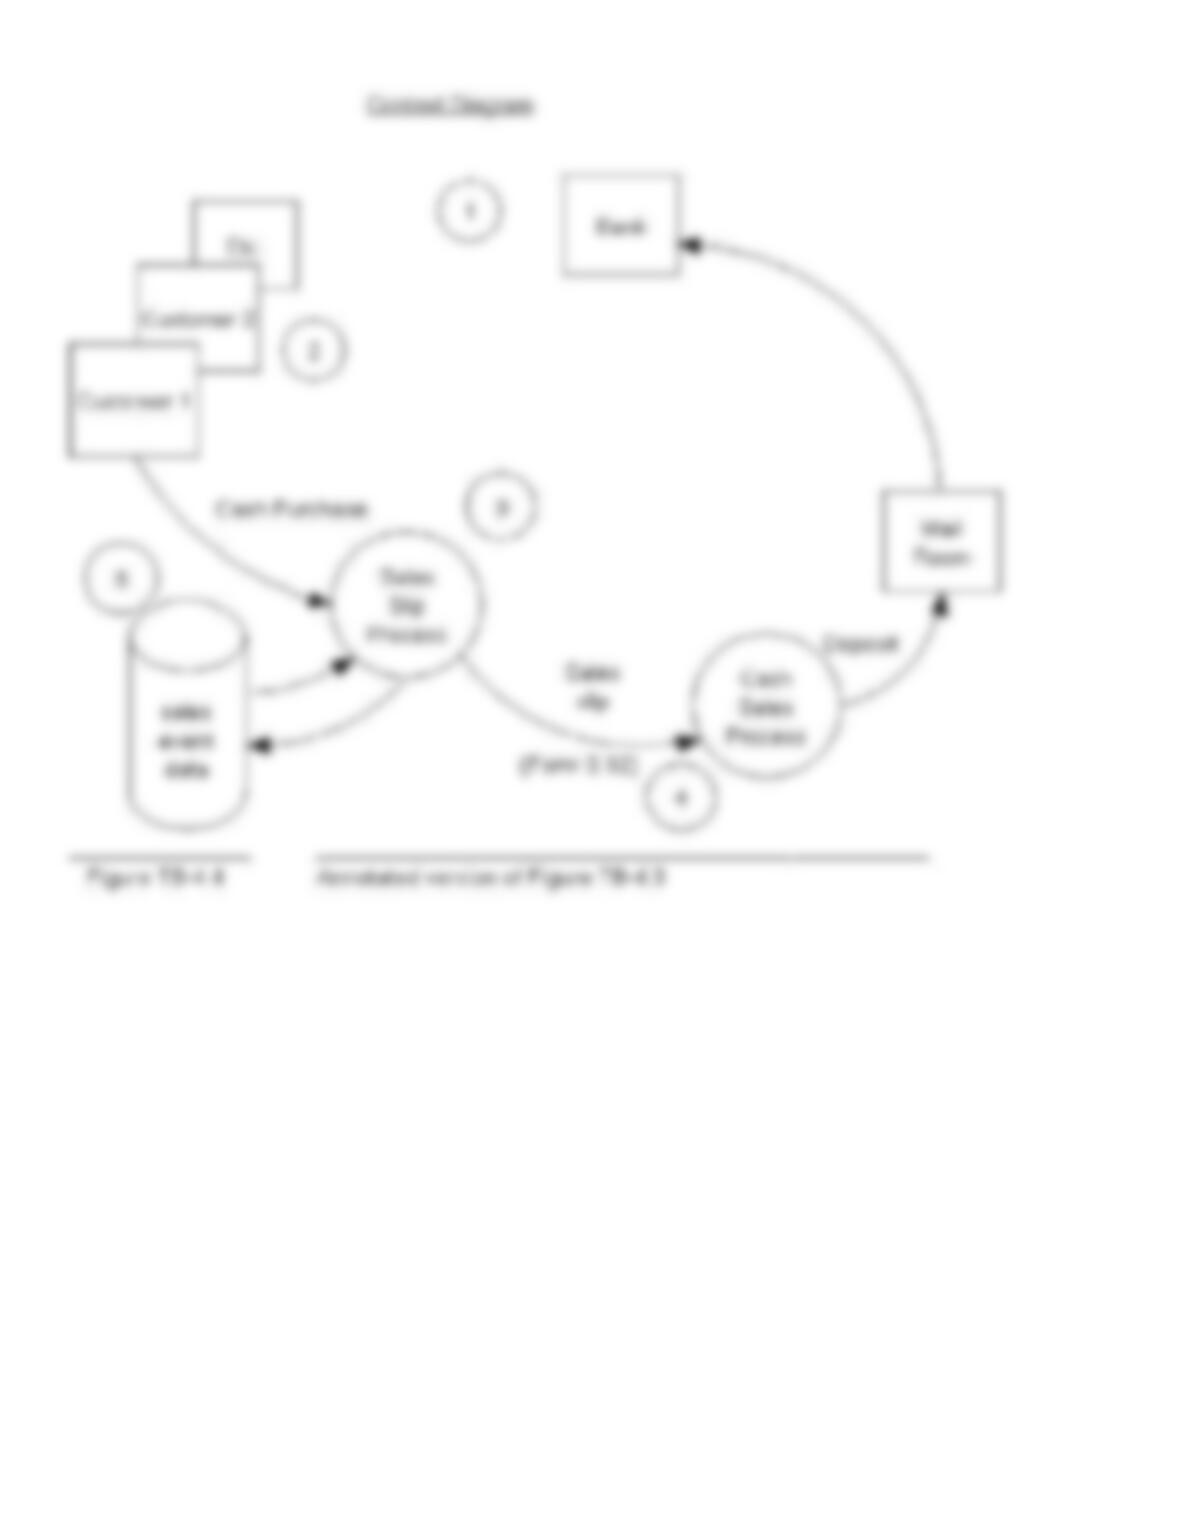
Identify as many of the errors in data flow diagram construction as you can. In the diagram, place consecutive
numbers (each in a circle) next to the points at which the errors exist. On your solution sheet, list the numbers
and write a one- to two-sentence description of each error and what the correct procedure should be. Error 1 is
provided as an example of how to construct the solution (but you must place the circled number 1 on your
solution diagram).
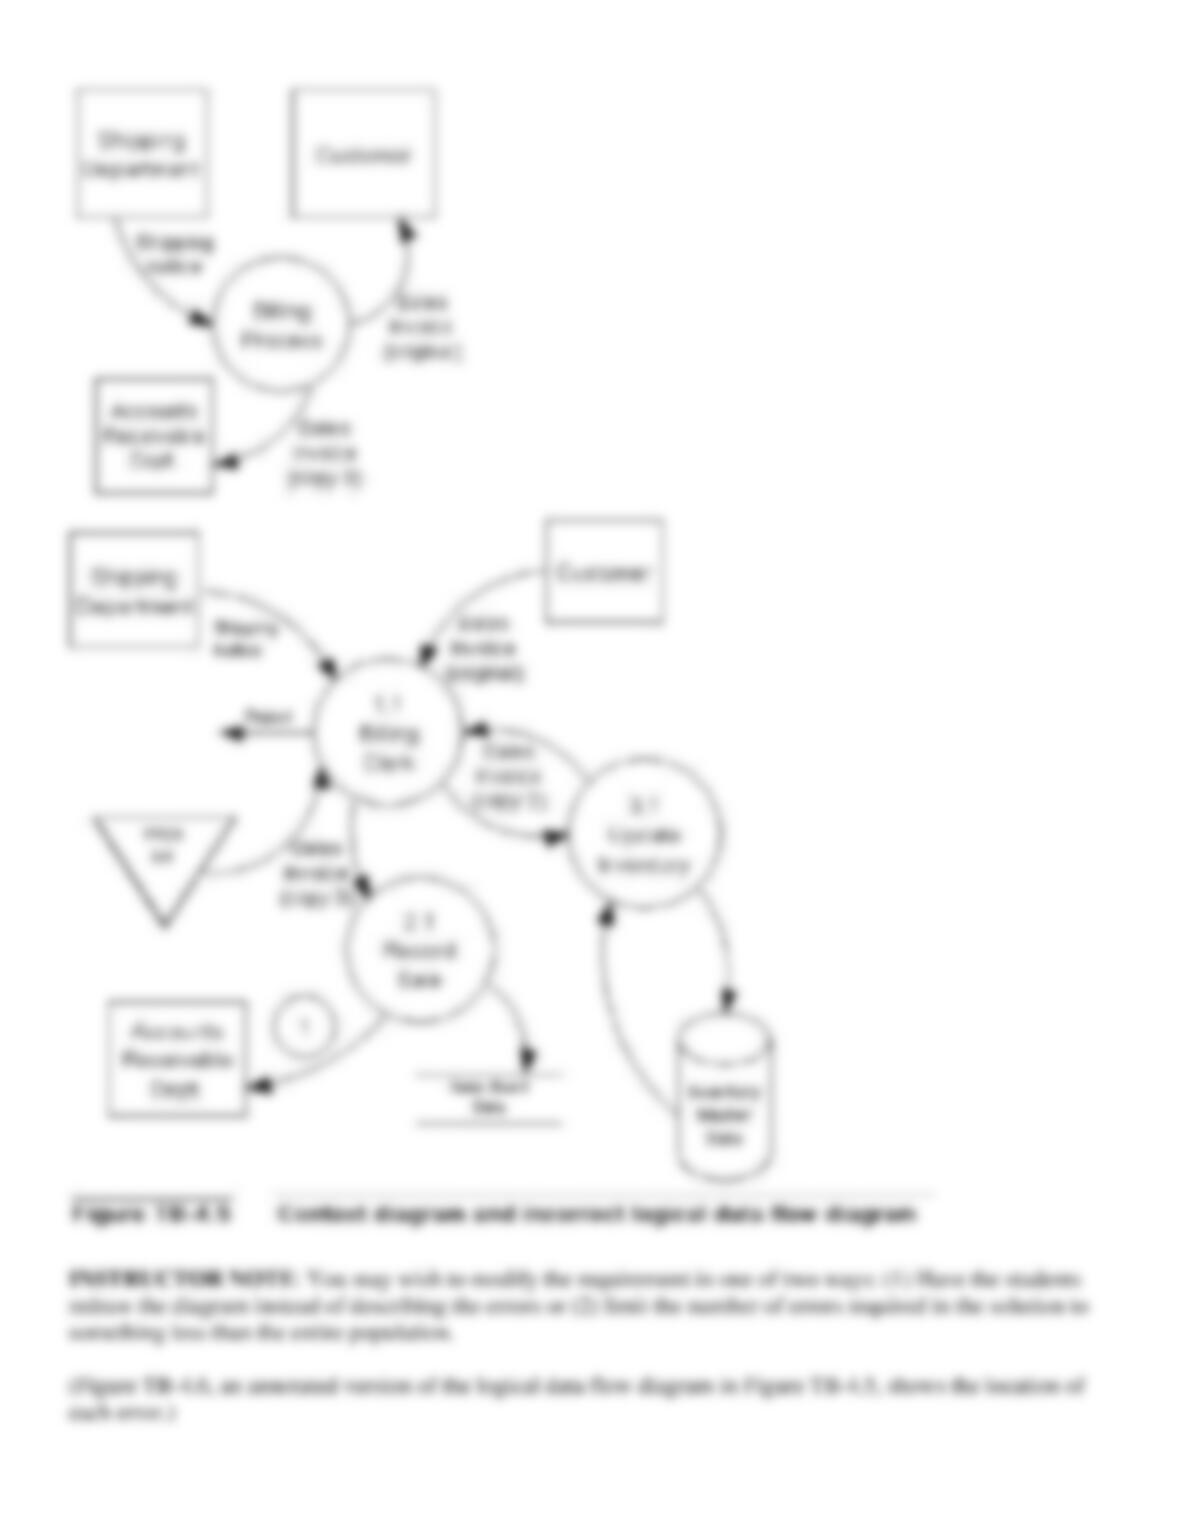
123. Figure TB-4.5 shows a level 0 logical data flow diagram for a billing system. Also shown for reference is
the context diagram for the system. The logical data flow diagram intentionally violates several of the
guidelines and other techniques presented in the text for drawing data flow diagrams.
Required:
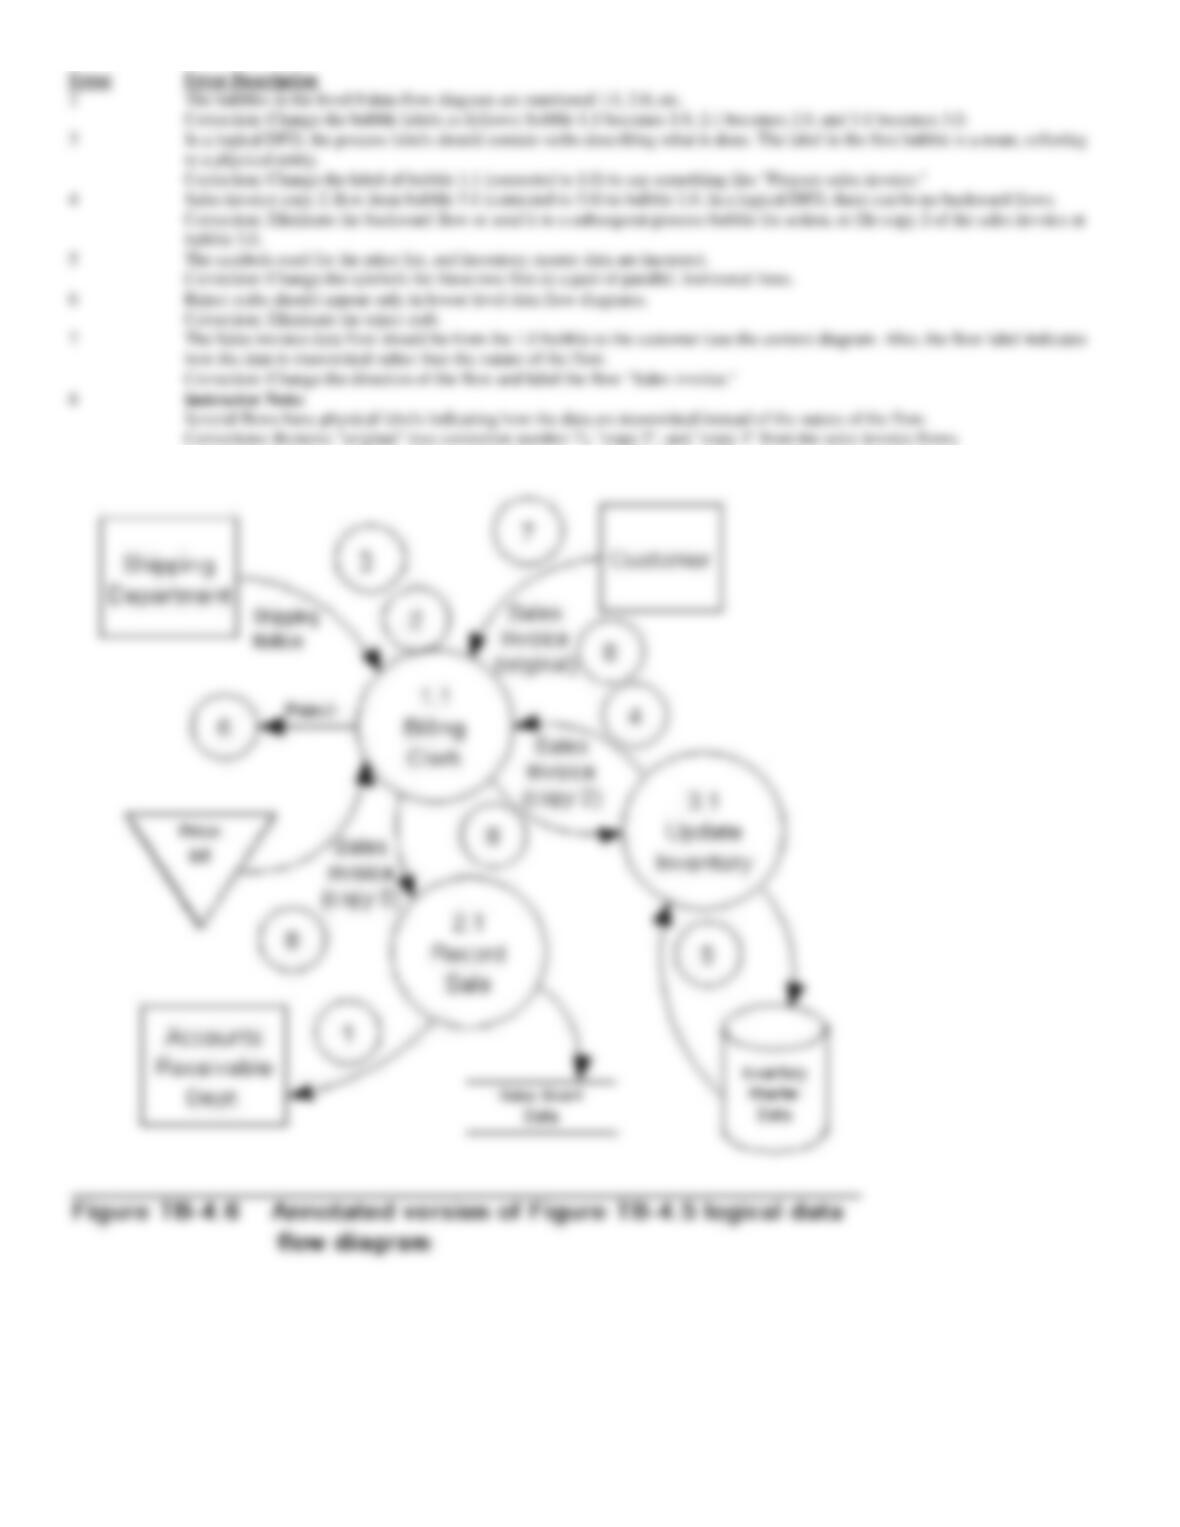
Identify as many of the errors in the logical data flow diagram construction as you can. In the logical data flow
diagram, place consecutive numbers (each in a circle) next to the points at which the errors exist. On your
solution sheet, list the numbers and write a one- to two-sentence description of each error and what the
corrected diagram should depict. If an error occurs in more than one place, mark each occurrence of the error.
Error 1 is provided as an example of how to construct the solution. Do not identify nor correct any errors that
may exist on the context diagram.
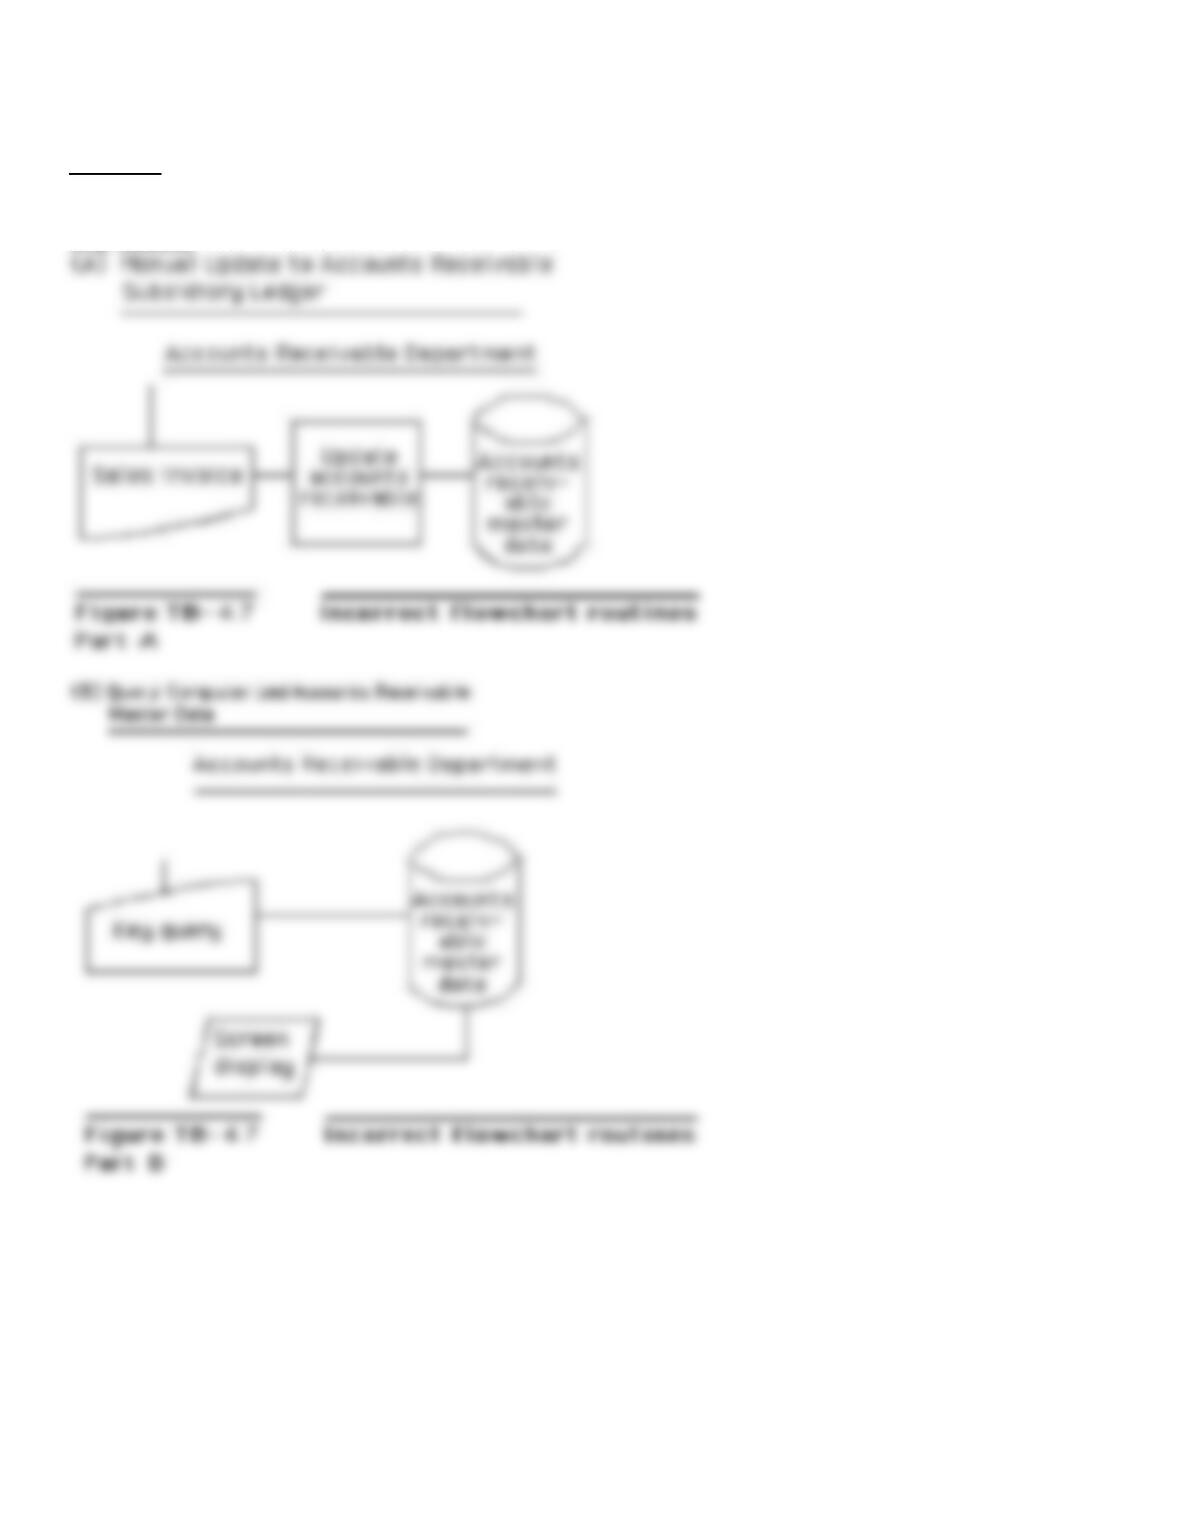
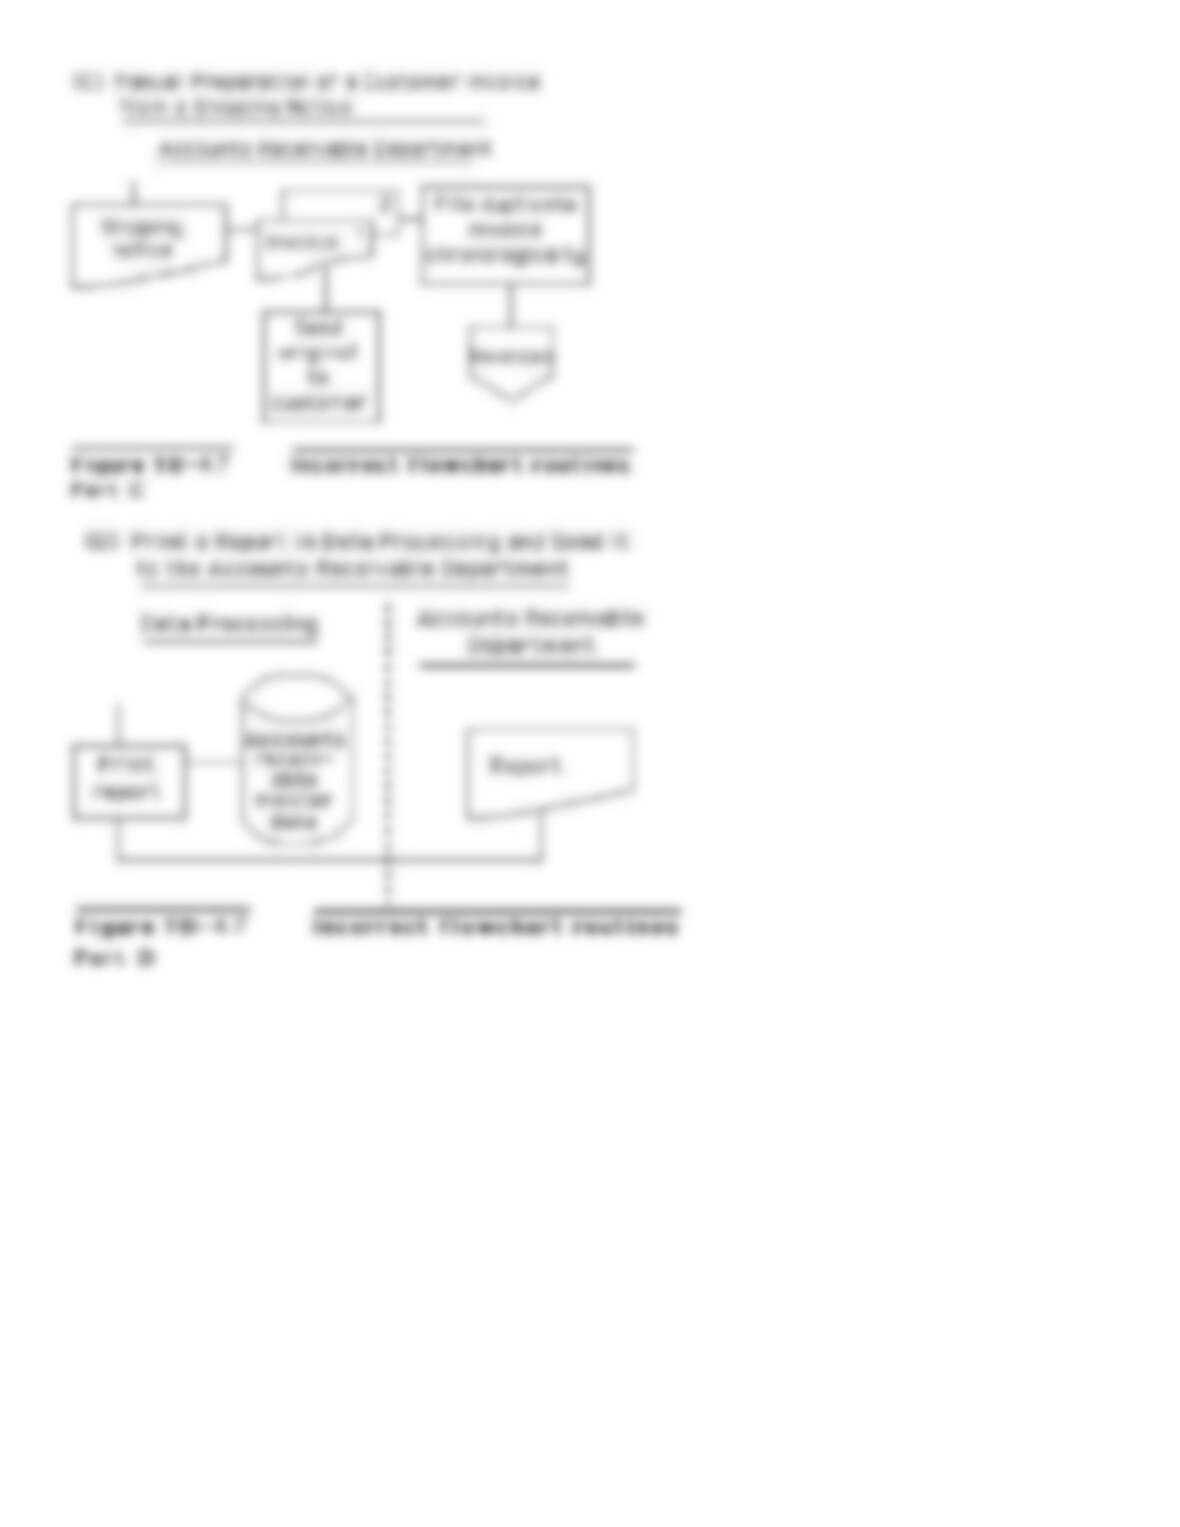
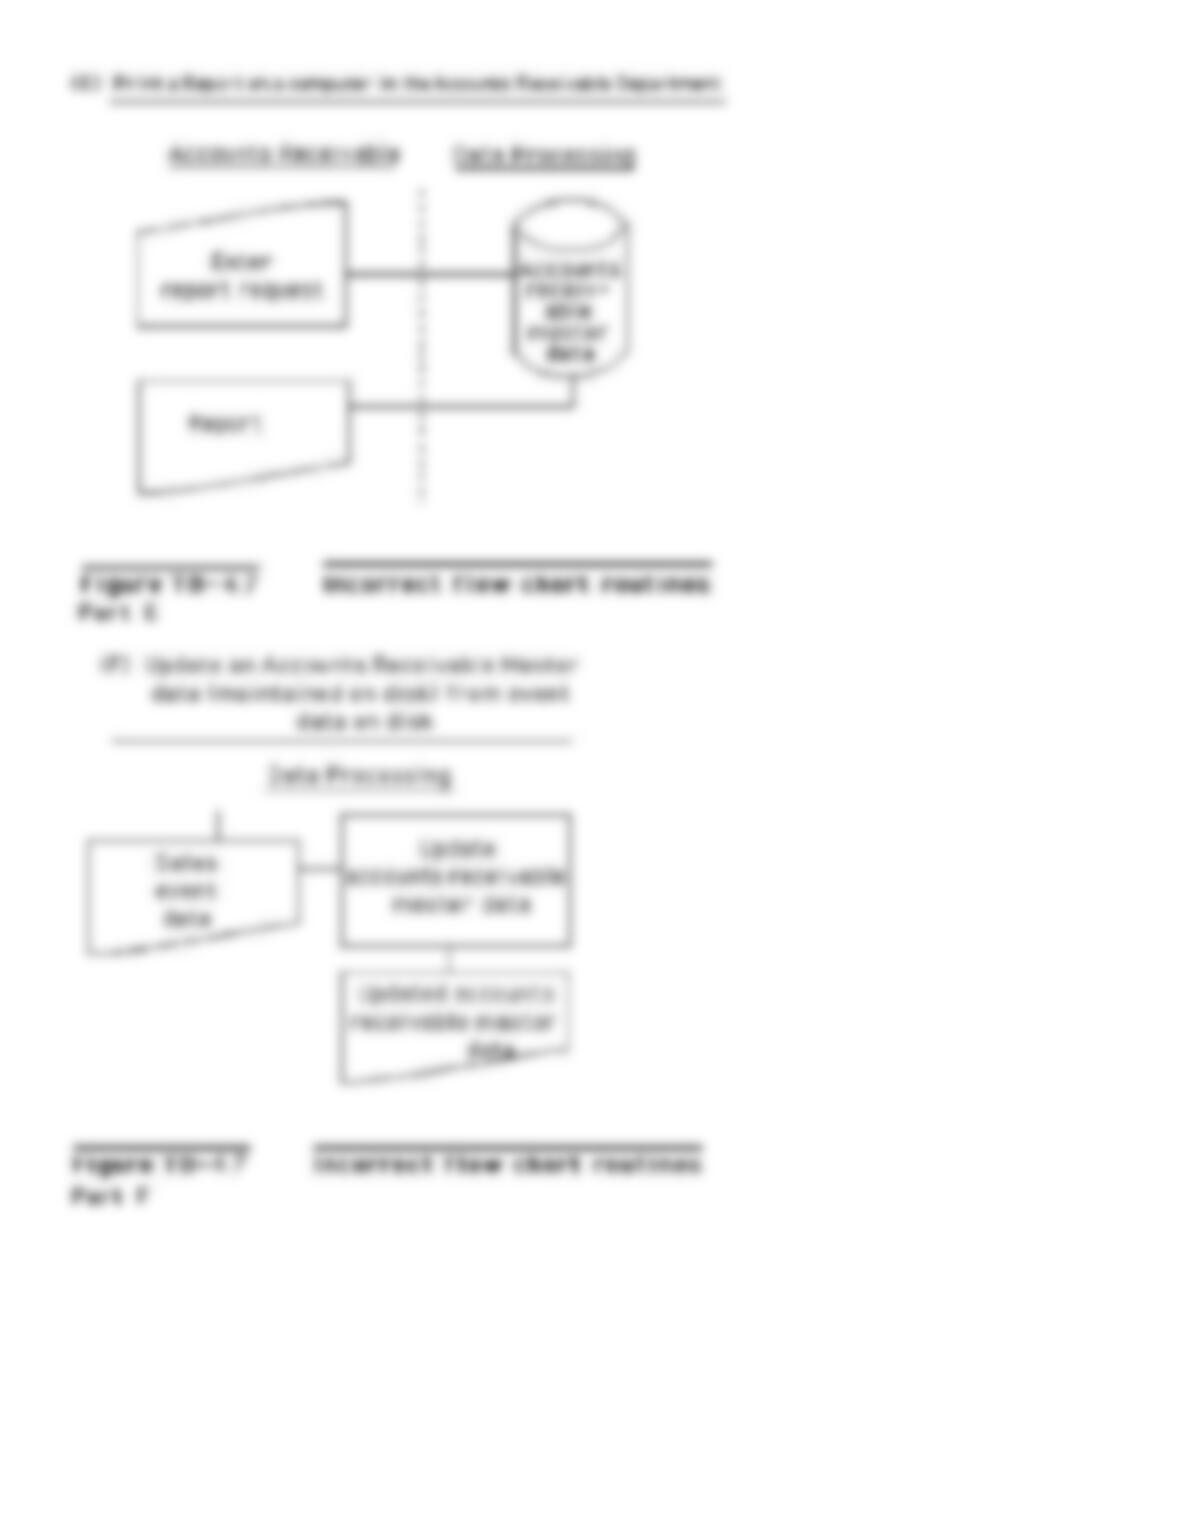
124. Figure TB-4.7 shows several systems flowchart routines that intentionally violate good flowchart
construction procedures.
Required:
Redraw each of the routines so that they conform to the guidelines and other techniques presented in the text for
drawing systems flowcharts. HINT: Be alert to the description of each routine; the descriptions should govern
your solution.